health and safety executive health and safety executive the current picture tony mitchell safety...
TRANSCRIPT

Health and Safety Executive
Health and Safety Executive
The current picture
Tony Mitchell
Safety section

Agricultural Transport – Key figures 2001-2006
• 74 Transport fatals (14 so far 2007-08)
• 32% of all ag fatals
• 597 reported accidents–74 fatal–284 major–239 3-day

Agricultural Transport – Key figures 2001-2005
Employees Self-employed Public Total
All Workplaces (HSE/LA)
172 42 35 249
Agriculture 26 31 7 64
Proportion (Fatals) 15% 74% 20% 26%
Proportion (all Riddor) 2.5%

Transport fatals – actuals (13/11/07)
15
8
10
16
17
5
14
0
2
4
6
8
10
12
14
16
18
2001-02 2002-03 2003-04 2004-05 2005-06 2006-07 2007-08p
year
nu
mb
er

Fatal accidents – current vs mean
0.00
0.50
1.00
1.50
2.00
2.50
3.00
3.50
Apr May Jun Jul Aug Sep Oct Nov Dec Jan Feb Mar
2001-07 mean
2007-08p

Other work in progress

Time of year - kind
Accident kind by month
0
5
10
15
20
25
30
35
40
Apr May Jun Jul Aug Sep Oct Nov Dec Jan Feb Mar
2001-06 fall
2001-06 material
2001-06 collapse
2001-06 SB

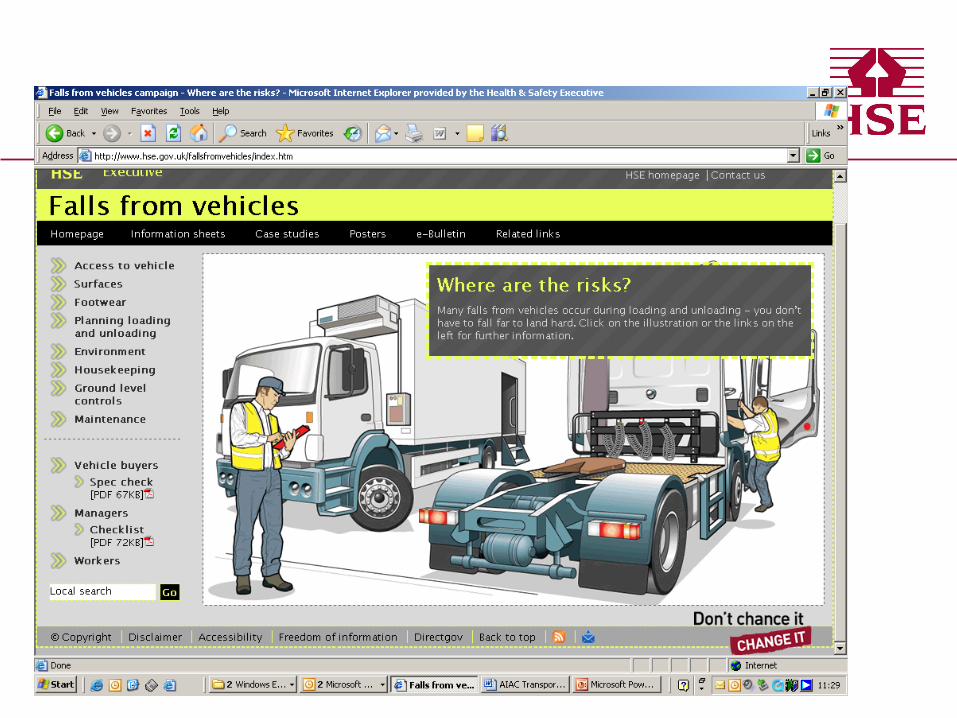
Current campaign – falls from vehicles
There are three key areas that cause most incidents in agriculture:
1. Carrying passengers in unsafe positions
2. Falls from vehicles during loading and unloading or maintenance – plan work and use suitable access equipment.
3. Slips/trips mounting tractors or mobile machines – you don’t have to fall far to fall hard!