health and safety executive annual statistics report … and safety executive annual statistics...
TRANSCRIPT

Health and Safety ExecutiveAnnual Statistics Report
2011/12
Health and Safety Executive
The Health and Safety Executive Statistics 2011/12 www.hse.gov.uk
Key facts1
KEY FACTS WORK-RELATED ILL HEALTH WORKPLACE INJURY ENFORCEMENT OTHER TOPICS SOURCES AND DEFINITIONS
www.hse.gov.uk/statistics/index.htm
Ill health
1.1 million people who worked during the last year were suffering from an illness (long-standing as well as new cases) they believed was caused or made worse by their current or past work. 0.5 million of these were new conditions which started during the year.
A further 0.7 million former workers (who last worked over 12 months ago) were suffering from an illness which was caused or made worse by their past work.
2347 people died from mesothelioma in 2010 and thousands more from other occupational cancers and diseases such as COPD.
Injuries
173 workers were killed at work, a rate of 0.6 fatalities per 100 000 workers.
111 164 other injuries to employees were reported under RIDDOR, a rate of 445.4 per 100 000 employees.
212 000 injuries leading to over-3-day absence occurred, according to the Labour Force Survey, a rate of 750 per 100 000 workers.
Working days lost
27 million days were lost overall (17 days per case).
22.7 million due to work-related ill health and 4.3 million due to workplace injury.
Economic costs to Britain
Workplace injuries and ill health (excluding cancer) cost society an estimated £13.4 billion in 2010/11.
Enforcement
551 cases were prosecuted by HSE in England and Wales.
95 cases were prosecuted by local authorities in England and Wales.
34 cases were prosecuted by the Procurator Fiscal in Scotland.
15 955 enforcement notices were issued by HSE and local authorities.
The Health and Safety Executive Statistics 2011/12 www.hse.gov.uk
2
KEY FACTS WORK-RELATED ILL HEALTH WORKPLACE INJURY ENFORCEMENT OTHER TOPICS SOURCES AND DEFINITIONS
www.hse.gov.uk/statistics/tables/index.htmWork-related ill health Fatal diseases
0
400
800
1200
1600
2000
2400
19851983 1987 1989 1991 1993 1995 1997 1999 2001 2003 2005 2007 2009 2011
Number of deaths or cases
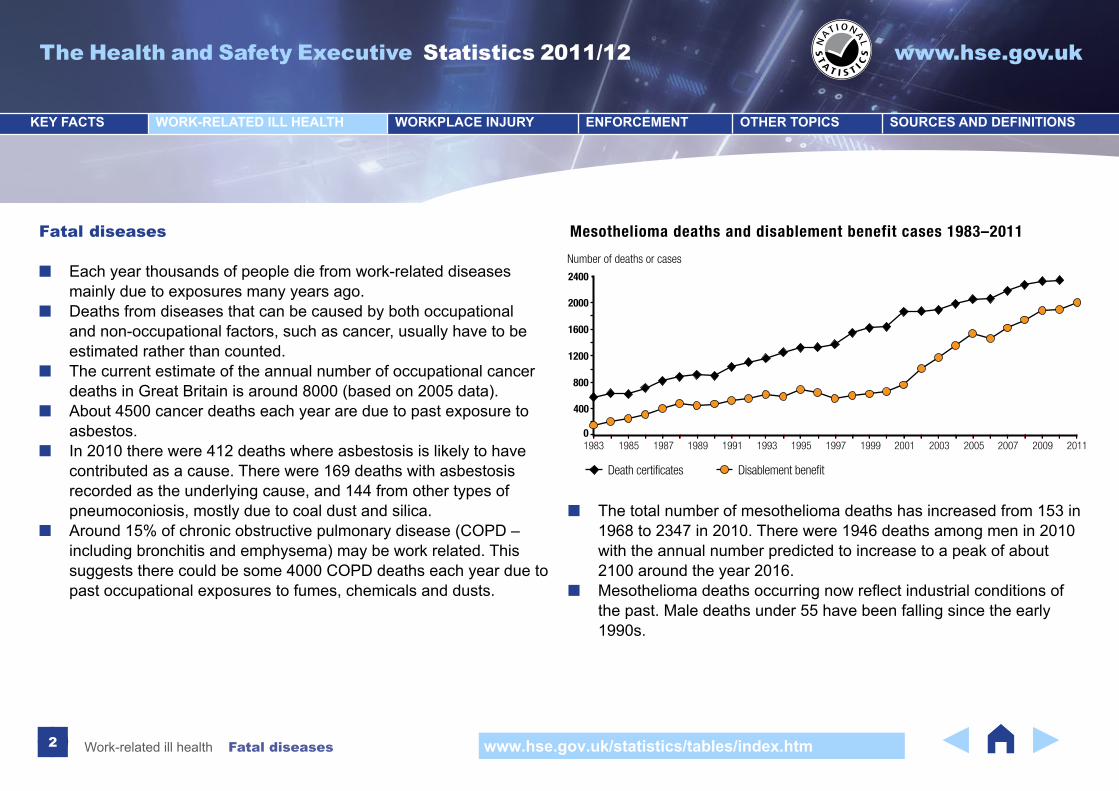
Mesothelioma deaths and disablement benefit cases 1983–2011
Disablement benefitDeath certificates
Fatal diseases
■ Each year thousands of people die from work-related diseases mainly due to exposures many years ago.
■ Deaths from diseases that can be caused by both occupational and non-occupational factors, such as cancer, usually have to be estimated rather than counted.
■ The current estimate of the annual number of occupational cancer deaths in Great Britain is around 8000 (based on 2005 data).
■ About 4500 cancer deaths each year are due to past exposure to asbestos.
■ In 2010 there were 412 deaths where asbestosis is likely to have contributed as a cause. There were 169 deaths with asbestosis recorded as the underlying cause, and 144 from other types of pneumoconiosis, mostly due to coal dust and silica.
■ Around 15% of chronic obstructive pulmonary disease (COPD – including bronchitis and emphysema) may be work related. This suggests there could be some 4000 COPD deaths each year due to past occupational exposures to fumes, chemicals and dusts.
■ The total number of mesothelioma deaths has increased from 153 in 1968 to 2347 in 2010. There were 1946 deaths among men in 2010 with the annual number predicted to increase to a peak of about 2100 around the year 2016.
■ Mesotheliomadeathsoccurringnowreflectindustrialconditionsofthe past. Male deaths under 55 have been falling since the early 1990s.
The Health and Safety Executive Statistics 2011/12 www.hse.gov.uk
3
KEY FACTS WORK-RELATED ILL HEALTH WORKPLACE INJURY ENFORCEMENT OTHER TOPICS SOURCES AND DEFINITIONS
www.hse.gov.uk/statistics/causdis/index.htmWork-related ill health Self-reported ill health
Self-reported ill health
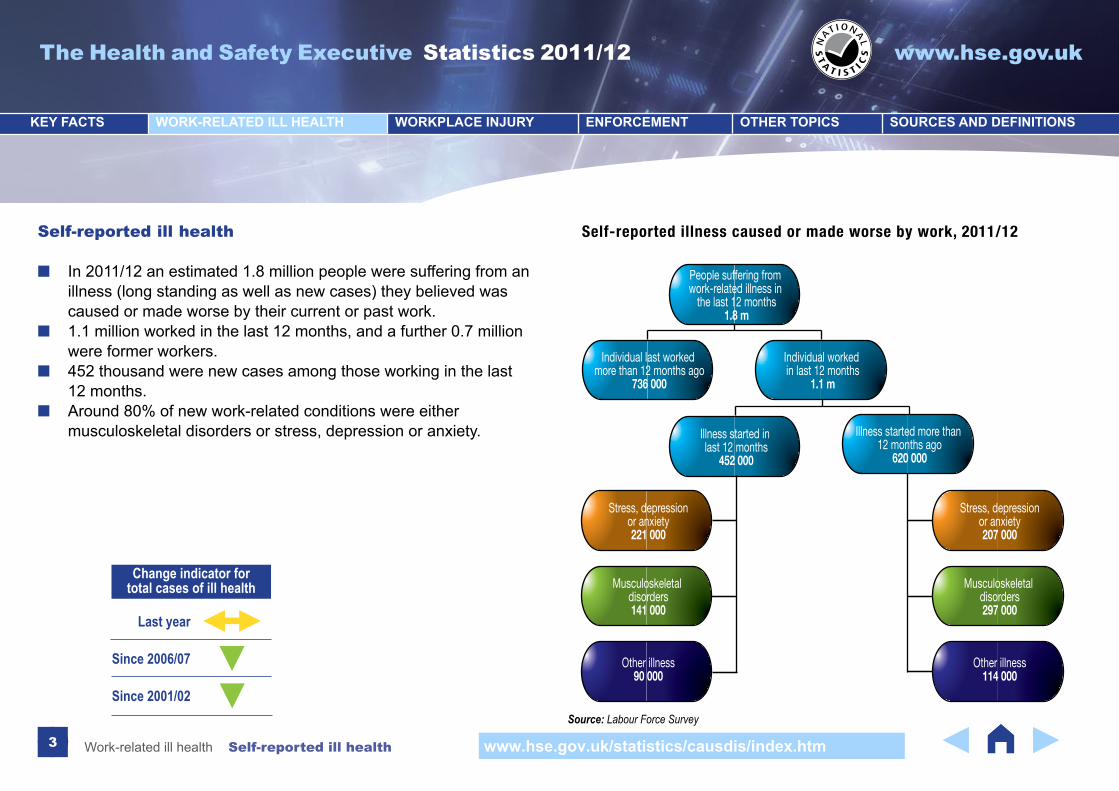
■ In 2011/12 an estimated 1.8 million people were suffering from an illness (long standing as well as new cases) they believed was caused or made worse by their current or past work.
■ 1.1 million worked in the last 12 months, and a further 0.7 million were former workers.
■ 452 thousand were new cases among those working in the last 12 months.
■ Around 80% of new work-related conditions were either musculoskeletal disorders or stress, depression or anxiety.
People suffering from work-related illness in
the last 12 months1.8 m
Individual worked in last 12 months
1.1 m
Illness started more than 12 months ago
620 000
Illness started in last 12 months
452 000
Individual last worked more than 12 months ago
736 000
Stress, depressionor anxiety221 000
Stress, depressionor anxiety207 000
Musculoskeletal disorders141 000
Musculoskeletal disorders297 000
Other illness90 000
Other illness114 000
Self-reported illness caused or made worse by work, 2011/12
Source: Labour Force Survey
Last year
Since 2006/07
Since 2001/02
Change indicator fortotal cases of ill health
The Health and Safety Executive Statistics 2011/12 www.hse.gov.uk
4
KEY FACTS WORK-RELATED ILL HEALTH WORKPLACE INJURY ENFORCEMENT OTHER TOPICS SOURCES AND DEFINITIONS
Source: Labour Force Survey
www.hse.gov.uk/statistics/lfs/index.htmWork-related ill health Self-reported ill health
New cases of work-related illness in the last 12 months (thousands)
Total number of cases of work-related illness in the last 12 months (thousands)
central 95% Confidence interval central 95% Confidence intervallower upper lower upper
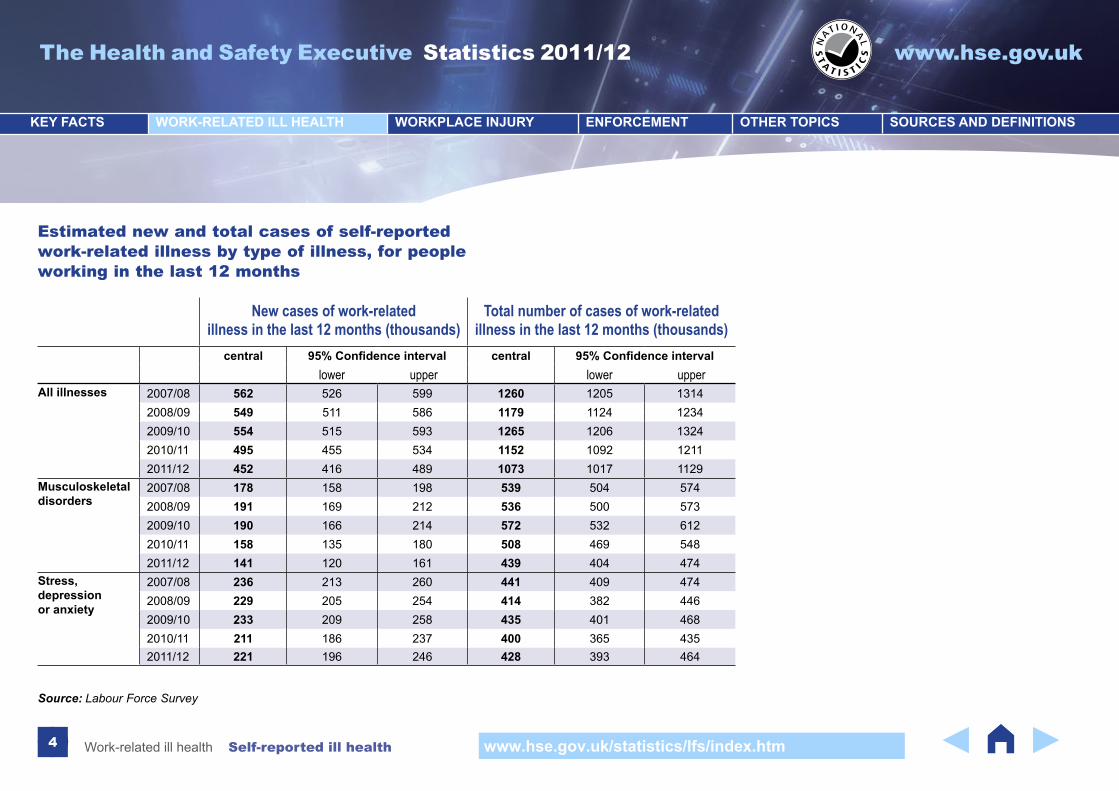
All illnesses 2007/08 562 526 599 1260 1205 13142008/09 549 511 586 1179 1124 12342009/10 554 515 593 1265 1206 13242010/11 495 455 534 1152 1092 12112011/12 452 416 489 1073 1017 1129
Musculoskeletal disorders
2007/08 178 158 198 539 504 5742008/09 191 169 212 536 500 5732009/10 190 166 214 572 532 6122010/11 158 135 180 508 469 5482011/12 141 120 161 439 404 474
Stress, depression or anxiety
2007/08 236 213 260 441 409 4742008/09 229 205 254 414 382 4462009/10 233 209 258 435 401 4682010/11 211 186 237 400 365 4352011/12 221 196 246 428 393 464
Estimated new and total cases of self-reported work-related illness by type of illness, for people working in the last 12 months
The Health and Safety Executive Statistics 2011/12 www.hse.gov.uk
5
KEY FACTS WORK-RELATED ILL HEALTH WORKPLACE INJURY ENFORCEMENT OTHER TOPICS SOURCES AND DEFINITIONS
www.hse.gov.uk/statistics/lfs/index.htmWork-related ill health Self-reported ill health
0
100
200
300
400
500
600
700
2002/03 2002/03 2004/052003/04 2005/06
Note: average sample variability +/-7% on the total
Note: No data on work-related ill health was collected in 2002/03
2006/07 2007/08 2008/09 2009/10
New cases (thousands)
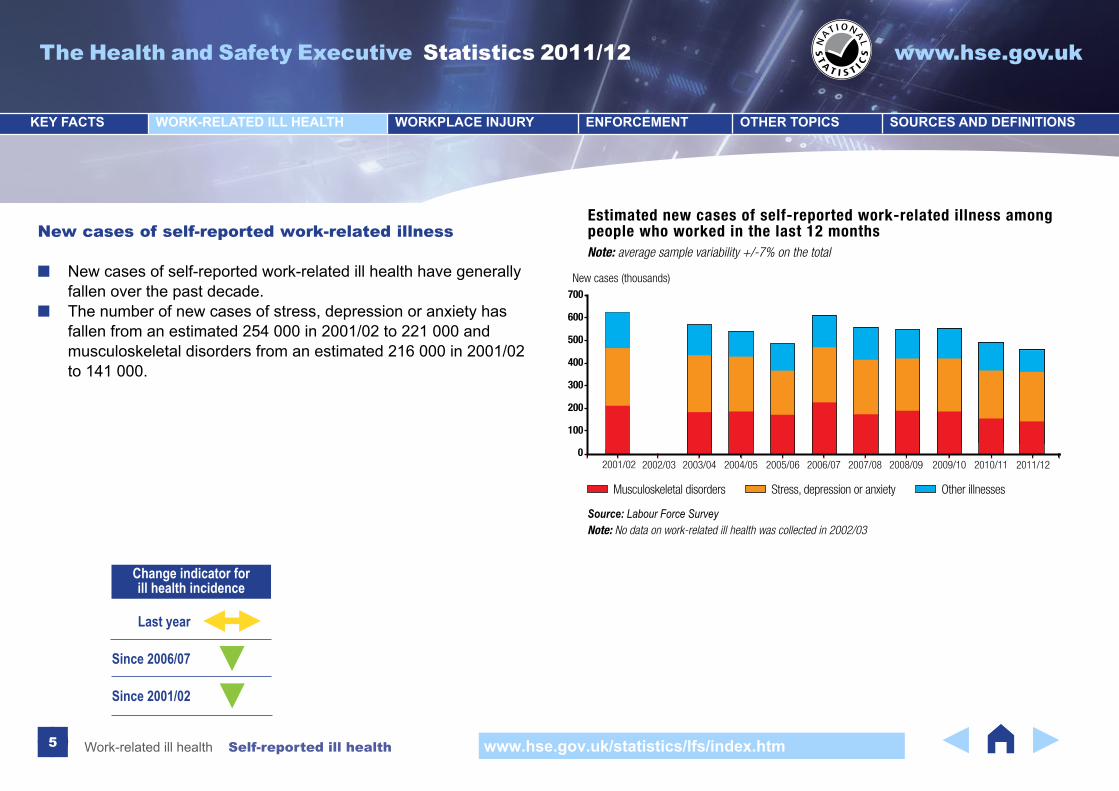
Estimated new cases of self-reported work-related illness among people who worked in the last 12 months
2010/11
Musculoskeletal disorders Stress, depression or anxiety Other illnesses
Source: Labour Force Survey
2011/122001/02
New cases of self-reported work-related illness
■ New cases of self-reported work-related ill health have generally fallen over the past decade.
■ The number of new cases of stress, depression or anxiety has fallen from an estimated 254 000 in 2001/02 to 221 000 and musculoskeletal disorders from an estimated 216 000 in 2001/02 to 141 000.
Last year
Since 2006/07
Since 2001/02
Change indicator forill health incidence
The Health and Safety Executive Statistics 2011/12 www.hse.gov.uk
6
KEY FACTS WORK-RELATED ILL HEALTH WORKPLACE INJURY ENFORCEMENT OTHER TOPICS SOURCES AND DEFINITIONS
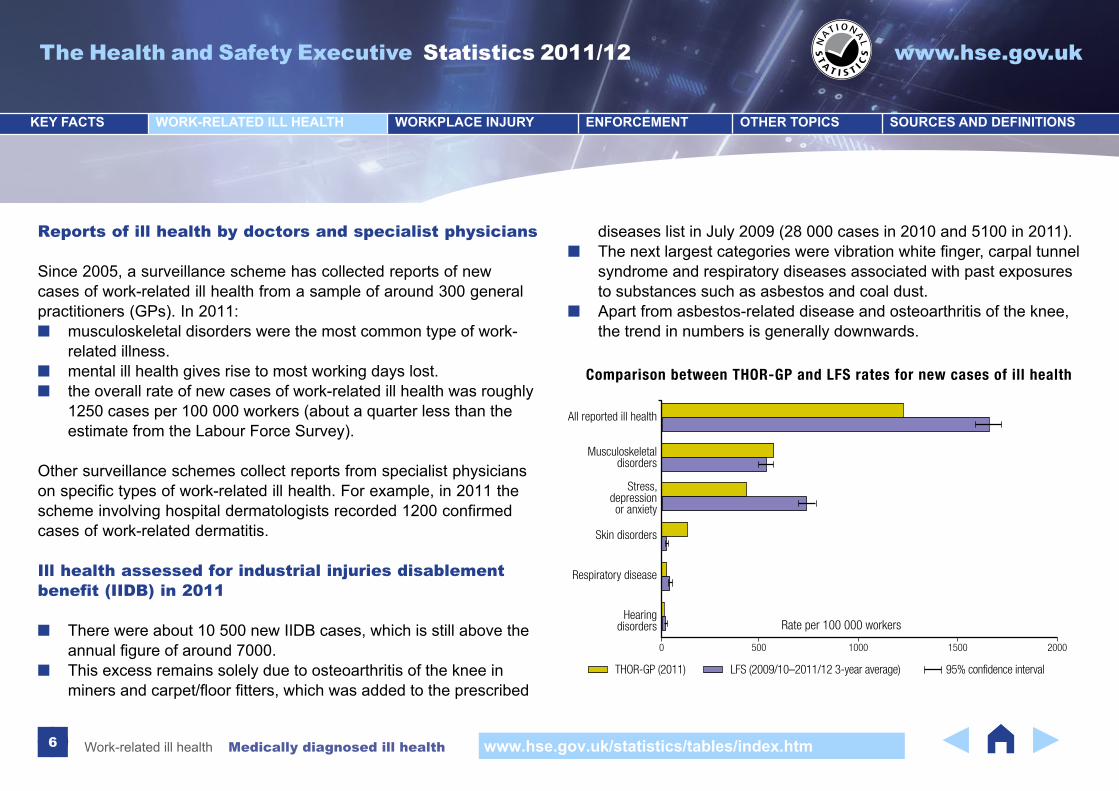
Reports of ill health by doctors and specialist physicians
Since 2005, a surveillance scheme has collected reports of new cases of work-related ill health from a sample of around 300 general practitioners (GPs). In 2011:
■ musculoskeletal disorders were the most common type of work-related illness.
■ mental ill health gives rise to most working days lost. ■ the overall rate of new cases of work-related ill health was roughly
1250 cases per 100 000 workers (about a quarter less than the estimate from the Labour Force Survey).
Other surveillance schemes collect reports from specialist physicians on specific types of work-related ill health. For example, in 2011 the scheme involving hospital dermatologists recorded 1200 confirmed cases of work-related dermatitis.
Ill health assessed for industrial injuries disablement benefit (IIDB) in 2011
■ There were about 10 500 new IIDB cases, which is still above the annualfigureofaround7000.
■ This excess remains solely due to osteoarthritis of the knee in minersandcarpet/floorfitters,whichwasaddedtotheprescribed
diseases list in July 2009 (28 000 cases in 2010 and 5100 in 2011). ■ Thenextlargestcategorieswerevibrationwhitefinger,carpaltunnel
syndrome and respiratory diseases associated with past exposures to substances such as asbestos and coal dust.
■ Apart from asbestos-related disease and osteoarthritis of the knee, the trend in numbers is generally downwards.
www.hse.gov.uk/statistics/tables/index.htmWork-related ill health Medically diagnosed ill health
All reported ill health
Skin disorders
Respiratory disease
Hearingdisorders
Stress,depressionor anxiety
Musculoskeletaldisorders
Comparison between THOR-GP and LFS rates for new cases of ill health
THOR-GP (2011) LFS (2009/10–2011/12 3-year average)
0 500 1000 1500 2000
95% confidence interval
Rate per 100 000 workers
The Health and Safety Executive Statistics 2011/12 www.hse.gov.uk
7
KEY FACTS WORK-RELATED ILL HEALTH WORKPLACE INJURY ENFORCEMENT OTHER TOPICS SOURCES AND DEFINITIONS
www.hse.gov.uk/statistics/fatals.htmWorkplace injury Fatal injuries
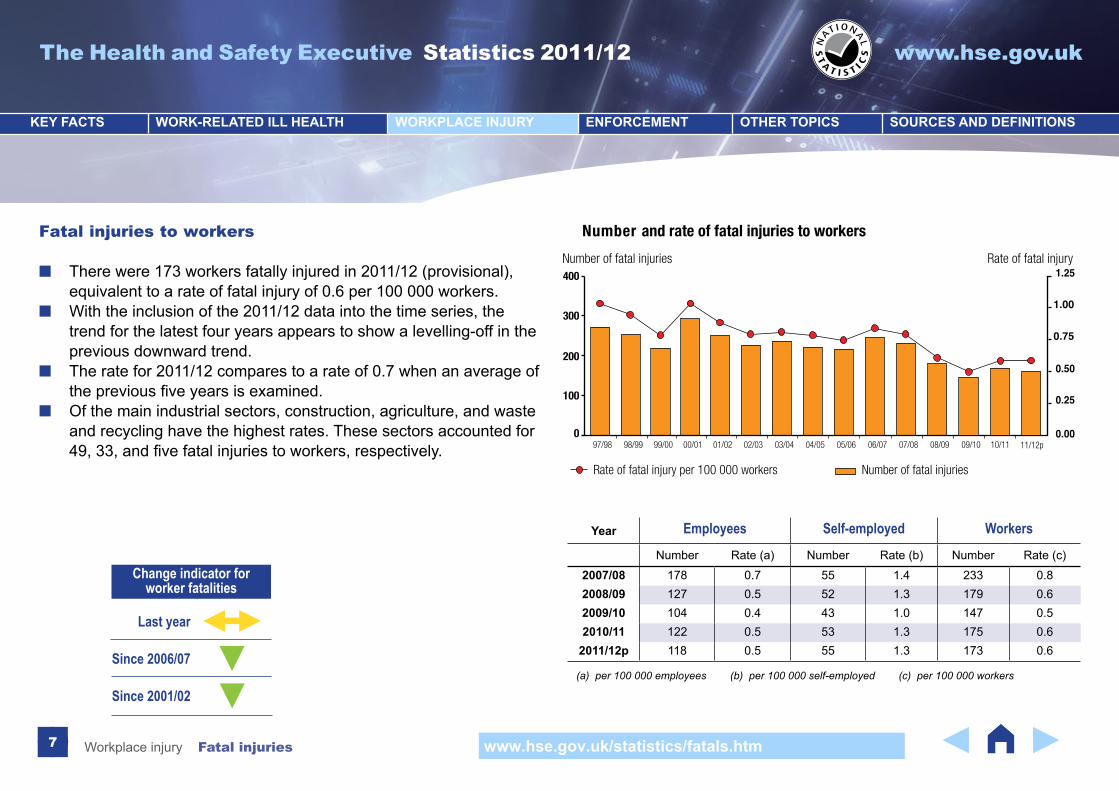
Fatal injuries to workers
■ There were 173 workers fatally injured in 2011/12 (provisional), equivalent to a rate of fatal injury of 0.6 per 100 000 workers.
■ With the inclusion of the 2011/12 data into the time series, the trend for the latest four years appears to show a levelling-off in the previous downward trend.
■ The rate for 2011/12 compares to a rate of 0.7 when an average of thepreviousfiveyearsisexamined.
■ Of the main industrial sectors, construction, agriculture, and waste and recycling have the highest rates. These sectors accounted for 49,33,andfivefatalinjuriestoworkers,respectively.
100
0
200
300
400
01/02 02/03 03/04 04/05 05/0697/98 98/99 99/00 00/01
Number of fatal injuries Rate of fatal injury
Number and rate of fatal injuries to workers
Rate of fatal injury per 100 000 workers
0.00
0.25
0.50
0.75
1.00
1.25
Number of fatal injuries
06/07 07/08 08/09 09/10 10/11 11/12p
Year Employees Self-employed WorkersNumber Rate (a) Number Rate (b) Number Rate (c)
2007/08 178 0.7 55 1.4 233 0.82008/09 127 0.5 52 1.3 179 0.62009/10 104 0.4 43 1.0 147 0.52010/11 122 0.5 53 1.3 175 0.6
2011/12p 118 0.5 55 1.3 173 0.6
(a) per 100 000 employees (b) per 100 000 self-employed (c) per 100 000 workers
Last year
Since 2006/07
Since 2001/02
Change indicator forworker fatalities
The Health and Safety Executive Statistics 2011/12 www.hse.gov.uk
8
KEY FACTS WORK-RELATED ILL HEALTH WORKPLACE INJURY ENFORCEMENT OTHER TOPICS SOURCES AND DEFINITIONS
www.hse.gov.uk/statistics/causinj/index.htmWorkplace injury Employer-reported injuries
0
50 000
100 000
150 000
200 000
97/98 98/99 99/00 03/04 04/0502/0301/0200/01
Number of injuries Rate (per 100 000)
Employer-reported non-fatal injuries
0
200
1000
400
600
800
Number of non-fatal injuriesRate of non-fatal injury per 100 000 employees
05/06 06/07 07/08 08/09 09/10 10/11 11/12p
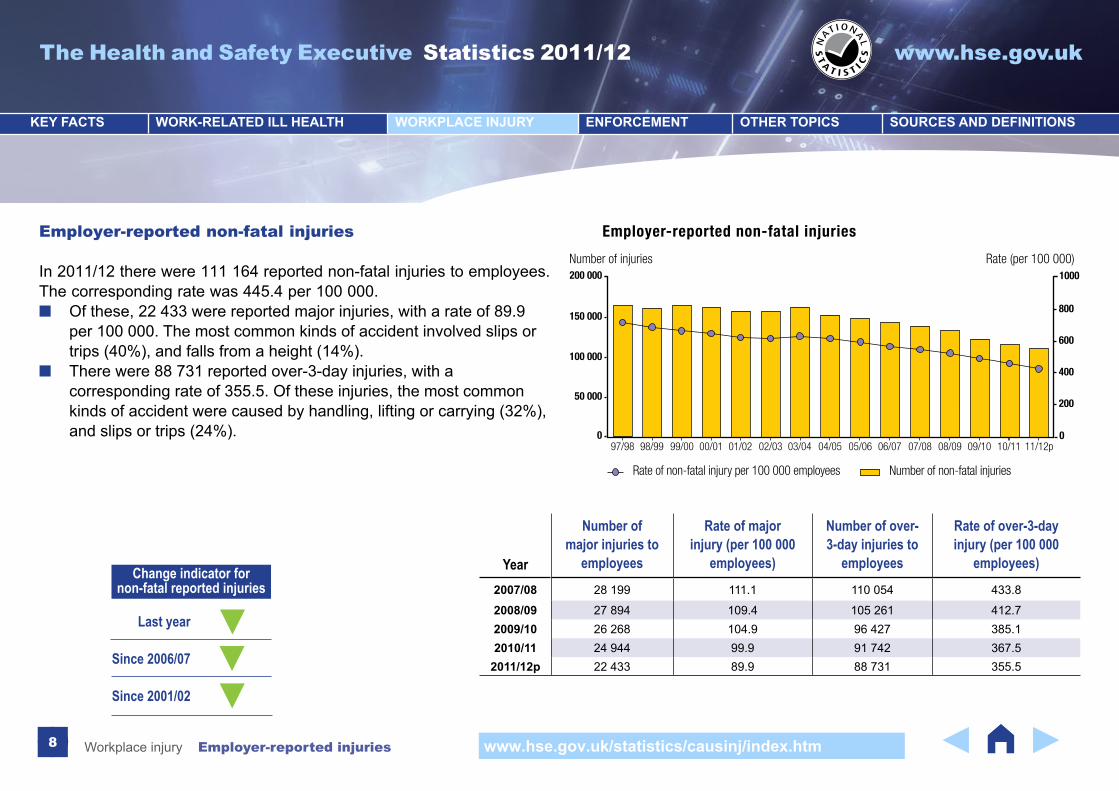
Employer-reported non-fatal injuries
In 2011/12 there were 111 164 reported non-fatal injuries to employees. The corresponding rate was 445.4 per 100 000.
■ Of these, 22 433 were reported major injuries, with a rate of 89.9 per 100 000. The most common kinds of accident involved slips or trips (40%), and falls from a height (14%).
■ There were 88 731 reported over-3-day injuries, with a corresponding rate of 355.5. Of these injuries, the most common kinds of accident were caused by handling, lifting or carrying (32%), and slips or trips (24%).
Year
Number of major injuries to
employees
Rate of major injury (per 100 000
employees)
Number of over-3-day injuries to
employees
Rate of over-3-day injury (per 100 000
employees)
2007/08 28 199 111.1 110 054 433.8
2008/09 27 894 109.4 105 261 412.72009/10 26 268 104.9 96 427 385.12010/11 24 944 99.9 91 742 367.5
2011/12p 22 433 89.9 88 731 355.5
Last year
Since 2006/07
Since 2001/02
Change indicator fornon-fatal reported injuries
The Health and Safety Executive Statistics 2011/12 www.hse.gov.uk
9
KEY FACTS WORK-RELATED ILL HEALTH WORKPLACE INJURY ENFORCEMENT OTHER TOPICS SOURCES AND DEFINITIONS
www.hse.gov.uk/statistics/causinj/index.htmWorkplace injury Labour Force Survey
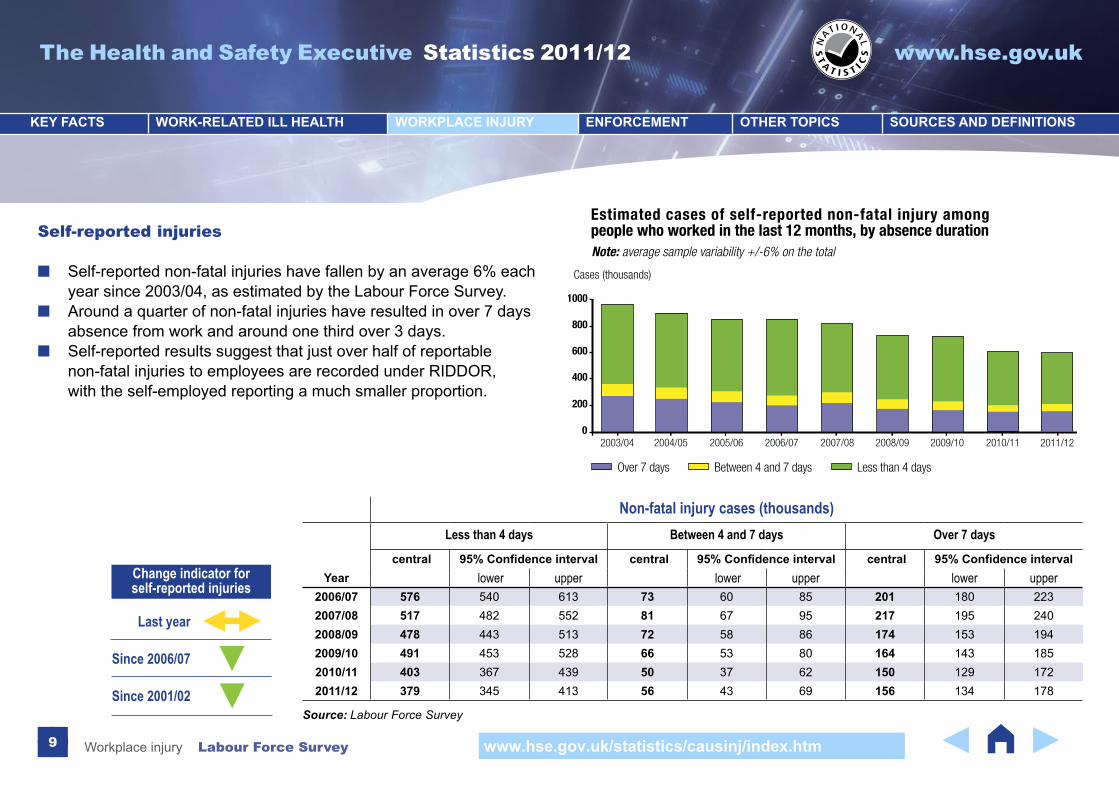
Self-reported injuries
■ Self-reported non-fatal injuries have fallen by an average 6% each year since 2003/04, as estimated by the Labour Force Survey.
■ Around a quarter of non-fatal injuries have resulted in over 7 days absence from work and around one third over 3 days.
■ Self-reported results suggest that just over half of reportable non-fatal injuries to employees are recorded under RIDDOR, with the self-employed reporting a much smaller proportion.
2003/040
200
400
600
800
1000
2011/122004/05 2005/06 2006/07 2007/08 2008/09 2009/10
Note: average sample variability +/-6% on the total
Cases (thousands)
Estimated cases of self-reported non-fatal injury among people who worked in the last 12 months, by absence duration
2010/11
Over 7 days Between 4 and 7 days Less than 4 days
Non-fatal injury cases (thousands) Less than 4 days Between 4 and 7 days Over 7 days
central 95% Confidence interval central 95% Confidence interval central 95% Confidence intervalYear lower upper lower upper lower upper
2006/07 576 540 613 73 60 85 201 180 2232007/08 517 482 552 81 67 95 217 195 2402008/09 478 443 513 72 58 86 174 153 1942009/10 491 453 528 66 53 80 164 143 1852010/11 403 367 439 50 37 62 150 129 1722011/12 379 345 413 56 43 69 156 134 178
Source: Labour Force Survey
Last year
Since 2006/07
Since 2001/02
Change indicator forself-reported injuries
The Health and Safety Executive Statistics 2011/12 www.hse.gov.uk
10
KEY FACTS WORK-RELATED ILL HEALTH WORKPLACE INJURY ENFORCEMENT OTHER TOPICS SOURCES AND DEFINITIONS
www.hse.gov.uk/statistics/prosecutions.htmEnforcement Cases instituted
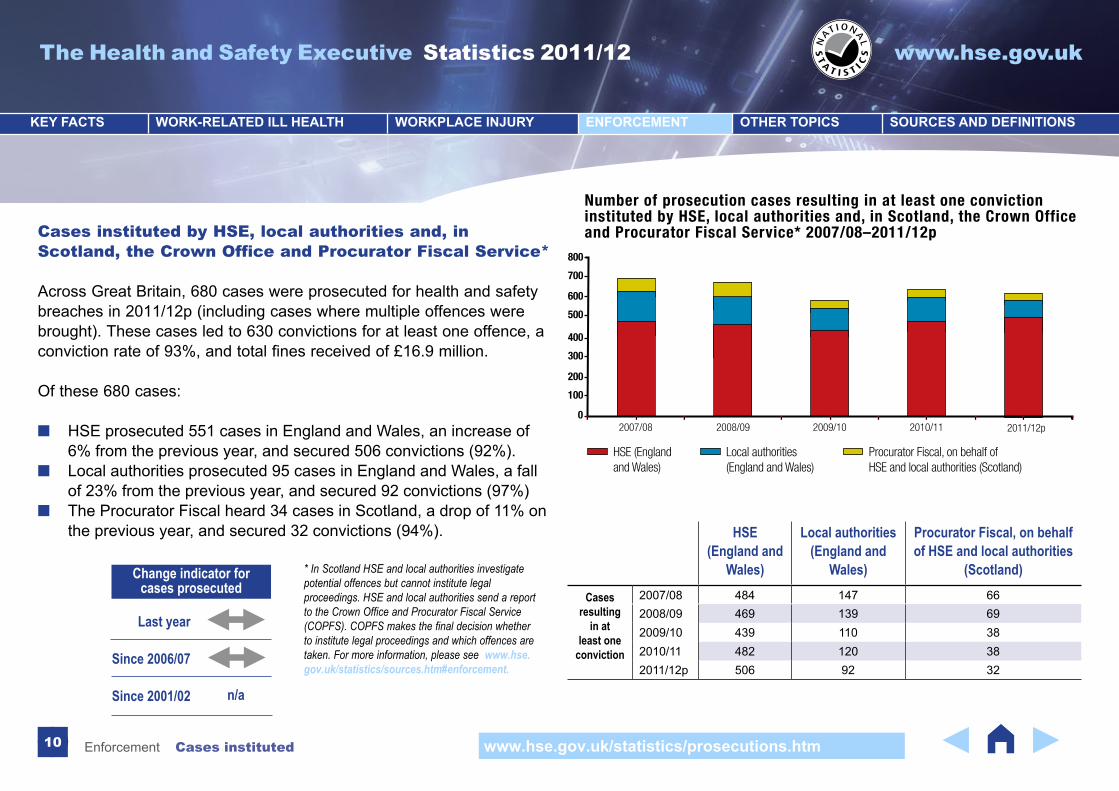
Cases instituted by HSE, local authorities and, in Scotland, the Crown Office and Procurator Fiscal Service*
Across Great Britain, 680 cases were prosecuted for health and safety breaches in 2011/12p (including cases where multiple offences were brought). These cases led to 630 convictions for at least one offence, a conviction rate of 93%, and total fines received of £16.9 million.
Of these 680 cases:
■ HSE prosecuted 551 cases in England and Wales, an increase of 6% from the previous year, and secured 506 convictions (92%).
■ Local authorities prosecuted 95 cases in England and Wales, a fall of 23% from the previous year, and secured 92 convictions (97%)
■ The Procurator Fiscal heard 34 cases in Scotland, a drop of 11% on the previous year, and secured 32 convictions (94%).
* In Scotland HSE and local authorities investigate potential offences but cannot institute legal proceedings. HSE and local authorities send a report to the Crown Office and Procurator Fiscal Service (COPFS). COPFS makes the final decision whether to institute legal proceedings and which offences are taken. For more information, please see www.hse.gov.uk/statistics/sources.htm#enforcement.
HSE (England and
Wales)
Local authorities (England and
Wales)
Procurator Fiscal, on behalf of HSE and local authorities
(Scotland)
Cases resulting
in at least one
conviction
2007/08 484 147 662008/09 469 139 692009/10 439 110 382010/11 482 120 382011/12p 506 92 32
0
200
400
600
800
100
300
500
700
2008/09 2009/10 2010/11
Number of prosecution cases resulting in at least one conviction instituted by HSE, local authorities and, in Scotland, the Crown Office and Procurator Fiscal Service* 2007/08–2011/12p
2007/08
HSE (England and Wales)
Local authorities (England and Wales)
Procurator Fiscal, on behalf of HSE and local authorities (Scotland)
2011/12p
Last year
Since 2006/07
Since 2001/02
Change indicator forcases prosecuted
n/a
The Health and Safety Executive Statistics 2011/12 www.hse.gov.uk
11
KEY FACTS WORK-RELATED ILL HEALTH WORKPLACE INJURY ENFORCEMENT OTHER TOPICS SOURCES AND DEFINITIONS
www.hse.gov.uk/statistics/prosecutions.htmEnforcement Offences prosecuted
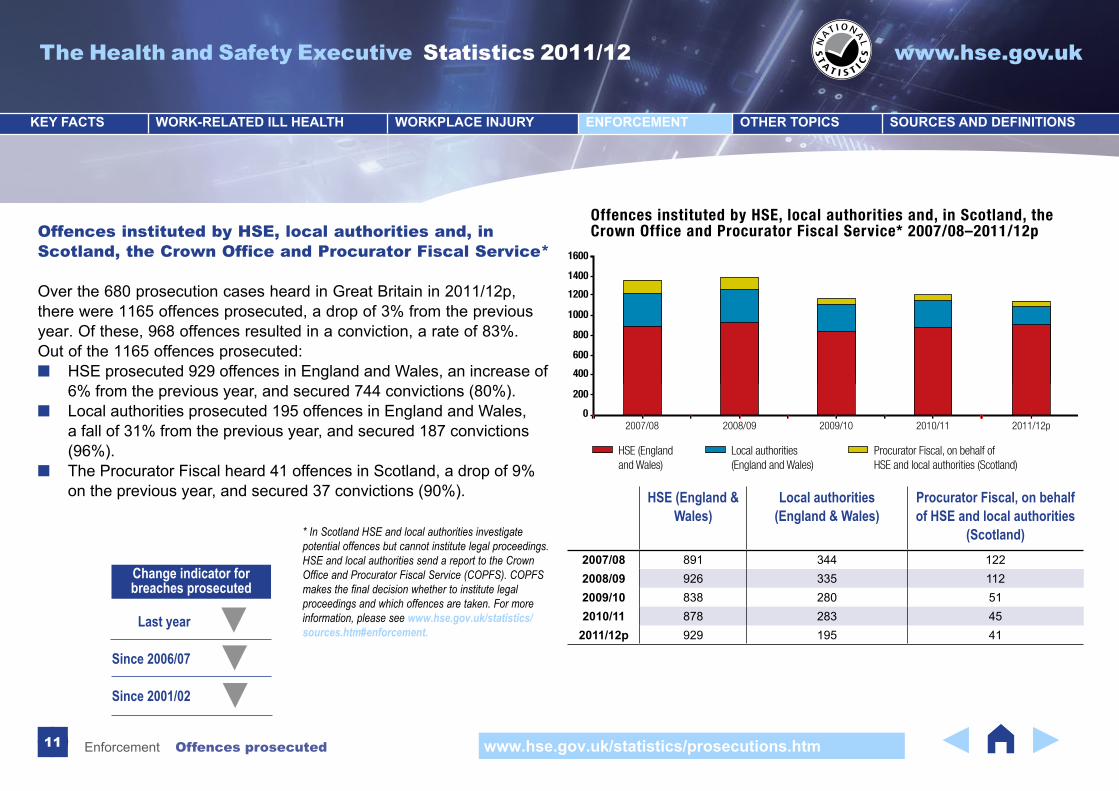
Offences instituted by HSE, local authorities and, in Scotland, the Crown Office and Procurator Fiscal Service*
Over the 680 prosecution cases heard in Great Britain in 2011/12p, there were 1165 offences prosecuted, a drop of 3% from the previous year. Of these, 968 offences resulted in a conviction, a rate of 83%.Out of the 1165 offences prosecuted:
■ HSE prosecuted 929 offences in England and Wales, an increase of 6% from the previous year, and secured 744 convictions (80%).
■ Local authorities prosecuted 195 offences in England and Wales, a fall of 31% from the previous year, and secured 187 convictions (96%).
■ The Procurator Fiscal heard 41 offences in Scotland, a drop of 9% on the previous year, and secured 37 convictions (90%).
0
200
400
600
800
1000
1200
1400
1600
2008/09 2009/10 2010/11
Offences instituted by HSE, local authorities and, in Scotland, the Crown Office and Procurator Fiscal Service* 2007/08–2011/12p
2007/08 2011/12p
HSE (England and Wales)
Local authorities (England and Wales)
Procurator Fiscal, on behalf of HSE and local authorities (Scotland)
HSE (England & Wales)
Local authorities (England & Wales)
Procurator Fiscal, on behalf of HSE and local authorities
(Scotland)2007/08 891 344 1222008/09 926 335 1122009/10 838 280 512010/11 878 283 45
2011/12p 929 195 41Last year
Since 2006/07
Since 2001/02
Change indicator forbreaches prosecuted
* In Scotland HSE and local authorities investigate potential offences but cannot institute legal proceedings. HSE and local authorities send a report to the Crown Office and Procurator Fiscal Service (COPFS). COPFS makes the final decision whether to institute legal proceedings and which offences are taken. For more information, please see www.hse.gov.uk/statistics/sources.htm#enforcement.
The Health and Safety Executive Statistics 2011/12 www.hse.gov.uk
12
KEY FACTS WORK-RELATED ILL HEALTH WORKPLACE INJURY ENFORCEMENT OTHER TOPICS SOURCES AND DEFINITIONS
www.hse.gov.uk/statistics/notices.htmEnforcement Notices served
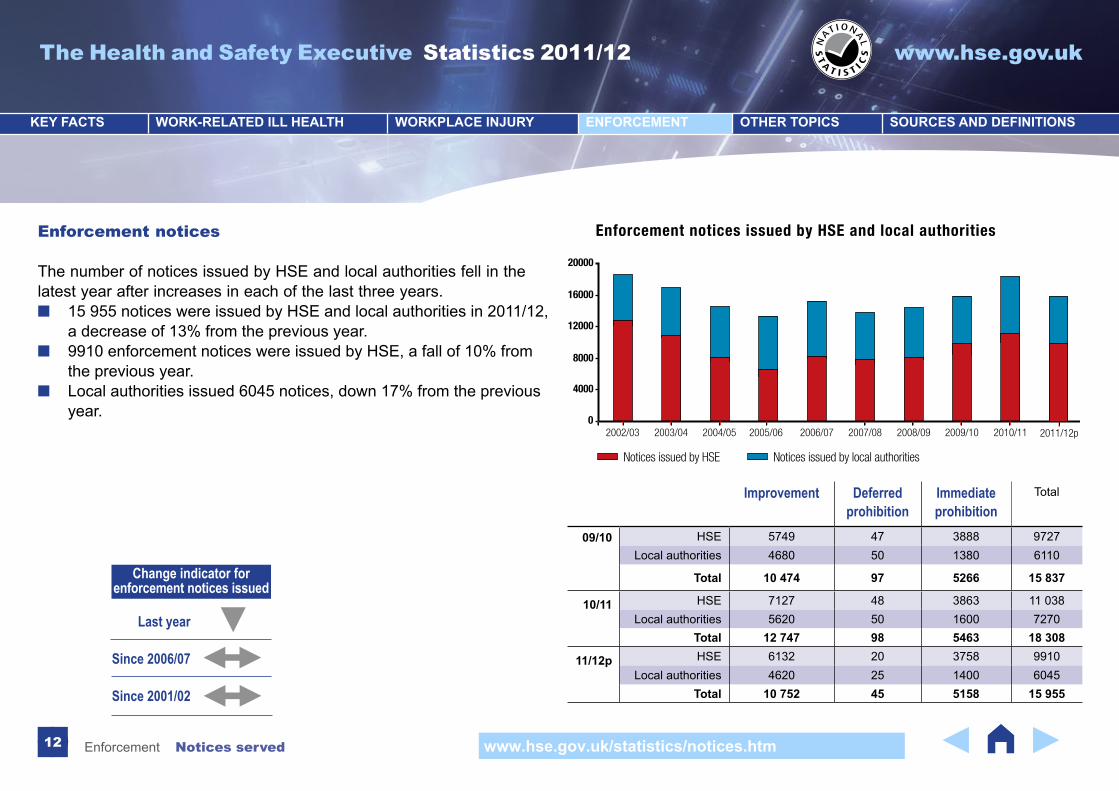
Enforcement notices
The number of notices issued by HSE and local authorities fell in the latest year after increases in each of the last three years.
■ 15 955 notices were issued by HSE and local authorities in 2011/12, a decrease of 13% from the previous year.
■ 9910 enforcement notices were issued by HSE, a fall of 10% from the previous year.
■ Local authorities issued 6045 notices, down 17% from the previous year.
0
4000
8000
12000
16000
20000
2007/08 2009/10
Enforcement notices issued by HSE and local authorities
2002/03 2003/04 2004/05 2005/06 2011/12p2006/07 2008/09 2010/11
Notices issued by HSE Notices issued by local authorities
Improvement Deferred prohibition
Immediate prohibition
Total
09/10 HSE 5749 47 3888 9727Local authorities 4680 50 1380 6110
Total 10 474 97 5266 15 837
10/11 HSE 7127 48 3863 11 038Local authorities 5620 50 1600 7270
Total 12 747 98 5463 18 308
11/12p HSE 6132 20 3758 9910Local authorities 4620 25 1400 6045
Total 10 752 45 5158 15 955
Last year
Since 2006/07
Since 2001/02
Change indicator forenforcement notices issued
The Health and Safety Executive Statistics 2011/12 www.hse.gov.uk
13
KEY FACTS WORK-RELATED ILL HEALTH WORKPLACE INJURY ENFORCEMENT OTHER TOPICS SOURCES AND DEFINITIONS
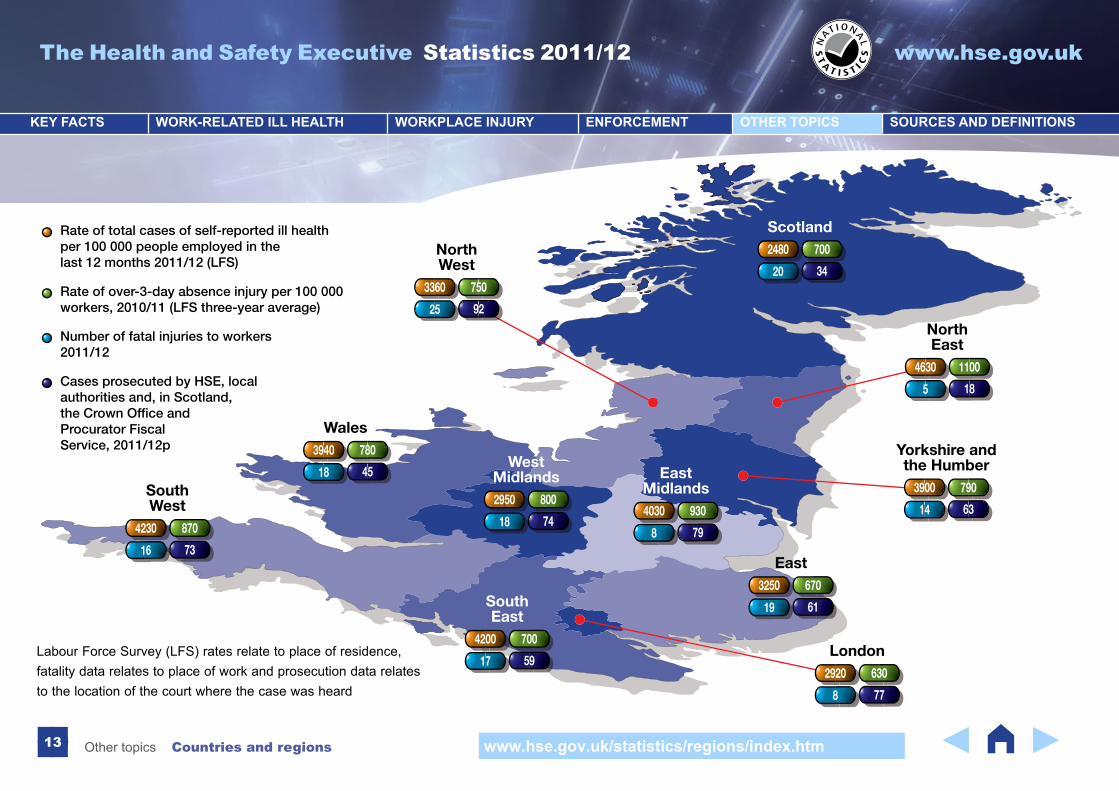
www.hse.gov.uk/statistics/regions/index.htmOther topics Countries and regions
18
Wales7803940
45
Rate of over-3-day absence injury per 100 000 workers, 2010/11 (LFS three-year average)
Rate of total cases of self-reported ill health per 100 000 people employed in thelast 12 months 2011/12 (LFS)
Number of fatal injuries to workers 2011/12
Cases prosecuted by HSE, local authorities and, in Scotland, the Crown Office andProcurator Fiscal Service, 2011/12p
19
East6703250
61
8
4030
79
EastMidlands
930SouthWest
16
8704230
73
18
WestMidlands
8002950
74
17
SouthEast
7004200
59
8
London6302920
77
14
Yorkshire andthe Humber
7903900
63
5
NorthEast
11004630
18
20
Scotland7002480
34
25
NorthWest
7503360
92
Labour Force Survey (LFS) rates relate to place of residence, fatality data relates to place of work and prosecution data relates to the location of the court where the case was heard

The Health and Safety Executive Statistics 2011/12 www.hse.gov.uk
14
KEY FACTS WORK-RELATED ILL HEALTH WORKPLACE INJURY ENFORCEMENT OTHER TOPICS SOURCES AND DEFINITIONS
www.hse.gov.uk/statistics/european/index.htmOther topics European comparisons
European comparisons
Summary of performanceAlthough health and safety systems differ across Europe in recording, reporting and enforcement, Eurostat publishes data in as standardised a form as possible. This table compares UK performance on key health and safety measures with other large economies such as Germany, France, Italy, Spain and Poland, and with overall rates for the EU-15 and EU-27 groups of countries, where available.
Key findings ■ In 2009 the rate of fatal injuries in GB was the second lowest of
those published by Eurostat. GB performs well against other large economies such as Germany, France, Spain, Italy and Poland.
■ Non-fatal accidents in GB were at a similar level to other large economies in 2007, but better than the overall EU-15 and EU-27 rates.
■ Rates of work-related ill health resulting in sick leave were lower in GB in 2007 than most other EU countries.
■ Overall, GB performance is better than many other European countries in the key outcome areas: accidents, fatalities and levels of self-reported work-related ill health.
* Methodological differences in data collection mean France is excluded from these comparisons
UK performance exceeds comparators
UK performance in line with comparators
Comparison not available
Fatalities – incidence rate per 100 000 employed (Eurostat 2009)
Self-reported work-related accidents resulting in sick leave (LFS 2007)
Self-reported work-related health problemresulting in sick leave (LFS 2007)*
EU-27EU-15PeersGermany, France,
Italy, Spain, Poland
The Health and Safety Executive Statistics 2011/12 www.hse.gov.uk
15
KEY FACTS WORK-RELATED ILL HEALTH WORKPLACE INJURY ENFORCEMENT OTHER TOPICS SOURCES AND DEFINITIONS
www.hse.gov.uk/statistics/industry/index.htmOther topics Industry sectors
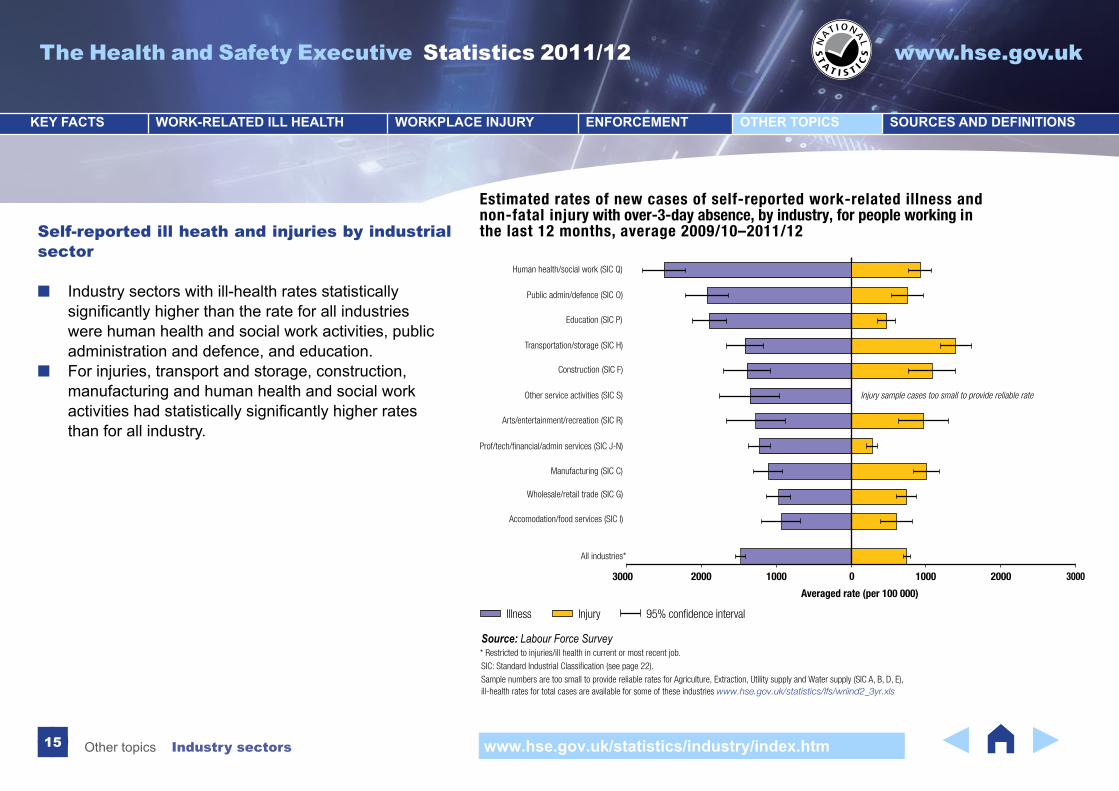
Self-reported ill heath and injuries by industrial sector
■ Industry sectors with ill-health rates statistically significantlyhigherthantherateforallindustrieswere human health and social work activities, public administration and defence, and education.
■ For injuries, transport and storage, construction, manufacturing and human health and social work activitieshadstatisticallysignificantlyhigherrates than for all industry.
Estimated rates of new cases of self-reported work-related illness and non-fatal injury with over-3-day absence, by industry, for people working in the last 12 months, average 2009/10–2011/12
Averaged rate (per 100 000)
Human health/social work (SIC Q)
Arts/entertainment/recreation (SIC R)
Public admin/defence (SIC O)
Education (SIC P)
Construction (SIC F)
Prof/tech/financial/admin services (SIC J-N)
Other service activities (SIC S) Injury sample cases too small to provide reliable rate
Manufacturing (SIC C)
Wholesale/retail trade (SIC G)
Accomodation/food services (SIC I)
Transportation/storage (SIC H)
All industries*
Source: Labour Force Survey* Restricted to injuries/ill health in current or most recent job.
SIC: Standard Industrial Classification (see page 22).
Sample numbers are too small to provide reliable rates for Agriculture, Extraction, Utility supply and Water supply (SIC A, B, D, E), ill-health rates for total cases are available for some of these industries www.hse.gov.uk/statistics/lfs/wriind2_3yr.xls
Illness Injury 95% confidence interval
0100020003000 1000 2000 3000
The Health and Safety Executive Statistics 2011/12 www.hse.gov.uk
16
KEY FACTS WORK-RELATED ILL HEALTH WORKPLACE INJURY ENFORCEMENT OTHER TOPICS SOURCES AND DEFINITIONS
www.hse.gov.uk/statistics/lfs/index.htmOther topics Occupation groups
3050
5690
4910
3760
3580
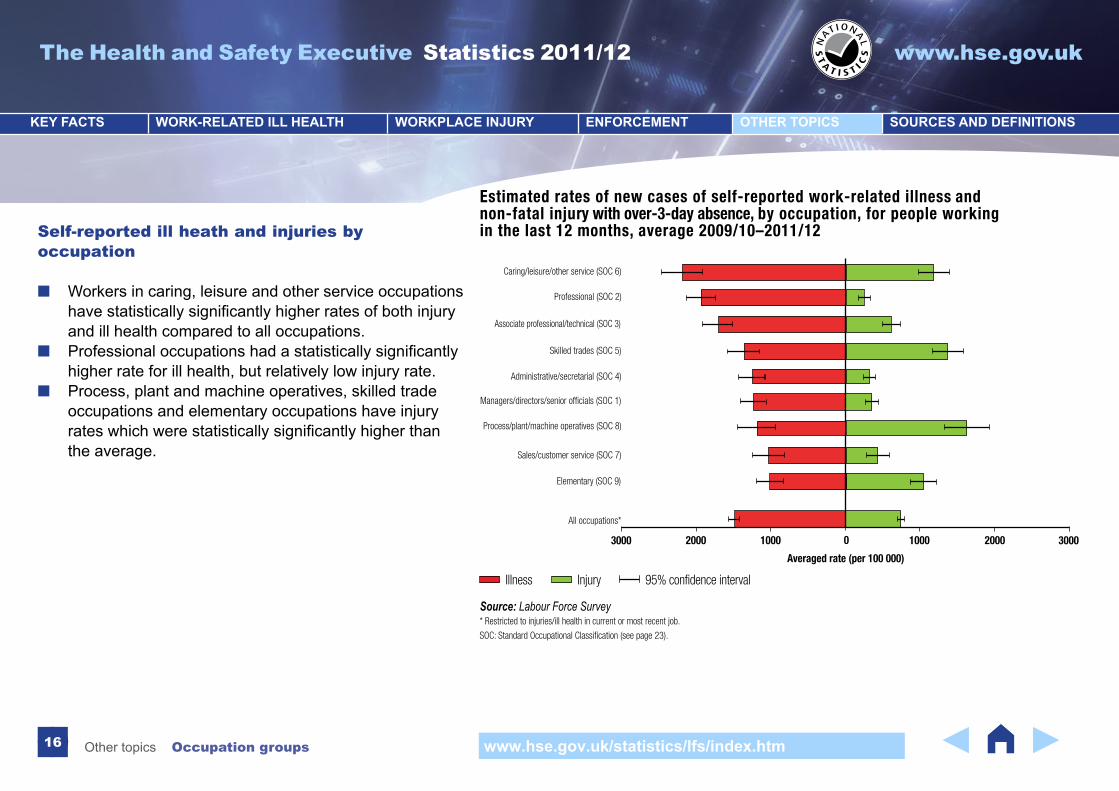
Estimated rates of new cases of self-reported work-related illness and non-fatal injury with over-3-day absence, by occupation, for people working in the last 12 months, average 2009/10–2011/12
0100020003000 1000 2000 3000
Averaged rate (per 100 000)
Caring/leisure/other service (SOC 6)
Associate professional/technical (SOC 3)
Skilled trades (SOC 5)
Sales/customer service (SOC 7)
Elementary (SOC 9)
All occupations*
* Restricted to injuries/ill health in current or most recent job.
SOC: Standard Occupational Classification (see page 23).
Illness Injury 95% confidence interval
Source: Labour Force Survey
Managers/directors/senior officials (SOC 1)
Administrative/secretarial (SOC 4)
3640Process/plant/machine operatives (SOC 8)
Professional (SOC 2)
Self-reported ill heath and injuries by occupation
■ Workers in caring, leisure and other service occupations havestatisticallysignificantlyhigherratesofbothinjuryand ill health compared to all occupations.
■ Professionaloccupationshadastatisticallysignificantlyhigher rate for ill health, but relatively low injury rate.
■ Process, plant and machine operatives, skilled trade occupations and elementary occupations have injury rateswhichwerestatisticallysignificantlyhigherthanthe average.
The Health and Safety Executive Statistics 2011/12 www.hse.gov.uk
17
KEY FACTS WORK-RELATED ILL HEALTH WORKPLACE INJURY ENFORCEMENT OTHER TOPICS SOURCES AND DEFINITIONS
www.hse.gov.uk/statistics/lfs/index.htmOther topics Working days lost
2000-020
5
10
15
20
25
30
35
40
45
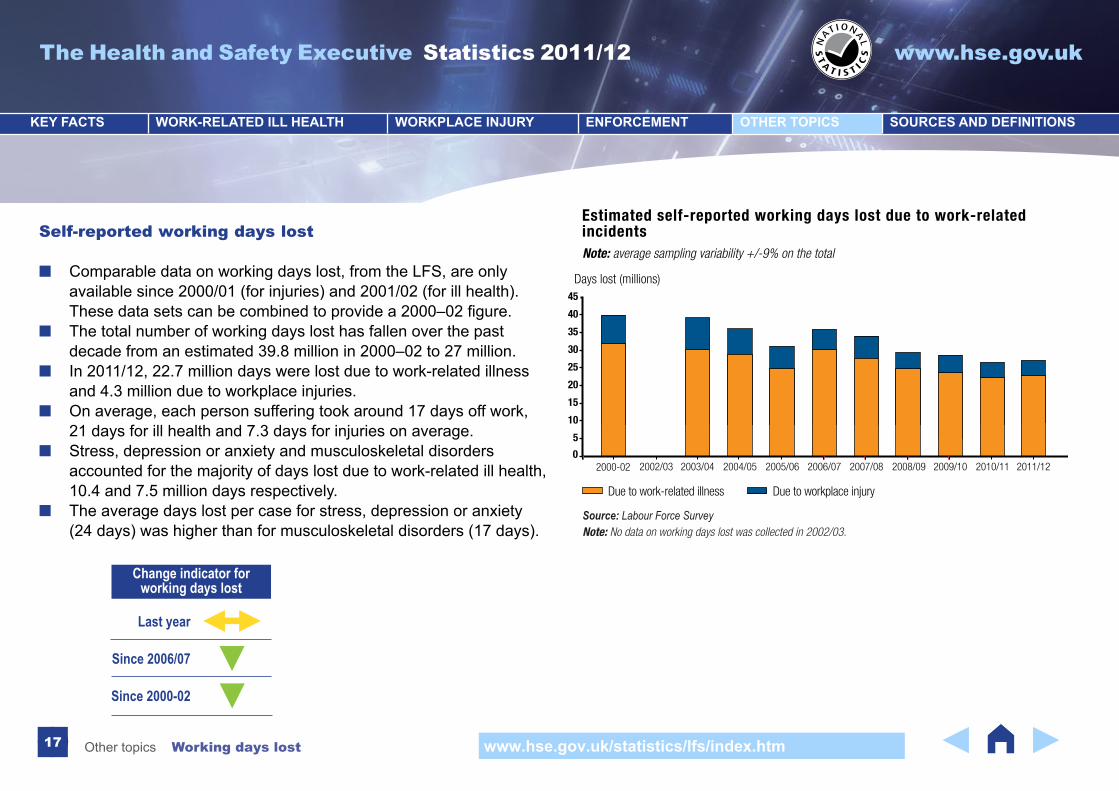
Estimated self-reported working days lost due to work-related incidents
2002/03 2002/03 2004/052003/04 2005/06 2006/07 2007/08 2008/09 2009/10 2010/11
Due to work-related illness Due to workplace injury
Note: average sampling variability +/-9% on the total
Days lost (millions)
Source: Labour Force SurveyNote: No data on working days lost was collected in 2002/03.
2011/12
Self-reported working days lost
■ Comparable data on working days lost, from the LFS, are only available since 2000/01 (for injuries) and 2001/02 (for ill health). Thesedatasetscanbecombinedtoprovidea2000–02figure.
■ The total number of working days lost has fallen over the past decade from an estimated 39.8 million in 2000–02 to 27 million.
■ In 2011/12, 22.7 million days were lost due to work-related illness and 4.3 million due to workplace injuries.
■ On average, each person suffering took around 17 days off work, 21 days for ill health and 7.3 days for injuries on average.
■ Stress, depression or anxiety and musculoskeletal disorders accounted for the majority of days lost due to work-related ill health, 10.4 and 7.5 million days respectively.
■ The average days lost per case for stress, depression or anxiety (24 days) was higher than for musculoskeletal disorders (17 days).
Last year
Since 2006/07
Since 2000-02
Change indicator forworking days lost
The Health and Safety Executive Statistics 2011/12 www.hse.gov.uk
18
KEY FACTS WORK-RELATED ILL HEALTH WORKPLACE INJURY ENFORCEMENT OTHER TOPICS SOURCES AND DEFINITIONS
www.hse.gov.uk/statistics/lfs/index.htmOther topics Working days lost
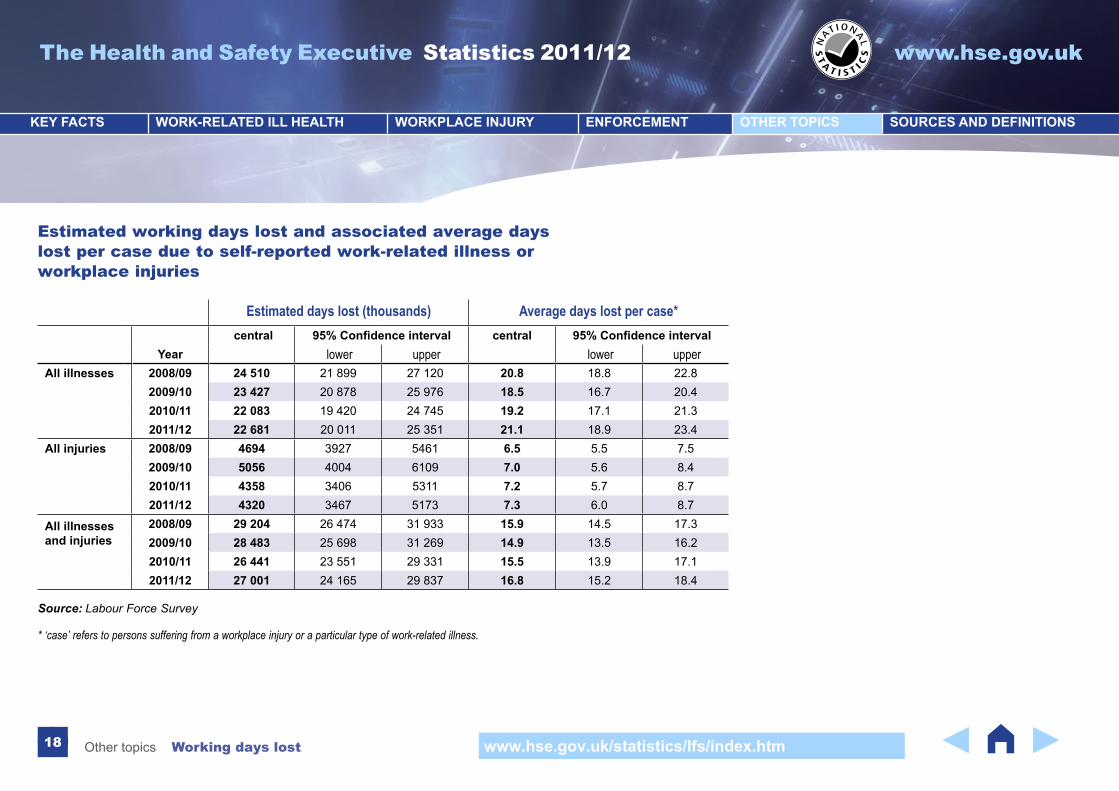
Estimated days lost (thousands) Average days lost per case* central 95% Confidence interval central 95% Confidence interval
Year lower upper lower upperAll illnesses 2008/09 24 510 21 899 27 120 20.8 18.8 22.8
2009/10 23 427 20 878 25 976 18.5 16.7 20.42010/11 22 083 19 420 24 745 19.2 17.1 21.32011/12 22 681 20 011 25 351 21.1 18.9 23.4
All injuries 2008/09 4694 3927 5461 6.5 5.5 7.52009/10 5056 4004 6109 7.0 5.6 8.42010/11 4358 3406 5311 7.2 5.7 8.72011/12 4320 3467 5173 7.3 6.0 8.7
All illnesses and injuries
2008/09 29 204 26 474 31 933 15.9 14.5 17.32009/10 28 483 25 698 31 269 14.9 13.5 16.22010/11 26 441 23 551 29 331 15.5 13.9 17.12011/12 27 001 24 165 29 837 16.8 15.2 18.4
Estimated working days lost and associated average days lost per case due to self-reported work-related illness or workplace injuries
Source: Labour Force Survey
* ‘case’ refers to persons suffering from a workplace injury or a particular type of work-related illness.
The Health and Safety Executive Statistics 2011/12 www.hse.gov.uk
19
KEY FACTS WORK-RELATED ILL HEALTH WORKPLACE INJURY ENFORCEMENT OTHER TOPICS SOURCES AND DEFINITIONS
www.hse.gov.uk/statistics/cost.htmOther topics Economic costs to Britain
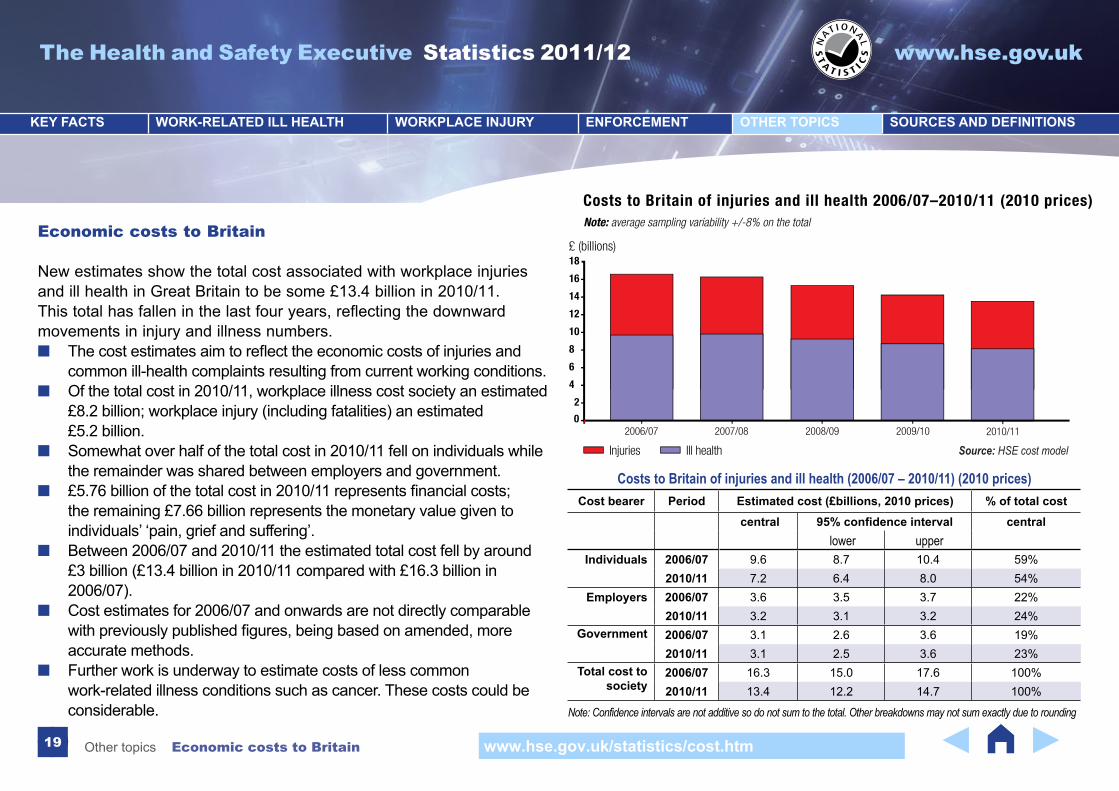
Economic costs to Britain
New estimates show the total cost associated with workplace injuries and ill health in Great Britain to be some £13.4 billion in 2010/11. This total has fallen in the last four years, reflecting the downward movements in injury and illness numbers.
■ Thecostestimatesaimtoreflecttheeconomiccostsofinjuriesandcommon ill-health complaints resulting from current working conditions.
■ Of the total cost in 2010/11, workplace illness cost society an estimated £8.2 billion; workplace injury (including fatalities) an estimated £5.2 billion.
■ Somewhat over half of the total cost in 2010/11 fell on individuals while the remainder was shared between employers and government.
■ £5.76billionofthetotalcostin2010/11representsfinancialcosts;the remaining £7.66 billion represents the monetary value given to individuals’ ‘pain, grief and suffering’.
■ Between 2006/07 and 2010/11 the estimated total cost fell by around £3 billion (£13.4 billion in 2010/11 compared with £16.3 billion in 2006/07).
■ Cost estimates for 2006/07 and onwards are not directly comparable withpreviouslypublishedfigures,beingbasedonamended,moreaccurate methods.
■ Further work is underway to estimate costs of less common work-related illness conditions such as cancer. These costs could be considerable.
Costs to Britain of injuries and ill health (2006/07 – 2010/11) (2010 prices)Cost bearer Period Estimated cost (£billions, 2010 prices) % of total cost
central 95% confidence interval central lower upper
Individuals 2006/07 9.6 8.7 10.4 59%2010/11 7.2 6.4 8.0 54%
Employers 2006/07 3.6 3.5 3.7 22%2010/11 3.2 3.1 3.2 24%
Government 2006/07 3.1 2.6 3.6 19%2010/11 3.1 2.5 3.6 23%
Total cost to society
2006/07 16.3 15.0 17.6 100%2010/11 13.4 12.2 14.7 100%
2010/110
2
4
6
8
10
12
14
16
18
Costs to Britain of injuries and ill health 2006/07–2010/11 (2010 prices)
2006/07 2009/102008/092007/08
Injuries Ill health
Note: average sampling variability +/-8% on the total
£ (billions)
Source: HSE cost model
Note: Confidence intervals are not additive so do not sum to the total. Other breakdowns may not sum exactly due to rounding
The Health and Safety Executive Statistics 2011/12 www.hse.gov.uk
20
KEY FACTS WORK-RELATED ILL HEALTH WORKPLACE INJURY ENFORCEMENT OTHER TOPICS SOURCES AND DEFINITIONS
www.hse.gov.uk/statistics/sources.htmSourcesanddefinitions
Sources and definitions
The Labour Force Survey (LFS): A national survey run by the Office for National Statistics of over 40 000 households each quarter. HSE commissions annual questions in the LFS to gain a view of work-related illness and workplace injury based on individuals’ perceptions. Further details about the LFS, and more specifically the HSE commissioned questions, are available from www.hse.gov.uk/statistics/lfs/technicalnote.htm
Self-reported work-related illness (SWI): People who have conditions which they think have been caused or made worse by their current or past work, as estimated from the LFS. Estimated total cases include long-standing as well as new cases. New cases consist of those who first became aware of their illness in the last 12 months. HSE has carried out SWI surveys, through the LFS, periodically since 1990 and annually since 2003/04.
Rate per 100 000: The number of injuries or cases of ill health per 100 000 employees or workers, either overall or for a particular industry or area.
95% confidence intervals: The range of values which we are 95% confident contains the true value, in the absence of bias. This reflects the potential error that results from surveying a sample rather than the entire population. A difference between two estimates is ‘statistically significant’ if there is a less than 5% chance that it is due to sampling error alone.
Reports of ill health by doctors and specialist physicians: These reports of work-related ill health are gathered in surveillance schemes run by the The Health and Occupation Reporting network (THOR and THOR-GP). Statistical tables covering patients seen by specialists are available annually from the early 1990s for work-related respiratory disorders and skin disease. THOR-GP has been fully established since 2006.
Ill health assessed for disablement benefit (IIDB): New cases of specified ‘prescribed diseases’ (with an established occupational cause) assessed for compensation under the Industrial Injuries Disablement Benefit scheme. IIDB statistics are available annually from the 1980s or earlier.
The Health and Safety Executive Statistics 2011/12 www.hse.gov.uk
Sources and definitions21
KEY FACTS WORK-RELATED ILL HEALTH WORKPLACE INJURY ENFORCEMENT OTHER TOPICS SOURCES AND DEFINITIONS
www.hse.gov.uk/statistics/sources.htm
RIDDOR 95: The Reporting of Injuries, Diseases and Dangerous Occurrences Regulations 1995, under which fatal and specified non-fatal injuries to workers and members of the public are reported by employers.
Certain types of work-related injury are not reportable under RIDDOR and hence are excluded from these figures. Particular exclusions include fatalities and injuries to the armed forces and injuries from work-related road collisions.
In September 2011, the reporting system for RIDDOR changed with some impact on the resulting statistics. For more information about the coverage of RIDDOR and the effect of recent changes, see www.hse.gov.uk/statistics/sources.htm.
Reported major injuries: These are specified serious injuries to workers, including most fractures, amputations and other injuries leading to resuscitation or 24-hour admittance to hospital.
Reported over-3-day injuries: Other (non-major) injuries to workers that lead to absence from work or inability to do their usual job, for over three days.
Self-reported injuries from the Labour Force Survey (LFS): HSE has placed a set of injury questions on the LFS in 1990 and annually since 1993. Over-3-day absence injuries include all those sustained as a result of non-road traffic accidents, leading to more than three consecutive (working and non-working) days away from work (not counting the day on which the accident happened). All workplace injuries include all those sustained as a result of a non-road traffic accident, regardless. LFS injury rates are generally presented as three-year averages to provide a more robust series of estimates.
Working days lost: Days off work due to workplace injuries and work-related ill health, as estimated from the LFS. The figures are expressed as full-day equivalents, to allow for variation in daily hours worked, and are available for 2000/01 (injuries), 2001/02 (ill health), and annually (for both injuries and ill health) from 2003/04.
Enforcement notices and offences prosecuted: The relevant enforcing authorities are HSE, local authorities and, in Scotland, the Crown Office and Procurator Fiscal Service (COPFS). In Scotland, HSE and local authorities investigate potential offences but cannot institute legal proceedings. HSE and local authorities send a report to the COPFS and the COPFS makes the final decision whether to institute legal proceedings and which offences are taken.
The Health and Safety Executive Statistics 2011/12 www.hse.gov.uk
Sources and definitions22
KEY FACTS WORK-RELATED ILL HEALTH WORKPLACE INJURY ENFORCEMENT OTHER TOPICS SOURCES AND DEFINITIONS
www.hse.gov.uk/statistics/sources.htm
Enforcement notices cover improvement, prohibition and deferred prohibition. Offences prosecuted refer to individual breaches of health and safety legislation; a prosecution case may include more than one offence. Where prosecution statistics are allocated against a particular year, unless otherwise stated, the year relates to the date of final hearing with a known outcome. They exclude those cases not completed, for example adjourned.
HSE cost model: Developed to estimate the costs of injury and common ill-health complaints arising from current working conditions. It uses the number of fatalities reported under RIDDOR and the estimated number of people reporting a non-fatal workplace injury or work-related illness in the LFS/SWI (the latter are restricted to reports of newly occurring illness to best capture costs arising from current working conditions). The cost model allows for those people who permanently leave the workforce as a result of their workplace injury or illness, again estimated from the LFS/SWI. Information on financial costs comes from various sources including ONS surveys on earnings, NHS data on treatment costs and DWP figures on benefit rates. Non-financial costs are based on the value that individuals would be willing to pay to have reduced risk of death or avoid reductions in quality of life which result from injury or illness. The cost model approach uses similar methods to other government departments.
Eurostat
Fatal injuries: Despite issues with comparability, Eurostat publishes data on fatal accidents at work in as standardised a form as possible. Fatalities cover eight common industry groupings, are standardised to take account of the different structure of working populations across member states, and fatalities due to road traffic accidents are removed to account for GB and Ireland who do not record work-related road traffic accidents. For further details on the scope and coverage of the fatalities data please see the metadata provided by Eurostat: http://epp.eurostat.ec.europa.eu/cache/ITY_SDDS/EN/hsw_acc_work_esms.htm
European Union Labour Force Survey (EU LFS): A large household survey carried out in the 27 Member States of the European Union, 3 candidate countries and 3 countries of the European Free Trade Association (EFTA). In 2007 the EU-LFS included an ad hoc module asking about accidents at work, work-related health problems, and exposure to factors that can adversely affect mental well-being or physical health in the previous 12 months.
Standard Industrial Classification (SIC): The system used in UK official statistics for classifying businesses by the type of activity they are engaged in. This has been revised several times since first introduced in 1948. The version used in these statistics is SIC 2007.
The Health and Safety Executive Statistics 2011/12 www.hse.gov.uk
Sources and definitions23
KEY FACTS WORK-RELATED ILL HEALTH WORKPLACE INJURY ENFORCEMENT OTHER TOPICS SOURCES AND DEFINITIONS
www.hse.gov.uk/statistics/sources.htm
Standard Occupational Classification (SOC): The system used in UK official statistics for classifying workers by the type of job they are engaged in. The version used in these statistics is SOC 2010.
Change indicators: The traffic light indicators of change over the past year, five years and ten years which are shown on many pages of this document have been determined by statistical significance for LFS data (ie whether the latest estimate is significantly higher or lower than the relevant reference year) and using a 2% per year categorisation for RIDDOR and enforcement data (for example, if a data series has fallen by more than 2% per year over the reference period, a downward indicator is shown).
p: Provisional.
n/a: Not available
HSE Chief Statitician: Kate SweeneyContact: [email protected]