Summary of CSO Receiving Water Quality Monitoring in
Upper Mystic River/Alewife Brook and Charles River, 2010
Massachusetts Water Resources Authority
Environmental Quality Department Report 2011-11
Citation Coughlin, Kelly. 2011. Summary of CSO Receiving Water Quality Monitoring in Upper Mystic River/Alewife Brook and Charles River, 2010. Boston: Massachusetts Water Resources Authority. Report 2011-11. 46 pp.
Summary of CSO Receiving Water Quality Monitoring in Upper Mystic River/Alewife Brook
and Charles River, 2010
Prepared by:
Kelly Coughlin Environmental Quality Department, Operations Division
Massachusetts Water Resources Authority 100 First Avenue, Boston, MA 02129
July 2011
Environmental Quality Department Technical Report 2011-11

i
TABLE OF CONTENTS
1 INTRODUCTION ............................................................................................................................................... 1 1.1 OVERVIEW OF THE MONITORING PROGRAM .................................................................................... 5 1.2 ORGANIZATION AND PURPOSE OF THE REPORT .............................................................................. 5
2 MATERIALS AND METHODS ........................................................................................................................ 5 2.1 FIELD AND LABORATORY METHODS .................................................................................................. 5
2.1.1 Selection of sampling locations ............................................................................................................. 5 2.1.2 Sampling schedule ................................................................................................................................. 5 2.1.3 Sample collection ................................................................................................................................... 5 2.1.4 Field measurements ............................................................................................................................... 6 2.1.5 Rainfall measurements ........................................................................................................................... 6 2.1.6 Laboratory analyses .............................................................................................................................. 6
2.2 DATA ANALYSIS ..................................................................................................................................... 7 2.3 WATER QUALITY CRITERIA USED IN THIS REPORT ........................................................................ 8
3 RESULTS: CHARLES RIVER ........................................................................................................................ 10 3.1 SAMPLING AREA ................................................................................................................................... 10 3.2 POLLUTION SOURCES .......................................................................................................................... 11 3.3 SUMMARY OF WATER QUALITY, 2005-2010 ................................................................................. 13 3.4 TRENDS IN WATER QUALITY, 2010 .................................................................................................. 16
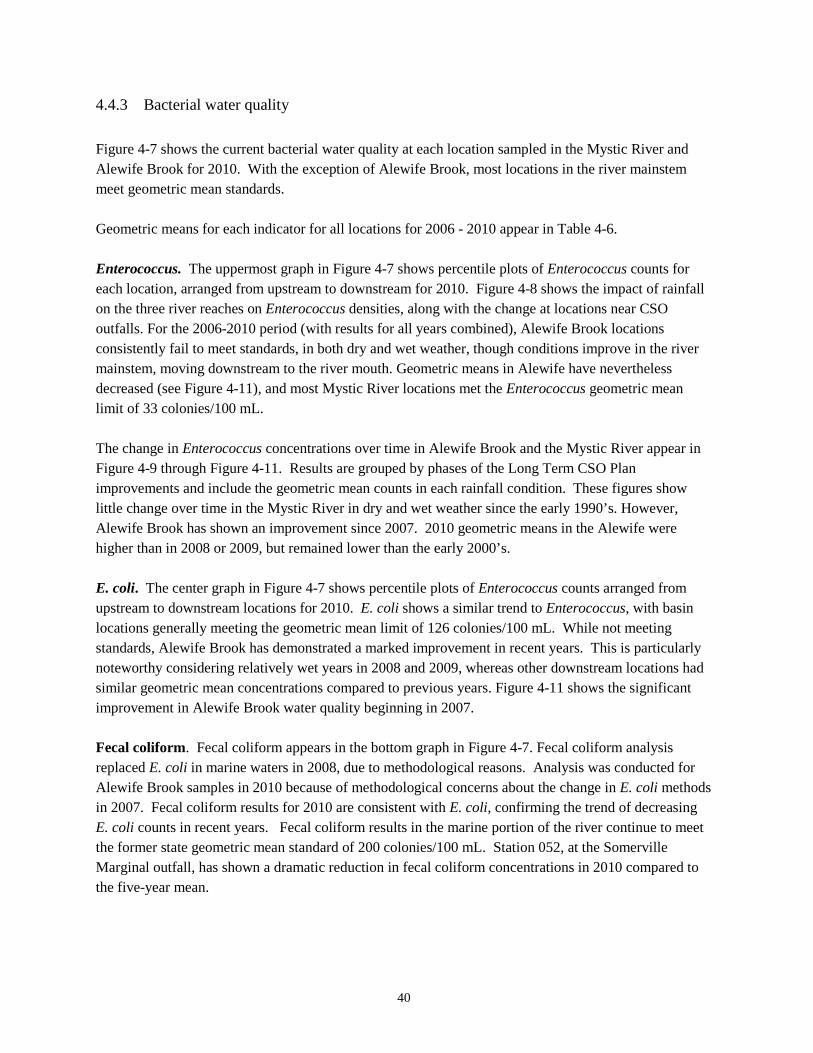
3.4.1 Physical measurements ........................................................................................................................ 16 3.4.2 Nutrients, TSS and chlorophyll ............................................................................................................ 18 3.4.3 Bacterial water quality ........................................................................................................................ 20
3.5 SUMMARY OF CHARLES RIVER WATER QUALITY ........................................................................ 26 4 RESULTS: MYSTIC RIVER AND ALEWIFE BROOK .............................................................................. 27
4.1 SAMPLING AREA ................................................................................................................................... 27 4.2 POLLUTION SOURCES .......................................................................................................................... 27 4.3 SUMMARY OF WATER QUALITY, 2005-2010 ................................................................................. 30 4.4 TRENDS IN WATER QUALITY, 2010 .................................................................................................. 33
4.4.1 Physical measurements ........................................................................................................................ 33 4.4.2 Nutrients, TSS and chlorophyll ............................................................................................................ 35 4.4.3 Bacterial water quality ........................................................................................................................ 36
4.5 SUMMARY OF MYSTIC RIVER WATER QUALITY ........................................................................... 45 REFERENCES .......................................................................................................................................................... 46
ii
LIST OF TABLES
Table 2-1. Field measurements. .................................................................................................................... 6 Table 2-2. Laboratory measurements. ........................................................................................................... 7 Table 2-3. Water quality criteria for Class B and Class SB waters. ............................................................. 9 Table 3-1. MWRA monitoring locations, lower Charles River. ................................................................. 11 Table 3-2. Charles River pollution sources. ................................................................................................ 12 Table 3-3. Charles River Basin CSO activations, results for 2010 system conditions and 2010 rainfall.. . 14 Table 3-4. Charles River sample collection by rainfall condition. ............................................................. 12 Table 3-5. Summary of water quality, lower Charles River Basin 5-year averages ................................... 14 Table 3-6. Geometric mean indicator bacteria, Charles River, 2005 - 2010. .............................................. 23 Table 4-1. MWRA monitoring locations, Mystic River and Alewife Brook. ............................................. 28 Table 4-2. Mystic River/Alewife Brook pollution sources. ........................................................................ 29 Table 4-3. Mystic River/Alewife Brook, results for 2010 system conditions and 2010 rainfall. ............... 29 Table 4-4. Mystic River/Alewife Brook sample collection by rainfall condition. ...................................... 29 Table 4-5. Summary of water quality, Mystic River/Alewife Brook 5 year averages. ............................... 31 Table 4-6. Geometric mean indicator bacteria, Mystic River, 2005 - 2010. ............................................... 42
LIST OF FIGURES
Figure 1-1. Estimated CSO flow reductions, 1987 – 2017 .......................................................................... 3 Figure 1-2. CSO Typical Year Discharge Volumes……………………………..………………………………3 Figure 2-1. Percentile distributions indicated on percentile plots ..……………………………………………3 Figure 3-1. Map of MWRA Charles River sampling locations .................................................................. 10 Figure 3-2. Summer temperature,dissolved oxygen, and Secchi depth, Charles River Basin, 2010. ......... 17 Figure 3-3. Monthly average nutrients, TSS and Chlorophyll 2005 - 2010, Watertown Dam. .................. 19 Figure 3-3. Monthly average nutrients, TSS and Chlorophyll 2005 - 2010, Science Museum. ................. 18 Figure 3-5. Indicator bacteria concentrations, Charles River Basin, 2010. ............................................... 22 Figure 3-6. Enterococcus by rainfall condition, Charles Basin, 2006 - 2010. ............................................ 24 Figure 3-7. Enterococcus over time, Upper Charles Basin. ........................................................................ 23 Figure 3-8. Enterococcus over time, Lower Charles Basin. ....................................................................... 23 Figure 4-1. Map of Mystic River sampling locations ................................................................................. 26 Figure 4-2. Summer temperature,dissolved oxygen, and Secchi depth, Lower Mystic, 2010. ................... 34 Figure 4-3. Monthly average nutrients, TSS and Chlorophyll 2005 - 2010, upstream of Alewife Brook.. 36 Figure 4-4. Monthly average nutrients, TSS and Chlorophyll 2005 - 2010, Boston Ave.. ......................... 37 Figure 4-5. Monthly average nutrients, TSS and Chlorophyll 2005 - 2010, Amelia Earhart Dam.. .......... 38 Figure 4-6. Monthly average nutrients, TSS and Chlorophyll 2005 - 2010, Mystic River Mouth.. ........... 39 Figure 4-7. Indicator bacteria concentrations, Mystic River/Alewife Brook, 2010. .................................. 41 Figure 4-8. Enterococcus by rainfall condition, Mystic River/Alewife Brook,. ......................................... 43 Figure 4-9. Enterococcus over time, Alewife Brook. ................................................................................. 44 Figure 4-10. Enterococcus over time, Mystic River. .................................................................................. 44 Figure 4-11. Enterococcus and E. coli over time, Alewife Brook, 2000 – 2010. ....................................... 45
1
1 Introduction This report summarizes data collected as part of Massachusetts Water Resources Authority’s (MWRA’s) combined sewer overflow (CSO) receiving water monitoring program, and is produced in accordance with the variance for CSO discharges to Lower Charles River/Charles Basin and Variance for CSO discharges to the Alewife Brook/Upper Mystic River. The goal of this monitoring is to identify the water quality impacts of CSO flows on water bodies. During the 2010 calendar year, MWRA continued to implement its Long Term CSO Control Plan, which was developed to address CSO discharges from all CSOs hydraulically connected to the MWRA sewer system and its member communities. This monitoring summary provides an assessment of water quality in the Charles and Mystic Rivers, which are affected by CSO projects implemented as part of this plan. In 2010, the Massachusetts Department of Environmental Protection (MADEP) extended the Variance for CSO discharges to the Lower Charles River/Charles Basin issued to MWRA, Boston Water and Sewer Commission (BWSC) and the City of Cambridge respectively by three years, to October 1, 2013. MADEP also extended the Variance for CSO discharges to the Alewife Brook/Upper Mystic River issued to MWRA, the City of Cambridge and the City of Somerville respectively by three years, to September 1, 2013. Under the agreement on the Long Term Control Plan (the “Plan”) reached by EPA, MADEP and MWRA in March 2006, MADEP agreed to issue a series of three-year variance extensions until 2020, and MWRA agreed to implement the revised Plan by 2015 and verify the predicted performance at all CSO outfalls by 2020. At that time, DEP will consider issuing long-term water quality standards determinations, based on the verified performance of the Plan and other conditions affecting the water quality and uses of these water bodies. Conditions in the recent variance extensions require MWRA to implement the Plan and require MWRA and the municipalities to continue to implement the Nine Minimum Controls of EPA’s National CSO Control Policy, and all of the CSO permittees are required to report estimated CSO discharge frequency and volume from their respective outfalls to these receiving waters on an annual basis. MWRA is also required to continue receiving water quality monitoring program to assess impacts of CSO discharges. 2010 CSO progress as it relates to the Charles River and Alewife Brook/Mystic River includes the following:
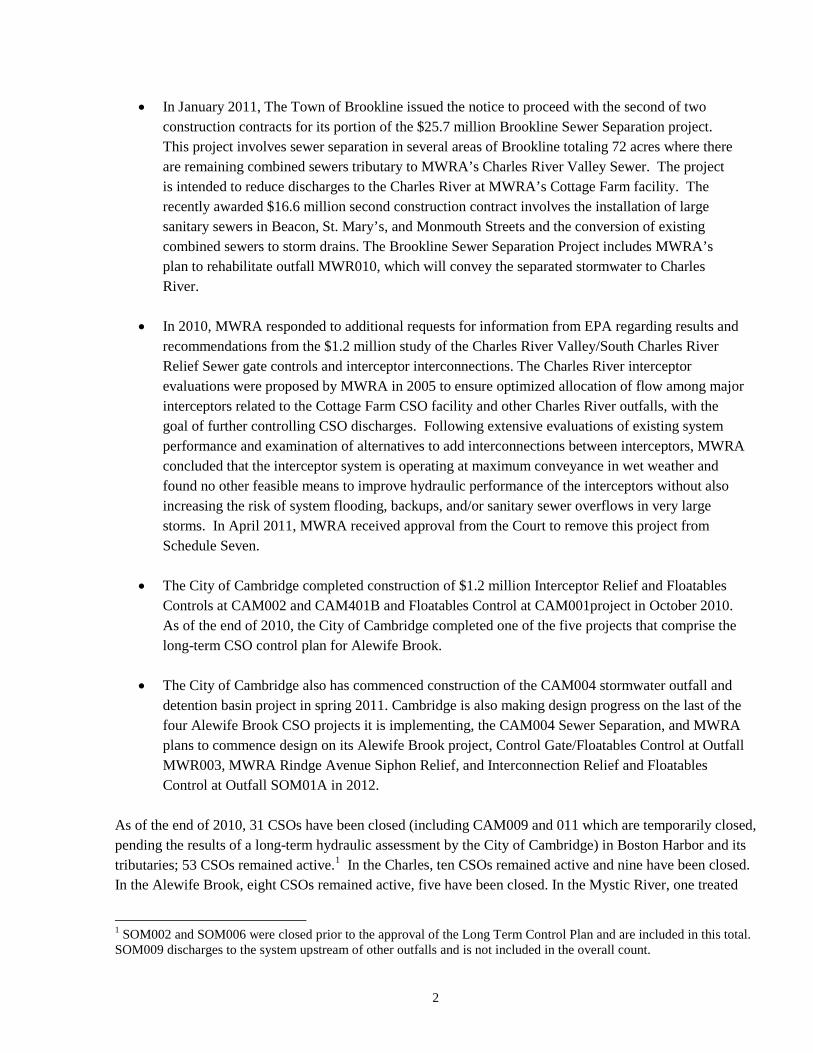
• In July 2010, BWSC completed the Bulfinch Triangle Sewer Separation project. The project involved the installation of 3,687 linear feet of storm drain, 1,376 linear feet of minor drain and 1,181 linear feet of sanitary sewer to separate the BWSC combined sewers serving the downtown/North Station area of Boston. This project will minimize CSO discharges to the Charles River and Upper Inner Harbor, especially at MWRA’s Prison Point CSO facility and eliminates CSO discharges at outfall BOS049, which has been converted to a storm drain.
2
• In January 2011, The Town of Brookline issued the notice to proceed with the second of two construction contracts for its portion of the $25.7 million Brookline Sewer Separation project. This project involves sewer separation in several areas of Brookline totaling 72 acres where there are remaining combined sewers tributary to MWRA’s Charles River Valley Sewer. The project is intended to reduce discharges to the Charles River at MWRA’s Cottage Farm facility. The recently awarded $16.6 million second construction contract involves the installation of large sanitary sewers in Beacon, St. Mary’s, and Monmouth Streets and the conversion of existing combined sewers to storm drains. The Brookline Sewer Separation Project includes MWRA’s plan to rehabilitate outfall MWR010, which will convey the separated stormwater to Charles River.
• In 2010, MWRA responded to additional requests for information from EPA regarding results and
recommendations from the $1.2 million study of the Charles River Valley/South Charles River Relief Sewer gate controls and interceptor interconnections. The Charles River interceptor evaluations were proposed by MWRA in 2005 to ensure optimized allocation of flow among major interceptors related to the Cottage Farm CSO facility and other Charles River outfalls, with the goal of further controlling CSO discharges. Following extensive evaluations of existing system performance and examination of alternatives to add interconnections between interceptors, MWRA concluded that the interceptor system is operating at maximum conveyance in wet weather and found no other feasible means to improve hydraulic performance of the interceptors without also increasing the risk of system flooding, backups, and/or sanitary sewer overflows in very large storms. In April 2011, MWRA received approval from the Court to remove this project from Schedule Seven.
• The City of Cambridge completed construction of $1.2 million Interceptor Relief and Floatables
Controls at CAM002 and CAM401B and Floatables Control at CAM001project in October 2010. As of the end of 2010, the City of Cambridge completed one of the five projects that comprise the long-term CSO control plan for Alewife Brook.
• The City of Cambridge also has commenced construction of the CAM004 stormwater outfall and
detention basin project in spring 2011. Cambridge is also making design progress on the last of the four Alewife Brook CSO projects it is implementing, the CAM004 Sewer Separation, and MWRA plans to commence design on its Alewife Brook project, Control Gate/Floatables Control at Outfall MWR003, MWRA Rindge Avenue Siphon Relief, and Interconnection Relief and Floatables Control at Outfall SOM01A in 2012.
As of the end of 2010, 31 CSOs have been closed (including CAM009 and 011 which are temporarily closed, pending the results of a long-term hydraulic assessment by the City of Cambridge) in Boston Harbor and its tributaries; 53 CSOs remained active.1
1 SOM002 and SOM006 were closed prior to the approval of the Long Term Control Plan and are included in this total. SOM009 discharges to the system upstream of other outfalls and is not included in the overall count.
In the Charles, ten CSOs remained active and nine have been closed. In the Alewife Brook, eight CSOs remained active, five have been closed. In the Mystic River, one treated
3
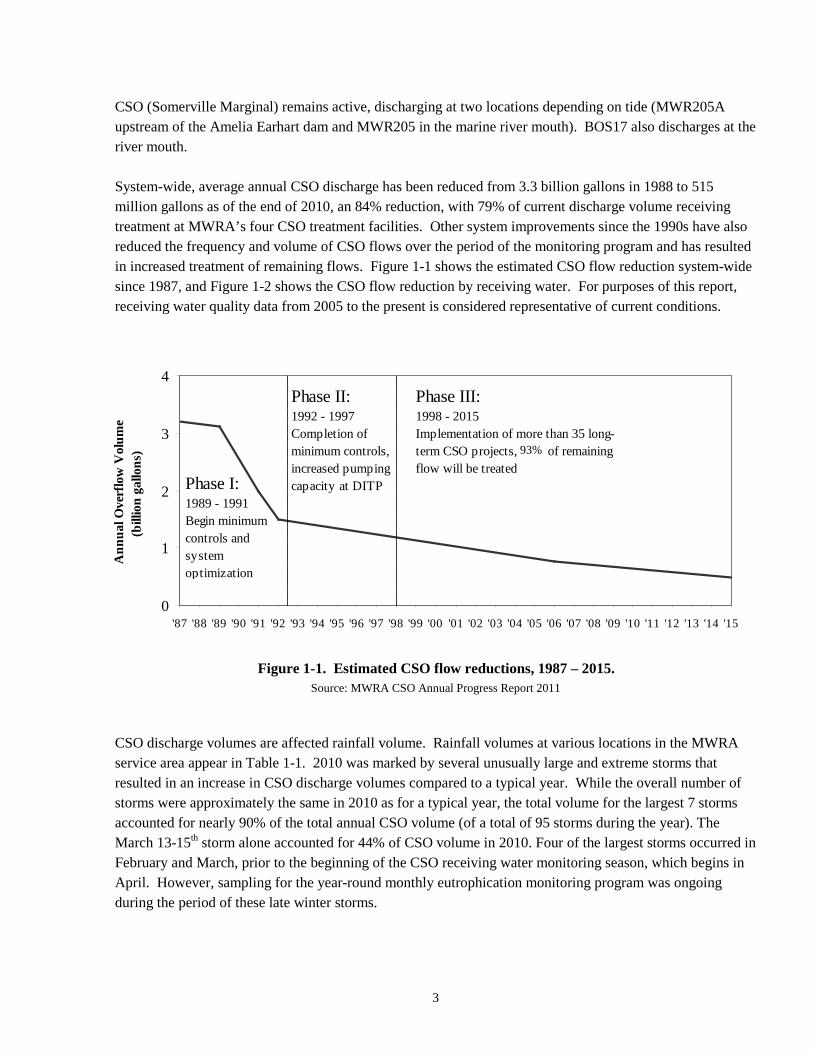
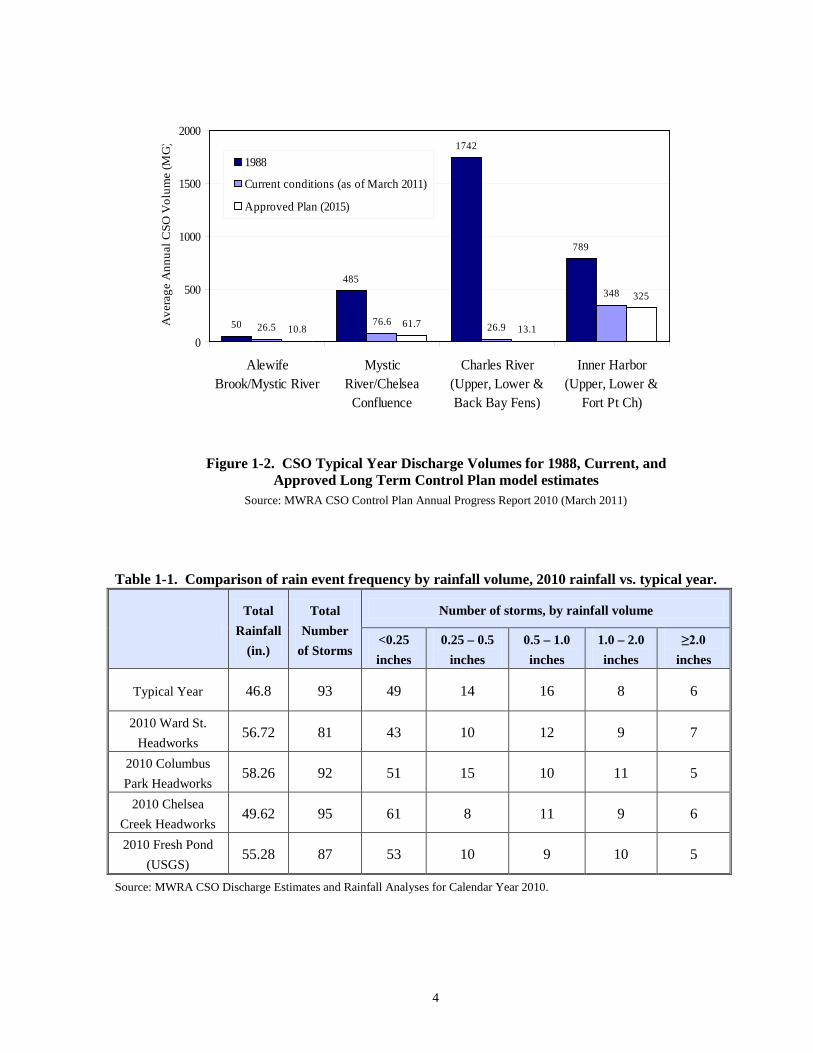
CSO (Somerville Marginal) remains active, discharging at two locations depending on tide (MWR205A upstream of the Amelia Earhart dam and MWR205 in the marine river mouth). BOS17 also discharges at the river mouth. System-wide, average annual CSO discharge has been reduced from 3.3 billion gallons in 1988 to 515 million gallons as of the end of 2010, an 84% reduction, with 79% of current discharge volume receiving treatment at MWRA’s four CSO treatment facilities. Other system improvements since the 1990s have also reduced the frequency and volume of CSO flows over the period of the monitoring program and has resulted in increased treatment of remaining flows. Figure 1-1 shows the estimated CSO flow reduction system-wide since 1987, and Figure 1-2 shows the CSO flow reduction by receiving water. For purposes of this report, receiving water quality data from 2005 to the present is considered representative of current conditions.
Figure 1-1. Estimated CSO flow reductions, 1987 – 2015. Source: MWRA CSO Annual Progress Report 2011
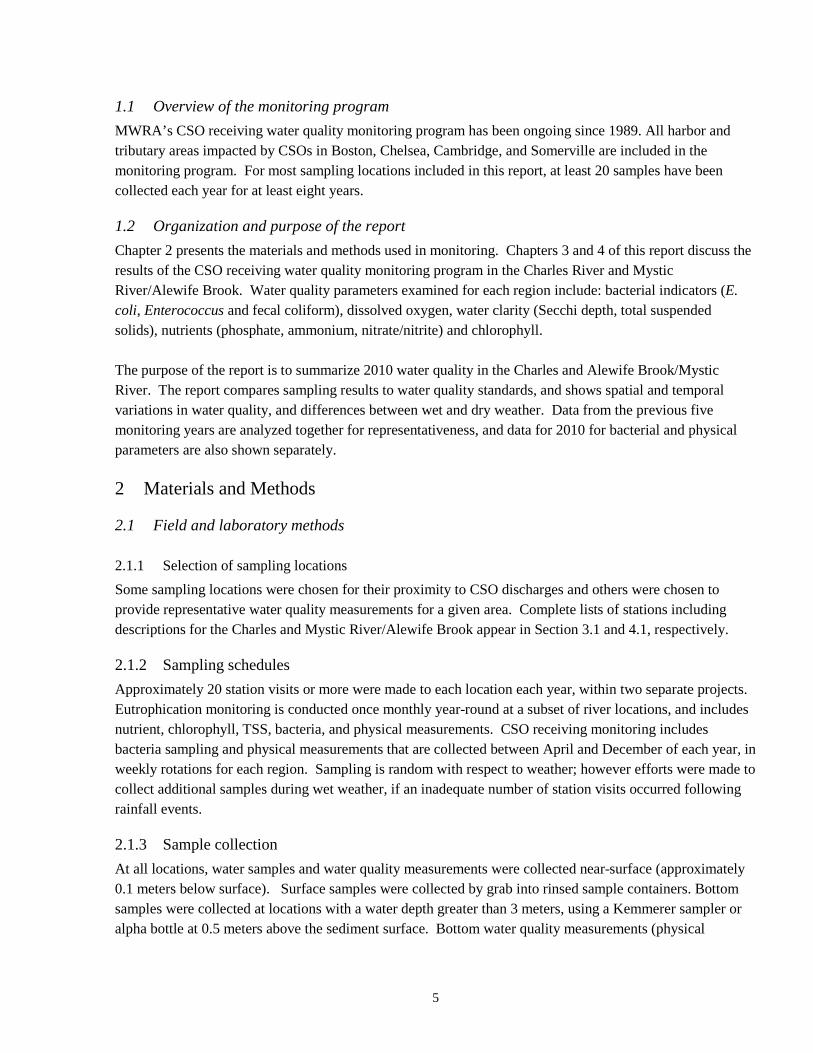
CSO discharge volumes are affected rainfall volume. Rainfall volumes at various locations in the MWRA service area appear in Table 1-1. 2010 was marked by several unusually large and extreme storms that resulted in an increase in CSO discharge volumes compared to a typical year. While the overall number of storms were approximately the same in 2010 as for a typical year, the total volume for the largest 7 storms accounted for nearly 90% of the total annual CSO volume (of a total of 95 storms during the year). The March 13-15th storm alone accounted for 44% of CSO volume in 2010. Four of the largest storms occurred in February and March, prior to the beginning of the CSO receiving water monitoring season, which begins in April. However, sampling for the year-round monthly eutrophication monitoring program was ongoing during the period of these late winter storms.
0
1
2
3
4
'87 '88 '89 '90 '91 '92 '93 '94 '95 '96 '97 '98 '99 '00 '01 '02 '03 '04 '05 '06 '07 '08 '09 '10 '11 '12 '13 '14 '15
Ann
ual O
verf
low
Vol
ume
(bill
ion
gallo
ns)
Phase I: 1989 - 1991Begin minimum controls and system optimization
Phase II: 1992 - 1997Completion of minimum controls, increased pumping capacity at DITP
Phase III: 1998 - 2015Implementation of more than 35 long-term CSO projects, 95% of remaining flow will be treated
93%
4
Figure 1-2. CSO Typical Year Discharge Volumes for 1988, Current, and Approved Long Term Control Plan model estimates
Source: MWRA CSO Control Plan Annual Progress Report 2010 (March 2011)
Table 1-1. Comparison of rain event frequency by rainfall volume, 2010 rainfall vs. typical year.
Total
Rainfall (in.)
Total Number
of Storms
Number of storms, by rainfall volume
<0.25 inches
0.25 – 0.5 inches
0.5 – 1.0 inches
1.0 – 2.0 inches
≥2.0 inches
Typical Year 46.8 93 49 14 16 8 6
2010 Ward St. Headworks
56.72 81 43 10 12 9 7
2010 Columbus Park Headworks
58.26 92 51 15 10 11 5
2010 Chelsea Creek Headworks
49.62 95 61 8 11 9 6
2010 Fresh Pond (USGS)
55.28 87 53 10 9 10 5
Source: MWRA CSO Discharge Estimates and Rainfall Analyses for Calendar Year 2010.
50
485
1742
789
26.5 76.6 26.9
348
10.8 61.7 13.1
325
0
500
1000
1500
2000
AlewifeBrook/Mystic River
MysticRiver/Chelsea
Confluence
Charles River(Upper, Lower &Back Bay Fens)
Inner Harbor(Upper, Lower &
Fort Pt Ch)
Ave
rage
Ann
ual C
SO V
olum
e (M
G)
1988
Current conditions (as of March 2011)
Approved Plan (2015)
5
1.1 Overview of the monitoring program MWRA’s CSO receiving water quality monitoring program has been ongoing since 1989. All harbor and tributary areas impacted by CSOs in Boston, Chelsea, Cambridge, and Somerville are included in the monitoring program. For most sampling locations included in this report, at least 20 samples have been collected each year for at least eight years.
1.2 Organization and purpose of the report Chapter 2 presents the materials and methods used in monitoring. Chapters 3 and 4 of this report discuss the results of the CSO receiving water quality monitoring program in the Charles River and Mystic River/Alewife Brook. Water quality parameters examined for each region include: bacterial indicators (E. coli, Enterococcus and fecal coliform), dissolved oxygen, water clarity (Secchi depth, total suspended solids), nutrients (phosphate, ammonium, nitrate/nitrite) and chlorophyll. The purpose of the report is to summarize 2010 water quality in the Charles and Alewife Brook/Mystic River. The report compares sampling results to water quality standards, and shows spatial and temporal variations in water quality, and differences between wet and dry weather. Data from the previous five monitoring years are analyzed together for representativeness, and data for 2010 for bacterial and physical parameters are also shown separately. 2 Materials and Methods
2.1 Field and laboratory methods
2.1.1 Selection of sampling locations Some sampling locations were chosen for their proximity to CSO discharges and others were chosen to provide representative water quality measurements for a given area. Complete lists of stations including descriptions for the Charles and Mystic River/Alewife Brook appear in Section 3.1 and 4.1, respectively.
2.1.2 Sampling schedules Approximately 20 station visits or more were made to each location each year, within two separate projects. Eutrophication monitoring is conducted once monthly year-round at a subset of river locations, and includes nutrient, chlorophyll, TSS, bacteria, and physical measurements. CSO receiving monitoring includes bacteria sampling and physical measurements that are collected between April and December of each year, in weekly rotations for each region. Sampling is random with respect to weather; however efforts were made to collect additional samples during wet weather, if an inadequate number of station visits occurred following rainfall events.
2.1.3 Sample collection At all locations, water samples and water quality measurements were collected near-surface (approximately 0.1 meters below surface). Surface samples were collected by grab into rinsed sample containers. Bottom samples were collected at locations with a water depth greater than 3 meters, using a Kemmerer sampler or alpha bottle at 0.5 meters above the sediment surface. Bottom water quality measurements (physical
6
measurements such as dissolved oxygen, temperature, and salinity) were made at most locations regardless of depth. Separate sampling containers were used for bacteria, nutrient, and TSS analyses.
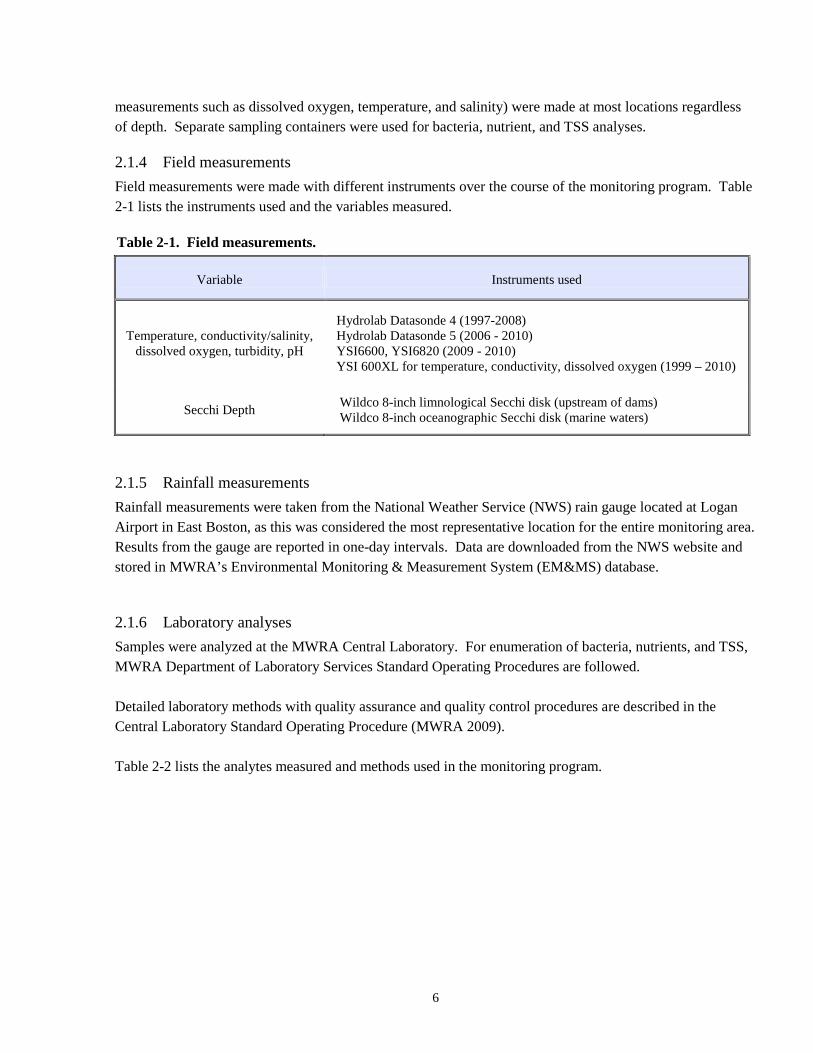
2.1.4 Field measurements Field measurements were made with different instruments over the course of the monitoring program. Table 2-1 lists the instruments used and the variables measured.
Table 2-1. Field measurements.
Variable Instruments used
Temperature, conductivity/salinity, dissolved oxygen, turbidity, pH
Hydrolab Datasonde 4 (1997-2008) Hydrolab Datasonde 5 (2006 - 2010) YSI6600, YSI6820 (2009 - 2010) YSI 600XL for temperature, conductivity, dissolved oxygen (1999 – 2010)
Secchi Depth Wildco 8-inch limnological Secchi disk (upstream of dams) Wildco 8-inch oceanographic Secchi disk (marine waters)
2.1.5 Rainfall measurements Rainfall measurements were taken from the National Weather Service (NWS) rain gauge located at Logan Airport in East Boston, as this was considered the most representative location for the entire monitoring area. Results from the gauge are reported in one-day intervals. Data are downloaded from the NWS website and stored in MWRA’s Environmental Monitoring & Measurement System (EM&MS) database.
2.1.6 Laboratory analyses Samples were analyzed at the MWRA Central Laboratory. For enumeration of bacteria, nutrients, and TSS, MWRA Department of Laboratory Services Standard Operating Procedures are followed. Detailed laboratory methods with quality assurance and quality control procedures are described in the Central Laboratory Standard Operating Procedure (MWRA 2009). Table 2-2 lists the analytes measured and methods used in the monitoring program.
7
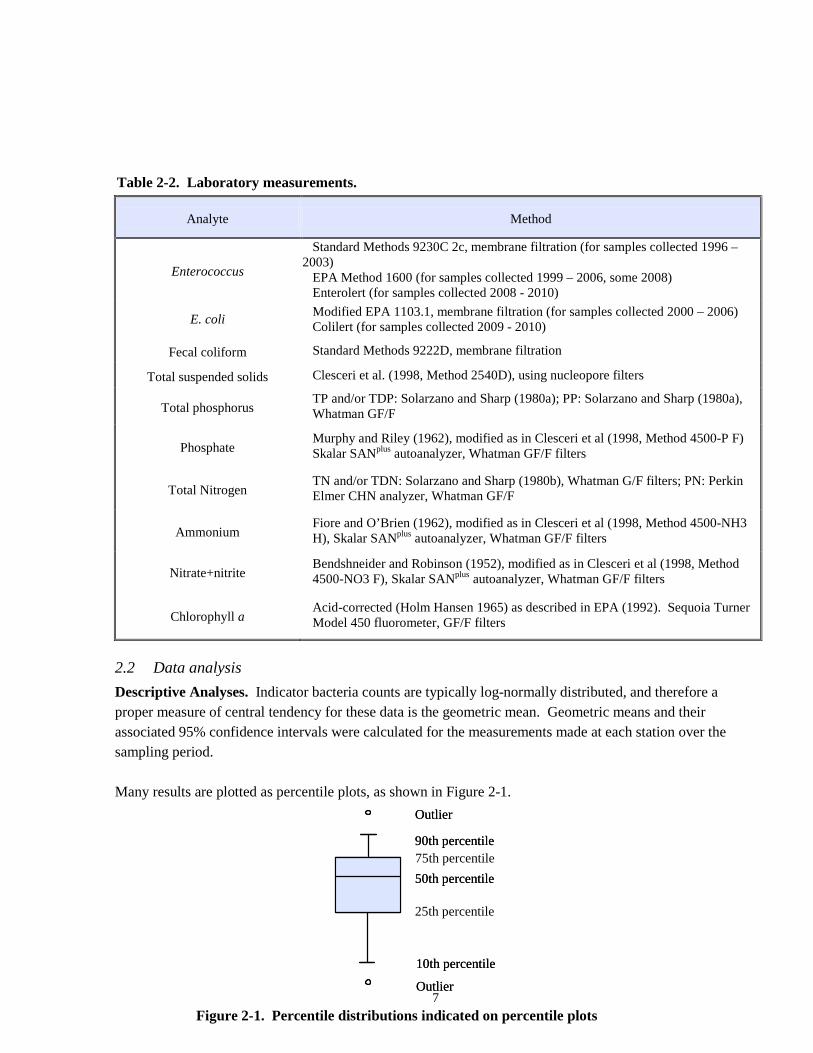
Table 2-2. Laboratory measurements.
Analyte Method
Enterococcus
Standard Methods 9230C 2c, membrane filtration (for samples collected 1996 – 2003)
EPA Method 1600 (for samples collected 1999 – 2006, some 2008) Enterolert (for samples collected 2008 - 2010)
E. coli Modified EPA 1103.1, membrane filtration (for samples collected 2000 – 2006) Colilert (for samples collected 2009 - 2010)
Fecal coliform Standard Methods 9222D, membrane filtration
Total suspended solids Clesceri et al. (1998, Method 2540D), using nucleopore filters
Total phosphorus TP and/or TDP: Solarzano and Sharp (1980a); PP: Solarzano and Sharp (1980a), Whatman GF/F
Phosphate Murphy and Riley (1962), modified as in Clesceri et al (1998, Method 4500-P F) Skalar SANplus autoanalyzer, Whatman GF/F filters
Total Nitrogen TN and/or TDN: Solarzano and Sharp (1980b), Whatman G/F filters; PN: Perkin Elmer CHN analyzer, Whatman GF/F
Ammonium Fiore and O’Brien (1962), modified as in Clesceri et al (1998, Method 4500-NH3 H), Skalar SANplus autoanalyzer, Whatman GF/F filters
Nitrate+nitrite Bendshneider and Robinson (1952), modified as in Clesceri et al (1998, Method 4500-NO3 F), Skalar SANplus autoanalyzer, Whatman GF/F filters
Chlorophyll a Acid-corrected (Holm Hansen 1965) as described in EPA (1992). Sequoia Turner Model 450 fluorometer, GF/F filters
2.2 Data analysis Descriptive Analyses. Indicator bacteria counts are typically log-normally distributed, and therefore a proper measure of central tendency for these data is the geometric mean. Geometric means and their associated 95% confidence intervals were calculated for the measurements made at each station over the sampling period. Many results are plotted as percentile plots, as shown in Figure 2-1.
Figure 2-1. Percentile distributions indicated on percentile plots
Outlier
50th percentile
10th percentile
Outlier
90th percentile
25th percentile
Outlier
50th percentile
10th percentile
Outlier
90th percentile 75th percentile
8
These plots present a frequency distribution of a group of measurements. Each box comprises measurements from a single beach or sampling location. Values are shown in Figure 2-1 for the 10th, 25th, 50th, 75th, and 90th percentiles. Single measurements beyond these ranges (outliers) are displayed as dots. Box plots display the range and central tendencies of the data allow for easy comparison of the results among stations. The 50th percentile (median) is equivalent to the geometric mean, assuming the data are log-normally distributed.
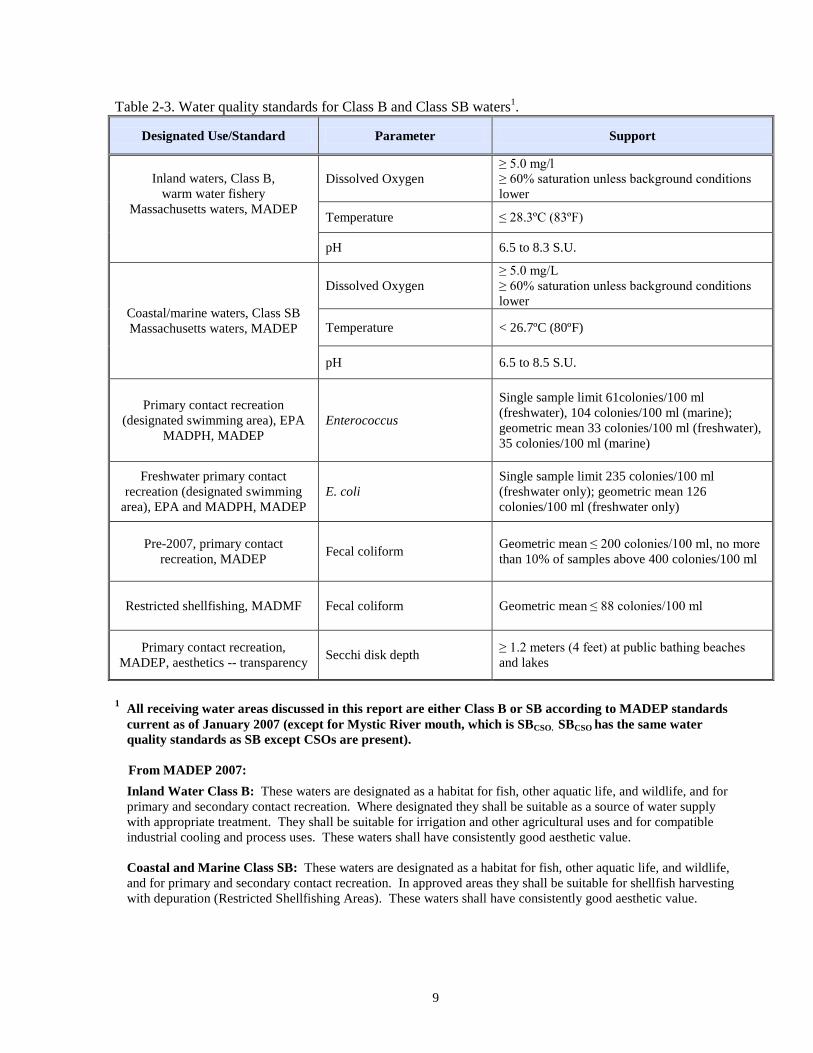
2.3 Water Quality Standards used in this report Standards are shown in Table 2-6, and include standards and guidelines from the Massachusetts Department of Environmental Protection (MADEP), Environmental Protection Agency (EPA), Massachusetts Department of Public Health (MADPH), and the Massachusetts Division of Marine Fisheries (MADMF). The MADEP standard for Class SB waters (fishable swimmable) are based on E. coli and/or Enterococcus counts for freshwater, and Enterococcus counts for marine waters, following a USEPA recommendation for Enterococcus in marine waters (USEPA 1986). The Massachusetts Department of Public Health issued regulations for beach management based on the USEPA criteria. MADMF uses fecal coliform to monitor shellfish growing waters.
9
Table 2-3. Water quality standards for Class B and Class SB waters1.
Designated Use/Standard Parameter Support
Inland waters, Class B, warm water fishery
Massachusetts waters, MADEP
Dissolved Oxygen ≥ 5.0 mg/l ≥ 60% saturation unless background conditions lower
Temperature ≤ 28.3ºC (83ºF)
pH 6.5 to 8.3 S.U.
Coastal/marine waters, Class SB Massachusetts waters, MADEP
Dissolved Oxygen ≥ 5.0 mg/L ≥ 60% saturation unless background conditions lower
Temperature < 26.7ºC (80ºF)
pH 6.5 to 8.5 S.U.
Primary contact recreation (designated swimming area), EPA
MADPH, MADEP Enterococcus
Single sample limit 61colonies/100 ml (freshwater), 104 colonies/100 ml (marine); geometric mean 33 colonies/100 ml (freshwater), 35 colonies/100 ml (marine)
Freshwater primary contact recreation (designated swimming
area), EPA and MADPH, MADEP E. coli
Single sample limit 235 colonies/100 ml (freshwater only); geometric mean 126 colonies/100 ml (freshwater only)
Pre-2007, primary contact recreation, MADEP Fecal coliform Geometric mean ≤ 200 colonies/100 ml, no more
than 10% of samples above 400 colonies/100 ml
Restricted shellfishing, MADMF Fecal coliform Geometric mean ≤ 88 colonies/100 ml
Primary contact recreation, MADEP, aesthetics -- transparency Secchi disk depth ≥ 1.2 meters (4 feet) at public bathing beaches
and lakes
1 All receiving water areas discussed in this report are either Class B or SB according to MADEP standards current as of January 2007 (except for Mystic River mouth, which is SBCSO. SBCSO has the same water quality standards as SB except CSOs are present).
From MADEP 2007:
Inland Water Class B: These waters are designated as a habitat for fish, other aquatic life, and wildlife, and for primary and secondary contact recreation. Where designated they shall be suitable as a source of water supply with appropriate treatment. They shall be suitable for irrigation and other agricultural uses and for compatible industrial cooling and process uses. These waters shall have consistently good aesthetic value. Coastal and Marine Class SB: These waters are designated as a habitat for fish, other aquatic life, and wildlife, and for primary and secondary contact recreation. In approved areas they shall be suitable for shellfish harvesting with depuration (Restricted Shellfishing Areas). These waters shall have consistently good aesthetic value.
10
3 Results: Charles River
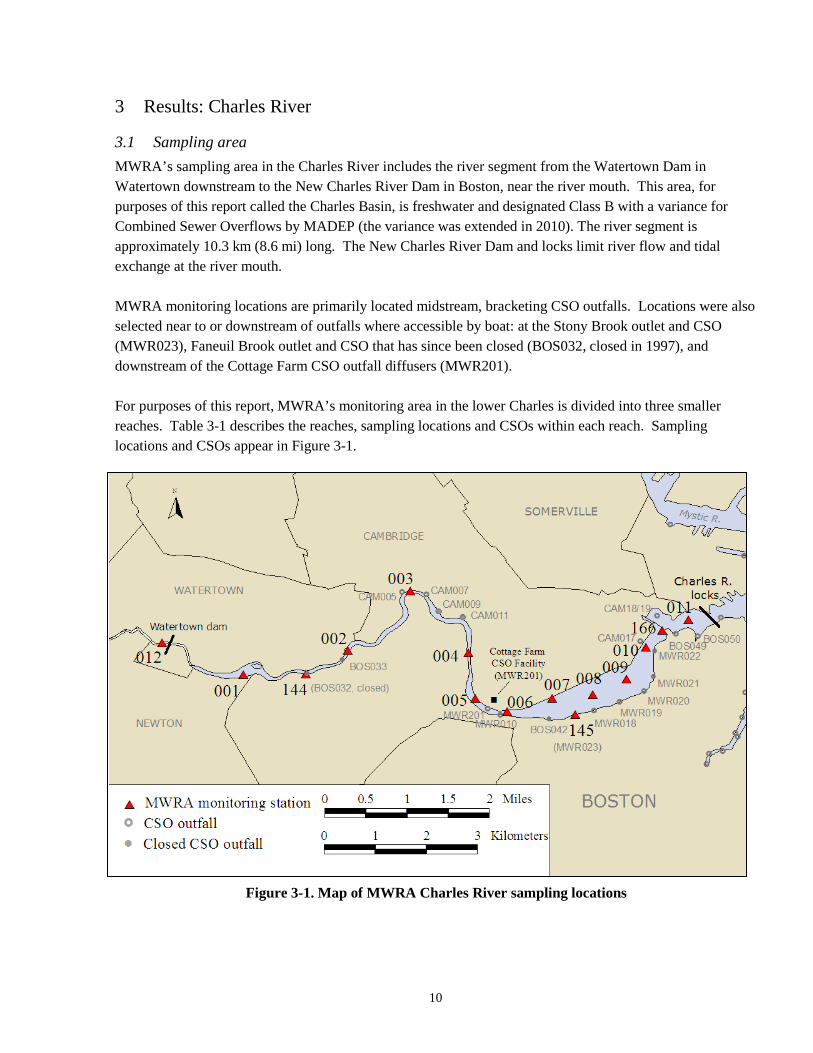
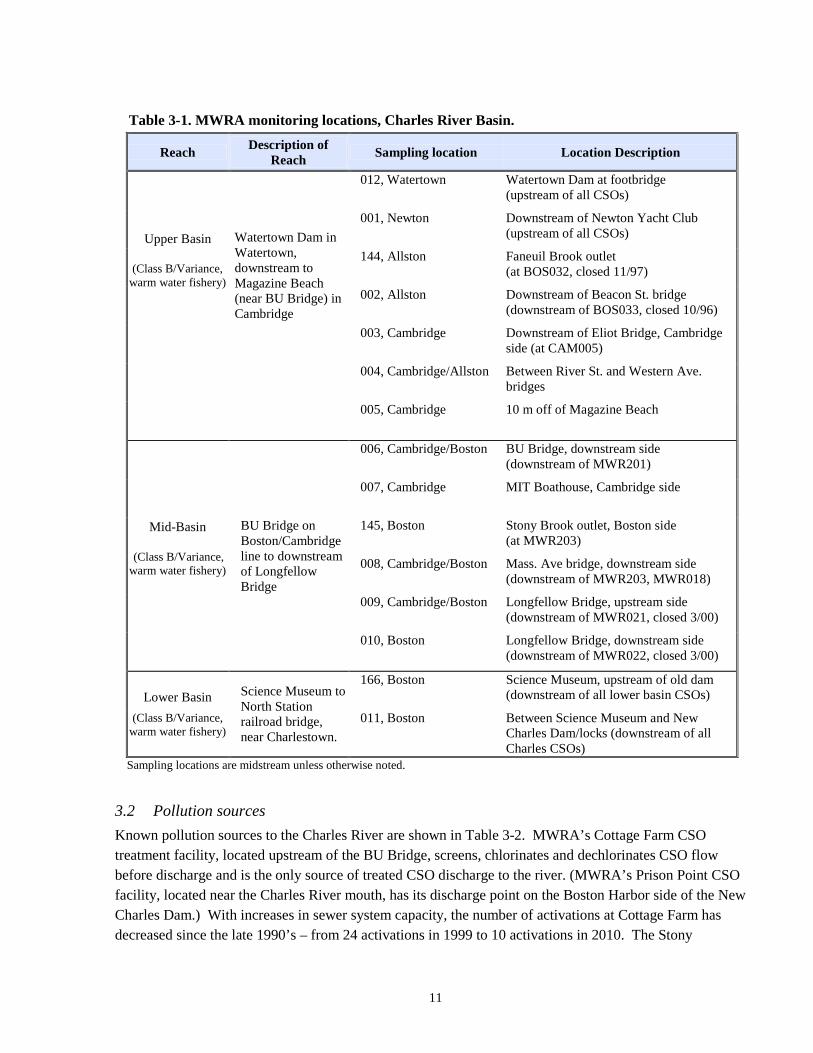
3.1 Sampling area MWRA’s sampling area in the Charles River includes the river segment from the Watertown Dam in Watertown downstream to the New Charles River Dam in Boston, near the river mouth. This area, for purposes of this report called the Charles Basin, is freshwater and designated Class B with a variance for Combined Sewer Overflows by MADEP (the variance was extended in 2010). The river segment is approximately 10.3 km (8.6 mi) long. The New Charles River Dam and locks limit river flow and tidal exchange at the river mouth. MWRA monitoring locations are primarily located midstream, bracketing CSO outfalls. Locations were also selected near to or downstream of outfalls where accessible by boat: at the Stony Brook outlet and CSO (MWR023), Faneuil Brook outlet and CSO that has since been closed (BOS032, closed in 1997), and downstream of the Cottage Farm CSO outfall diffusers (MWR201). For purposes of this report, MWRA’s monitoring area in the lower Charles is divided into three smaller reaches. Table 3-1 describes the reaches, sampling locations and CSOs within each reach. Sampling locations and CSOs appear in Figure 3-1.
Figure 3-1. Map of MWRA Charles River sampling locations
11
Table 3-1. MWRA monitoring locations, Charles River Basin.
Reach Description of Reach Sampling location Location Description
Upper Basin
(Class B/Variance, warm water fishery)
Watertown Dam in Watertown, downstream to Magazine Beach (near BU Bridge) in Cambridge
012, Watertown Watertown Dam at footbridge (upstream of all CSOs)
001, Newton Downstream of Newton Yacht Club (upstream of all CSOs)
144, Allston Faneuil Brook outlet (at BOS032, closed 11/97)
002, Allston Downstream of Beacon St. bridge (downstream of BOS033, closed 10/96)
003, Cambridge Downstream of Eliot Bridge, Cambridge side (at CAM005)
004, Cambridge/Allston Between River St. and Western Ave. bridges
005, Cambridge 10 m off of Magazine Beach
Mid-Basin
(Class B/Variance, warm water fishery)
BU Bridge on Boston/Cambridge line to downstream of Longfellow Bridge
006, Cambridge/Boston BU Bridge, downstream side (downstream of MWR201)
007, Cambridge MIT Boathouse, Cambridge side
145, Boston Stony Brook outlet, Boston side (at MWR203)
008, Cambridge/Boston Mass. Ave bridge, downstream side (downstream of MWR203, MWR018)
009, Cambridge/Boston Longfellow Bridge, upstream side (downstream of MWR021, closed 3/00)
010, Boston Longfellow Bridge, downstream side (downstream of MWR022, closed 3/00)
Lower Basin
(Class B/Variance, warm water fishery)
Science Museum to North Station railroad bridge, near Charlestown.
166, Boston Science Museum, upstream of old dam (downstream of all lower basin CSOs)
011, Boston Between Science Museum and New Charles Dam/locks (downstream of all Charles CSOs)
Sampling locations are midstream unless otherwise noted.
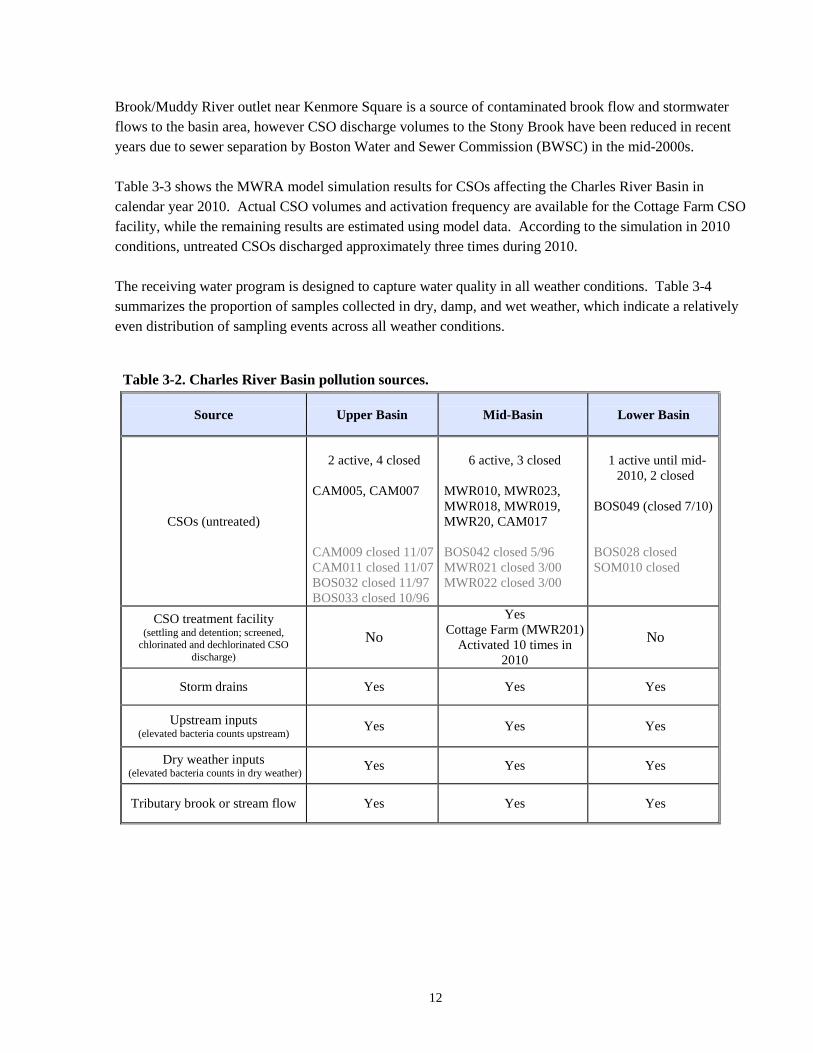
3.2 Pollution sources Known pollution sources to the Charles River are shown in Table 3-2. MWRA’s Cottage Farm CSO treatment facility, located upstream of the BU Bridge, screens, chlorinates and dechlorinates CSO flow before discharge and is the only source of treated CSO discharge to the river. (MWRA’s Prison Point CSO facility, located near the Charles River mouth, has its discharge point on the Boston Harbor side of the New Charles Dam.) With increases in sewer system capacity, the number of activations at Cottage Farm has decreased since the late 1990’s – from 24 activations in 1999 to 10 activations in 2010. The Stony
12
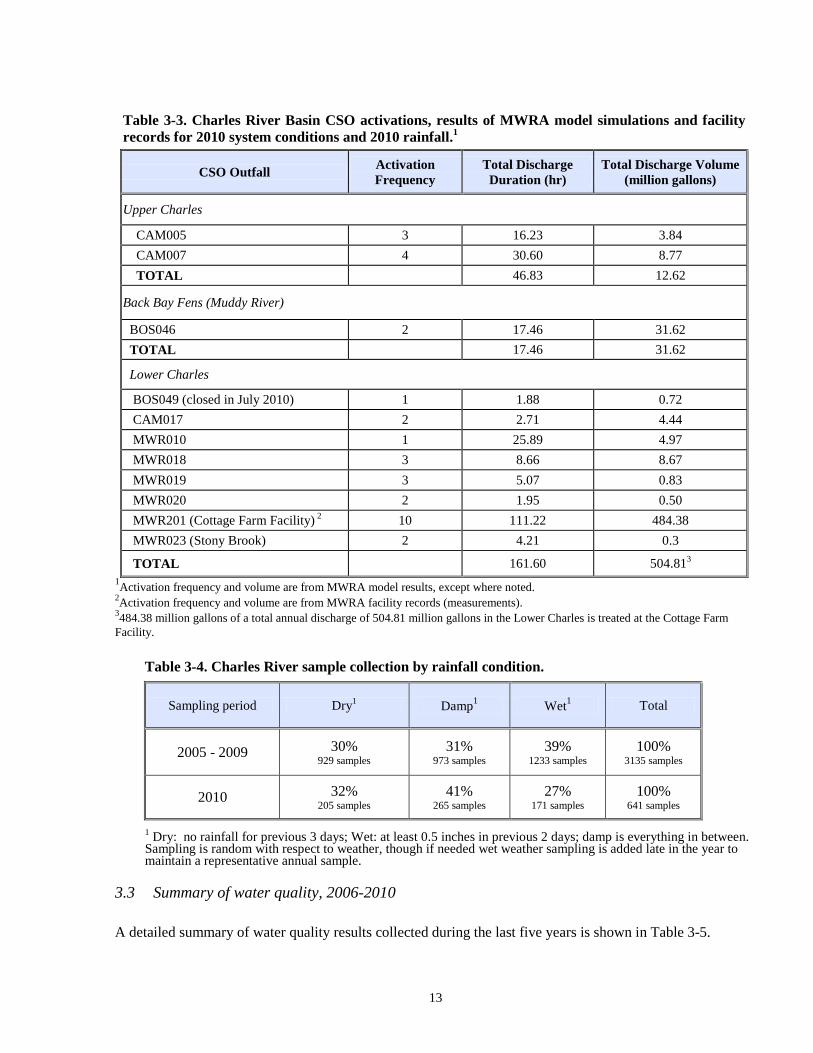
Brook/Muddy River outlet near Kenmore Square is a source of contaminated brook flow and stormwater flows to the basin area, however CSO discharge volumes to the Stony Brook have been reduced in recent years due to sewer separation by Boston Water and Sewer Commission (BWSC) in the mid-2000s. Table 3-3 shows the MWRA model simulation results for CSOs affecting the Charles River Basin in calendar year 2010. Actual CSO volumes and activation frequency are available for the Cottage Farm CSO facility, while the remaining results are estimated using model data. According to the simulation in 2010 conditions, untreated CSOs discharged approximately three times during 2010. The receiving water program is designed to capture water quality in all weather conditions. Table 3-4 summarizes the proportion of samples collected in dry, damp, and wet weather, which indicate a relatively even distribution of sampling events across all weather conditions.
Table 3-2. Charles River Basin pollution sources.
Source Upper Basin Mid-Basin Lower Basin
CSOs (untreated)
2 active, 4 closed
CAM005, CAM007 CAM009 closed 11/07 CAM011 closed 11/07 BOS032 closed 11/97 BOS033 closed 10/96
6 active, 3 closed
MWR010, MWR023, MWR018, MWR019, MWR20, CAM017 BOS042 closed 5/96 MWR021 closed 3/00 MWR022 closed 3/00
1 active until mid-
2010, 2 closed BOS049 (closed 7/10) BOS028 closed SOM010 closed
CSO treatment facility (settling and detention; screened,
chlorinated and dechlorinated CSO discharge)
No Yes
Cottage Farm (MWR201) Activated 10 times in
2010
No
Storm drains Yes Yes Yes
Upstream inputs (elevated bacteria counts upstream) Yes Yes Yes
Dry weather inputs (elevated bacteria counts in dry weather) Yes Yes Yes
Tributary brook or stream flow Yes Yes Yes
13
Table 3-3. Charles River Basin CSO activations, results of MWRA model simulations and facility records for 2010 system conditions and 2010 rainfall.1
CSO Outfall Activation Frequency
Total Discharge Duration (hr)
Total Discharge Volume (million gallons)
Upper Charles
CAM005 3 16.23 3.84 CAM007 4 30.60 8.77 TOTAL 46.83 12.62
Back Bay Fens (Muddy River)
BOS046 2 17.46 31.62 TOTAL 17.46 31.62
Lower Charles
BOS049 (closed in July 2010) 1 1.88 0.72 CAM017 2 2.71 4.44 MWR010 1 25.89 4.97 MWR018 3 8.66 8.67 MWR019 3 5.07 0.83 MWR020 2 1.95 0.50 MWR201 (Cottage Farm Facility) 2 10 111.22 484.38 MWR023 (Stony Brook) 2 4.21 0.3
TOTAL 161.60 504.813 1Activation frequency and volume are from MWRA model results, except where noted. 2Activation frequency and volume are from MWRA facility records (measurements). 3484.38 million gallons of a total annual discharge of 504.81 million gallons in the Lower Charles is treated at the Cottage Farm Facility.
1 Dry: no rainfall for previous 3 days; Wet: at least 0.5 inches in previous 2 days; damp is everything in between. Sampling is random with respect to weather, though if needed wet weather sampling is added late in the year to maintain a representative annual sample.
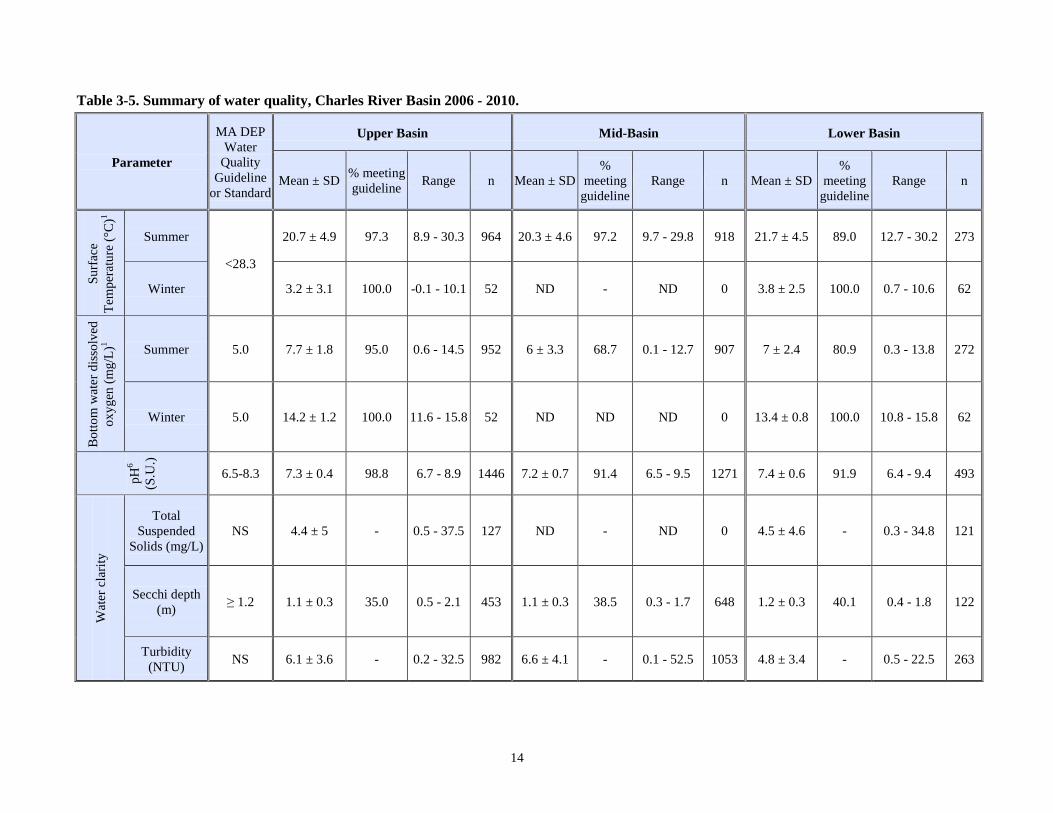
3.3 Summary of water quality, 2006-2010 A detailed summary of water quality results collected during the last five years is shown in Table 3-5.
Table 3-4. Charles River sample collection by rainfall condition.
Sampling period Dry1 Damp1 Wet1 Total
2005 - 2009 30% 929 samples
31% 973 samples
39% 1233 samples
100% 3135 samples
2010 32% 205 samples
41% 265 samples
27% 171 samples
100% 641 samples
14
Table 3-5. Summary of water quality, Charles River Basin 2006 - 2010.
Parameter
MA DEP Water
Quality Guideline
or Standard
Upper Basin Mid-Basin Lower Basin
Mean ± SD % meeting guideline Range n Mean ± SD
% meeting
guideline Range n Mean ± SD
% meeting
guideline Range n
Surf
ace
Tem
pera
ture
(°C
)1
Summer
<28.3
20.7 ± 4.9 97.3 8.9 - 30.3 964 20.3 ± 4.6 97.2 9.7 - 29.8 918 21.7 ± 4.5 89.0 12.7 - 30.2 273
Winter 3.2 ± 3.1 100.0 -0.1 - 10.1 52 ND - ND 0 3.8 ± 2.5 100.0 0.7 - 10.6 62
Bot
tom
wat
er d
isso
lved
ox
ygen
(mg/
L)1
Summer 5.0 7.7 ± 1.8 95.0 0.6 - 14.5 952 6 ± 3.3 68.7 0.1 - 12.7 907 7 ± 2.4 80.9 0.3 - 13.8 272
Winter 5.0 14.2 ± 1.2 100.0 11.6 - 15.8 52 ND ND ND 0 13.4 ± 0.8 100.0 10.8 - 15.8 62
pH6
(S.U
.)
6.5-8.3 7.3 ± 0.4 98.8 6.7 - 8.9 1446 7.2 ± 0.7 91.4 6.5 - 9.5 1271 7.4 ± 0.6 91.9 6.4 - 9.4 493
Wat
er c
larit
y
Total Suspended
Solids (mg/L) NS 4.4 ± 5 - 0.5 - 37.5 127 ND - ND 0 4.5 ± 4.6 - 0.3 - 34.8 121
Secchi depth (m) ≥ 1.2 1.1 ± 0.3 35.0 0.5 - 2.1 453 1.1 ± 0.3 38.5 0.3 - 1.7 648 1.2 ± 0.3 40.1 0.4 - 1.8 122
Turbidity (NTU) NS 6.1 ± 3.6 - 0.2 - 32.5 982 6.6 ± 4.1 - 0.1 - 52.5 1053 4.8 ± 3.4 - 0.5 - 22.5 263
15
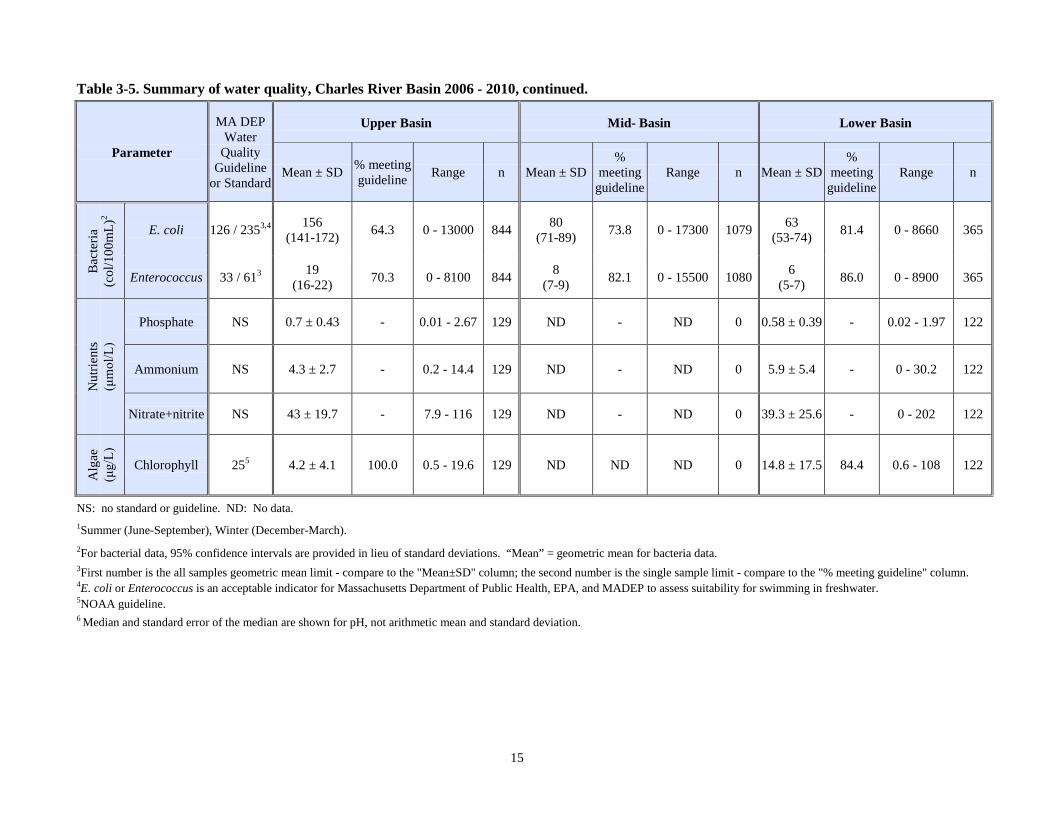
Table 3-5. Summary of water quality, Charles River Basin 2006 - 2010, continued.
Parameter
MA DEP Water
Quality Guideline
or Standard
Upper Basin Mid- Basin Lower Basin
Mean ± SD % meeting guideline Range n Mean ± SD
% meeting
guideline Range n Mean ± SD
% meeting
guideline Range n
Bac
teria
(col
/100
mL)
2
E. coli 126 / 2353,4 156 (141-172) 64.3 0 - 13000 844 80
(71-89) 73.8 0 - 17300 1079 63 (53-74) 81.4 0 - 8660 365
Enterococcus 33 / 613 19 (16-22) 70.3 0 - 8100 844 8
(7-9) 82.1 0 - 15500 1080 6 (5-7) 86.0 0 - 8900 365
Nut
rient
s
(μ
mol
/L)
Phosphate NS 0.7 ± 0.43 - 0.01 - 2.67 129 ND - ND 0 0.58 ± 0.39 - 0.02 - 1.97 122
Ammonium NS 4.3 ± 2.7 - 0.2 - 14.4 129 ND - ND 0 5.9 ± 5.4 - 0 - 30.2 122
Nitrate+nitrite NS 43 ± 19.7 - 7.9 - 116 129 ND - ND 0 39.3 ± 25.6 - 0 - 202 122
Alg
ae
(μ
g/L)
Chlorophyll 255 4.2 ± 4.1 100.0 0.5 - 19.6 129 ND ND ND 0 14.8 ± 17.5 84.4 0.6 - 108 122
NS: no standard or guideline. ND: No data. 1Summer (June-September), Winter (December-March). 2For bacterial data, 95% confidence intervals are provided in lieu of standard deviations. “Mean” = geometric mean for bacteria data. 3First number is the all samples geometric mean limit - compare to the "Mean±SD" column; the second number is the single sample limit - compare to the "% meeting guideline" column. 4E. coli or Enterococcus is an acceptable indicator for Massachusetts Department of Public Health, EPA, and MADEP to assess suitability for swimming in freshwater. 5NOAA guideline. 6 Median and standard error of the median are shown for pH, not arithmetic mean and standard deviation.
16
3.4 Trends in water quality, 2010 This section provides an analysis of trends for water quality parameters measured in the lower Charles in the 2010 monitoring year.
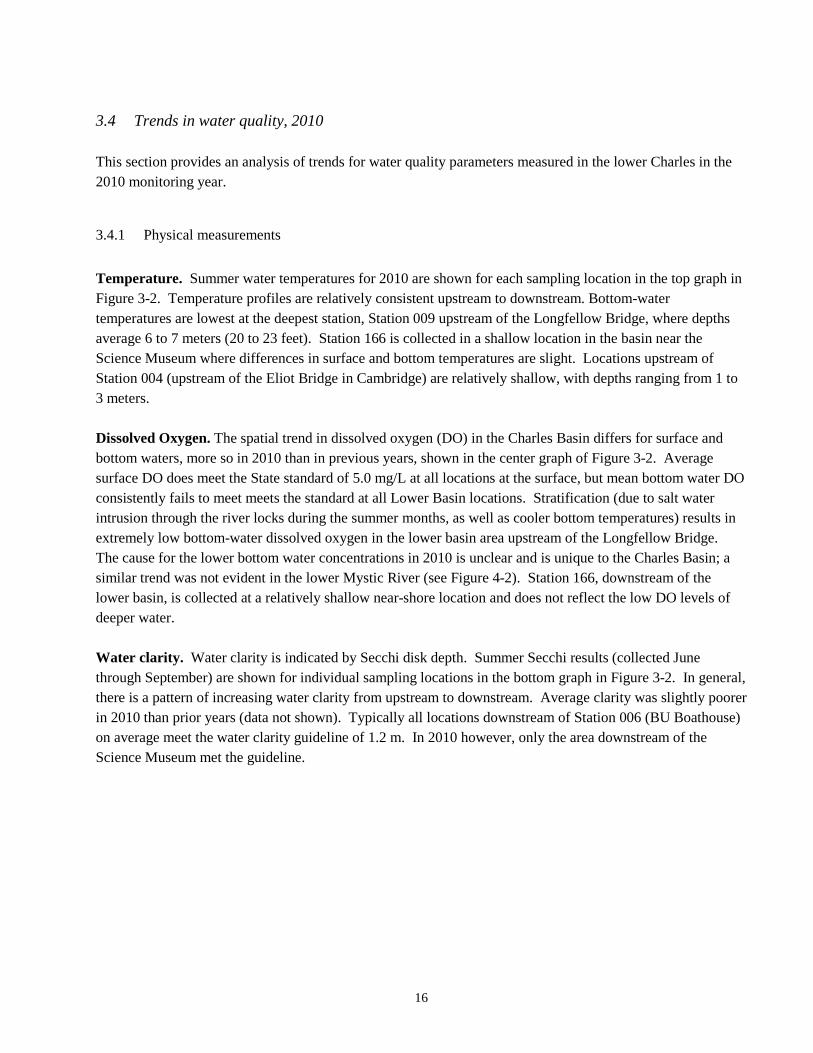
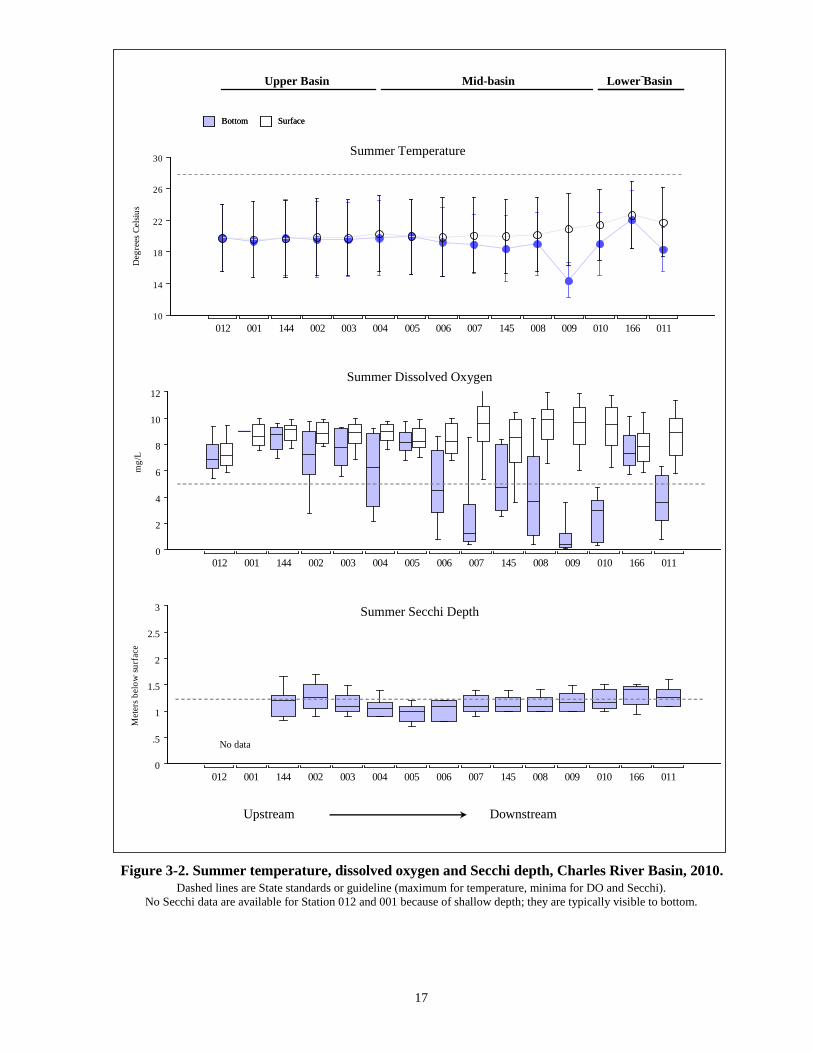
3.4.1 Physical measurements Temperature. Summer water temperatures for 2010 are shown for each sampling location in the top graph in Figure 3-2. Temperature profiles are relatively consistent upstream to downstream. Bottom-water temperatures are lowest at the deepest station, Station 009 upstream of the Longfellow Bridge, where depths average 6 to 7 meters (20 to 23 feet). Station 166 is collected in a shallow location in the basin near the Science Museum where differences in surface and bottom temperatures are slight. Locations upstream of Station 004 (upstream of the Eliot Bridge in Cambridge) are relatively shallow, with depths ranging from 1 to 3 meters. Dissolved Oxygen. The spatial trend in dissolved oxygen (DO) in the Charles Basin differs for surface and bottom waters, more so in 2010 than in previous years, shown in the center graph of Figure 3-2. Average surface DO does meet the State standard of 5.0 mg/L at all locations at the surface, but mean bottom water DO consistently fails to meet meets the standard at all Lower Basin locations. Stratification (due to salt water intrusion through the river locks during the summer months, as well as cooler bottom temperatures) results in extremely low bottom-water dissolved oxygen in the lower basin area upstream of the Longfellow Bridge. The cause for the lower bottom water concentrations in 2010 is unclear and is unique to the Charles Basin; a similar trend was not evident in the lower Mystic River (see Figure 4-2). Station 166, downstream of the lower basin, is collected at a relatively shallow near-shore location and does not reflect the low DO levels of deeper water. Water clarity. Water clarity is indicated by Secchi disk depth. Summer Secchi results (collected June through September) are shown for individual sampling locations in the bottom graph in Figure 3-2. In general, there is a pattern of increasing water clarity from upstream to downstream. Average clarity was slightly poorer in 2010 than prior years (data not shown). Typically all locations downstream of Station 006 (BU Boathouse) on average meet the water clarity guideline of 1.2 m. In 2010 however, only the area downstream of the Science Museum met the guideline.
17
Figure 3-2. Summer temperature, dissolved oxygen and Secchi depth, Charles River Basin, 2010. Dashed lines are State standards or guideline (maximum for temperature, minima for DO and Secchi).
No Secchi data are available for Station 012 and 001 because of shallow depth; they are typically visible to bottom.
0
.5
1
1.5
2
2.5
3
Met
ers b
elow
surf
ace
012 001 144 002 003 004 005 006 007 145 008 009 010 166 011
10
14
18
22
26
30
Deg
rees
Cel
sius
012 001 144 002 003 004 005 006 007 145 008 009 010 166 011
SB
0
2
4
6
8
10
12
mg/
L
012 001 144 002 003 004 005 006 007 145 008 009 010 166 011
Upstream Downstream Upstream Downstream
Summer Temperature
Summer Dissolved Oxygen
Summer Secchi Depth
Upper Basin Mid-basin Lower Basin
No data
SurfaceBottom SurfaceBottom
18
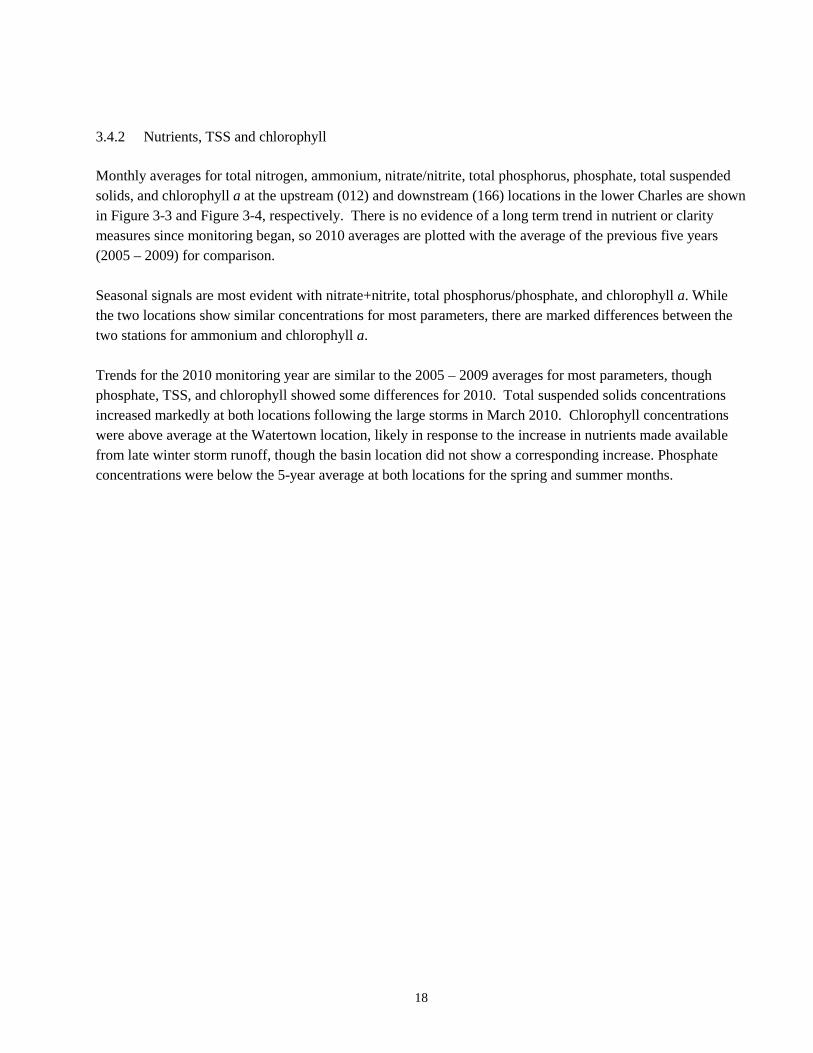
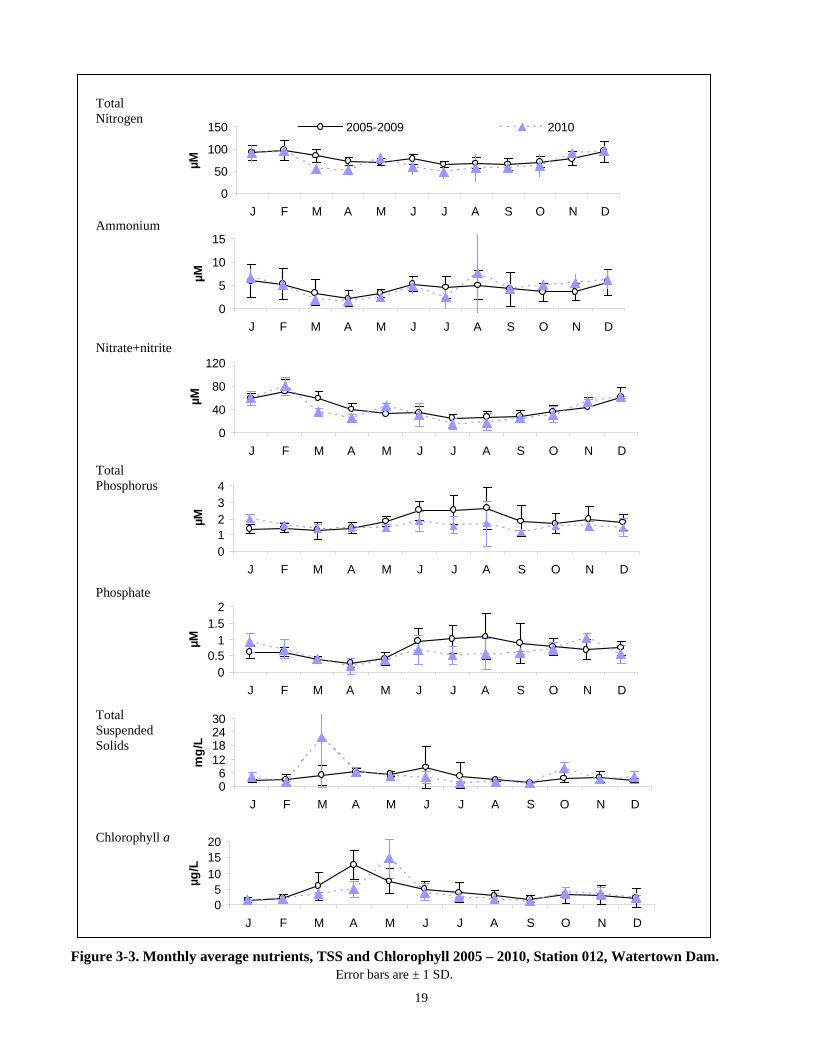
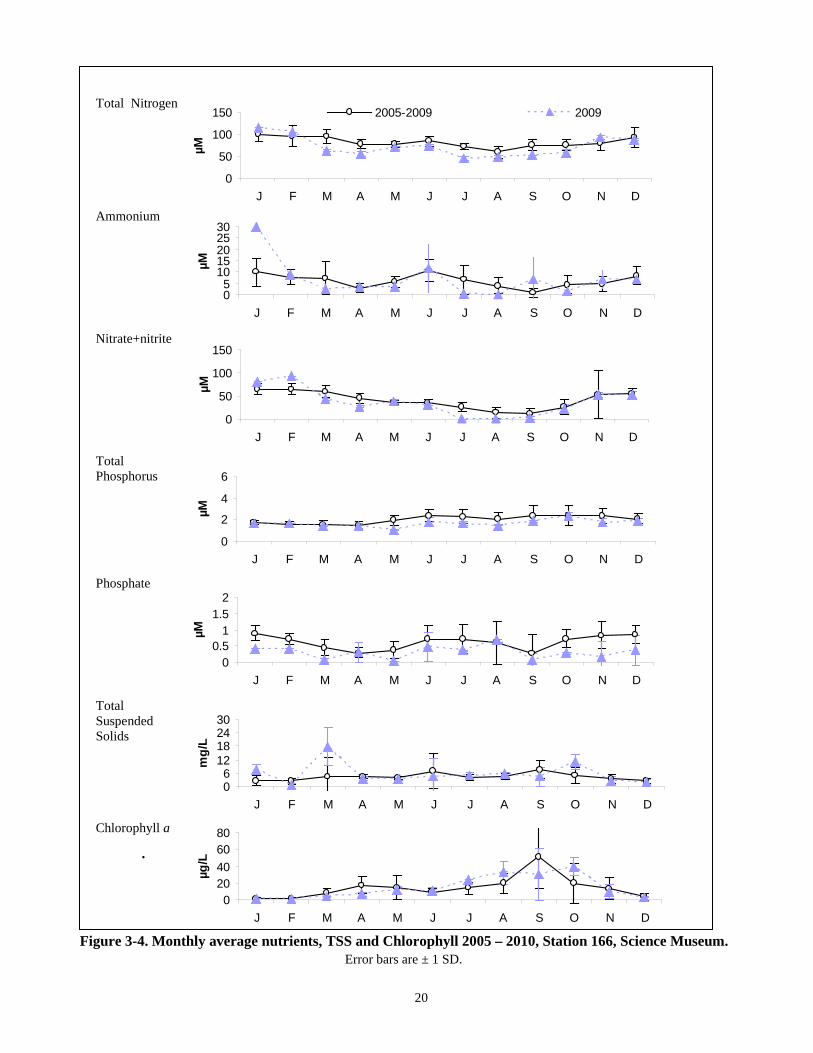
3.4.2 Nutrients, TSS and chlorophyll Monthly averages for total nitrogen, ammonium, nitrate/nitrite, total phosphorus, phosphate, total suspended solids, and chlorophyll a at the upstream (012) and downstream (166) locations in the lower Charles are shown in Figure 3-3 and Figure 3-4, respectively. There is no evidence of a long term trend in nutrient or clarity measures since monitoring began, so 2010 averages are plotted with the average of the previous five years (2005 – 2009) for comparison. Seasonal signals are most evident with nitrate+nitrite, total phosphorus/phosphate, and chlorophyll a. While the two locations show similar concentrations for most parameters, there are marked differences between the two stations for ammonium and chlorophyll a. Trends for the 2010 monitoring year are similar to the 2005 – 2009 averages for most parameters, though phosphate, TSS, and chlorophyll showed some differences for 2010. Total suspended solids concentrations increased markedly at both locations following the large storms in March 2010. Chlorophyll concentrations were above average at the Watertown location, likely in response to the increase in nutrients made available from late winter storm runoff, though the basin location did not show a corresponding increase. Phosphate concentrations were below the 5-year average at both locations for the spring and summer months.
19
Total Nitrogen
Ammonium
Nitrate+nitrite
Total Phosphorus
Phosphate
Total Suspended Solids
Chlorophyll a
Figure 3-3. Monthly average nutrients, TSS and Chlorophyll 2005 – 2010, Station 012, Watertown Dam. Error bars are ± 1 SD.
0
40
80
120
J F M A M J J A S O N D
µM
01234
J F M A M J J A S O N D
µM
00.5
11.5
2
J F M A M J J A S O N D
µM
06
12182430
J F M A M J J A S O N D
mg/
L
05
101520
J F M A M J J A S O N D
µg/L
0
50
100
150
J F M A M J J A S O N DµM
2005-2009 2010
0
5
10
15
J F M A M J J A S O N D
µM
20
Total Nitrogen
Ammonium
Nitrate+nitrite
Total Phosphorus
Phosphate
Total Suspended Solids
Chlorophyll a
.
Figure 3-4. Monthly average nutrients, TSS and Chlorophyll 2005 – 2010, Station 166, Science Museum. Error bars are ± 1 SD.
0
50
100
150
J F M A M J J A S O N D
µM
0
2
4
6
J F M A M J J A S O N D
µM
00.5
11.5
2
J F M A M J J A S O N D
µM
06
12182430
J F M A M J J A S O N D
mg/
L
020406080
J F M A M J J A S O N D
µg/L
0
50
100
150
J F M A M J J A S O N DµM
2005-2009 2009
05
1015202530
J F M A M J J A S O N D
µM
21
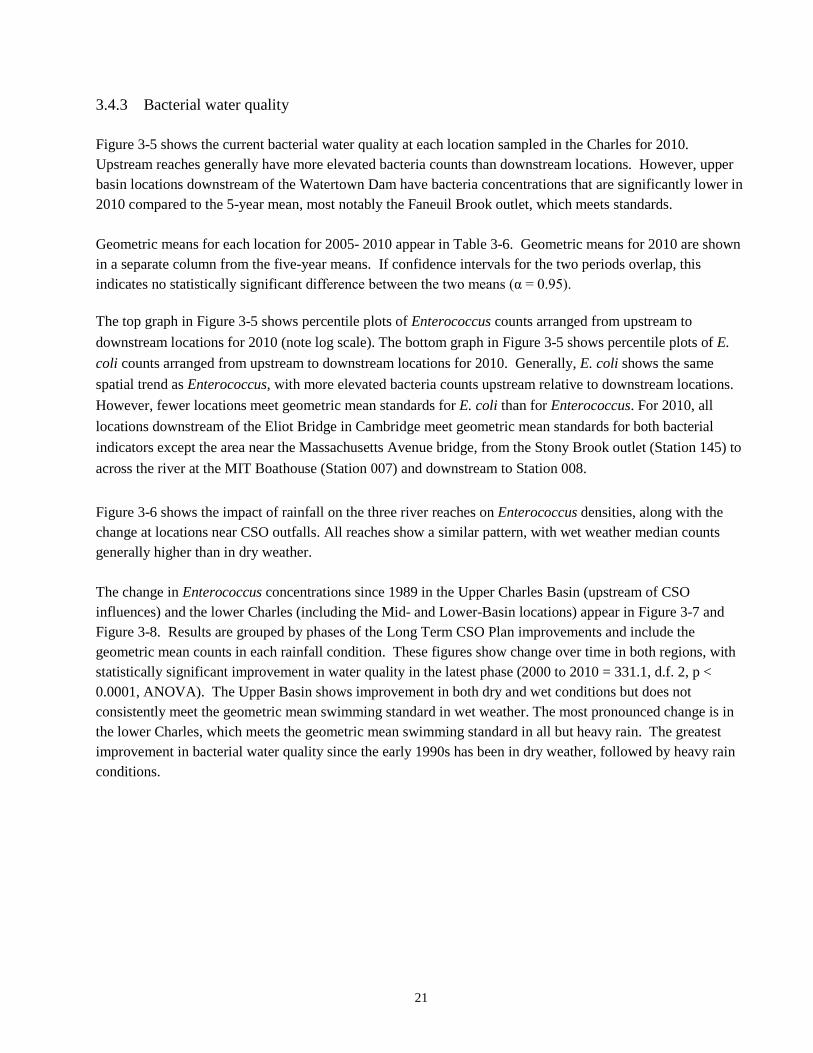
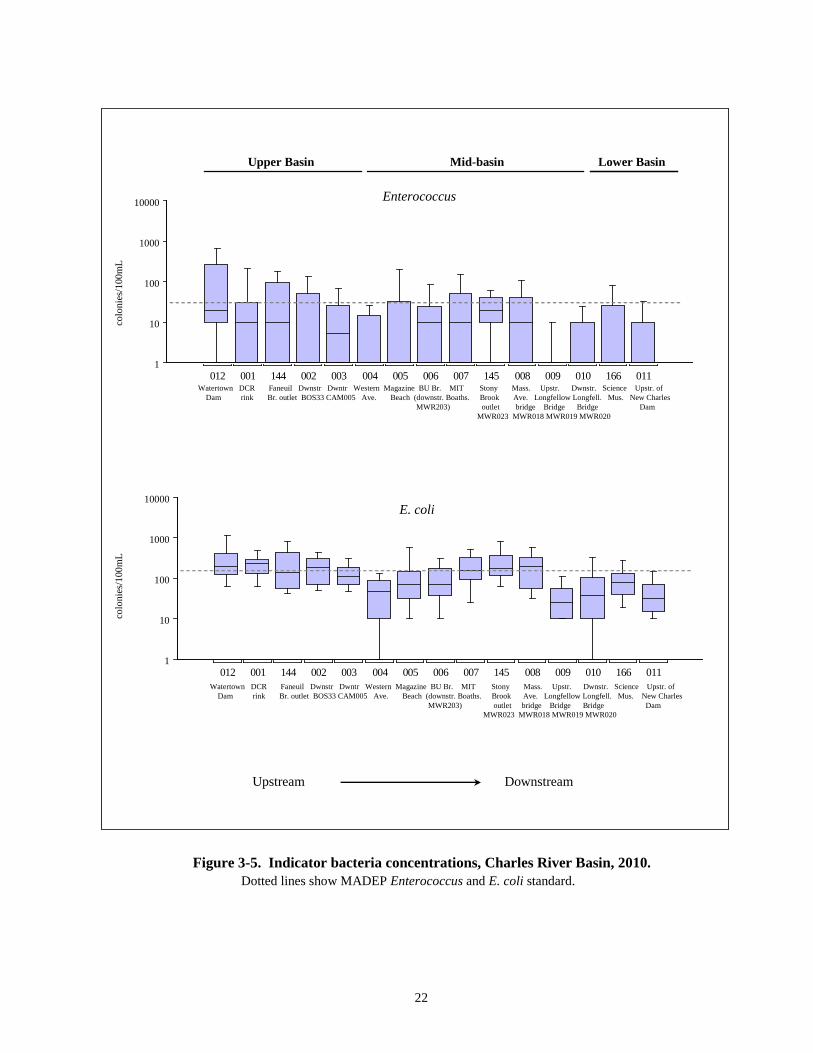
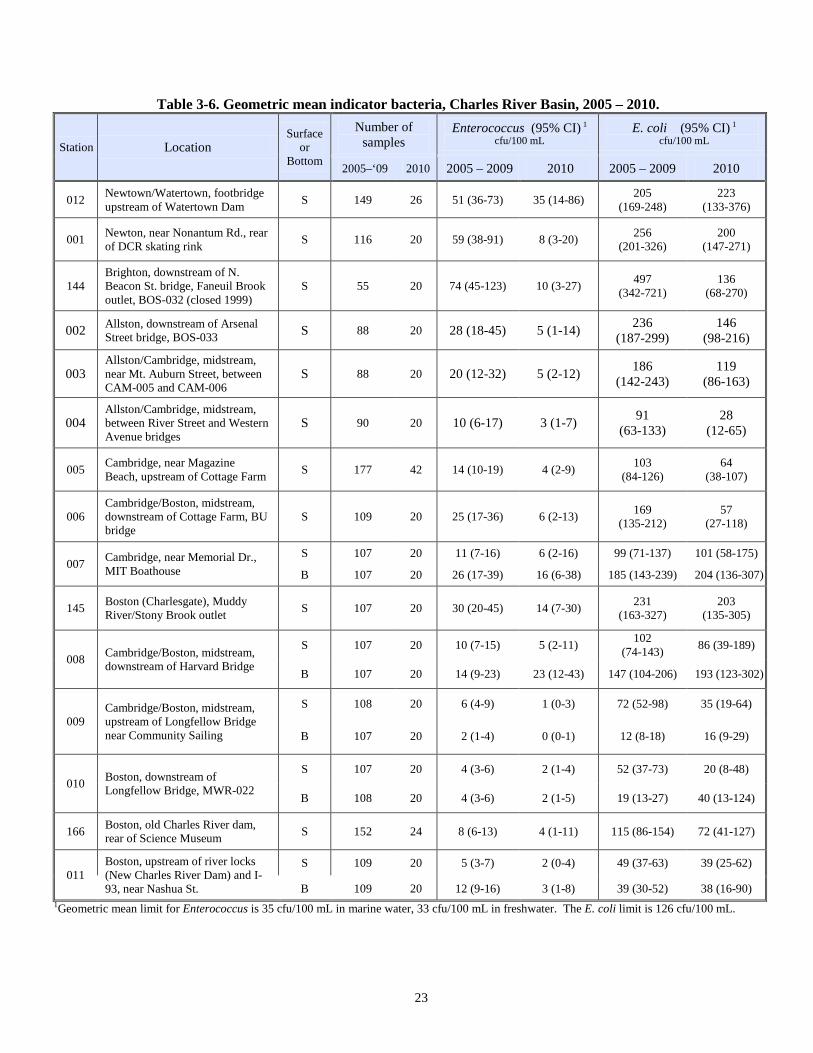
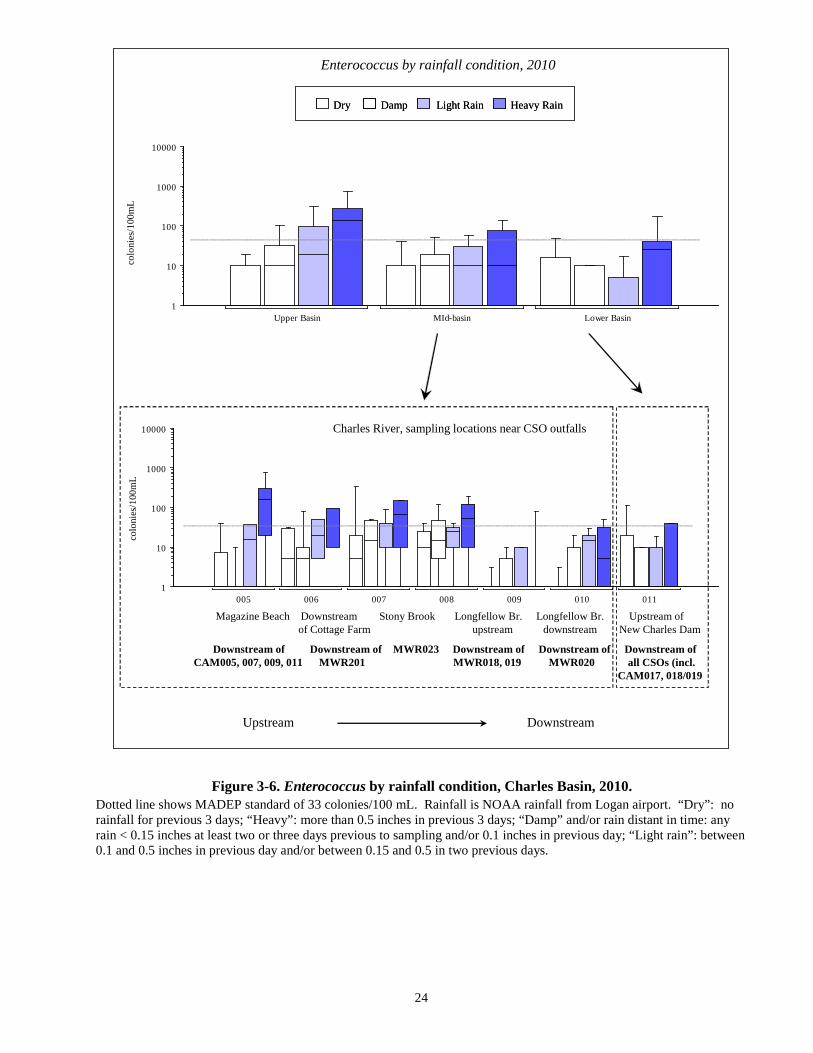
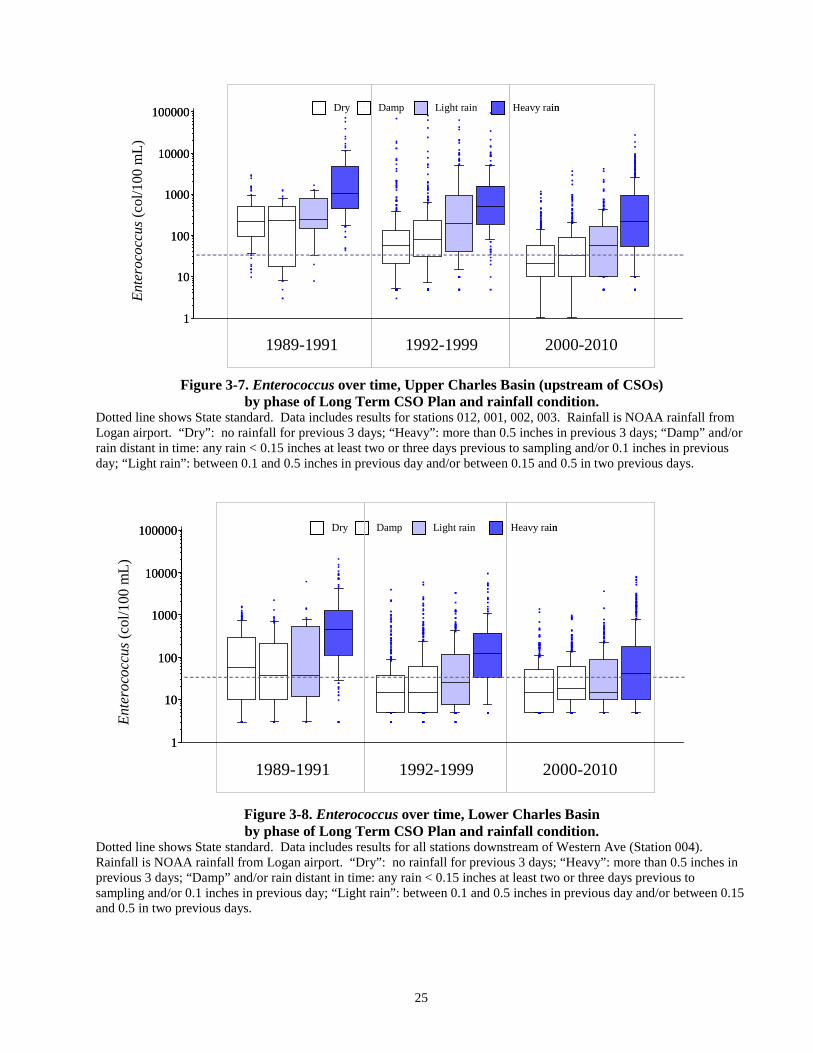
3.4.3 Bacterial water quality Figure 3-5 shows the current bacterial water quality at each location sampled in the Charles for 2010. Upstream reaches generally have more elevated bacteria counts than downstream locations. However, upper basin locations downstream of the Watertown Dam have bacteria concentrations that are significantly lower in 2010 compared to the 5-year mean, most notably the Faneuil Brook outlet, which meets standards. Geometric means for each location for 2005- 2010 appear in Table 3-6. Geometric means for 2010 are shown in a separate column from the five-year means. If confidence intervals for the two periods overlap, this indicates no statistically significant difference between the two means (α = 0.95). The top graph in Figure 3-5 shows percentile plots of Enterococcus counts arranged from upstream to downstream locations for 2010 (note log scale). The bottom graph in Figure 3-5 shows percentile plots of E. coli counts arranged from upstream to downstream locations for 2010. Generally, E. coli shows the same spatial trend as Enterococcus, with more elevated bacteria counts upstream relative to downstream locations. However, fewer locations meet geometric mean standards for E. coli than for Enterococcus. For 2010, all locations downstream of the Eliot Bridge in Cambridge meet geometric mean standards for both bacterial indicators except the area near the Massachusetts Avenue bridge, from the Stony Brook outlet (Station 145) to across the river at the MIT Boathouse (Station 007) and downstream to Station 008. Figure 3-6 shows the impact of rainfall on the three river reaches on Enterococcus densities, along with the change at locations near CSO outfalls. All reaches show a similar pattern, with wet weather median counts generally higher than in dry weather. The change in Enterococcus concentrations since 1989 in the Upper Charles Basin (upstream of CSO influences) and the lower Charles (including the Mid- and Lower-Basin locations) appear in Figure 3-7 and Figure 3-8. Results are grouped by phases of the Long Term CSO Plan improvements and include the geometric mean counts in each rainfall condition. These figures show change over time in both regions, with statistically significant improvement in water quality in the latest phase (2000 to 2010 = 331.1, d.f. 2, p < 0.0001, ANOVA). The Upper Basin shows improvement in both dry and wet conditions but does not consistently meet the geometric mean swimming standard in wet weather. The most pronounced change is in the lower Charles, which meets the geometric mean swimming standard in all but heavy rain. The greatest improvement in bacterial water quality since the early 1990s has been in dry weather, followed by heavy rain conditions.
22
Figure 3-5. Indicator bacteria concentrations, Charles River Basin, 2010. Dotted lines show MADEP Enterococcus and E. coli standard.
1
10
100
1000
10000
012 001 144 002 003 004 005 006 007 145 008 009 010 166 011
1
10
100
1000
10000
012 001 144 002 003 004 005 006 007 145 008 009 010 166 011
Enterococcus
E. coli
Upstream Downstream Upstream Downstream
Upper Basin Mid-basin Lower Basin
Watertown DCR Faneuil Dwnstr Dwntr Western Magazine BU Br. MIT Stony Mass. Upstr. Dwnstr. Science Upstr. ofDam rink Br. outlet BOS33 CAM005 Ave. Beach (downstr. Boaths. Brook Ave. Longfellow Longfell. Mus. New Charles
MWR203) outlet bridge Bridge Bridge DamMWR023 MWR018 MWR019 MWR020
Watertown DCR Faneuil Dwnstr Dwntr Western Magazine BU Br. MIT Stony Mass. Upstr. Dwnstr. Science Upstr. ofDam rink Br. outlet BOS33 CAM005 Ave. Beach (downstr. Boaths. Brook Ave. Longfellow Longfell. Mus. New Charles
MWR203) outlet bridge Bridge Bridge DamMWR023 MWR018 MWR019 MWR020
colo
nies
/100
mL
colo
nies
/100
mL
23
Table 3-6. Geometric mean indicator bacteria, Charles River Basin, 2005 – 2010.
Station Location Surface
or Bottom
Number of samples
Enterococcus (95% CI) 1 cfu/100 mL
E. coli (95% CI) 1 cfu/100 mL
2005–‘09 2010 2005 – 2009 2010 2005 – 2009 2010
012 Newtown/Watertown, footbridge upstream of Watertown Dam S 149 26 51 (36-73) 35 (14-86) 205
(169-248) 223
(133-376)
001 Newton, near Nonantum Rd., rear of DCR skating rink S 116 20 59 (38-91) 8 (3-20) 256
(201-326) 200
(147-271)
144 Brighton, downstream of N. Beacon St. bridge, Faneuil Brook outlet, BOS-032 (closed 1999)
S 55 20 74 (45-123) 10 (3-27) 497 (342-721)
136 (68-270)
002 Allston, downstream of Arsenal Street bridge, BOS-033 S 88 20 28 (18-45) 5 (1-14) 236
(187-299) 146
(98-216)
003 Allston/Cambridge, midstream, near Mt. Auburn Street, between CAM-005 and CAM-006
S 88 20 20 (12-32) 5 (2-12) 186 (142-243)
119 (86-163)
004 Allston/Cambridge, midstream, between River Street and Western Avenue bridges
S 90 20 10 (6-17) 3 (1-7) 91 (63-133)
28 (12-65)
005 Cambridge, near Magazine Beach, upstream of Cottage Farm S 177 42 14 (10-19) 4 (2-9) 103
(84-126) 64
(38-107)
006 Cambridge/Boston, midstream, downstream of Cottage Farm, BU bridge
S 109 20 25 (17-36) 6 (2-13) 169 (135-212)
57 (27-118)
007 Cambridge, near Memorial Dr., MIT Boathouse
S 107 20 11 (7-16) 6 (2-16) 99 (71-137) 101 (58-175)
B 107 20 26 (17-39) 16 (6-38) 185 (143-239) 204 (136-307)
145 Boston (Charlesgate), Muddy River/Stony Brook outlet S 107 20 30 (20-45) 14 (7-30) 231
(163-327) 203
(135-305)
008 Cambridge/Boston, midstream, downstream of Harvard Bridge
S 107 20 10 (7-15) 5 (2-11) 102 (74-143) 86 (39-189)
B 107 20 14 (9-23) 23 (12-43) 147 (104-206) 193 (123-302)
009 Cambridge/Boston, midstream, upstream of Longfellow Bridge near Community Sailing
S 108 20 6 (4-9) 1 (0-3) 72 (52-98) 35 (19-64)
B 107 20 2 (1-4) 0 (0-1) 12 (8-18) 16 (9-29)
010 Boston, downstream of Longfellow Bridge, MWR-022
S 107 20 4 (3-6) 2 (1-4) 52 (37-73) 20 (8-48)
B 108 20 4 (3-6) 2 (1-5) 19 (13-27) 40 (13-124)
166 Boston, old Charles River dam, rear of Science Museum S 152 24 8 (6-13) 4 (1-11) 115 (86-154) 72 (41-127)
011 Boston, upstream of river locks (New Charles River Dam) and I-93, near Nashua St.
S 109 20 5 (3-7) 2 (0-4) 49 (37-63) 39 (25-62)
B 109 20 12 (9-16) 3 (1-8) 39 (30-52) 38 (16-90) 1Geometric mean limit for Enterococcus is 35 cfu/100 mL in marine water, 33 cfu/100 mL in freshwater. The E. coli limit is 126 cfu/100 mL.
24
Figure 3-6. Enterococcus by rainfall condition, Charles Basin, 2010. Dotted line shows MADEP standard of 33 colonies/100 mL. Rainfall is NOAA rainfall from Logan airport. “Dry”: no rainfall for previous 3 days; “Heavy”: more than 0.5 inches in previous 3 days; “Damp” and/or rain distant in time: any rain < 0.15 inches at least two or three days previous to sampling and/or 0.1 inches in previous day; “Light rain”: between 0.1 and 0.5 inches in previous day and/or between 0.15 and 0.5 in two previous days.
1
10
100
1000
10000
Upper Basin MId-basin Lower Basin
1
10
100
1000
10000
005 006 007 008 009 010 011
Heavy RainLight RainDampDry Heavy RainLight RainDampDry
Magazine Beach Downstream Stony Brook Longfellow Br. Longfellow Br. Upstream of of Cottage Farm upstream downstream New Charles Dam
Downstream of Downstream of MWR023 Downstream of Downstream of Downstream ofCAM005, 007, 009, 011 MWR201 MWR018, 019 MWR020 all CSOs (incl.
CAM017, 018/019
Upstream Downstream Upstream Downstream
Charles River, sampling locations near CSO outfalls
Enterococcus by rainfall condition, 2010
colo
nies
/100
mL
colo
nies
/100
mL
25
Figure 3-7. Enterococcus over time, Upper Charles Basin (upstream of CSOs)
by phase of Long Term CSO Plan and rainfall condition. Dotted line shows State standard. Data includes results for stations 012, 001, 002, 003. Rainfall is NOAA rainfall from Logan airport. “Dry”: no rainfall for previous 3 days; “Heavy”: more than 0.5 inches in previous 3 days; “Damp” and/or rain distant in time: any rain < 0.15 inches at least two or three days previous to sampling and/or 0.1 inches in previous day; “Light rain”: between 0.1 and 0.5 inches in previous day and/or between 0.15 and 0.5 in two previous days.
Figure 3-8. Enterococcus over time, Lower Charles Basin by phase of Long Term CSO Plan and rainfall condition.
Dotted line shows State standard. Data includes results for all stations downstream of Western Ave (Station 004). Rainfall is NOAA rainfall from Logan airport. “Dry”: no rainfall for previous 3 days; “Heavy”: more than 0.5 inches in previous 3 days; “Damp” and/or rain distant in time: any rain < 0.15 inches at least two or three days previous to sampling and/or 0.1 inches in previous day; “Light rain”: between 0.1 and 0.5 inches in previous day and/or between 0.15 and 0.5 in two previous days.
Heavy rainLight rainDampDry Heavy rainLight rainDampDry
Heavy rainLight rainDampDry Heavy rainLight rainDampDry
1989-1991 1992-1999 2000-2010
Ente
roco
ccus
(col
/100
mL)
1
10
100
1000
10000
100000
1
10
100
1000
10000
100000
1989-1991 1992-1999 2000-2010
Ente
roco
ccus
(col
/100
mL)
1
10
100
1000
10000
100000
1
10
100
1000
10000
100000
26
3.5 Summary of Charles River Water Quality Bacterial water quality in the Charles in 2010 was spatially consistent with prior years, with more elevated concentrations at upstream locations (upstream of most CSOs), improving as the river widens and slows in the Lower Basin and approaches the New Charles Dam. However, upstream geometric mean counts overall were lower in 2010 than in the previous five years, from the Faneuil Brook outlet downstream to the BU Bridge. In the Lower Charles Basin, bacteria concentrations have increased slightly at the MIT Boathouse, but with little change across the river at the Stony Brook outlet. Bottom-water dissolved oxygen meets standards in the Upper Charles Basin, but worsens considerably in the lower Charles Basin. 2010 was unusually poor compared with prior years, with most of the Lower Basin locations failing to meet the dissolved oxygen standard of 5 mg/L in bottom waters. Seawater entering through the Charles locks in summer contributes to stratification of the basin, limiting exchange with surface waters and at least partially explains the lower bottom DO in this area. Nutrients and chlorophyll exhibited seasonal and spatial signals, with chlorophyll a and ammonium more elevated downstream than upstream in summer months, and total suspended solids more elevated upstream than downstream in spring months, particularly following the March 2010 storms. Total nitrogen and total phosphorus are similar in both upstream and downstream locations, but chlorophyll a concentrations were consistently higher at the Lower Basin location compared with the Watertown Dam.
27
4 Results: Mystic River and Alewife Brook
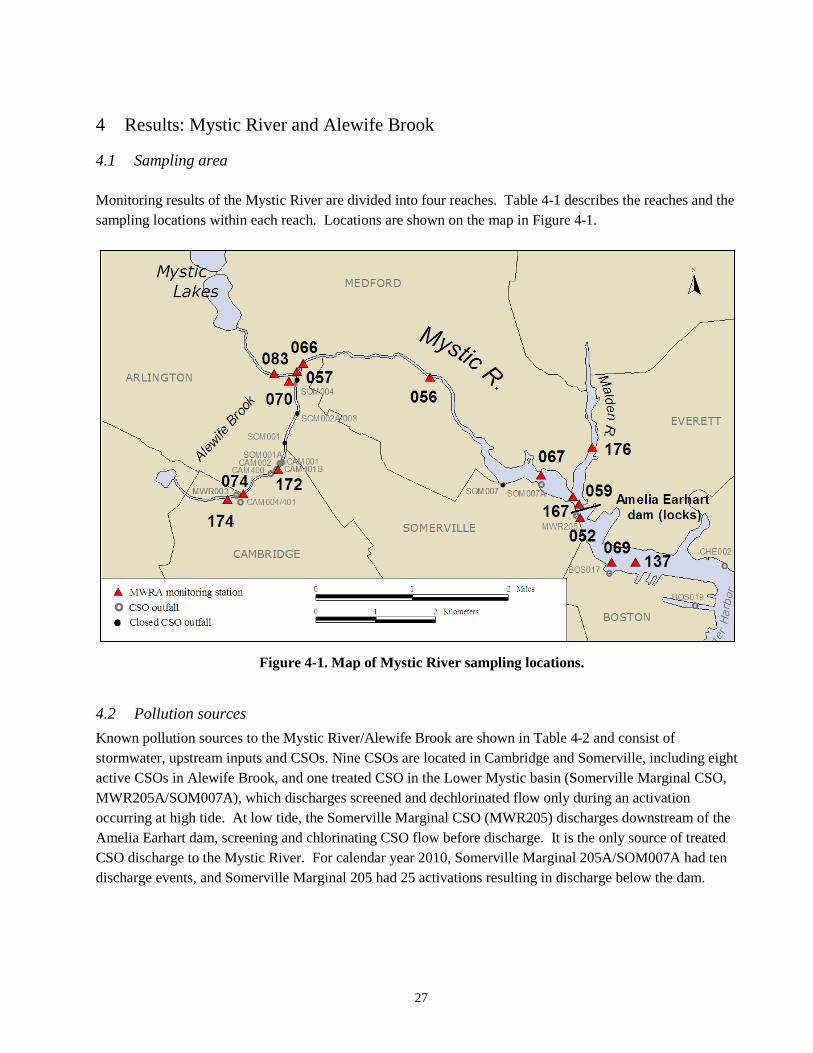
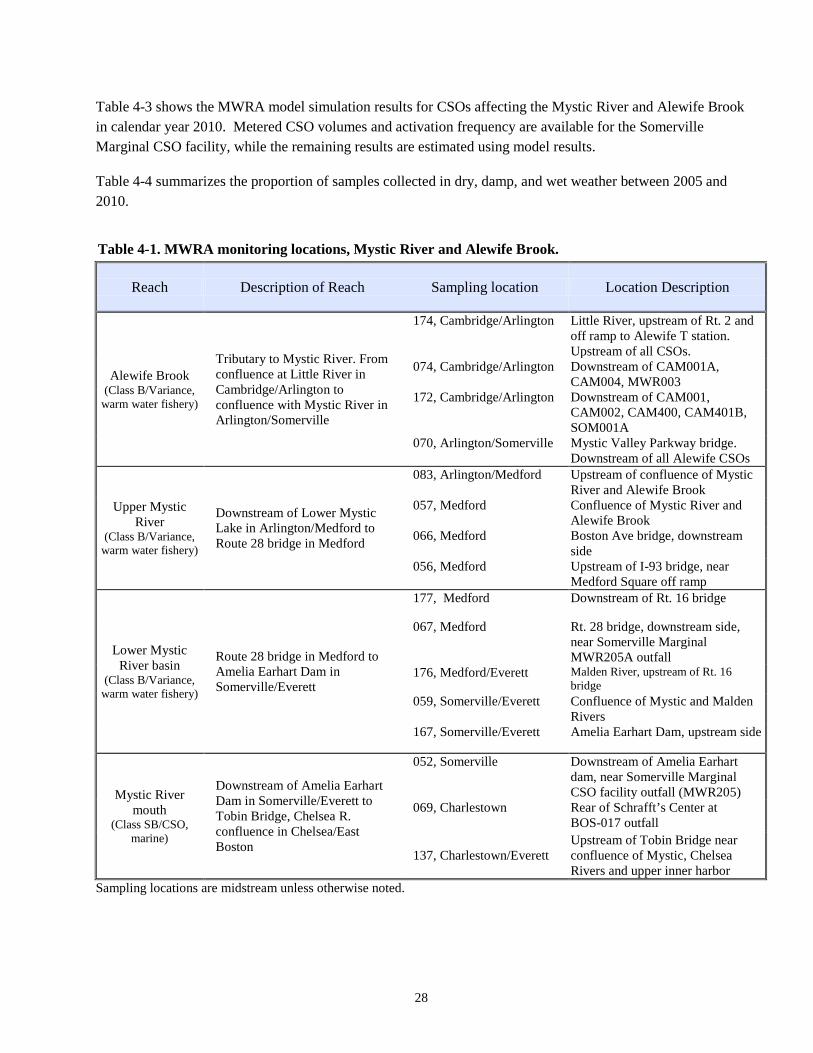
4.1 Sampling area Monitoring results of the Mystic River are divided into four reaches. Table 4-1 describes the reaches and the sampling locations within each reach. Locations are shown on the map in Figure 4-1.
Figure 4-1. Map of Mystic River sampling locations.
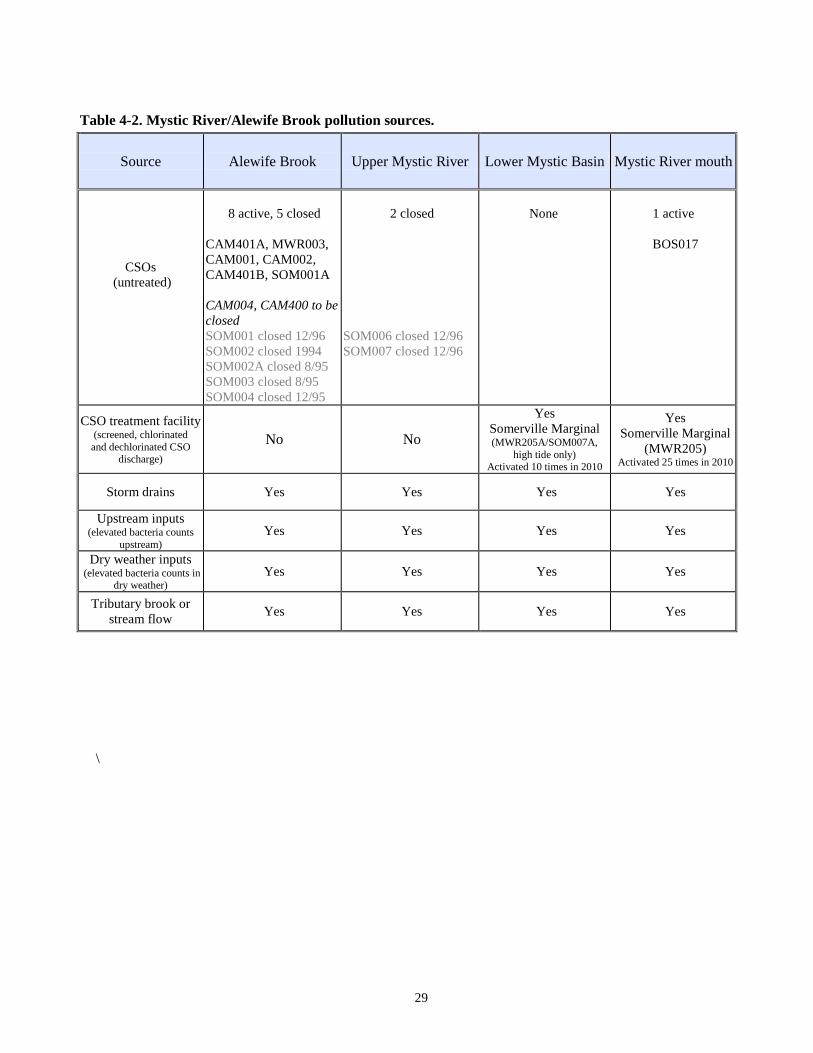
4.2 Pollution sources Known pollution sources to the Mystic River/Alewife Brook are shown in Table 4-2 and consist of stormwater, upstream inputs and CSOs. Nine CSOs are located in Cambridge and Somerville, including eight active CSOs in Alewife Brook, and one treated CSO in the Lower Mystic basin (Somerville Marginal CSO, MWR205A/SOM007A), which discharges screened and dechlorinated flow only during an activation occurring at high tide. At low tide, the Somerville Marginal CSO (MWR205) discharges downstream of the Amelia Earhart dam, screening and chlorinating CSO flow before discharge. It is the only source of treated CSO discharge to the Mystic River. For calendar year 2010, Somerville Marginal 205A/SOM007A had ten discharge events, and Somerville Marginal 205 had 25 activations resulting in discharge below the dam.
28
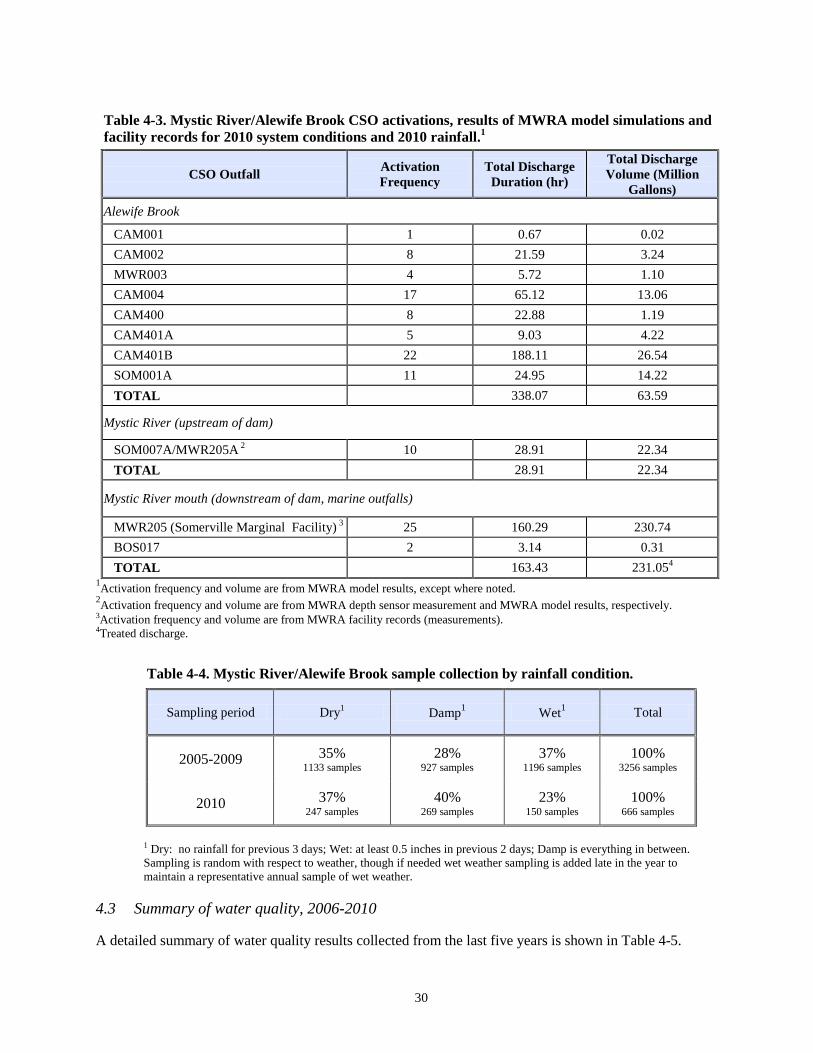
Table 4-3 shows the MWRA model simulation results for CSOs affecting the Mystic River and Alewife Brook in calendar year 2010. Metered CSO volumes and activation frequency are available for the Somerville Marginal CSO facility, while the remaining results are estimated using model results. Table 4-4 summarizes the proportion of samples collected in dry, damp, and wet weather between 2005 and 2010.
Table 4-1. MWRA monitoring locations, Mystic River and Alewife Brook.
Reach Description of Reach Sampling location Location Description
Alewife Brook (Class B/Variance,
warm water fishery)
Tributary to Mystic River. From confluence at Little River in Cambridge/Arlington to confluence with Mystic River in Arlington/Somerville
174, Cambridge/Arlington Little River, upstream of Rt. 2 and off ramp to Alewife T station. Upstream of all CSOs.
074, Cambridge/Arlington Downstream of CAM001A, CAM004, MWR003
172, Cambridge/Arlington Downstream of CAM001, CAM002, CAM400, CAM401B, SOM001A
070, Arlington/Somerville Mystic Valley Parkway bridge. Downstream of all Alewife CSOs
Upper Mystic River
(Class B/Variance, warm water fishery)
Downstream of Lower Mystic Lake in Arlington/Medford to Route 28 bridge in Medford
083, Arlington/Medford Upstream of confluence of Mystic River and Alewife Brook
057, Medford Confluence of Mystic River and Alewife Brook
066, Medford Boston Ave bridge, downstream side
056, Medford Upstream of I-93 bridge, near Medford Square off ramp
Lower Mystic River basin
(Class B/Variance, warm water fishery)
Route 28 bridge in Medford to Amelia Earhart Dam in Somerville/Everett
177, Medford Downstream of Rt. 16 bridge
067, Medford Rt. 28 bridge, downstream side, near Somerville Marginal MWR205A outfall
176, Medford/Everett Malden River, upstream of Rt. 16 bridge
059, Somerville/Everett Confluence of Mystic and Malden Rivers
167, Somerville/Everett Amelia Earhart Dam, upstream side
Mystic River mouth
(Class SB/CSO, marine)
Downstream of Amelia Earhart Dam in Somerville/Everett to Tobin Bridge, Chelsea R. confluence in Chelsea/East Boston
052, Somerville Downstream of Amelia Earhart dam, near Somerville Marginal CSO facility outfall (MWR205)
069, Charlestown Rear of Schrafft’s Center at BOS-017 outfall
137, Charlestown/Everett Upstream of Tobin Bridge near confluence of Mystic, Chelsea Rivers and upper inner harbor
Sampling locations are midstream unless otherwise noted.
29
Table 4-2. Mystic River/Alewife Brook pollution sources.
Source Alewife Brook Upper Mystic River Lower Mystic Basin Mystic River mouth
CSOs (untreated)
8 active, 5 closed
CAM401A, MWR003, CAM001, CAM002, CAM401B, SOM001A CAM004, CAM400 to be closed SOM001 closed 12/96 SOM002 closed 1994 SOM002A closed 8/95 SOM003 closed 8/95 SOM004 closed 12/95
2 closed
SOM006 closed 12/96 SOM007 closed 12/96
None
1 active
BOS017
CSO treatment facility (screened, chlorinated
and dechlorinated CSO discharge)
No No
Yes Somerville Marginal (MWR205A/SOM007A,
high tide only) Activated 10 times in 2010
Yes Somerville Marginal
(MWR205) Activated 25 times in 2010
Storm drains Yes Yes Yes Yes
Upstream inputs (elevated bacteria counts
upstream) Yes Yes Yes Yes
Dry weather inputs (elevated bacteria counts in
dry weather) Yes Yes Yes Yes
Tributary brook or stream flow Yes Yes Yes Yes
\
30
Table 4-3. Mystic River/Alewife Brook CSO activations, results of MWRA model simulations and facility records for 2010 system conditions and 2010 rainfall.1
CSO Outfall Activation Frequency
Total Discharge Duration (hr)
Total Discharge Volume (Million
Gallons) Alewife Brook
CAM001 1 0.67 0.02 CAM002 8 21.59 3.24 MWR003 4 5.72 1.10 CAM004 17 65.12 13.06 CAM400 8 22.88 1.19 CAM401A 5 9.03 4.22 CAM401B 22 188.11 26.54 SOM001A 11 24.95 14.22 TOTAL 338.07 63.59
Mystic River (upstream of dam)
SOM007A/MWR205A 2 10 28.91 22.34 TOTAL 28.91 22.34
Mystic River mouth (downstream of dam, marine outfalls)
MWR205 (Somerville Marginal Facility) 3 25 160.29 230.74 BOS017 2 3.14 0.31 TOTAL 163.43 231.054
1Activation frequency and volume are from MWRA model results, except where noted. 2Activation frequency and volume are from MWRA depth sensor measurement and MWRA model results, respectively. 3Activation frequency and volume are from MWRA facility records (measurements). 4Treated discharge.
1 Dry: no rainfall for previous 3 days; Wet: at least 0.5 inches in previous 2 days; Damp is everything in between. Sampling is random with respect to weather, though if needed wet weather sampling is added late in the year to maintain a representative annual sample of wet weather.
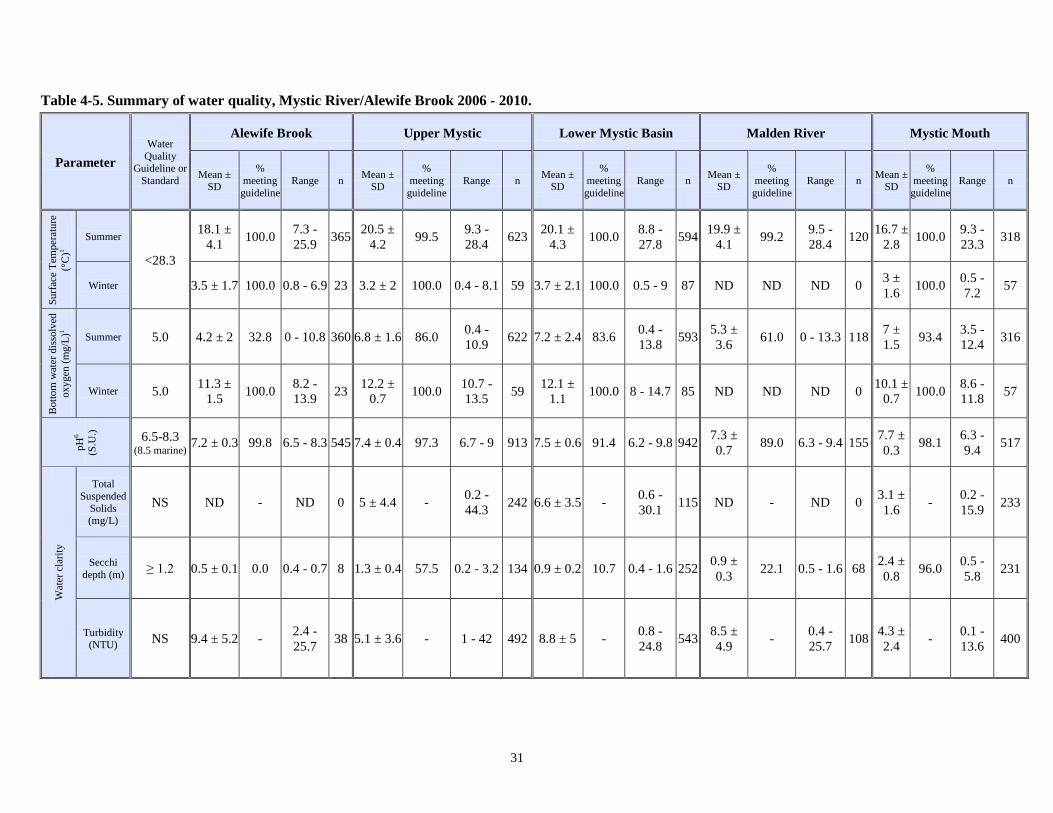
4.3 Summary of water quality, 2006-2010 A detailed summary of water quality results collected from the last five years is shown in Table 4-5.
Table 4-4. Mystic River/Alewife Brook sample collection by rainfall condition.
Sampling period Dry1 Damp1 Wet1 Total
2005-2009 35% 1133 samples
28% 927 samples
37% 1196 samples
100% 3256 samples
2010 37% 247 samples
40% 269 samples
23% 150 samples
100% 666 samples
31
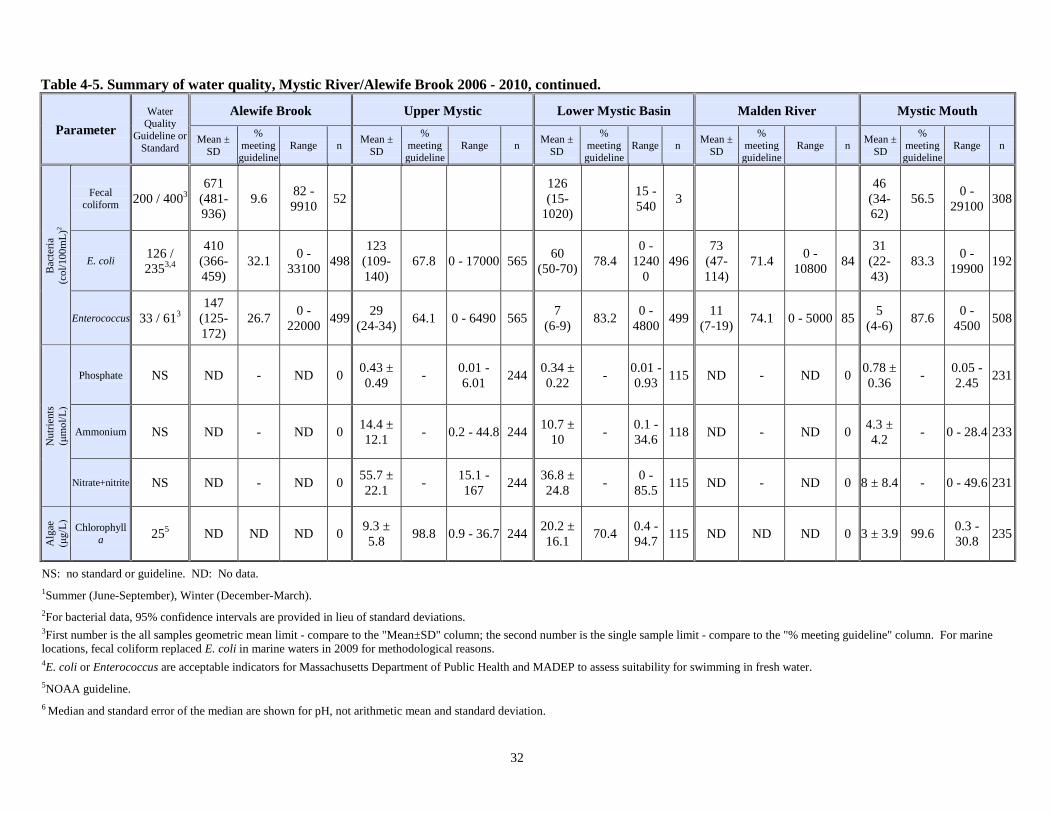
Table 4-5. Summary of water quality, Mystic River/Alewife Brook 2006 - 2010.
Parameter Water
Quality Guideline or
Standard
Alewife Brook Upper Mystic Lower Mystic Basin Malden River Mystic Mouth
Mean ± SD
% meeting guideline
Range n Mean ± SD
% meeting
guideline Range n Mean ±
SD
% meeting guideline
Range n Mean ± SD
% meeting guideline
Range n Mean ± SD
% meeting
guideline Range n
Surfa
ce T
empe
ratu
re
(°C
)1
Summer
<28.3
18.1 ± 4.1 100.0 7.3 -
25.9 365 20.5 ± 4.2 99.5 9.3 -
28.4 623 20.1 ± 4.3 100.0 8.8 -
27.8 594 19.9 ± 4.1 99.2 9.5 -
28.4 120 16.7 ± 2.8 100.0 9.3 -
23.3 318
Winter 3.5 ± 1.7 100.0 0.8 - 6.9 23 3.2 ± 2 100.0 0.4 - 8.1 59 3.7 ± 2.1 100.0 0.5 - 9 87 ND ND ND 0 3 ± 1.6 100.0 0.5 -
7.2 57
Bot
tom
wat
er d
isso
lved
ox
ygen
(mg/
L)1
Summer 5.0 4.2 ± 2 32.8 0 - 10.8 360 6.8 ± 1.6 86.0 0.4 - 10.9 622 7.2 ± 2.4 83.6 0.4 -
13.8 593 5.3 ± 3.6 61.0 0 - 13.3 118 7 ±
1.5 93.4 3.5 - 12.4 316
Winter 5.0 11.3 ± 1.5 100.0 8.2 -
13.9 23 12.2 ± 0.7 100.0 10.7 -
13.5 59 12.1 ± 1.1 100.0 8 - 14.7 85 ND ND ND 0 10.1 ±
0.7 100.0 8.6 - 11.8 57
pH6
(S.U
.) 6.5-8.3 (8.5 marine) 7.2 ± 0.3 99.8 6.5 - 8.3 545 7.4 ± 0.4 97.3 6.7 - 9 913 7.5 ± 0.6 91.4 6.2 - 9.8 942 7.3 ±
0.7 89.0 6.3 - 9.4 155 7.7 ± 0.3 98.1 6.3 -
9.4 517
Wat
er c
larit
y
Total Suspended
Solids (mg/L)
NS ND - ND 0 5 ± 4.4 - 0.2 - 44.3 242 6.6 ± 3.5 - 0.6 -
30.1 115 ND - ND 0 3.1 ± 1.6 - 0.2 -
15.9 233
Secchi depth (m) ≥ 1.2 0.5 ± 0.1 0.0 0.4 - 0.7 8 1.3 ± 0.4 57.5 0.2 - 3.2 134 0.9 ± 0.2 10.7 0.4 - 1.6 252 0.9 ±
0.3 22.1 0.5 - 1.6 68 2.4 ± 0.8 96.0 0.5 -
5.8 231
Turbidity (NTU) NS 9.4 ± 5.2 - 2.4 -
25.7 38 5.1 ± 3.6 - 1 - 42 492 8.8 ± 5 - 0.8 - 24.8 543 8.5 ±
4.9 - 0.4 - 25.7 108 4.3 ±
2.4 - 0.1 - 13.6 400
32
Table 4-5. Summary of water quality, Mystic River/Alewife Brook 2006 - 2010, continued.
Parameter Water
Quality Guideline or
Standard
Alewife Brook Upper Mystic Lower Mystic Basin Malden River Mystic Mouth
Mean ± SD
% meeting guideline
Range n Mean ± SD
% meeting guideline
Range n Mean ± SD
% meeting guideline
Range n Mean ± SD
% meeting
guideline Range n Mean ±
SD
% meeting guideline
Range n
Bac
teria
(col
/100
mL)
2
Fecal coliform 200 / 4003
671 (481-936)
9.6 82 - 9910 52
126 (15-
1020) 15 -
540 3 46
(34-62)
56.5 0 - 29100 308
E. coli 126 / 2353,4
410 (366-459)
32.1 0 - 33100 498
123 (109-140)
67.8 0 - 17000 565 60 (50-70) 78.4
0 - 1240
0 496
73 (47-114)
71.4 0 - 10800 84
31 (22-43)
83.3 0 - 19900 192
Enterococcus 33 / 613 147
(125-172)
26.7 0 - 22000 499 29
(24-34) 64.1 0 - 6490 565 7 (6-9) 83.2 0 -
4800 499 11 (7-19) 74.1 0 - 5000 85 5
(4-6) 87.6 0 - 4500 508
Nut
rient
s
(μ
mol
/L)
Phosphate NS ND - ND 0 0.43 ± 0.49 - 0.01 -
6.01 244 0.34 ± 0.22 - 0.01 -
0.93 115 ND - ND 0 0.78 ± 0.36 - 0.05 -
2.45 231
Ammonium NS ND - ND 0 14.4 ± 12.1 - 0.2 - 44.8 244 10.7 ±
10 - 0.1 - 34.6 118 ND - ND 0 4.3 ±
4.2 - 0 - 28.4 233
Nitrate+nitrite NS ND - ND 0 55.7 ± 22.1 - 15.1 -
167 244 36.8 ± 24.8 - 0 -
85.5 115 ND - ND 0 8 ± 8.4 - 0 - 49.6 231
Alg
ae
(μ
g/L)
Chlorophyll a 255 ND ND ND 0 9.3 ±
5.8 98.8 0.9 - 36.7 244 20.2 ± 16.1 70.4 0.4 -
94.7 115 ND ND ND 0 3 ± 3.9 99.6 0.3 - 30.8 235
NS: no standard or guideline. ND: No data. 1Summer (June-September), Winter (December-March). 2For bacterial data, 95% confidence intervals are provided in lieu of standard deviations. 3First number is the all samples geometric mean limit - compare to the "Mean±SD" column; the second number is the single sample limit - compare to the "% meeting guideline" column. For marine locations, fecal coliform replaced E. coli in marine waters in 2009 for methodological reasons. 4E. coli or Enterococcus are acceptable indicators for Massachusetts Department of Public Health and MADEP to assess suitability for swimming in fresh water. 5NOAA guideline. 6 Median and standard error of the median are shown for pH, not arithmetic mean and standard deviation.
33
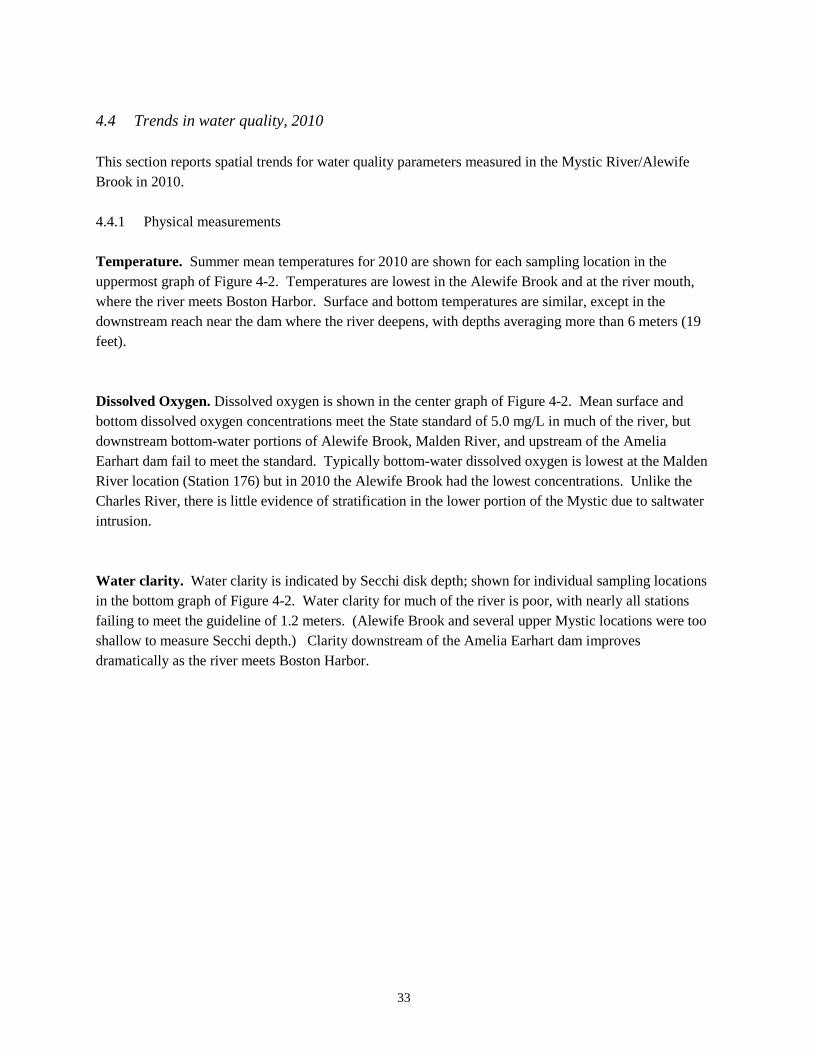
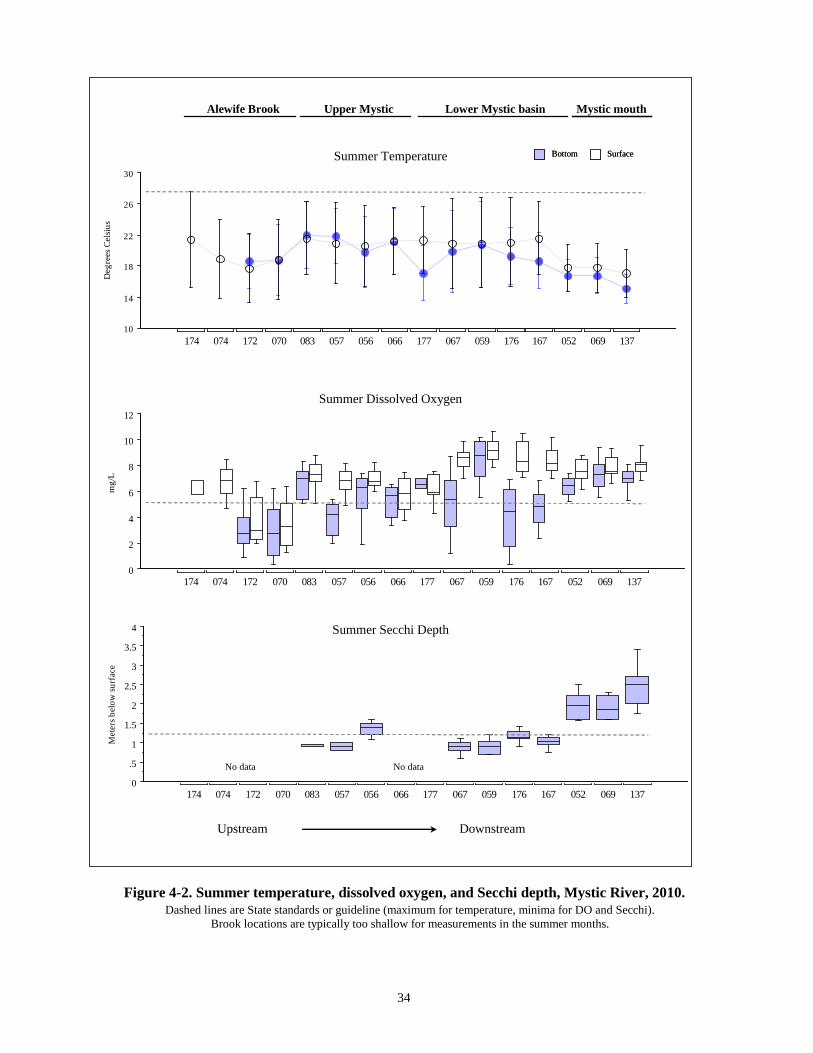
4.4 Trends in water quality, 2010 This section reports spatial trends for water quality parameters measured in the Mystic River/Alewife Brook in 2010. 4.4.1 Physical measurements Temperature. Summer mean temperatures for 2010 are shown for each sampling location in the uppermost graph of Figure 4-2. Temperatures are lowest in the Alewife Brook and at the river mouth, where the river meets Boston Harbor. Surface and bottom temperatures are similar, except in the downstream reach near the dam where the river deepens, with depths averaging more than 6 meters (19 feet). Dissolved Oxygen. Dissolved oxygen is shown in the center graph of Figure 4-2. Mean surface and bottom dissolved oxygen concentrations meet the State standard of 5.0 mg/L in much of the river, but downstream bottom-water portions of Alewife Brook, Malden River, and upstream of the Amelia Earhart dam fail to meet the standard. Typically bottom-water dissolved oxygen is lowest at the Malden River location (Station 176) but in 2010 the Alewife Brook had the lowest concentrations. Unlike the Charles River, there is little evidence of stratification in the lower portion of the Mystic due to saltwater intrusion. Water clarity. Water clarity is indicated by Secchi disk depth; shown for individual sampling locations in the bottom graph of Figure 4-2. Water clarity for much of the river is poor, with nearly all stations failing to meet the guideline of 1.2 meters. (Alewife Brook and several upper Mystic locations were too shallow to measure Secchi depth.) Clarity downstream of the Amelia Earhart dam improves dramatically as the river meets Boston Harbor.
34
Figure 4-2. Summer temperature, dissolved oxygen, and Secchi depth, Mystic River, 2010. Dashed lines are State standards or guideline (maximum for temperature, minima for DO and Secchi).
Brook locations are typically too shallow for measurements in the summer months.
0
.5
1
1.5
2
2.5
3
3.5
4
Met
ers b
elow
surf
ace
174 074 172 070 083 057 056 066 177 067 059 176 167 052 069 137
0
2
4
6
8
10
12
mg/
L
174 074 172 070 083 057 056 066 177 067 059 176 167 052 069 137
10
14
18
22
26
30
Deg
rees
Cel
sius
174 074 172 070 083 057 056 066 177 067 059 176 167 052 069 137
SB
Upstream Downstream Upstream Downstream
Summer Temperature
Summer Dissolved Oxygen
Summer Secchi Depth
Alewife Brook Upper Mystic Lower Mystic basin Mystic mouth
No data
SurfaceBottom SurfaceBottom
No data
35
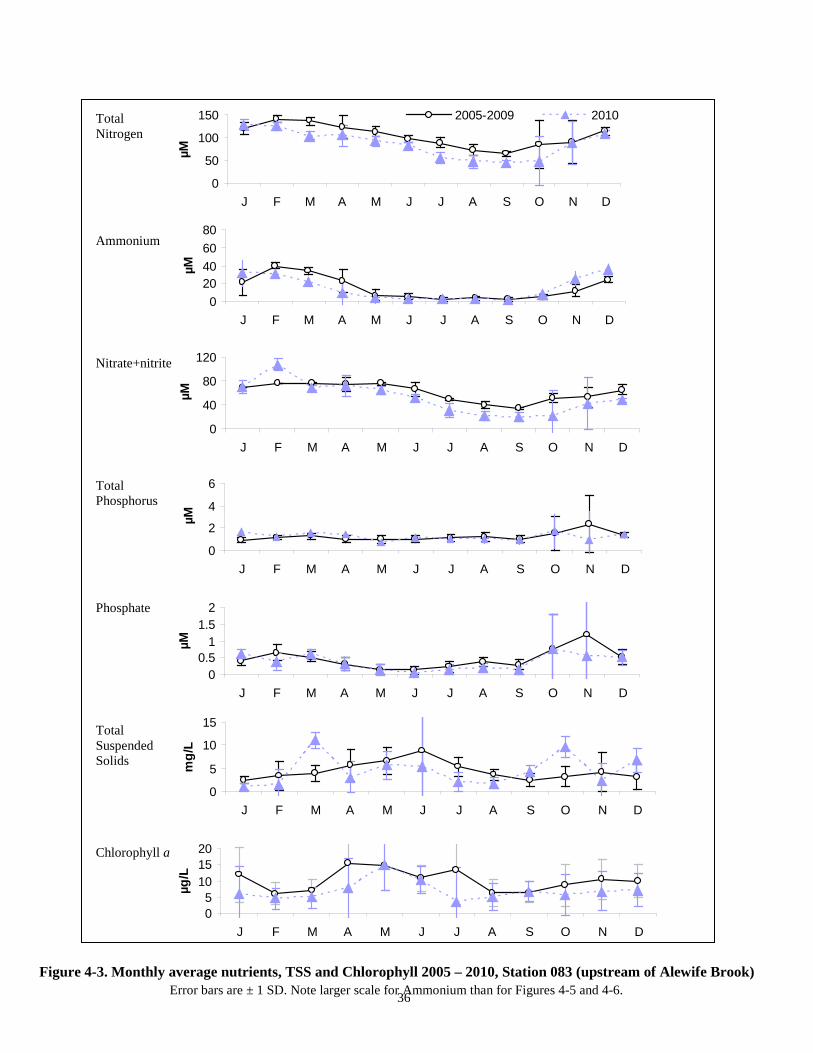
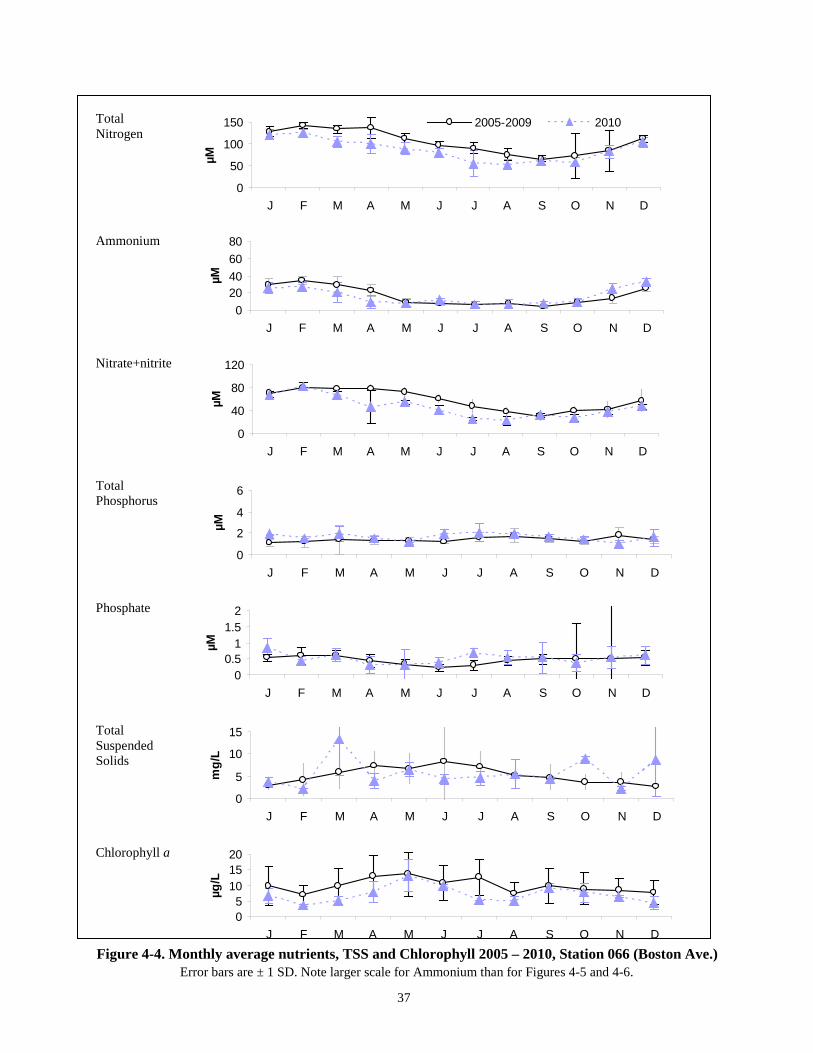
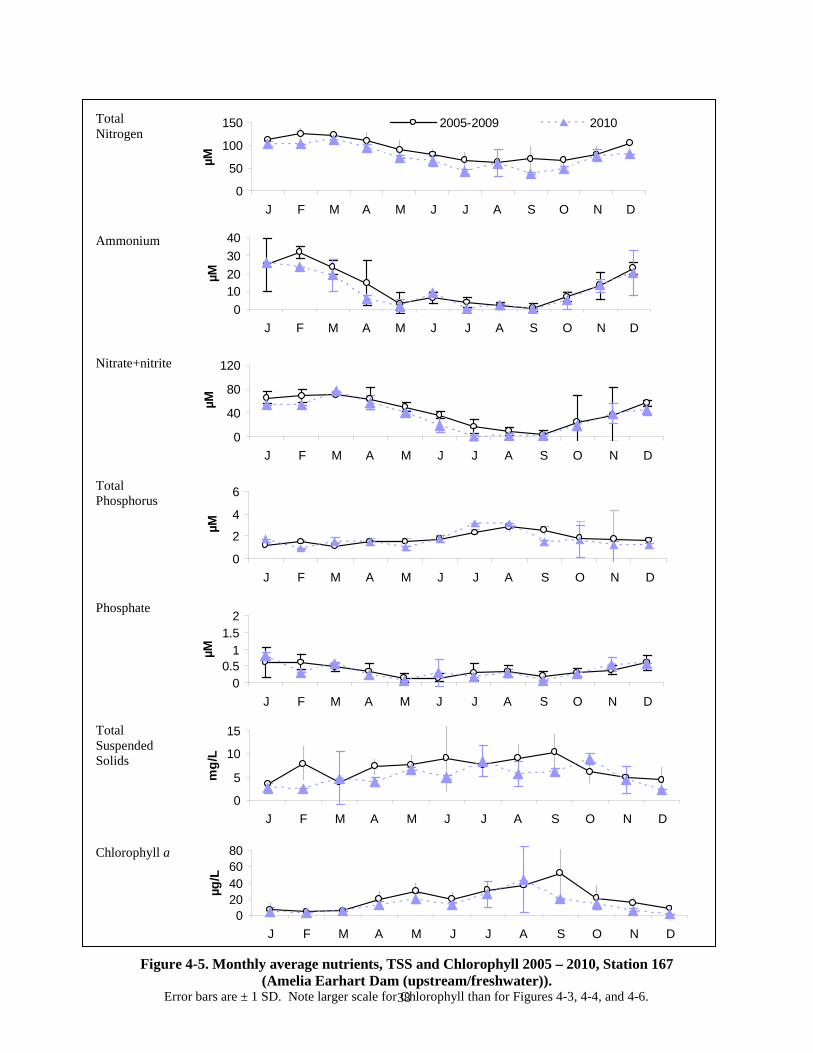
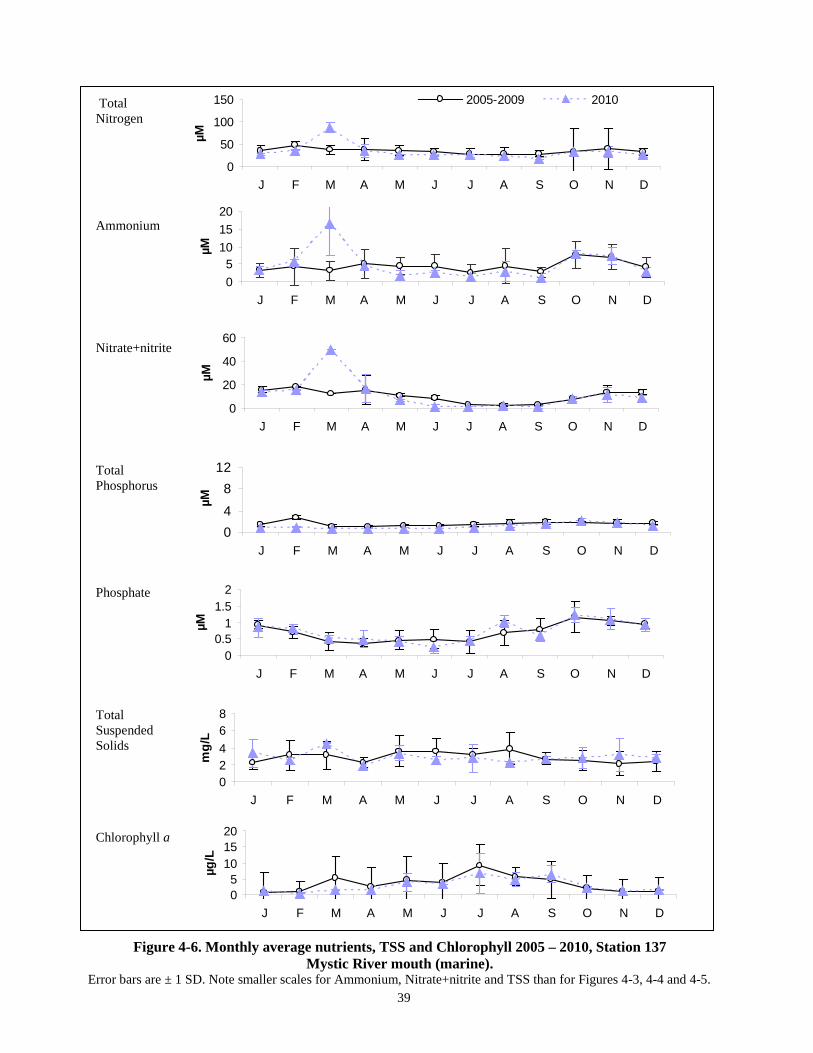
4.4.2 Nutrients, TSS and chlorophyll Monthly average total nitrogen, ammonium, nitrate/nitrite, total phosphorus, orthophosphate, total suspended solids, and chlorophyll a at the upstream locations (083 upstream of Alewife Brook and 066 at Boston Ave.), downstream (167 at Amelia Earhart Dam) and river mouth (137) locations are shown in Figures 4-3 through 4-6. Nitrogen concentrations drop substantially in summer months as biological uptake increases, and chlorophyll a and TSS increase. Station 167, immediately upstream of the dam, is more eutrophic than either upstream or at the mouth of the river, with much higher chlorophyll concentrations than upstream locations, particularly in late summer. 2010 results were very similar to the 2005-2009 average for all nutrient parameters, with the exception of chlorophyll at the two upstream locations (Stations 083 and 066) which had slightly below average concentrations. Like the Charles River, TSS concentrations increased following the March 2010 storms. In the cold weather months, when biological nutrient uptake is low, ammonium concentrations in the Mystic are more than twice as high in the Upper Mystic as in the Charles Basin. Nutrient concentrations on the marine side of the dam are generally much lower than upstream, particularly for nitrogen, chlorophyll, and total suspended solids.
36
Total Nitrogen
Ammonium
Nitrate+nitrite
Total Phosphorus
Phosphate
Total Suspended Solids
Chlorophyll a
Figure 4-3. Monthly average nutrients, TSS and Chlorophyll 2005 – 2010, Station 083 (upstream of Alewife Brook) Error bars are ± 1 SD. Note larger scale for Ammonium than for Figures 4-5 and 4-6.
0
40
80
120
J F M A M J J A S O N D
µM
0
2
4
6
J F M A M J J A S O N D
µM
00.5
11.5
2
J F M A M J J A S O N D
µM
0
5
10
15
J F M A M J J A S O N D
mg/
L
05
101520
J F M A M J J A S O N D
µg/L
0
50
100
150
J F M A M J J A S O N DµM
2005-2009 2010
020406080
J F M A M J J A S O N D
µM
37
Total Nitrogen Ammonium Nitrate+nitrite Total Phosphorus Phosphate Total Suspended Solids Chlorophyll a Figure 4-4. Monthly average nutrients, TSS and Chlorophyll 2005 – 2010, Station 066 (Boston Ave.)
Error bars are ± 1 SD. Note larger scale for Ammonium than for Figures 4-5 and 4-6.
0
40
80
120
J F M A M J J A S O N D
µM
0
2
4
6
J F M A M J J A S O N D
µM
00.5
11.5
2
J F M A M J J A S O N D
µM
0
5
10
15
J F M A M J J A S O N D
mg/
L
05
101520
J F M A M J J A S O N D
µg/L
0
50
100
150
J F M A M J J A S O N DµM
2005-2009 2010
020406080
J F M A M J J A S O N D
µM
38
Total Nitrogen Ammonium Nitrate+nitrite Total Phosphorus Phosphate Total Suspended Solids Chlorophyll a
Figure 4-5. Monthly average nutrients, TSS and Chlorophyll 2005 – 2010, Station 167 (Amelia Earhart Dam (upstream/freshwater)).
Error bars are ± 1 SD. Note larger scale for Chlorophyll than for Figures 4-3, 4-4, and 4-6.
0
40
80
120
J F M A M J J A S O N D
µM
0
2
4
6
J F M A M J J A S O N D
µM
00.5
11.5
2
J F M A M J J A S O N D
µM
0
5
10
15
J F M A M J J A S O N D
mg/
L
020406080
J F M A M J J A S O N D
µg/L
0
50
100
150
J F M A M J J A S O N DµM
2005-2009 2010
010203040
J F M A M J J A S O N D
µM
39
Total Nitrogen Ammonium Nitrate+nitrite Total Phosphorus Phosphate Total Suspended Solids Chlorophyll a
, TSS and Chlorophyll 2006 - 2010, Mystic River. Figure 4-6. Monthly average nutrients, TSS and Chlorophyll 2005 – 2010, Station 137
Mystic River mouth (marine). Error bars are ± 1 SD. Note smaller scales for Ammonium, Nitrate+nitrite and TSS than for Figures 4-3, 4-4 and 4-5.
0
20
40
60
J F M A M J J A S O N D
µM
04
812
J F M A M J J A S O N D
µM
00.5
11.5
2
J F M A M J J A S O N D
µM
02468
J F M A M J J A S O N D
mg/
L
05
101520
J F M A M J J A S O N D
µg/L
0
50
100
150
J F M A M J J A S O N DµM
2005-2009 2010
05
101520
J F M A M J J A S O N D
µM
40
4.4.3 Bacterial water quality Figure 4-7 shows the current bacterial water quality at each location sampled in the Mystic River and Alewife Brook for 2010. With the exception of Alewife Brook, most locations in the river mainstem meet geometric mean standards. Geometric means for each indicator for all locations for 2006 - 2010 appear in Table 4-6. Enterococcus. The uppermost graph in Figure 4-7 shows percentile plots of Enterococcus counts for each location, arranged from upstream to downstream for 2010. Figure 4-8 shows the impact of rainfall on the three river reaches on Enterococcus densities, along with the change at locations near CSO outfalls. For the 2006-2010 period (with results for all years combined), Alewife Brook locations consistently fail to meet standards, in both dry and wet weather, though conditions improve in the river mainstem, moving downstream to the river mouth. Geometric means in Alewife have nevertheless decreased (see Figure 4-11), and most Mystic River locations met the Enterococcus geometric mean limit of 33 colonies/100 mL. The change in Enterococcus concentrations over time in Alewife Brook and the Mystic River appear in Figure 4-9 through Figure 4-11. Results are grouped by phases of the Long Term CSO Plan improvements and include the geometric mean counts in each rainfall condition. These figures show little change over time in the Mystic River in dry and wet weather since the early 1990’s. However, Alewife Brook has shown an improvement since 2007. 2010 geometric means in the Alewife were higher than in 2008 or 2009, but remained lower than the early 2000’s. E. coli. The center graph in Figure 4-7 shows percentile plots of Enterococcus counts arranged from upstream to downstream locations for 2010. E. coli shows a similar trend to Enterococcus, with basin locations generally meeting the geometric mean limit of 126 colonies/100 mL. While not meeting standards, Alewife Brook has demonstrated a marked improvement in recent years. This is particularly noteworthy considering relatively wet years in 2008 and 2009, whereas other downstream locations had similar geometric mean concentrations compared to previous years. Figure 4-11 shows the significant improvement in Alewife Brook water quality beginning in 2007. Fecal coliform. Fecal coliform appears in the bottom graph in Figure 4-7. Fecal coliform analysis replaced E. coli in marine waters in 2008, due to methodological reasons. Analysis was conducted for Alewife Brook samples in 2010 because of methodological concerns about the change in E. coli methods in 2007. Fecal coliform results for 2010 are consistent with E. coli, confirming the trend of decreasing E. coli counts in recent years. Fecal coliform results in the marine portion of the river continue to meet the former state geometric mean standard of 200 colonies/100 mL. Station 052, at the Somerville Marginal outfall, has shown a dramatic reduction in fecal coliform concentrations in 2010 compared to the five-year mean.
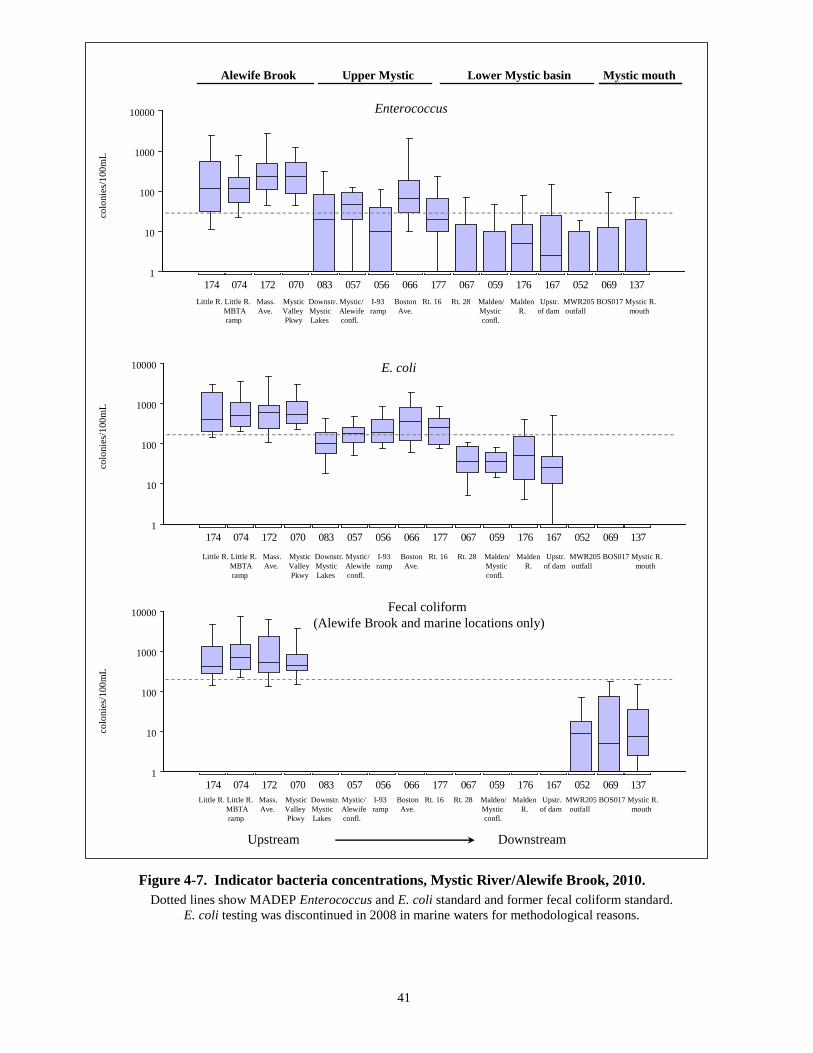
41
Figure 4-7. Indicator bacteria concentrations, Mystic River/Alewife Brook, 2010. Dotted lines show MADEP Enterococcus and E. coli standard and former fecal coliform standard.
E. coli testing was discontinued in 2008 in marine waters for methodological reasons.
1
10
100
1000
10000
174 074 172 070 083 057 056 066 177 067 059 176 167 052 069 137
1
10
100
1000
10000
174 074 172 070 083 057 056 066 177 067 059 176 167 052 069 137
1
10
100
1000
10000
174 074 172 070 083 057 056 066 177 067 059 176 167 052 069 137
Enterococcus
E. coli
Fecal coliform (Alewife Brook and marine locations only)
Upstream Downstream Upstream Downstream
Little R. Little R. Mass. Mystic Downstr. Mystic/ I-93 Boston Rt. 16 Rt. 28 Malden/ Malden Upstr. MWR205 BOS017 Mystic R. MBTA Ave. Valley Mystic Alewife ramp Ave. Mystic R. of dam outfall mouthramp Pkwy Lakes confl. confl.
Alewife Brook Upper Mystic Lower Mystic basin Mystic mouth
Little R. Little R. Mass. Mystic Downstr. Mystic/ I-93 Boston Rt. 16 Rt. 28 Malden/ Malden Upstr. MWR205 BOS017 Mystic R. MBTA Ave. Valley Mystic Alewife ramp Ave. Mystic R. of dam outfall mouthramp Pkwy Lakes confl. confl.
Little R. Little R. Mass. Mystic Downstr. Mystic/ I-93 Boston Rt. 16 Rt. 28 Malden/ Malden Upstr. MWR205 BOS017 Mystic R. MBTA Ave. Valley Mystic Alewife ramp Ave. Mystic R. of dam outfall mouthramp Pkwy Lakes confl. confl.
colo
nies
/100
mL
colo
nies
/100
mL
colo
nies
/100
mL
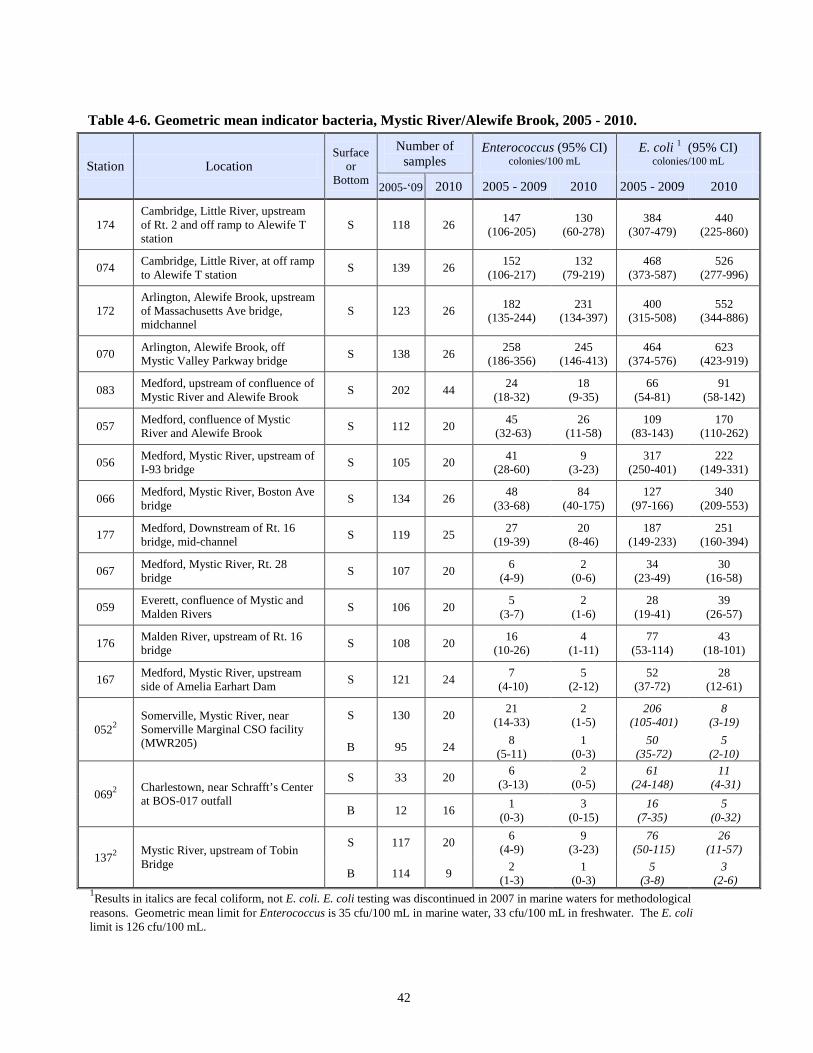
42
Table 4-6. Geometric mean indicator bacteria, Mystic River/Alewife Brook, 2005 - 2010.
Station Location Surface
or Bottom
Number of samples
Enterococcus (95% CI) colonies/100 mL
E. coli 1 (95% CI) colonies/100 mL
2005-‘09 2010 2005 - 2009 2010 2005 - 2009 2010
174 Cambridge, Little River, upstream of Rt. 2 and off ramp to Alewife T station
S 118 26 147 (106-205)
130 (60-278)
384 (307-479)
440 (225-860)
074 Cambridge, Little River, at off ramp to Alewife T station S 139 26 152
(106-217) 132
(79-219) 468
(373-587) 526
(277-996)
172 Arlington, Alewife Brook, upstream of Massachusetts Ave bridge, midchannel
S 123 26 182 (135-244)
231 (134-397)
400 (315-508)
552 (344-886)
070 Arlington, Alewife Brook, off Mystic Valley Parkway bridge S 138 26 258
(186-356) 245
(146-413) 464
(374-576) 623
(423-919)
083 Medford, upstream of confluence of Mystic River and Alewife Brook S 202 44 24
(18-32) 18
(9-35) 66
(54-81) 91
(58-142)
057 Medford, confluence of Mystic River and Alewife Brook S 112 20 45
(32-63) 26
(11-58) 109
(83-143) 170
(110-262)
056 Medford, Mystic River, upstream of I-93 bridge S 105 20 41
(28-60) 9
(3-23) 317
(250-401) 222
(149-331)
066 Medford, Mystic River, Boston Ave bridge S 134 26 48
(33-68) 84
(40-175) 127
(97-166) 340
(209-553)
177 Medford, Downstream of Rt. 16 bridge, mid-channel S 119 25 27
(19-39) 20
(8-46) 187
(149-233) 251
(160-394)
067 Medford, Mystic River, Rt. 28 bridge S 107 20 6
(4-9) 2
(0-6) 34
(23-49) 30
(16-58)
059 Everett, confluence of Mystic and Malden Rivers S 106 20 5
(3-7) 2
(1-6) 28
(19-41) 39
(26-57)
176 Malden River, upstream of Rt. 16 bridge S 108 20 16
(10-26) 4
(1-11) 77
(53-114) 43
(18-101)
167 Medford, Mystic River, upstream side of Amelia Earhart Dam S 121 24 7
(4-10) 5
(2-12) 52
(37-72) 28
(12-61)
0522 Somerville, Mystic River, near Somerville Marginal CSO facility (MWR205)
S 130 20 21 (14-33)
2 (1-5)
206 (105-401)
8 (3-19)
B 95 24 8 (5-11)
1 (0-3)
50 (35-72)
5 (2-10)
0692 Charlestown, near Schrafft’s Center at BOS-017 outfall
S 33 20 6 (3-13)
2 (0-5)
61 (24-148)
11 (4-31)
B 12 16 1 (0-3)
3 (0-15)
16 (7-35)
5 (0-32)
1372 Mystic River, upstream of Tobin Bridge
S 117 20 6 (4-9)
9 (3-23)
76 (50-115)
26 (11-57)
B 114 9 2 (1-3)
1 (0-3)
5 (3-8)
3 (2-6)
1Results in italics are fecal coliform, not E. coli. E. coli testing was discontinued in 2007 in marine waters for methodological reasons. Geometric mean limit for Enterococcus is 35 cfu/100 mL in marine water, 33 cfu/100 mL in freshwater. The E. coli limit is 126 cfu/100 mL.
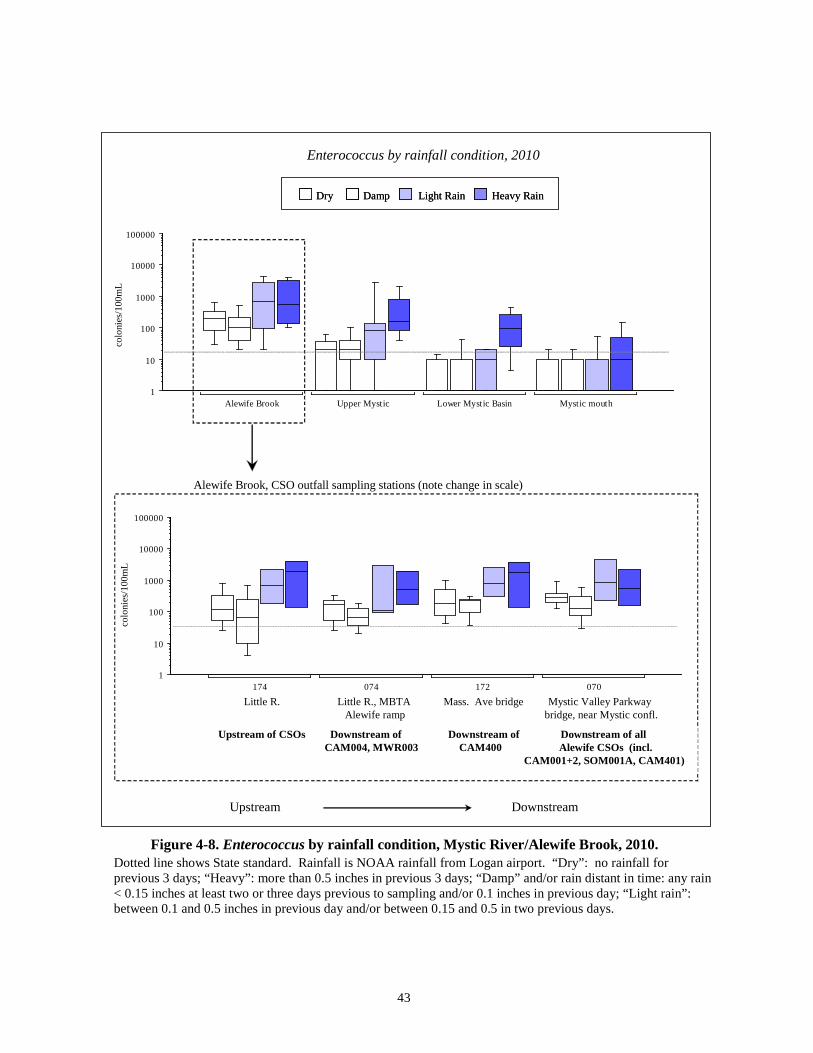
43
Figure 4-8. Enterococcus by rainfall condition, Mystic River/Alewife Brook, 2010. Dotted line shows State standard. Rainfall is NOAA rainfall from Logan airport. “Dry”: no rainfall for previous 3 days; “Heavy”: more than 0.5 inches in previous 3 days; “Damp” and/or rain distant in time: any rain < 0.15 inches at least two or three days previous to sampling and/or 0.1 inches in previous day; “Light rain”: between 0.1 and 0.5 inches in previous day and/or between 0.15 and 0.5 in two previous days.
1
10
100
1000
10000
100000
174 074 172 070
1
10
100
1000
10000
100000
Alewife Brook Upper Mystic Lower Mystic Basin Mystic mouth
Heavy RainLight RainDampDry Heavy RainLight RainDampDry
Little R. Little R., MBTA Mass. Ave bridge Mystic Valley Parkway Alewife ramp bridge, near Mystic confl.
Upstream of CSOs Downstream of Downstream of Downstream of all CAM004, MWR003 CAM400 Alewife CSOs (incl.
CAM001+2, SOM001A, CAM401)
Upstream Downstream Upstream Downstream
Alewife Brook, CSO outfall sampling stations (note change in scale)
Enterococcus by rainfall condition, 2010
colo
nies
/100
mL
colo
nies
/100
mL
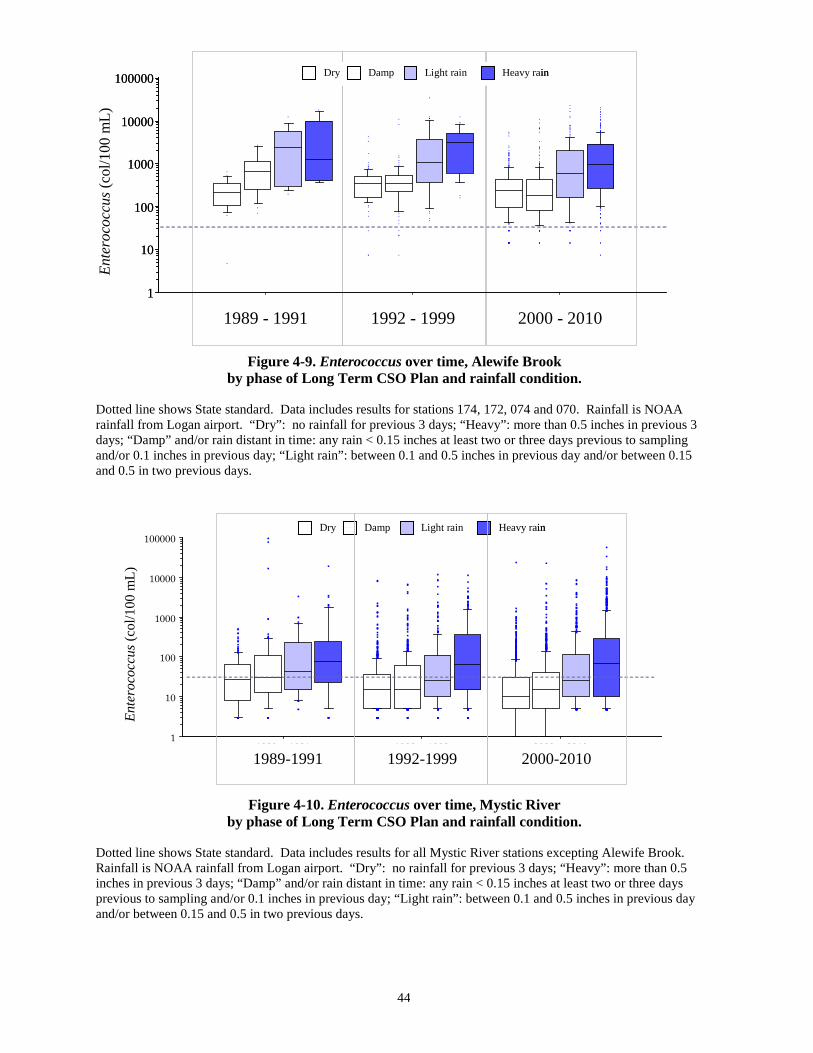
44
Figure 4-9. Enterococcus over time, Alewife Brook
by phase of Long Term CSO Plan and rainfall condition. Dotted line shows State standard. Data includes results for stations 174, 172, 074 and 070. Rainfall is NOAA rainfall from Logan airport. “Dry”: no rainfall for previous 3 days; “Heavy”: more than 0.5 inches in previous 3 days; “Damp” and/or rain distant in time: any rain < 0.15 inches at least two or three days previous to sampling and/or 0.1 inches in previous day; “Light rain”: between 0.1 and 0.5 inches in previous day and/or between 0.15 and 0.5 in two previous days.
Figure 4-10. Enterococcus over time, Mystic River
by phase of Long Term CSO Plan and rainfall condition. Dotted line shows State standard. Data includes results for all Mystic River stations excepting Alewife Brook. Rainfall is NOAA rainfall from Logan airport. “Dry”: no rainfall for previous 3 days; “Heavy”: more than 0.5 inches in previous 3 days; “Damp” and/or rain distant in time: any rain < 0.15 inches at least two or three days previous to sampling and/or 0.1 inches in previous day; “Light rain”: between 0.1 and 0.5 inches in previous day and/or between 0.15 and 0.5 in two previous days.
1989 - 1991 1992 - 1999 2000 - 2010
Ente
roco
ccus
(col
/100
mL)
1989-1991 1992-1997 1998-20071
10
100
1000
10000
100000
1
10
100
1000
10000
100000
Heavy rainLight rainDampDry Heavy rainLight rainDampDry
Heavy rainLight rainDampDry Heavy rainLight rainDampDry
1
10
100
1000
10000
100000
1989 to 1991 1992 to 1999 2000 to 2010
1989-1991 1992-1999 2000-2010
Ente
roco
ccus
(col
/100
mL)
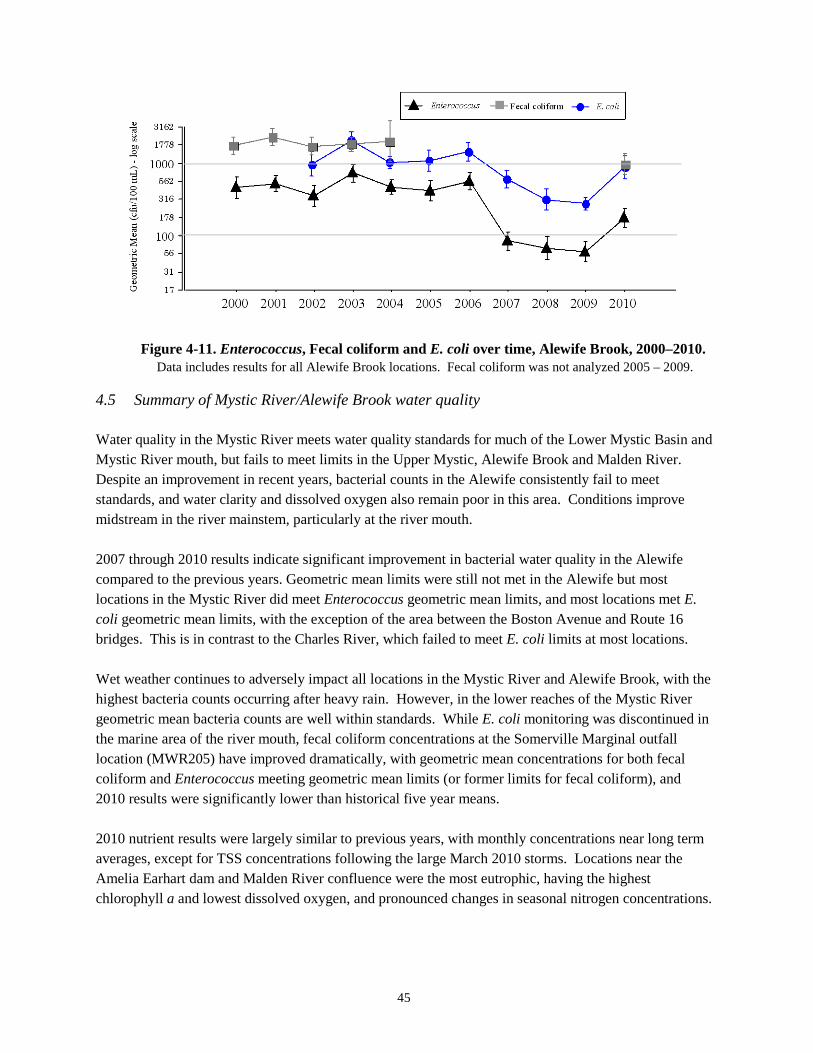
45
Figure 4-11. Enterococcus, Fecal coliform and E. coli over time, Alewife Brook, 2000–2010. Data includes results for all Alewife Brook locations. Fecal coliform was not analyzed 2005 – 2009.
4.5 Summary of Mystic River/Alewife Brook water quality Water quality in the Mystic River meets water quality standards for much of the Lower Mystic Basin and Mystic River mouth, but fails to meet limits in the Upper Mystic, Alewife Brook and Malden River. Despite an improvement in recent years, bacterial counts in the Alewife consistently fail to meet standards, and water clarity and dissolved oxygen also remain poor in this area. Conditions improve midstream in the river mainstem, particularly at the river mouth. 2007 through 2010 results indicate significant improvement in bacterial water quality in the Alewife compared to the previous years. Geometric mean limits were still not met in the Alewife but most locations in the Mystic River did meet Enterococcus geometric mean limits, and most locations met E. coli geometric mean limits, with the exception of the area between the Boston Avenue and Route 16 bridges. This is in contrast to the Charles River, which failed to meet E. coli limits at most locations. Wet weather continues to adversely impact all locations in the Mystic River and Alewife Brook, with the highest bacteria counts occurring after heavy rain. However, in the lower reaches of the Mystic River geometric mean bacteria counts are well within standards. While E. coli monitoring was discontinued in the marine area of the river mouth, fecal coliform concentrations at the Somerville Marginal outfall location (MWR205) have improved dramatically, with geometric mean concentrations for both fecal coliform and Enterococcus meeting geometric mean limits (or former limits for fecal coliform), and 2010 results were significantly lower than historical five year means. 2010 nutrient results were largely similar to previous years, with monthly concentrations near long term averages, except for TSS concentrations following the large March 2010 storms. Locations near the Amelia Earhart dam and Malden River confluence were the most eutrophic, having the highest chlorophyll a and lowest dissolved oxygen, and pronounced changes in seasonal nitrogen concentrations.
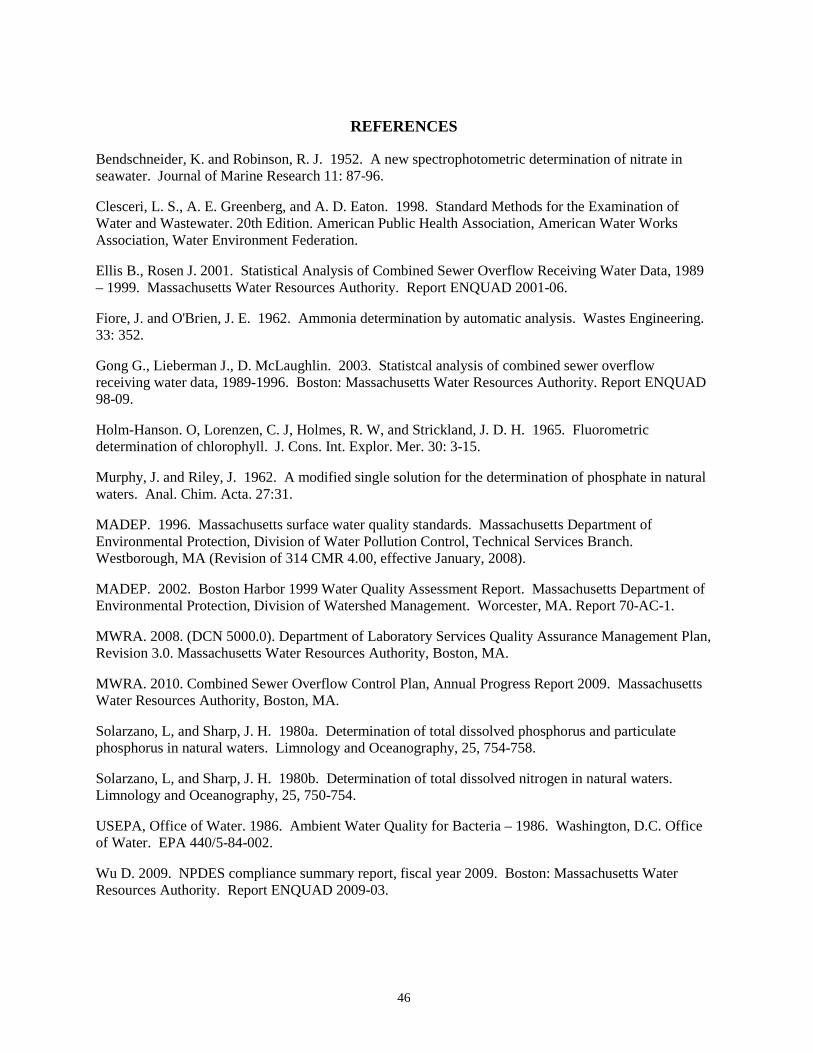
46
REFERENCES
Bendschneider, K. and Robinson, R. J. 1952. A new spectrophotometric determination of nitrate in seawater. Journal of Marine Research 11: 87-96. Clesceri, L. S., A. E. Greenberg, and A. D. Eaton. 1998. Standard Methods for the Examination of Water and Wastewater. 20th Edition. American Public Health Association, American Water Works Association, Water Environment Federation. Ellis B., Rosen J. 2001. Statistical Analysis of Combined Sewer Overflow Receiving Water Data, 1989 – 1999. Massachusetts Water Resources Authority. Report ENQUAD 2001-06. Fiore, J. and O'Brien, J. E. 1962. Ammonia determination by automatic analysis. Wastes Engineering. 33: 352. Gong G., Lieberman J., D. McLaughlin. 2003. Statistcal analysis of combined sewer overflow receiving water data, 1989-1996. Boston: Massachusetts Water Resources Authority. Report ENQUAD 98-09. Holm-Hanson. O, Lorenzen, C. J, Holmes, R. W, and Strickland, J. D. H. 1965. Fluorometric determination of chlorophyll. J. Cons. Int. Explor. Mer. 30: 3-15. Murphy, J. and Riley, J. 1962. A modified single solution for the determination of phosphate in natural waters. Anal. Chim. Acta. 27:31. MADEP. 1996. Massachusetts surface water quality standards. Massachusetts Department of Environmental Protection, Division of Water Pollution Control, Technical Services Branch. Westborough, MA (Revision of 314 CMR 4.00, effective January, 2008). MADEP. 2002. Boston Harbor 1999 Water Quality Assessment Report. Massachusetts Department of Environmental Protection, Division of Watershed Management. Worcester, MA. Report 70-AC-1. MWRA. 2008. (DCN 5000.0). Department of Laboratory Services Quality Assurance Management Plan, Revision 3.0. Massachusetts Water Resources Authority, Boston, MA. MWRA. 2010. Combined Sewer Overflow Control Plan, Annual Progress Report 2009. Massachusetts Water Resources Authority, Boston, MA. Solarzano, L, and Sharp, J. H. 1980a. Determination of total dissolved phosphorus and particulate phosphorus in natural waters. Limnology and Oceanography, 25, 754-758. Solarzano, L, and Sharp, J. H. 1980b. Determination of total dissolved nitrogen in natural waters. Limnology and Oceanography, 25, 750-754. USEPA, Office of Water. 1986. Ambient Water Quality for Bacteria – 1986. Washington, D.C. Office of Water. EPA 440/5-84-002. Wu D. 2009. NPDES compliance summary report, fiscal year 2009. Boston: Massachusetts Water Resources Authority. Report ENQUAD 2009-03.
Massachusetts Water Resources Authority Charlestown Navy Yard
100 First Avenue Boston, MA 02129
(617) 242-6000 http://www.mwra.state.ma.us


