1
UNIVERSITY OF THE AEGEAN DEPARTMENT OF SHIPPING, TRADE AND TRANSPORT
«ΤΟ SCRUB OR ΝΟΤ ΤΟ SCRUB: THE SHIP-OWNERS’ DILEMMA»
POST GRADUATE THESIS FOR MSc “SHIPPING, TRADE AND
TRANSPORT”.
GOURGIOTI ALEXANDRA
22/9/2018
CHIOS 2018
2
«TO SCRUB OR NOT TO SCRUB: THE SHIP-OWNERS’ DILEMMA»
22/9/2018
Post Graduate Thesis for MSc
“Shipping, Trade and Transport”
School of Business
Author: Gourgioti Alexandra
Supervising professor: Ioannis N. Lagoudis
Director of studies: Seraphim Kapros
CHIOS
3
Contents
List of Abbreviations ................................................................................ 4
Acknowledgements ................................................................................. 5
Abstract ................................................................................................... 5
List of figures ........................................................................................... 6
List of tables ............................................................................................. 7
1. Introduction ....................................................................................... 7
2. Literature review ............................................................................. 14
2.1 Exhaust Gas Cleaning Systems (EGCS) or Scrubbers ................... 16
2.1.1 Wet scrubbers ......................................................................... 17
2.1.2 Dry scrubbers .......................................................................... 23
2.1.3 Which scrubber: an overview .................................................. 24
2.1.4 Why use scrubbers .................................................................. 25
2.1.5 EGCS, maintenance and monitoring ...................................... 28
2.2 Alternative Fuels ........................................................................ 31
2.2.1 HFO, MGO and MDO .............................................................. 31
2.2.2 Liquefied Natural Gas (LNG) ................................................... 35
2.2.2.1 LNG and greenhouse gases ................................................. 35
2.2.2.2 LNG advantages and disadvantages .................................... 37
2.2.2.3 LNG in new buildings and existing vessels ........................... 39
2.2.3 Methanol ............................................................................... 41
4
3. Methodology ................................................................................... 42
4. Results ............................................................................................. 45
5. Conclusion ....................................................................................... 50
Bibliography ........................................................................................... 53
List of Abbreviations
CO2 Carbon Dioxide
GHG Greenhouse Gas
EGCS Exhaust Gas Cleaning System
EGCSA Exhaust Gas Cleaning Systems Association
ECA Emission Control Area
EU European Union
HFO Heavy Fuel Oil
ICS International Chamber of Shipping
IFO Intermediate Fuel Oil
IMO International Maritime Organization
ISO International Organization for Standardization
LSHFO Low Sulfur Heavy Fuel Oil
LNG Liquefied Natural Gas
MARPOL International Convention of the Prevention of Pollution
from Ships
MDO Marine Diesel Oil
MED Marine Equipment Directive
MEPC Marine Environmental Protection Committee
MGO Marine Gas Oil
MT Metric tons
NOx Nitrogen Oxides
ODS Ozone depleting substances
OMM Onboard Monitoring Manual
5
OPRC Oil Pollution Preparedness, Response and Co-operation
PAH Polycyclic Aromatic Hydrocarbons
PM Particulate Matter
SECP SOx Emissions Compliance Plan
SOLAS International Convention for the Safety at Sea
SOx Sulfur Oxides
ULSFO Ultra-Low Sulfur Fuel Oil Low
VOC Volatile organic compounds
Acknowledgements
First of all, I would like to thank my supervising professor Dr. Ioannis
Lagoudis for his support and help. Without him it would be impossible
for me to complete this thesis. His patience, his willingness to help me as
well as his instructions helped me to curry out my work and gave me the
opportunity to understand better the world of research.
I would like to thank my thesis committee members.
I would also like to thank my family for their support and help all this
time. They once again stood by my side through all this process and
helped me in every possible way.
Abstract
In this thesis the complexity of the factors related to IMO 2020 Sulphur
Cap compliance, is displayed. The most applicable means that can
contribute to the elimination of the pollutant factors are mentioned. The
6
most promising one, the Exhaust Gas Cleaning System (EGCS) is
thoroughly examined. Furthermore, the most common alternative
bunker fuels are also inspected, as possible choices. Taking into
consideration that all stakeholders need to invest a significant amount of
money, this work tries to answer the sector’s constant question,
whether EGCS is the “solution to the pollution”. The economic aspect of
the issue is examined through the implementation of an economic
assessment scenario. The outcome is a series of useful deductions. The
most apparent result is that scrubbers are more suitable for bigger and
new vessels. Nevertheless, as an overall conclusion it becomes obvious
that there are many ways to eliminate harmful exhaust gases. More
integrated research must be carried out as soon as possible, so that all
members of the marine sector’s community, after taking into
consideration all factors involved, will select the most suitable means in
order to comply with international regulations.
List of figures
Figure 1. SOx global emission ................................................................... 9
Figure 2. MARPOL ANNEX VI fuel sulfur limits ........................................ 10
Figure 3. ECA world map ........................................................................ 10
Figure 4. CO2 emission in different transportation means .................... 11
Figure 5. NOx limit on new engines in Large Ocean Going Vessels ......... 12
Figure 6. Exhaust Gas Cleaning Systems classification ......................... 16
Figure 7. Wet scrubber .......................................................................... 18
Figure 8. Membrane scrubber ................................................................ 22
Figure 9. Dry scrubber ............................................................................ 23
Figure 10. Types of fuels used in maritime sector .................................. 31
Figure 11. Petroleum products made from a barrel crude oil ................ 32

7
Figure 12. Average HFO and MGO Rotterdam spot prices in $ / bbl. ... 34
Figure 13. IMO agreement for reducing ships’ CO2 ................................ 36
Figure 14. LNG facilities in central and eastern Europe ....................... 38
Figure 15. Distribution of scrubber/LNG in different types of ships ....... 40
Figure 16. World Total Final Consumption by fuel................................ 41
Figure 17. 24-month fuel consumption in $ for a Handy tanker ............ 46
Figure 18. 24-month fuel consumption for an Aframax tanker .............. 47
Figure 19. 24-month fuel consumption in $ for a Panamax tanker ........ 47
Figure 20. 24-month fuel consumption in $ for a VLCC tanker ............... 48
Figure 21. 24-month fuel consumption in $ for a ULCC tanker ............... 49
Figure 22. Ship owner options for compliance to new regulations ........ 42
Figure 23. Percentage of LNG new build ships. ...................................... 43
List of tables
Table 1. Annual (280 sailing days) fuel consumption in $ for five
different types of tankers ...................................................................... 45
1. Introduction
Shipping is the most important means of transport, as the international
fleet is carrying annually almost 90% of the total merchandise volume
(UNCTAD 2011). Vessels rely on fossil fuel, and as a result they affect the
sensitive ecosystems as well as human health due to the exhaust gases

8
that they discharge. The environmental impact of the sector depends on
many factors, like a ship’s engine type, route, age, cargo and operation
condition (Entec, 2005 a). The most effective way to reduce the adverse
effects of shipping industry’s activities is to control the fuels used by the
sector. The traditional sources of energy for vessels are diesel oil and
heavy fuel oil, whose combustion releases various gases as NOx and SOx
in the atmosphere. These fuels have worked competently during the
recent decades, particularly with regard to adaptability, performance
and safety. But in the last few years some issues have arisen due to fossil
fuel use. These issues include «the barriers of compliance with the new
emission regulations, the increase of the fuel cost…, and finally the
sustainability issue» (Seddiek and Elgohary, 2014).
As the world’s population is rapidly increasing, the need for
transportation is growing fast, too. But this urge for trade means more
harmful emissions. It is very probable that whatever is done on land in
the direction of the protection of the environment and public health
from emission reduction of land-based sources (like vehicles and
factories), is diminished by the rising ships’ air pollution (Yang et al.
2012).
In 2016 new requirements for sulfur limits in the marine industry were
adopted by the International Maritime Organization (IMO). Established
formally in 1948 at an international conference in Geneva, IMO is a
United Nations’ specialized agency whose mission is to regulate ships
engaged in international trade, promote maritime safety and protect the
environment.

9
Figure 1. SOx global emission
Source: The Shipping Observer
The IMO’s MARPOL Annex VI “Prevention of Air Pollution from Ships”
was adopted in 1997 and came into force in 2005, after acquiring the
requisite number of signatories and tonnage. According to the
International Maritime Organization’s official statement “The
regulations for the Prevention of Air Pollution from Ships (Annex VI) seek
to control airborne emissions from ships (sulfur oxides, nitrogen oxides),
ozone depleting substances (ODS), volatile organic compounds (VOC)
and shipboard incineration and their contribution to local and global air
pollution, human health issues and environmental problems”. At the
beginning the sulfur cap was set at 4,5% , then, after January the 1st
2012, it was set at 3,5%.

10
Figure 2. MARPOL ANNEX VI fuel sulfur limits Source: U.S. Energy Information Administration, based on MARPOL
In 1997 Emission Control Areas (ECAs) were established. They are sea
areas where more stringent limitations have been applied, regarding
SOx and PM emissions, extending 200 nautical miles from the coast. The
ECAs include Baltic Sea, North Sea, most of USA and Canadian coast
(North American ECA), Puerto Rico and the US Virgin Islands (US
Caribbean ECA).
Figure 3. ECA world map
Map By Thor Marine Trading
11
Annex VI defines two sets of emission and fuel quality requirements: (1)
global requirements, and (2) more stringent requirements applicable to
ships in ECAs. So, the new limit outside the ECA areas was set at 0,5%
m/m whereas in the ECAs the limit is already 0,1% m/m. More
accurately, this measure has been implemented since the 1st of January
2015. Additionally, in July 2017 the MEPC-71 made it clear that the
shipping industry should comply with these regulations up until January
the 1st 2020.
Apart from the International Maritime Organization (IMO), the European
Union (EU), the US Environmental Protection Agency (EPA) and the
California Air Resources Board (CARB), even port administrations, have
introduced regulations in order to reduce the contribution of shipping to
global emissions. More precisely, the European Union has adopted a
series of strategies with a view to reducing the emissions that are being
released into the atmosphere by ships. In 2012 with Directive
2012/33/EU, European Union tried to comply fully with the regulations
that were adopted by IMO regarding the sulfur limits.
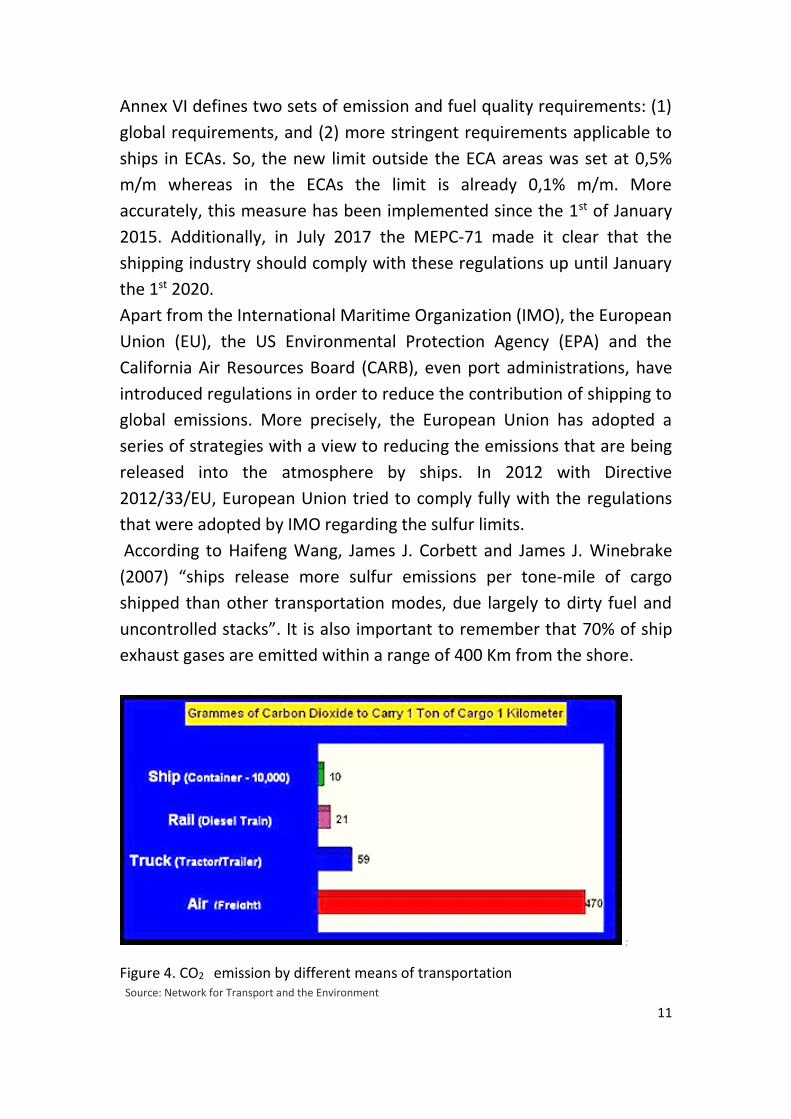
According to Haifeng Wang, James J. Corbett and James J. Winebrake
(2007) “ships release more sulfur emissions per tone-mile of cargo
shipped than other transportation modes, due largely to dirty fuel and
uncontrolled stacks”. It is also important to remember that 70% of ship
exhaust gases are emitted within a range of 400 Km from the shore.
:
Figure 4. CO2 emission by different means of transportation Source: Network for Transport and the Environment

12
Exhaust gases contain mainly Nitrogen (N2), Water Vapor (H2O), Oxygen-
(O2), Carbon Dioxide (CO2), Hydrocarbons (HC), Particulate matter (PM),
Carbon Monoxide (CO), Nitrogen Oxides (NOx) and Sulphur Oxides (SOx).
Figure 5. NOx limit on new engines in Large Ocean-Going Vessels
Source: Diesel Technology Forum
This work searches the best possible answer to the fundamental
question that marine industry is facing, namely what method to choose
in order to comply with the new regulations as far as exhaust gases are
concerned, with focus on SOx emissions. This is an issue of paramount
significance, since it will affect not only the great majority of the 60.000
vessels of the world fleet but also a number of sensitive sectors that are
related to the marine industry. Changes will have an impact on the
global economy, the environment and also on human health. Hence a
vast number of scientists along with marine sector specialists are
painstakingly examining all aspects involved.
Using high resolution emissions inventories, integrated atmospheric
models and health risk functions Sofiev, Winebrake et al. (2018)
attempted an assessment of ship-related pollution impacts in 2020 with
and without the low sulfur cap. They found that “Cleaner marine fuels
will reduce ship-related premature mortality and morbidity by 34% and
54% respectively. Despite these reductions, low-sulfur marine fuels will
13
still account for 250k deaths and 6,4M childhood asthma cases annually,
and more stringent standards beyond 2020 may provide additional
health benefits”.
The subject whose investigation should be of top priority is the
economic impingement of every possible alternative method that can be
applied. CAPEX and OPEX data are cross checked and different scenario
models are examined by the accounting departments of shipping
companies. At the same time, the bunkering sector has to cope with the
upcoming switchover from the “good old” HFO to new types of fuels,
whose future price can hardly be predicted. Great amounts of funds
have to be invested on new vessels or retrofitting infrastructure while
refineries have to make their own decisions regarding which technology
they should adopt.
Another significant aspect is time. It is estimated that only 1% of the
world fleet has already complied with the IMO’s 2020 regulations
(Grimmer, R. and Myers, M. 2018). Thus, shipyards will face great
numbers of new buildings or retrofits in the narrow time space left till
the 1st of January 2020. Given that ship-owners haven’t reached a
decision and bunkering industry is hesitant, the time frame is bound to
taper even more.
A key issue that should also be considered is that all alternative methods
or fuels have some disadvantages, often difficult to content with.
In addition to all aforementioned, the shipping sector stakeholders must
take into account possible future regulations that may create a stricter
frame for the maritime industry such as the expansion of ECA zones,
along with rules already agreed, as for example the IMO’s 2025 EEDI
Requirements.
This thesis is dealing with the economic perspective of a ship owner’s
decision making process. More specifically, it exhibits a certain path that
stakeholders can follow in their decision making process as far as
viability of scrubber installation is concerned. The methodology used
contains the execution of an assessment model with stress to EGCS
installation expenses refund, in comparison to alternative bunkering
fuels costs.

14
The study is developed in five Chapters. The marine sector exhaust
gases, the basic grid of already implemented regulations, new
requirements and norms along with their amendments, are presented in
Introduction (Chapter 1). In Chapter 2 through Literature Review helps
us understand how science and research come to stakeholders’ aid by
providing new technical solutions, such as the Exhaust Gas Cleaning
Systems (EGCS) or alternative propulsion fuels, like MGO,MDO, LNG and
Methanol. Chapter 3 contains the Methodology used in this thesis, an
economic assessment scenario that is being implemented on specific
types of tankers with the installation of scrubbers taken into account. In
Chapter 4 the derived Results from the methodology applied, are
examined. In the 5th Chapter the key deductions of the work are
summarized and some general outcomes are being presented.
2. Literature review
A thorough examination of emission regulations as mentioned, shows
that the situation has already changed and many more developments
are yet to come in the near future. Globally, a vast number of private
sector researchers along with public institutes, are putting a great deal
of effort to track down the best way to achieve rule compliance.
Numerous publications, issued from institutes (ABS Advisory on EGCS,
2018; Germanischer Lloyd, 2013; IVL Swedish Environmental Research
Institute, 2016 ), as well as researchers of the private sector (Barsamian
and Curcio, 2017 ) along with an increasing number of thesis studies
(Duursema, 2015; Mansson, 2017; Sastre Buades, 2017; Serwah, 2016;
Kokkinos, 2018; Lahtinen, 2016) and articles, focus on the challenges
shipping industry is facing.
In their publication “Emissions Tradeoffs among alternative marine
fuels: Total fuel analysis of residual oil, MGO and MDO” (2008), James J.
Corbett and James J. Winebrake, through a total fuel cycle analysis,
estimate and compare emissions of CO2 and SOx for RO, MGO and MDO
fuels used in a certain type of ship (container). After the presentation of
the results derived by an analysis of three variables (i.e. sulfur content,
15
energy content and fuel density), they demonstrate the need for the
refinery industry to adopt improvement measures in order to eliminate
vessels’ emissions.
In their study “Assessment of cost as a function of abatement options in
maritime ECAs” (2015), Haakon Lindstad, Inge Sandaas and Anders H.
Stromman make an assessment of costs and fuel consumption of two
types of ships operating in and out of ECA zones, taking into
consideration different sea and weather conditions and the area they
are traversing. An analysis of abatement options assessment is applied
regarding fuel consumption in ECAs.
Liping Jiang, Jacob Kronbak and Leise Pil Christensen, in their work “The
costs and benefits of sulfur reduction measures: Sulfur scrubbers versus
marine gas oil” (2014) are proposing an economic analysis of measures
for ships’ emissions and pollution reduction. The measures are
compared regarding their equivalent annual net benefits, using fuel cost
fluctuations and the ship’s age. They also apply a trip-based method for
estimating ships’ emissions under certain circumstances.
In their study “Adapting the shipping sector to stricter emissions
regulations: Fuel switching or installing a scrubber?”(2017) Luis Maria
Abadie, Nestor Goichoechea and Ibon Galarraga are featuring an
economic assessment of the alternative techniques, by adopting a
stochastic model for various fuel prices. Thanks to that method the
resulting estimations can help marine industry’s decision makers pick
the most feasible option for their vessels.
In this thesis, emphasis is given to the financial perspective of the
various alternative options. As already cited, the impact on all affected
sectors will be unprecedented. By adopting an economic assessment for
scrubber use but also different alternative fuels in a variety of ship types,
it becomes more obvious which method achieves the best return of
invested funds, a critical factor that all ship-owners take into account in
their decision making process.

16
2.1 Exhaust Gas Cleaning Systems (EGCS) or Scrubbers
Figure 6. Exhaust Gas Cleaning Systems classification
Source: International Maritime Organization, 2016
Exhaust Gas Cleaning Systems are devices that are installed in the
exhaust system of ships in order to clean the gases released in the
atmosphere from marine diesel engines and oil-fired boilers. This way a
ship can discharge only a minimum amount of SΟx and reduced
particulate matter, as if it was burning fuel with a sulfur content less
than 0,1%.
Scrubbers achieve that by using either sea water, chemically treated
fresh water, or dry substances. After scrubbing, the clean exhaust gas is
released into the atmosphere. It is estimated that scrubbers remove up
to 98% SOx (Kristensen, 2012) and 40-75% PM. The substance used for
the cleaning process creates a waste stream which has to be processed
before discharged over board or stored.
As for discharged waste water, the European Union compels each
Member State to comply with the water quality standards that are
included in the Water Framework Directive (WFD). This particular
decision has led a number of state-members of the EU to ban the
17
discharge of exhaust gas cleaning system’s wash water in their territorial
waters. For instance, Germany prohibits the discharge of wash water
that comes from a scrubber system in its inland waterways, its rivers and
some of its ports. Belgium went one step further, by forbidding the
discharge of scrubber’s waste water from the ships within three nautical
miles of its coast. Additionally, since 2015 IMO has put a specification of
certain criteria of the wash water discharge. More specifically, the wash
water pH must not exceed 6,5. Additionally, the MARPOL Annexes VI
Regulation 17 refers to the residues that can be found in the scrubber
system’s wash water. These residues must be carefully stored onboard
and be delivered to appropriate facilities on shore. The discharge of such
substances is prohibited under any circumstances. It is very important
for crew members to follow this procedure very carefully and record
every step of it in the EGCS’s log book, which should be kept onboard.
The European Union has made it mandatory for ships that want to install
an exhaust gas cleaning system (EGCS) and operating under the flag of
any Member State, to be certified by the MED which stands for Marine
Equipment Directive. At the same time, those EGCS must also meet the
standards of the IMO.
2.1.1 Wet scrubbers
The most common type of scrubbers is the wet-scrubber. The general
idea is to mix exhaust gas with water in order to remove sulfur, as SOx
gases are water soluble. After being liquefied, they form acids that react
with alkaline water: either natural sea water, or fresh water with added
substances. Thanks to this process, the once harmful SO2 ends up to
form sulfate salt, which occurs naturally in the sea and is soluble as well.
This process is not something new. The first scrubbers were used to
remove carbon dioxide from early submarines.
Wet scrubbers fall into, three categories: Open loop, closed loop and
hybrid scrubbers.
Open loop is the system that is being provided with seawater. It is the
high alkalinity of the seawater that neutralizes the SOx in the exhaust
gases.

18
In wet open loop scrubbers the water is used only once and then, after
treatment, it is discharged overboard. It has the plus of working with
very few moving parts and requiring hydraulic pressure provided by a
pump. Though it requires regular de-fouling and operational checks, it is
a low maintenance system which consists of three different parts.
Figure 7. Wet scrubber
Source: Ionada.com
The first part is the exhaust gas cleaning unit that provides the suitable
vessel for the emmissions, that come from the boiler or the engine of
the ship, to be stored and cleaned by the water.
In this part of the wet scrubber’s system, the exhaust gases are being
cooled to 160-180 oC in an exhaust gas economizer. Then the gases are
treated in an ejector where water is ejected and soot particles are
removed. Finally the exhaust gases are being led through an absorption

19
duct, sprayed with water and cleaned from remaining SOx. It is here that
the alkaline components in the seawater neutralize sulfuric acid.
The second part of the scrubber is a special wash water treatment plant
that brushes away the pollutants from the water. In the treatment
device the wash water is cleaned and residuals are removed by filters.
The last part of the whole process is the sludge storing facilities. Vessels
are not allowed to burn the residues onboard, so they are obliged to
reserve those pollutants until they find suitable disposal facilities ashore.
A monitor system that records air and water parameters is also required.
The open loop is the most economically attractive type of wet exhaust
gas cleaning system. It is also the simplest. Crews seem to prefer it too
and that is very important because they are the ones that handle it
onboard. When crew members are accustomed to a certain machine or
a specific mechanism, the error percentage can drop dramatically and so
do costs.
It must be stressed that the function of an open loop scrubber depends
on the chemical composition of the water in which the vessel is
operating. For example, an open loop scrubber system might face some
problems in certain areas where the salinity or the alkalinity of the water
is low. So it is very important for both the shipping company and the
designing team to take into consideration the area in which the vessel is
meant to operate. If the alkalinity of the water is lower than required,
then the scrubber system will not be able to function well and the
operator should switch to using low sulfur fuel oil in order to meet the
IMO’s requirements regarding sulfur emissions.
It is also important to emphasize the fact that shipping companies which
choose to install an exhaust gas cleaning system will have to constantly
monitor its performance. According to the revised EU sulfur directive
“ships using alternative emission abatement methods shall continuously
achieve reductions of SOx emissions that are equivalent to the
reductions that would be achieved by using compliant marine fuel”. So it
is obvious that the ship-owners who install exhaust gas cleaning systems
on their vessels should also equip them with a highly sophisticated
emissions monitoring system.
20
In closed loop scrubbers on the other hand, the water, usually
freshwater with an additive that increases its alkalinity, is cleaned to
become suitable for recirculation and be reused in a continuous closed
loop, and not only once, as in open loop scrubbers. The additive needed
is usually aqueous sodium hydroxide, known as caustic soda (NaOH).
During treatment, residues are removed from the dirty washwater, and
the cleaned water is dosed with NaOH to restore its alkalinity, before
returning to the scrubber tower.
The use of closed loop systems is preferred under certain circumstances.
For example when the ship is in an area where the water discharge is
prohibited due to strict regulations, when the vessel is moored at a port,
or traveling in river estuaries were water alkalinity might be low. The
fact that the chemical composition of the water, in which a ship is
operating, does not affect the way the scrubber is operating, is an
advantage.
By ensuring high levels of alkalinity, owing to caustic soda injection, this
method uses half the wash water that would be needed in an open loop
scrubber and of course, at the same time, it achieves the same level of
efficiency. A closed loop system gives the operator the ability to
constantly control alkalinity levels, thus creating a stable environment
inside the scrubber system.
Nevertheless there are also some drawbacks regarding the closed loop
system’s function. Due to the continuous recirculation of the water
inside the system, monitoring its quality becomes more difficult, as the
water’s color is getting darker. Especially when it comes to the
measurement of the Polycyclic Aromatic Hydrocarbon (PAH) levels inside
the system, every mistake can cost thousands of dollars in fines for the
shipping company owning the vessel.
Closed loop systems are also more complex and more costly. It is also
possible that during their handling some problems may emerge. The
dangerous nature of the caustic soda makes the use of special acid-
resistant material imperative, especially in the parts of the scrubber
system that have a greater concentration of acids. A good example of

21
such a material is the duplex stainless steel which is extremely corrosive-
resistant.
Ship crews must also be aware of safety procedures when handling this
corrosive substance which can harm unprotected eyes and tissue.
Because a buffer tank is needed (and this is probably the system’s major
drawback, since this wastewater storage tank requires space) as well as
a heat exchanger, pumps, strainers, a sodium hydroxide unit and a water
treatment device, closed loop systems are more costly to run.
Another type of wet scrubber is the hybrid type. This type allows
switching between open and closed loop systems, offering the
advantages of both. They operate as open loop when in the open ocean
and as closed when the vessel is sailing in protected areas or near the
coastline. The conversion from open loop to closed is done by changing
the circulation pump suction from seawater to the circulating tank and
by sending wash water to the circulation tank instead of the overboard
discharge.
This type of scrubber has also its disadvantages. For example, it is more
complicated when compared to the two other types of scrubbers. It also
requires more space on the ship than a wet or a dry scrubber system.
The required handling of the caustic soda (NaOH) and the residues,
generate higher operational expenditure.
22
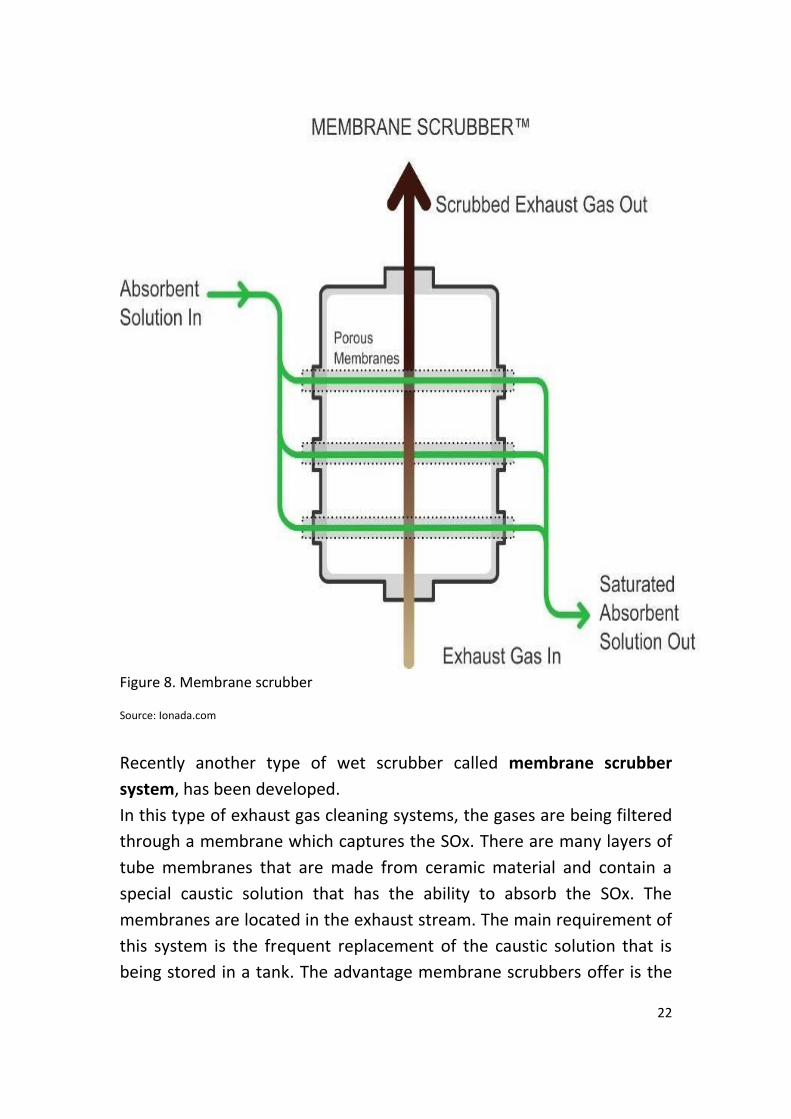
Figure 8. Membrane scrubber
Source: Ionada.com
Recently another type of wet scrubber called membrane scrubber
system, has been developed.
In this type of exhaust gas cleaning systems, the gases are being filtered
through a membrane which captures the SOx. There are many layers of
tube membranes that are made from ceramic material and contain a
special caustic solution that has the ability to absorb the SOx. The
membranes are located in the exhaust stream. The main requirement of
this system is the frequent replacement of the caustic solution that is
being stored in a tank. The advantage membrane scrubbers offer is the

23
lack of wash water. On the other hand, this type of wet scrubber has a
higher cost for the shipping companies, as it uses caustic soda.
2.1.2 Dry scrubbers
Figure 9. Dry scrubber
Source: Ionada.com
The dry exhaust gas cleaning system’s concept is based on the use of a
chemical absorption called chemisorption that doesn’t use water or any
24
liquid as a medium. Entering sidewise in the absorber through a filter or
bed of the absorbent, the exhaust gas streams are cleaned and then exit
from the other side. The residue, calcium sulfate, is then removed from
the bottom of the exhaust gas cleaning system and stored in the vessels’
ballast tanks in order to be disposed of as soon as the ship reaches a
port.
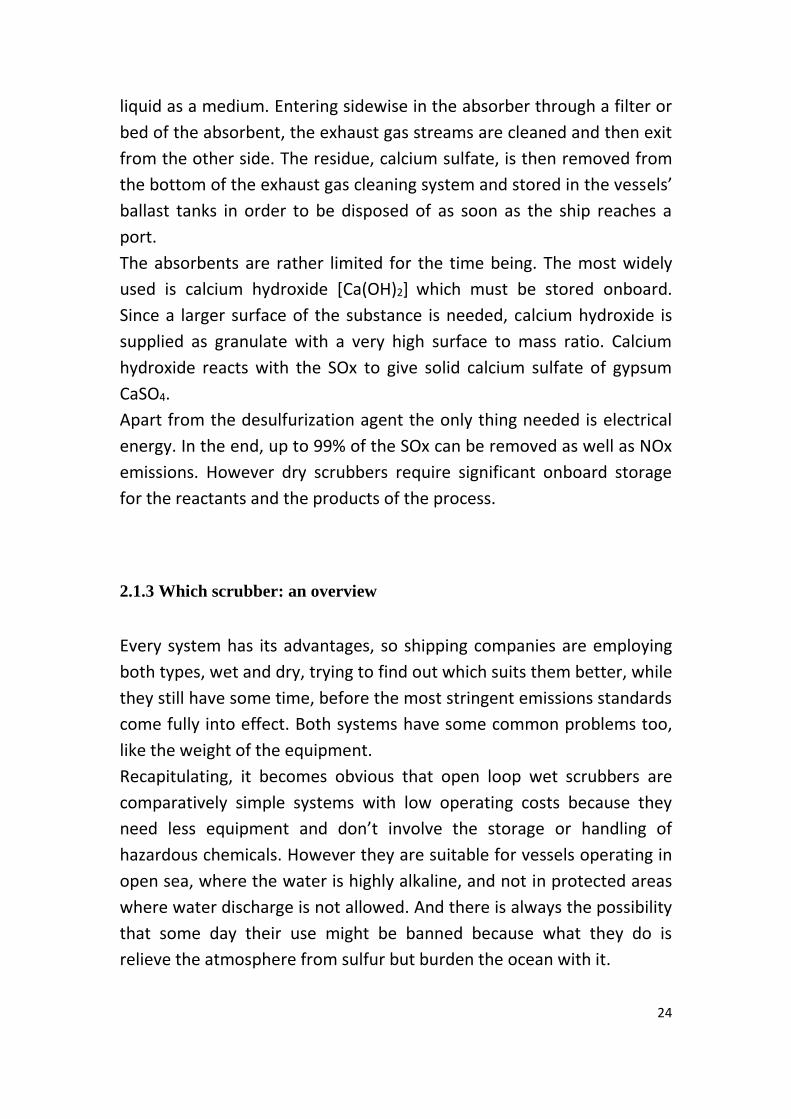
The absorbents are rather limited for the time being. The most widely
used is calcium hydroxide [Ca(OH)2] which must be stored onboard.
Since a larger surface of the substance is needed, calcium hydroxide is
supplied as granulate with a very high surface to mass ratio. Calcium
hydroxide reacts with the SOx to give solid calcium sulfate of gypsum
CaSO4.
Apart from the desulfurization agent the only thing needed is electrical
energy. In the end, up to 99% of the SOx can be removed as well as NOx
emissions. However dry scrubbers require significant onboard storage
for the reactants and the products of the process.
2.1.3 Which scrubber: an overview
Every system has its advantages, so shipping companies are employing
both types, wet and dry, trying to find out which suits them better, while
they still have some time, before the most stringent emissions standards
come fully into effect. Both systems have some common problems too,
like the weight of the equipment.
Recapitulating, it becomes obvious that open loop wet scrubbers are
comparatively simple systems with low operating costs because they
need less equipment and don’t involve the storage or handling of
hazardous chemicals. However they are suitable for vessels operating in
open sea, where the water is highly alkaline, and not in protected areas
where water discharge is not allowed. And there is always the possibility
that some day their use might be banned because what they do is
relieve the atmosphere from sulfur but burden the ocean with it.
25
Closed loop scrubbers, on the other hand, operate in low alkalinity
water. Among their disadvantages is the complexity of their washwater
systems, the additional equipment and the space needed, the risky
handling of hazardous substances, (like NaOH).
Hybrid scrubbers are rather flexible and operate in all waters, regardless
their alkalinity but have not solved the problems such as the lack of
space, system’s complexity and NaOH handling. They are suitable for
operating in all kinds of waters, in open seas and near the coastline and
in operation restricted areas.
2.1.4 Why use scrubbers
One of the many advantages scrubbers offer over other options, is that
they give ship owners the ability to continue using the fuels that they
mainly use and therefore maintain their current practices in supply.
Hence it seems that retrofitting is feasible for many of the ships that
operate today. Naval architects can also design new ships having in mind
the possibility of installing a scrubber later.
Some experts (Jiang, Kronbak and Christensen, 2013) claim that, as far as
scrubbers are concerned, it is slightly preferable for a company to
choose a new build rather than a retrofit, assuming that the scrubber’s
lifespan when it is installed on a new vessel can reach up to 15 years,
whereas in a retrofit it drops to only 12 years. The retrofit is a non viable
solution when the ship is expected to operate for less than 12 years.
Figures are showing that most installations are taking place in shipyards
in Asia and that the 60% represents retrofitting scrubbers in older ships.
According to the Exhaust Gas Cleaning Systems Association (EGCSA), in
the second half of 2018 the overall number of vessels that were
equipped with such a system stood at 983. It is also worth mentioning
that this represents a 50% rise in the number of installations that took
place in just a few months.
Another interesting fact is that at present the companies of the bulk and
the container sector are the ones that prefer this kind of technology
while at the beginning it was the cruise sector that seemed to pave the

26
way. But, as already mentioned, every choice comes with a cost. And in
shipping, costs are usually extremely high. It is estimated that the
average cost for retrofitting a ship by adding a wet scrubber might be
40% higher than a new build (Entec, 2005). The amount of money that
such an installation may require varies from one million to even 5 million
euro per ship. The final cost may reach 8 million euro for some types of
ships. That’s the main reason that led to a huge gap between IMO’s
initial estimations (3.800 vessels) and the final number of ships on which
a scrubber system has been installed.
Another important factor is time, and time, especially in the shipping
industry is money. The installation of a scrubber itself may take up to
several weeks but the research sometimes may require a whole year of
preparations. And that’s because there are many different types of
scrubbers and a lot of different types of vessels. The only thing that is
sure is that companies don’t like taking vessels off hire for weeks.
After choosing the right scrubber system, a company must meticulously
search to find the optimum way to install it. There are many parameters
that should be taken into consideration. For example funnel and engine
casing modifications, additional piping system or tanks installation might
be necessary.
Shipping companies are also concerned about the possibility of a sudden
change in the international legislation that could easily make the use of
scrubbers quite defunct. And this danger might prove to be very real.
The implementation of all these measures is just at its beginning and as
a result there is a great chance that there will be many differentiations
on a legal level as the new rules are being enforced.
There is one more aspect that makes ship-owners skeptical about
installing scrubbers on their ships. Systems like these are space
consuming and that is something that may have an effect on the
capacity of the vessel. Except for the exhaust gas cleaning system itself,
extra space would be needed for the rest of the necessary equipment.
For instance, the installation of a scrubber system would definitely
create the need for a much larger funnel than the one that already exists
27
onboard. It will also require a totally different pump system, as well as
deck platforms and ladder.
The shipping companies must also take into consideration that the
installation of an exhaust gas cleaning system will increase the weight of
the vessel by several tons (Ara Barsamian and Lee Curcio, 2017). On a
ship with an engine power of 4 MW the overall weight of a scrubber can
be 4 tones, while on a vessel with a much stronger engine of 55 MW, the
total operational weight of the scrubber system can reach up to 53,7
tons. The effect that a heavy scrubber has on the stability of a vessel,
especially since scrubber towers are installed high above exhaust
chimneys (ABS, Exhaust Gas Scrubber Systems Advisory), should also be
considered.
Additionally, when a closed loop or a hybrid scrubber system is installed,
the ship will also need a fresh water circulation tank as well as NaOH
safety measures. The pumps are needed in order to give a specific
pressure for the spray nozzles and to take the water in the higher level
of the ship, where the scrubber is placed. All these new requirements for
the exhaust gas cleaning system might cause money loss or higher cost
for the shipping company.
Another possible obstacle regarding the use of a scrubber system is the
aforementioned discharge of the wash water. This process must be
monitored and that is the reason behind the need for data monitoring
devices onboard. According to the Guidelines that were set in 2015,
every exhaust gas cleaning system must include data monitoring devices
in its equipment. These are some of the data that IMO requires to
always be monitored: First of all, wash water is a crucial element of the
wet scrubber’s system. So it is imperative that its flow and pressure are
under constant control. It is also important to measure the pressure of
the exhaust gases inside the scrubber in order to avoid possible failure
of the system in the future. The exhaust gases temperature is also
another factor that must be taken into consideration. Of course, one of
the most significant things that should always be checked during the
EGCS operation process, is the SO2 and CO2 concentrations. Especially

28
the first one is the main variable that would determine the effectiveness
and the success of the EGCS.
As mentioned before, some of the wash water’s characteristics must
also be measured. One of them is the wash water’s pH and also it’s PAH
concentration levels. When the vessel is operating in areas with very
strict wash water discharge regulations there might be a need for
supplementary machinery to be installed. For instance, it would be
preferable to build in a separator that will guarantee the removal of the
extra amount of residues from wash water.
Additional logistics required by water treatment processes and sludge
management are another factor that has to be considered. Increasing
fuel consumption (estimated between 1 and 3%) and maintenance costs
are another drawback.
2.1.5 EGCS, maintenance and monitoring
On the bright side, according to many, an installed scrubber system is
not very demanding when it comes to maintenance, as it might have
been portrayed. But, naturally, it creates the need for an update in the
Plant Maintenance Scheme after the installation of such a system. The
pumping system as well as the pipelines must be inspected. It is
important that it operates properly on a daily basis. Only a few crew
members are needed for overseeing the scrubber, but they must be well
trained and should be able to operate it safely and know how to handle
the chemical substances and the waste water. The right maintenance of
this kind of system requires regular filter cleaning and an inspection of
the whole exhaust gas cleaning system to be executed every six months.
A record book providing the authorities with important information
about the scrubbers system’s condition and way of its maintenance is
also needed onboard. According to IMO’s guidelines “For ships
intending to use an EGCS in part or in full to comply with Regulation 14
of MARPOL Annex VI, a SOx Emissions Compliance Plan (SECP) must be
approved on behalf of the Administration and is required to detail the
method of compliance for all fuel oil combustion machinery installed
29
onboard”. It is more than obvious that the International Maritime
Organization with this declaration is trying to avoid the any uncertainty
that may occur in the future.
Another document that must be carried onboard is the Onboard
Monitoring Manual (OMM). It must have the approval of the ship’s flag
state. The OMM according to the principles that have been set by IMO,
should contain the following:
“Data on the sensors used in the EGCS emissions and wash water
monitoring system, including service, maintenance and calibration.
• The exact location where the exhaust and wash water measurements
are to be taken, together with any necessary supporting services or
systems
• Data from the analyzers that can be used in the emissions and wash
water systems, including operation, service and maintenance
requirements
• Other necessary information and data that will ensure that the
monitoring system is operating properly.
• Details on how the monitoring systems must be surveyed”.
An exhaust gas cleaning system has to pass two levels of approval. First
of all, the scrubber must have the official MARPOL authorization
regarding its environmental performance. Secondly, it should also have
the approval of the classification society. The IMO’s approval has two
options. The first one is the Scheme A. This option is providing the ships
with a pre-certified exhaust gas cleaning system. But this is not as easy
as it may sound, because there are many different factors that should be
taken into consideration before such a complicated system is being
approved. For instance, the monitoring process of the wash water
system is not fully covered by the certificate for air emissions that can be
provided by Scheme A. That is why the most preferable option for the
majority of shipping companies is Scheme B which guarantees the
monitoring system of the scrubber. The system’s supervisor must
constantly follow the international regulations in order to ensure that
the exhaust gas system is operating within the international regulatory
guidelines.

30
There is no clear answer and even the biggest companies of the sector
are very careful with their decision-making process. For example, the
extra cost for the containership industry can easily reach even 34 billion
dollars per year. Consequently, every factor must be examined and
weighted painstakingly. One critical aspect is the vessel’s age. If the ship
is old, for instance it is over 15 years old, the shipping company may
hesitate to install an exhaust gas cleaning system, although many factors
are showing that the cost of the installation can be recovered in a small
period of time that sometimes can be even less than a year. This will be
possible, as ships with a scrubber system installed on them, can freely
use the much cheaper Heavy Fuel Oil.
The new-buildings industry is very different. Ship-owners are more open
to the idea of ordering a ship with a scrubber system installed on it.
There is also one more factor that affects the decision making process.
An exhaust gas cleaning system being retrofitted on a vessel is a time
consuming procedure that may require many weeks, as already
mentioned. If the ship was already in use, the shipping company will lose
money. So it’s much easier and less expensive for the company to install
the system to a “newborn” ship.
Even the availability of space in a dry docking shipyard might be an
important problem as sometimes the ships that have scrubbers installed
on them at the same time are too many.
One more variable of this tricky equation is the economical state of each
company. The installation of a scrubber requires a respectable amount
of money that not every ship owner is ready to spend. Every ship owner
wishes that this sum will be paid off in a certain period of time thanks to
“savings on cash that would be generated from lower fuel prices” (Jiang,
Kronbank and Christensen, 2014). It is estimated that for a large vessel
with a fuel consumption that reaches 70 ton-per-day with an 6,5 million
euro installation cost, the estimated payback period is somewhere
between 18 to 14 months.
Some shipping companies are “going overboard” with scrubbers. But
others don’t. So, the latter, have to change the type of fuel that they are

31
using. The fuel market is already changing and this is just at the
beginning.
Figure 10. Types of fuels used in maritime sector
Source: ΙΜΟ
2.2 Alternative Fuels
2.2.1 HFO, MGO and MDO
Marine fuels are divided into two different categories. The first category
is the HFO (Heavy Fuel Oil) while the second one includes all the
distillate fuels, also known as MGO (Marine Gasoil) (James J. Corbett &
James J. Winebrake, 2012). Sometimes these two types of fuels are
combined and the mixture is a brand new category which is called MDO
(Marine Diesel Oil) or IFO (Intermediate Fuel Oil).
During the distillation process, different products, called distillates, are
being produced. The last are residual fuels used by ships, lubricating oils
etc. Some advanced refineries continue the process increasing the
temperature to 900 oC, giving valuable low molecular weight fuel oils.
The bigger the ship, the heavier the fuel its engines can use. That is why
HFO was the type of fuel that made the ships go round the world for
many years. Global demand for HFO (2016) accounted for 70% of a
mixed grade of bunker fuels.

32
Figure 11. Petroleum products deriving from a barrel crude oil
A residual fuel incurred during distillation, HFO is black in color, and has
a particularly high viscosity and density. Due to these characteristics, it
can’t be pumped in temperatures around 20 oC, so has to be preheated
in the ship’s tanks, at least to 40 oC.
Sulfur content is what differentiates HFO. High sulfur fuel oil (HSFO) has
the highest percentage of sulfur (up to 3,5%), low sulfur fuel oil (LSFO)
has a content of sulfur up to 1,0%, while ultra low sulfur fuel oil’s
(ULSFO) sulfur content reaches 0,1%. The latter is the fuel used in
protected areas.
The term MGO (Marine Gas Oil) describes those marine fuels that are
made solely from distillates. One of the main advantages of the distillate

33
fuels is that the percentage of sulfur in them can easily be kept under
very low levels, compliable with the 0,5% limit of the IMO’s regulation.
Actually, there is a certain type of low sulfur marine gas oil that contains
less than 0,1% sulfur. To be more accurate, a MGO fuel can contain
different degrees of sulfur, but always in lower concentrations than that
of the heavy fuel oil. Another very helpful quality of marine gas oil is
that, unlike the heavy fuel oil, there is no need for it to be heated while
in storage. Yet, a major drawback in MGO’s use is its high price. In April
2016 it was more than twice the HFO’s price (Marquard and Bahls AG).
As for MDO (Marine Diesel Oil), it describes all those types of fuels that
are a combination of marine gas oil and heavy fuel oil. Indeed, marine
diesel oil refers to those types of fuel blends that have a very slight
proportion of heavy fuel oil. Sometimes MDO is being used as a
synonymous to IFO or Intermediate Fuel Oil. But there is a difference
between those two types of fuel, as IFO contains a higher quantity of
heavy fuel oil than MDO. Actually in some cases IFO is included in the
heavy fuel oil category. Marine diesel fuels have a higher density than
regular diesel fuels. Just like MGO, there are different types of fuels that
derive from MDO with different sulfur content. For instance, IFO 180
and IFO 380 contain less than 3,5% of sulfur. These two types of fuel can
be also found with a less than 1% sulfur concentration that enables ships
to enter into the Emission Control Areas. Of the 50,6 million metric tons
(MT) of bunker fuel sold in the largest bunker market, the Port of
Singapore, 75% was IFO.
As 2020 gets closer, refineries are choosing to optimize the production
procedure by turning their backs to heavy fuel oil. This is a very positive
change that may signify a new era in the fuel industry. The higher
demand for MGO will result in higher prices that are expected to surpass
the price of HFO (Møllenbach et al., 2012), even skyrocket, according to
some estimations. It is not a secret that in many cases the fuel costs
must be covered by the charterers. So in the eyes of some shipping
companies the new boost in the fuel prices will be the charterer’s
problem. However, the final recipient of the cost is, obviously, the
consumer, as Wood McKenzie analysts predict.
34
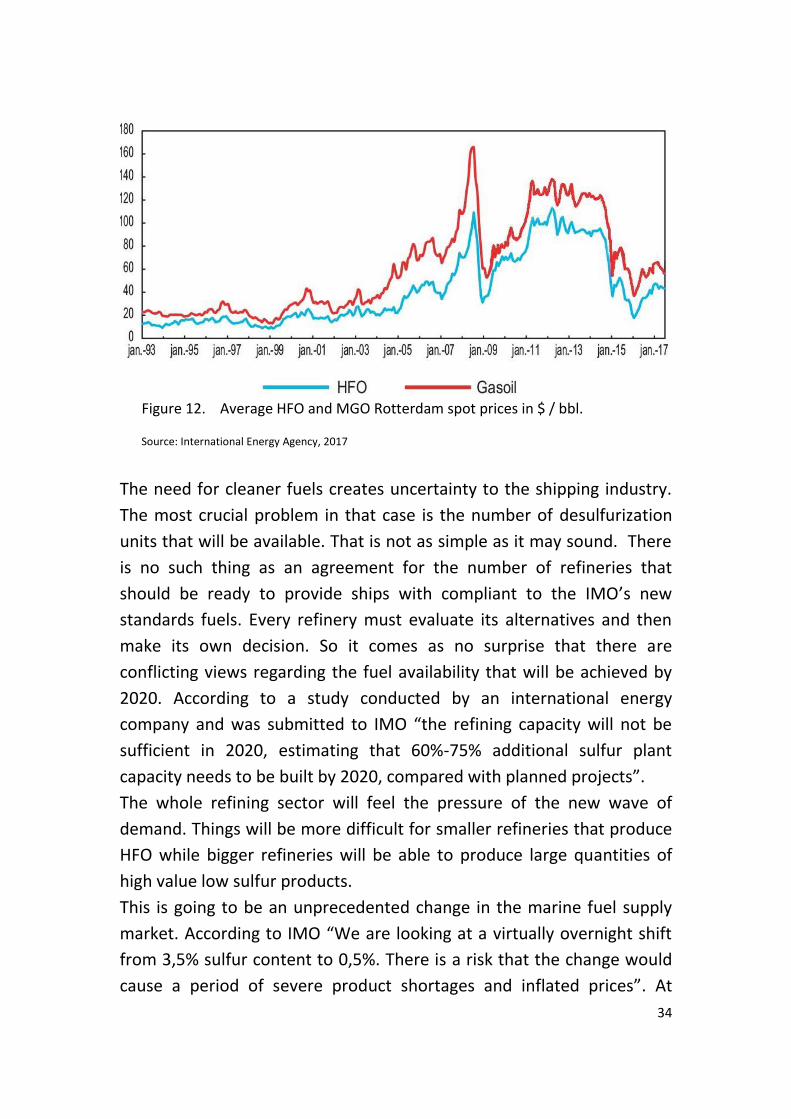
Figure 12. Average HFO and MGO Rotterdam spot prices in $ / bbl.
Source: International Energy Agency, 2017
The need for cleaner fuels creates uncertainty to the shipping industry.
The most crucial problem in that case is the number of desulfurization
units that will be available. That is not as simple as it may sound. There
is no such thing as an agreement for the number of refineries that
should be ready to provide ships with compliant to the IMO’s new
standards fuels. Every refinery must evaluate its alternatives and then
make its own decision. So it comes as no surprise that there are
conflicting views regarding the fuel availability that will be achieved by
2020. According to a study conducted by an international energy
company and was submitted to IMO “the refining capacity will not be
sufficient in 2020, estimating that 60%-75% additional sulfur plant
capacity needs to be built by 2020, compared with planned projects”.
The whole refining sector will feel the pressure of the new wave of
demand. Things will be more difficult for smaller refineries that produce
HFO while bigger refineries will be able to produce large quantities of
high value low sulfur products.
This is going to be an unprecedented change in the marine fuel supply
market. According to IMO “We are looking at a virtually overnight shift
from 3,5% sulfur content to 0,5%. There is a risk that the change would
cause a period of severe product shortages and inflated prices”. At

35
present the shipping industry is consuming 3,2m barrels per day (bpd) of
HFO. For MGO the number drops to 800.000 bpd. According to
predictions, from 2020 there will be a reversion, with HFO consumption
dropping to 700.000 bpd and MGO consumption rising at 3,4m bpd.
No one expects that the global refining sector will be able to switch its
whole production overnight. On the contrary there is a great possibility
that the bunker market will need some time to find a new balance.
2.2.2 Liquefied Natural Gas (LNG)
One of the fuels that might help to reduce the problem of the air
pollution caused by ships is LNG. It combines the benefits of gasses while
at the same time it is easily transported like all liquids (Semolinos, Olsen
and Giacosa, 2013).
Liquefied natural gas (LNG) is natural gas that has been converted to
liquid when cooled down to below minus 162 oC at a relatively low
pressure. Thus, LNG can be easily stored or transported in special tanks
with very low storage pressure. Natural gas contains more than 98%
methane, it is odorless, non toxic, non corrosive. It evaporates quickly, it
leaves no residue, so no cleanup is needed for LNG spills in water or
land. It contains virtually no sulfur and no particulate matter, while its
combustion produces is significantly lower in NOx compared to heavy
marine fuel oil. And its price is relatively lower than that of high sulfur
marine fuel oil especially now that oil is no longer as abundant as it used
to be in the past.
2.2.2.1 LNG and greenhouse gases
Though the LNG is a much clearer option than other fossil fuels, the
overall CO2 emissions that are being released in the atmosphere are
reduced only about 20%. So the advantages that the LNG’s use is
offering regarding the overall reduction of the Greenhouse gases (GHG)
emissions are not as significant. Even worse, some studies estimate that
burning LNG will reduce the CO2 emissions only around 10%.

36
Figure 13. IMO agreement for reducing ships’ CO2
Source: International Chamber of Shipping
The new regulations aim to decrease the amount of CO2 that is being
emitted. As the amount of CO2 released in the atmosphere by
international shipping in 2012 reached 796 million tons [according to
Third IMO Greenhouse Gas Study (2014)] this decrease in the emission
of CO2, the principal GHG, is of paramount importance for reducing the
global warming. As stated in the same study NOx emissions reached 18,6
million tons and SOx reached 10,6 million tons during the same year.
Hence, marine transport accounts for 2,2%, 13% and 12% of global CO2,
NOx and SOx emissions respectively (CE Delft, Germanischer Lloyd,
Marintek, and Det Norske Veritas, 2006). In Chapter 4 of MARPOL Annex
VI which entered force in 2013, IMO sets strict regulations in order to
reduce CO2 emitted from vessels.
Operational measures adopted to regulate CO2 emission fall into two
categories: a) the Energy Efficiency Design Index (EEDI), for new ships,
which involves the development of more energy efficient engines, and b)
Ship Efficiency Management Plan (SEEMP), which affects all ships old
and new, which optimizes vessel operational efficiency by controlling
and monitoring their performance.
Though LNG can’t cut CO2 to the extent that is required by mandatory
rules already in force internationally, it remains the best available option
in order to reduce this kind of emissions. Already, in spite of the

37
increased demand for maritime transport, shipping industry managed to
lower its total CO2 emissions by over 10% between 2007-2012
[International Chamber of Shipping (ICS)]. According to IMO rules, ships
constructed from 2025 and on, must be 30% more efficient than ships of
2000s. Many of the vessels that are going to comprise the future fleet of
super efficient ships, will be using LNG as a fuel.
What must be kept in mind is that although in LNG’s case CO2 emissions
are lower than in traditional fuels, CH4 emissions are higher (Thomson et
al, 2015). And though this gas doesn’t linger in the atmosphere as
carbon dioxide, its effects are more devastating because it traps heat
more easily. Actually it is 84 times more harmful than CO2. Methane
escapes the propulsion system of LNG fueled ships when combustion is
incomplete or as a result of venting from pipes after the engine has
stopped. It then dissipates to the atmosphere more quickly than CO2.
Therefore it is evident that LNG can’t be considered as a panacea for
solving all emissions issues, particularly regarding the aforementioned
methane slip (Schinas and Buttler, 2016).
And there is always the possibility of the future imposition of new
requirements regarding some pollutants that are known but not yet
restricted, which LNG fueled ships might not address.
Trying to comply with recent restrictions, manufacturers are developing
several new technologies for LNG fueled ships. Among them is adopting
advanced software for the designing of vessel hulls, using lighter
materials in the building of ships and reducing operational vessel speed.
2.2.2.2 LNG advantages and disadvantages
Introduction of LNG as propulsion fuel for shipping entails some
technical and financial challenges. However, price is one of its strong
points as it is relatively low compared to low sulfur distillates, marine
diesel oil (MDO), marine gas oil (MGO), high sulfur marine fuel oils,
heavy fuel oil (HFO) and intermediate fuel oil (IFO)(Llorenc Sastre
Buades, 2017). This does apply for these past few years, but since
marine fuel prices tend to fluctuate due to external factors, it is difficult
to make trustworthy price forecasts. It also applies to some markets, like
38
Europe and the United States, where natural gas price is considerably
lower than high and low sulfur oils prices. On the other hand in Asia,
LNG is more costly than low sulfur oils.
Additionally, due to the special infrastructure needed for LNG handling,
storage and distribution, low natural gas prices do not always translate
into low LNG prices, as well. In any case, the use of LNG decreases other
costs, like: tax costs thanks to reduced emissions, the cost of engine
maintenance as gas combustion is much cleaner, the cost of fuel as LNG
fueled engines are more efficient, etc (Herdzic, 2002).
Furthermore LNG technology is known and well proven, something that
does not apply for other technologies, like scrubbers for example. Not
only is it long tested and tried, but LNG technology is already being
improved, so that current products are much more efficient and less
costly.
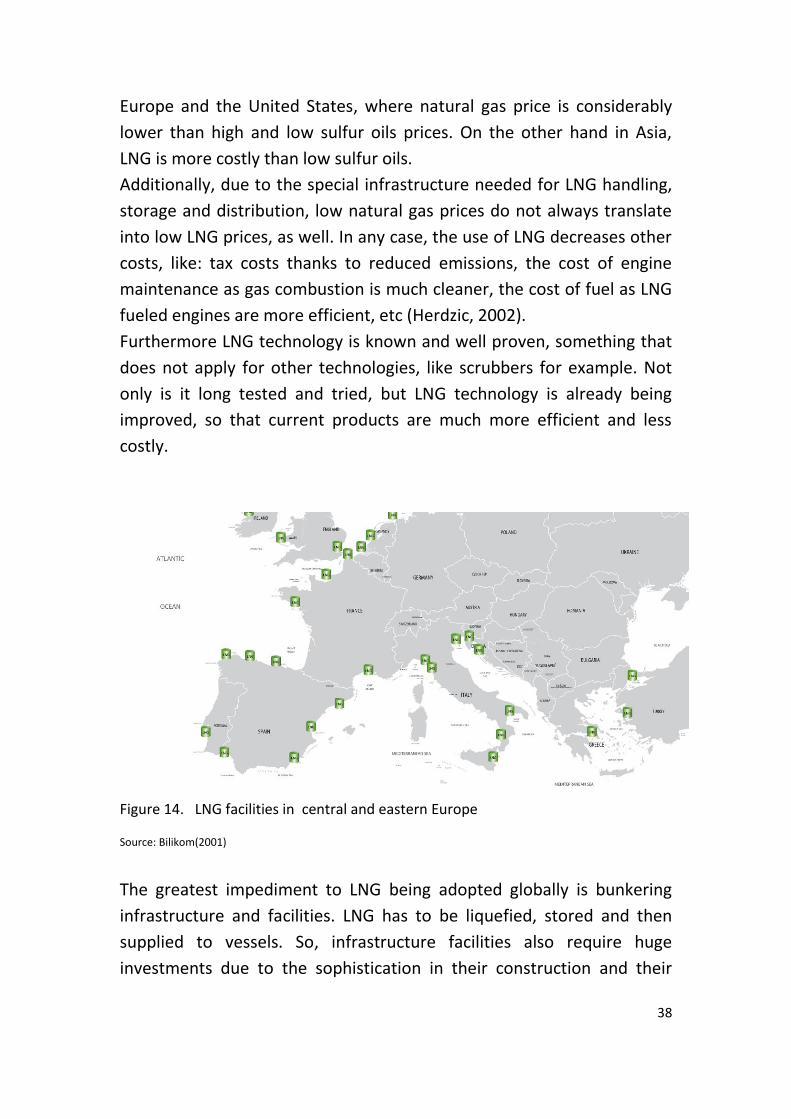
Figure 14. LNG facilities in central and eastern Europe
Source: Bilikom(2001)
The greatest impediment to LNG being adopted globally is bunkering
infrastructure and facilities. LNG has to be liquefied, stored and then
supplied to vessels. So, infrastructure facilities also require huge
investments due to the sophistication in their construction and their

39
obligation to meet safety standards. Because ship owners need to be
confident that LNG supplies will be available everywhere and at low
prices, a hypothetical lack of fuel at port can cause many problems. But
things are changing. For the time being Rotterdam is one of the ports
that are being more involved with LNG bunkering facilities. This also is
the case with other ports around the Baltic and North Sea. However, in
order LNG to become a competitive fuel, more medium and small scale
ports need to establish LNG filling stations (Gullberg and Gahnström,
2011). Recently it seems that Europe might be ready to help its main
ports to have LNG available for ships (European Commission, 2014,
Directive 2014/94/EU of the European Parliament and of the Council of
22 October 2014 on the deployment of alternative fuels infrastructure.
Official Journal of the European Union, OJ L 307/71 Brussels). In North
America many ports are already well equipped. Therefore it seems that
at least in the ECA areas of the Northern Hemisphere there will be
sufficient infrastructure to support adoption of LNG (Schinas and Buttler,
2016). In the rest of the world bunkering facilities are at an infant
structure and this is what will determine the viability of LNG as a marine
fuel.
2.2.2.3 LNG in new buildings and existing vessels
On February 2017 the LNG fueled ships in operation where 100, while on
May 2018 the number had risen to 122, with another 132 under
construction or on order. In gross tonnage terms the share of LNG
vessels delivered has grown from 1,4% in 2010 to 5,7% in 2017 (UNCTAD
2017). As for the cost, building a LNG fueled ship is comparable to
building a traditional diesel fuel-powered ship but the fuel cost to
operate the first is approximately half of what it would costs to operate
the latter. So fuel savings are huge.
LNG is not only a probable choice only for new buildings but for existing
vessels as well, although retrofitting of the latter would require a higher
investment, due to large scale modifications that would be required in

40
the engine quarters. As a result the cost for retrofitting an existing ship is
between 5 to 17 million euros, depending on the tank and engine size
(Ralli, 2015). More likely to adopt LNG as a fuel are also ships that spend
most of their time in ECA zones where regulations are strict, such as
ferries and tags. The same applies to vessels operating in areas where
LNG prices are lower and the suitable infrastructure guaranteed.
Figure 15. Distribution of scrubber/LNG in different types of ships
Source: 3d CWC LNG Fuels Summit 2017 (Amsterdam).
A problem that the wider use of LNG may create is the need for fuel
tanks on the ship. These tanks are cylindrical in shape, a fact that won’t
help with the existing space shortage problem on board. This fact
combined with some safety issues makes LNG tanks space consuming, as
sometimes they may require 3 or 4 times more space than traditional
fuel tanks. LNG engines are also occupying a greater percentage of the
ship’s space. Less space means less cargo and of course less cargo means
less money.
Furthermore LNG tanks have to keep natural gas under safe pressure
conditions. Safety has been a serious concern, though, for several
decades, LNG carriers using liquefied gas in their cargo tanks to power
their engines have an enviable safety record (Michot Fos, 2003).

41
2.2.3 Methanol
An alternative fuel that can be used by the shipping industry, which is
compliant with the new regulations regarding the sulfur content, is
methanol. The IMO has already given the green light to the ISO
(International Organization for Standardization) in order to promote this
type of fuel in the maritime sector. Methanol’s main advantages are its
high availability as well as the fact that it can be easily stored. It is also
easier and cheaper to retrofit an engine to operate with this particular
fuel. Especially on a new-built vessel the alterations needed are much
less when compared to the retrofits that will be required for instance at
an LNG fueled engine. As for the installation of a methanol fuel system in
an already existing and operating vessel it is calculated to be 75%
cheaper in comparison with the installation of an LNG fueled system.
The technical challenges that might also occur are not so many. For
example, it would be better if the pipeline system would be double-
walled and that the storage tank would have nitrogen inserted in it. By
doing so in case of an accident the methanol would vent with gravity
and become liquid when it comes in contact with air. This particular
property of methanol can make its removal from the fuel system and the
engine of the ship much easier when a repair is required.
Figure 16. World Total Final Consumption by fuel
Source: International Energy Agency, 2017

42
3. Methodology
Taking into consideration the aforementioned in Chapter 2, shipping
industry’s decision makers could end up with four major potential
solutions (Figure 22).
Figure 22. Ship owner’s options for compliance to new regulations
Source: IMO
ULSFO
ULSFO is unique as marine fuel and could not be surpassed by any other
fuel. Among its many virtues are compliance with IMO regulations and
low requirements regarding invested funds. The use of ULSFO is already
rising. In 2016 only it climbed to 2%. But the needed infrastructure is yet
not available. Another drawback is the high price at present combined
with future estimations that expect its price to rise even more. In fact, as
already mentioned, it is more suitable for older ships with a shorter life-
span which won’t be able to return funds invested in scrubbers or in LNG
engines.

43
EGCS
Scrubber appliances allow ships to use the cheap and abundant HFO. Investment and extra running costs, technical issues such as management of waste material or the ship’s stability along with lack of infrastructure in the future are serious obstacles. EGCS is a quite new, not tested technology and this can be another headache for the ship owners. Figures indicate that very few shipping companies have opted for scrubbers, postponing any system installation until 2020.
MGO
The MGO is another alternative for the ship owners. Low sulfur content ‒lower than IMO requirements‒ and a growing infrastructure network are its main advantages, while pricing could be a drawback.
LNG
LNG has a series of positive characteristics. Machinery efficiency, its low SOx, PM and NOx content, low price (in USA and Europe), lack of toxicity, are substantial benefits. Nevertheless, CH4 and CO2 emissions, space issues that will occur and safety problems have to be thoroughly analysed before any decision is made. Availability and high prices in some regions, like Asia, are also serious obstacles. Yet, LNG World Shipping data (as for May 2018) show that the number of liners that will use LNG has increased by 38% over the past year (Figure 18).
Figure 23. Percentage of LNG new build ships
Source: Titan LNG Analysis, Clarksons
44
As already mentioned, the economic aspect of the measures required
by IMO are of great importance, due to the significant amount of
investments needed. This will definitely affect the balance sheets of
most of the sector’s companies. The factor that might prove to be critical
for every investment carried out in the next few years, is the return rate
of invested capitals. This thesis displays viability of scrubbers in
corelation to other alternative fuels by using an economic model, taking
into consideration the Return of Investment Index (ROI). This can be
achieved by comparing consumptions of different fuels for a certain
period of time. First of all, a calculation of annual fuel costs for the four
most commonly used bunkering fuels, namely HFO, MGO, LNG and
ULSFO, is utilized on five different types of tankers. The types of tankers
chosen, typify the segregation of tanker fleet. Handy tankers are 10-
50,000 dwt, Panamax are up to 70,000 dwt, Aframax are up to 100,000
dwt, VLCC are up to 300,000 dwt and ULCC are over 300,000 dwt. A
sailing period of 280 days per year is taken into account. The cost of
scrubbers for every vessel type is also added in all HFO consumptions as
initial investment cost.
Data used in this particular work were derived from numerous
publications. The segmentation of tankers fleet is cited in Petter
Hvalgard Bakke and Daniel Reinsborg's master thesis "Empirical impacts
of macroeconomic risk factors on tanker shipping equities"(2012).
Bunker prices were retrieved from “Ship & Bunker.com” website, while
fuel consumption for tankers was picked from the scientific papers of
Wojciech Górski, Teresa Abramowicz-Gerigk and Zbigniew Burciu “The
influence of ship operational parameters on fuel consumption”(2013) as
well as S. B. Dalsøren, M. S. Eide, Ø. Endresen, A. Mjelde, G. Gravirand I.
and S. A. Isaksen “Update on emissions and environmental impacts from
the international fleet of ships: the contribution from major ship types
and ports” (2009) and also from Dr. R. Vis article “Viability of Scrubbers
for different types of Vessels” (2018) in Ship & Bunker.com. The cost of
scrubbers was retrieved from the article “SOx 2020: Effects on the Oil
Products Markets” in Clarkson.com website.
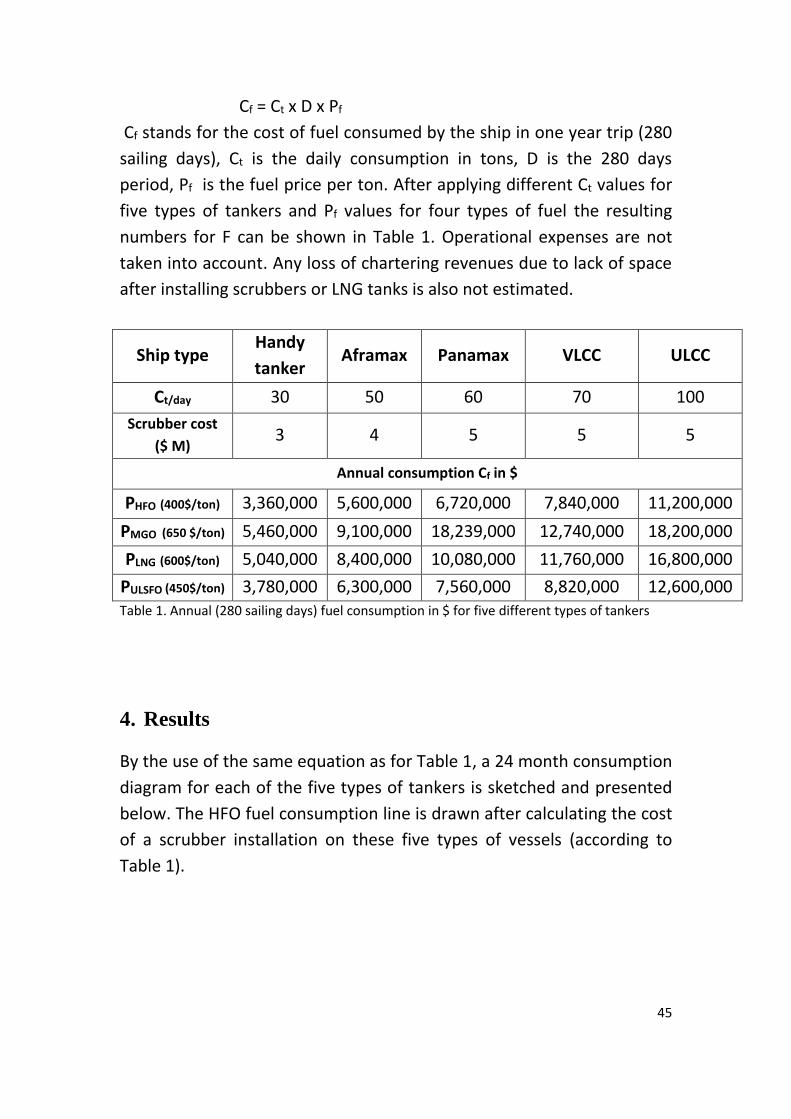
The equation that portraits the annual cost is:
45
Cf = Ct x D x Pf
Cf stands for the cost of fuel consumed by the ship in one year trip (280
sailing days), Ct is the daily consumption in tons, D is the 280 days
period, Pf is the fuel price per ton. After applying different Ct values for
five types of tankers and Pf values for four types of fuel the resulting
numbers for F can be shown in Table 1. Operational expenses are not
taken into account. Any loss of chartering revenues due to lack of space
after installing scrubbers or LNG tanks is also not estimated.
Ship type Handy
tanker Aframax Panamax VLCC ULCC
Ct/day 30 50 60 70 100
Scrubber cost
($ M) 3 4 5 5 5
Annual consumption Cf in $
PHFO (400$/ton) 3,360,000 5,600,000 6,720,000 7,840,000 11,200,000
PMGO (650 $/ton) 5,460,000 9,100,000 18,239,000 12,740,000 18,200,000
PLNG (600$/ton) 5,040,000 8,400,000 10,080,000 11,760,000 16,800,000
PULSFO (450$/ton) 3,780,000 6,300,000 7,560,000 8,820,000 12,600,000 Table 1. Annual (280 sailing days) fuel consumption in $ for five different types of tankers
4. Results
By the use of the same equation as for Table 1, a 24 month consumption
diagram for each of the five types of tankers is sketched and presented
below. The HFO fuel consumption line is drawn after calculating the cost
of a scrubber installation on these five types of vessels (according to
Table 1).

46
Figure 17. 24-month fuel consumption in $ for a Handy tanker
By examining Figure 17 it is obvious that the lines of consumptions of
different fuels, CHFO, CMGO and CLNG meet. These points show respective
ROI numbers in different month periods. The Return of Investment of a
scrubber with a 3 million $ cost installed on a Handy tanker, comparing
HFO and MGO bunker fuels is 13 months, while comparing HFO and LNG
is 17 months. For the ULFSO, ROI exceeds the 36 months.
47
Figure 18. 24-month fuel consumption for an Aframax tanker
Figure 18 shows that Return of Investment for a scrubber installation
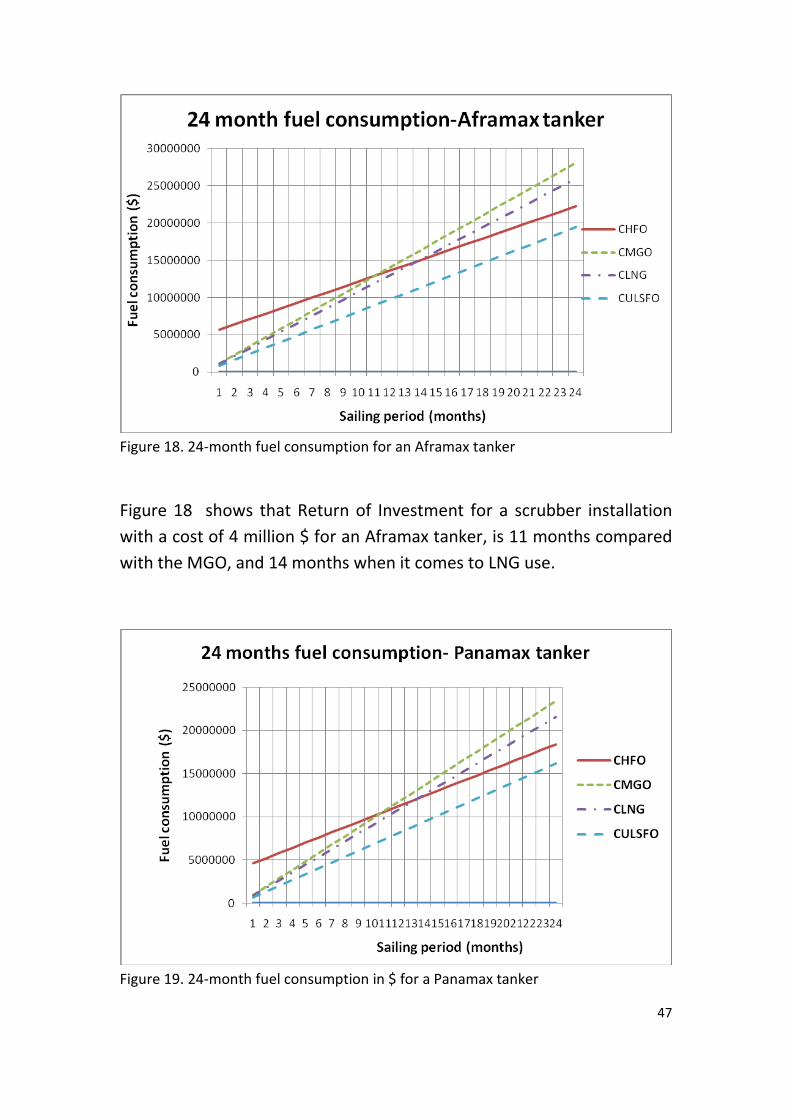
with a cost of 4 million $ for an Aframax tanker, is 11 months compared
with the MGO, and 14 months when it comes to LNG use.
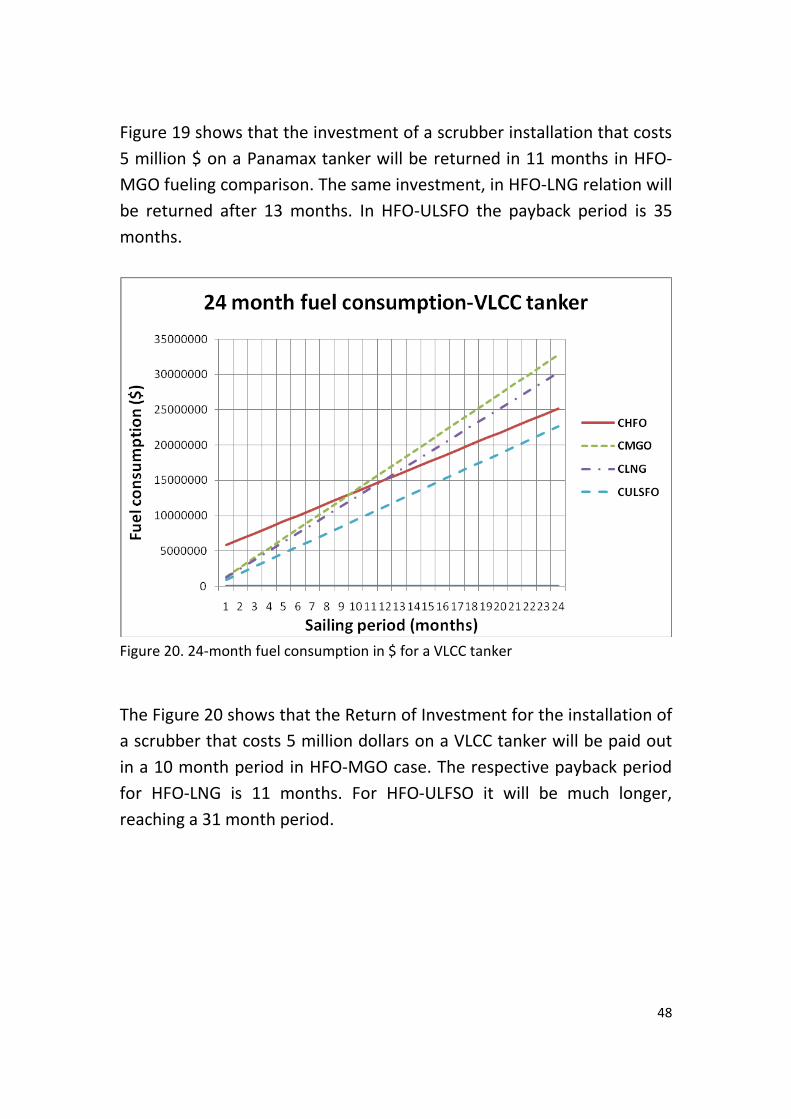
Figure 19. 24-month fuel consumption in $ for a Panamax tanker
48
Figure 19 shows that the investment of a scrubber installation that costs
5 million $ on a Panamax tanker will be returned in 11 months in HFO-
MGO fueling comparison. The same investment, in HFO-LNG relation will
be returned after 13 months. In HFO-ULSFO the payback period is 35
months.
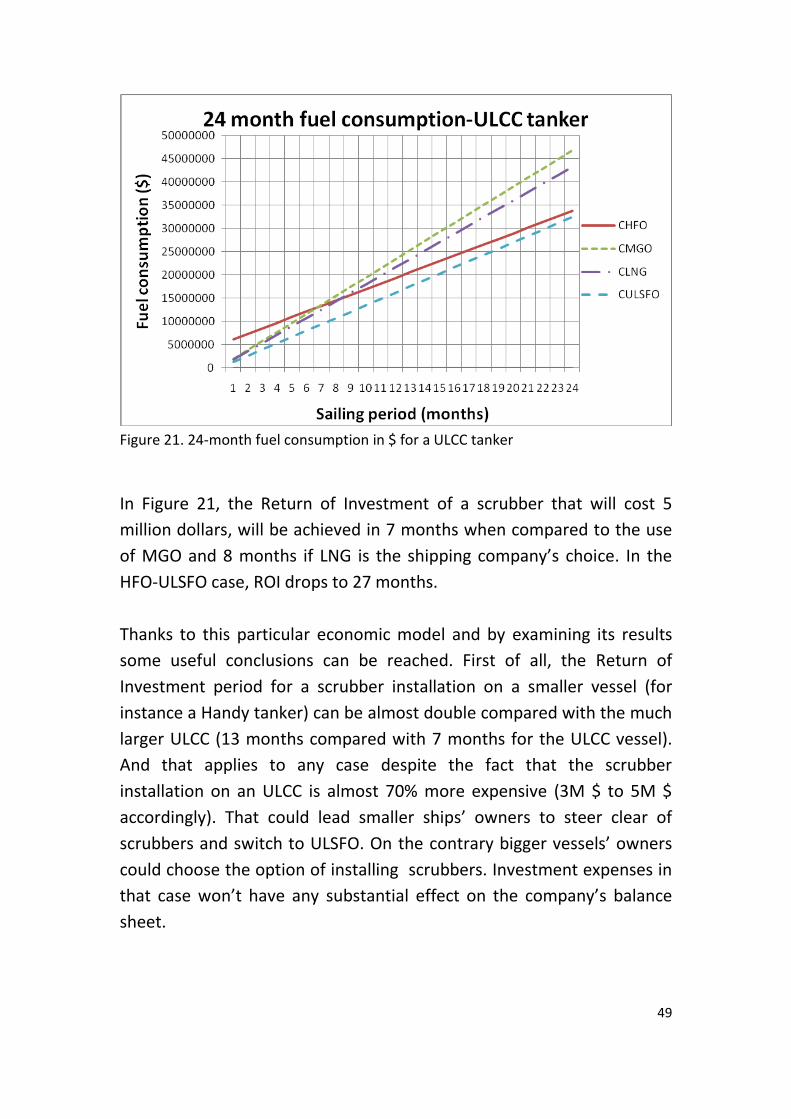
Figure 20. 24-month fuel consumption in $ for a VLCC tanker
The Figure 20 shows that the Return of Investment for the installation of
a scrubber that costs 5 million dollars on a VLCC tanker will be paid out
in a 10 month period in HFO-MGO case. The respective payback period
for HFO-LNG is 11 months. For HFO-ULFSO it will be much longer,
reaching a 31 month period.
49
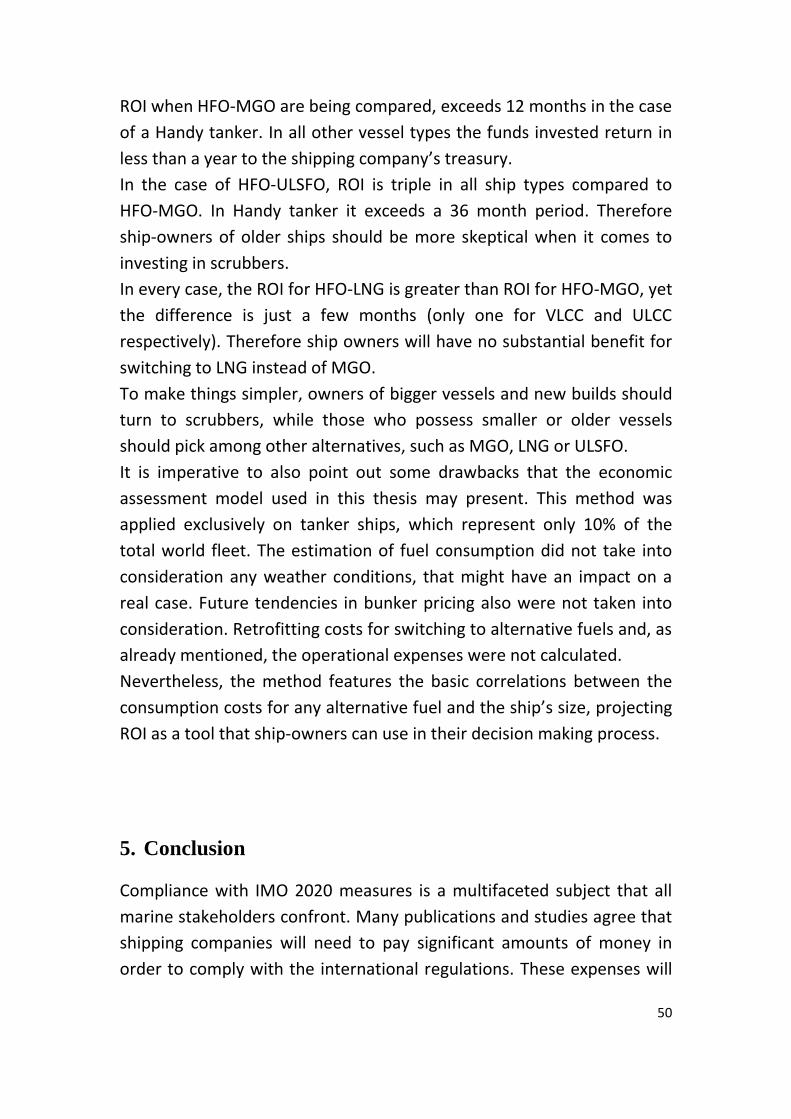
Figure 21. 24-month fuel consumption in $ for a ULCC tanker
In Figure 21, the Return of Investment of a scrubber that will cost 5
million dollars, will be achieved in 7 months when compared to the use
of MGO and 8 months if LNG is the shipping company’s choice. In the
HFO-ULSFO case, ROI drops to 27 months.
Thanks to this particular economic model and by examining its results
some useful conclusions can be reached. First of all, the Return of
Investment period for a scrubber installation on a smaller vessel (for
instance a Handy tanker) can be almost double compared with the much
larger ULCC (13 months compared with 7 months for the ULCC vessel).
And that applies to any case despite the fact that the scrubber
installation on an ULCC is almost 70% more expensive (3M $ to 5M $
accordingly). That could lead smaller ships’ owners to steer clear of
scrubbers and switch to ULSFO. On the contrary bigger vessels’ owners
could choose the option of installing scrubbers. Investment expenses in
that case won’t have any substantial effect on the company’s balance
sheet.
50
ROI when HFO-MGO are being compared, exceeds 12 months in the case
of a Handy tanker. In all other vessel types the funds invested return in
less than a year to the shipping company’s treasury.
In the case of HFO-ULSFO, ROI is triple in all ship types compared to
HFO-MGO. In Handy tanker it exceeds a 36 month period. Therefore
ship-owners of older ships should be more skeptical when it comes to
investing in scrubbers.
In every case, the ROI for HFO-LNG is greater than ROI for HFO-MGO, yet
the difference is just a few months (only one for VLCC and ULCC
respectively). Therefore ship owners will have no substantial benefit for
switching to LNG instead of MGO.
To make things simpler, owners of bigger vessels and new builds should
turn to scrubbers, while those who possess smaller or older vessels
should pick among other alternatives, such as MGO, LNG or ULSFO.
It is imperative to also point out some drawbacks that the economic
assessment model used in this thesis may present. This method was
applied exclusively on tanker ships, which represent only 10% of the
total world fleet. The estimation of fuel consumption did not take into
consideration any weather conditions, that might have an impact on a
real case. Future tendencies in bunker pricing also were not taken into
consideration. Retrofitting costs for switching to alternative fuels and, as
already mentioned, the operational expenses were not calculated.
Nevertheless, the method features the basic correlations between the
consumption costs for any alternative fuel and the ship’s size, projecting
ROI as a tool that ship-owners can use in their decision making process.
5. Conclusion
Compliance with IMO 2020 measures is a multifaceted subject that all
marine stakeholders confront. Many publications and studies agree that
shipping companies will need to pay significant amounts of money in
order to comply with the international regulations. These expenses will

51
either be registered as invested capitals or as operating costs, by the
shipping industry and by the infrastructure sector as well. According to
Wood Mackenzie consultancy “the shipping industry’s annual bunker
costs could rise by up to 60 billion dollars in 2020 with full compliance
with the IMO’s sulfur cap”(2017). Fuels can represent even the 70%-80%
of the total cost of a voyage. That is a fact that will lead to a significant
increase in the freight rates.
This thesis is dealing with the main issue of the sector, namely if EGCS
technology is the answer to IMO’s 2020 sulfur cap, or alternative fuels
such as MGO, LNG or ULSFO should be preferred. The objective is to
point out the most vital aspect of the question, the economic one, by
comparing all these options in a way that shows why any of these
methods should be chosen. This is accomplished by the enforcement of
a specific methodology. An economic model for measuring fuel
consumption of different vessel types was chosen. Return of Investment,
a principal economic factor for ship owners, helps in analyzing the
emerging results.
Analysis of these results leads to some basic deductions. Scrubbers are
less costly than switching to other fuels when installed on bigger ships
and new buildings. On the other hand ULSFO should be preferred in
smaller vessels. This also stands for older vessels which could use LNG as
well. The choice between MGO and LNG should take into account other
factors since both of them retain high prices. In their thesis, Georg
Fredriksson and Joel Wiberg (2018) are in concordance with this work
concluding that scrubbers are the best solution for new builds after 2020
and under certain circumstances for already sailing ships. Yet that stands
for bigger shipping companies with higher investment capability. On the
other hand, in their thesis, Fredrik Østerbø Brekke and Espen Græsdal
(2015) conclude that distillates are a preferable option for older vessels.
Initial investment costs for LNG or scrubbers exceed the running costs of
distillates on ships with short operating lifetime. In contrast to this
thesis’ results, they suggest that scrubbers are more suitable for medium
aged vessels while LNG applies only to vessels with a remaining lifetime
that is longer. Moreover, in their work, “IMO 0.5% S Global: Scrubbers
52
Yes or Scrubbers No?”, Ara Barsamian and Lee Curcio (2017) come to the
conclusion that for ships consuming more than 300t/day, scrubbers are
the most suitable compliant solution while vessels with less than 40t/day
consumption should switch to ULSFO or MGO. That leads to a scrubber
preference for larger ships and a fuel switch for smaller. It becomes
obvious their conclusions are in concordance with the bottom line
results of this thesis .
This work has certain limitations. The most important one is the inability
to examine all factors involved. Their number and complexity exceed a
thesis capability. The applied methodology concerned a specific domain
of shipping industry, and a number of assumptions have been adopted.
Thus, the derived conclusions are rather indicative, while fairly
significant. Nevertheless, this thesis can provide reference for further
research.
The implementation of measures on an international level is a multi-
variable problem. Researchers should address it accordingly. Since time
gap is closing, oncoming projects should be as integrated as possible.
Refinery and bunkering industry planning, should be also taken into
consideration. In that way stakeholders of the sector could be make
their decisions much easier.
It is quite obvious that at present there isn’t a single or simple answer to
the question that the shipping industry is facing regarding the air
pollution problem and the costs that will be generated by the new
international legislations. Yet, this uncertainty might have a positive
side. If all ship-owners adopt the same solution, for example ULSFO, or if
they all install scrubbers and keep using HFO, then the price of this fuel
would increase dramatically as demand would outstrip supply. If LNG
was to become the preferred solution, other problems might arise. The
current global liquefaction capacity is just 339 million MTs of LNG per
year. But “if all ships were to adopt LNG as a fuel source, liquefaction
capacity would need to expand 65%-90% to meet this new demand. This
capacity would take years to build and requires investments of hundreds
of billions of dollars” (Brown Brothers Harriman, 2018).

53
Ship-owners are not in a hurry to take action. They are waiting to see
which decision other ship owners will make. The main issue that
shipping companies have to deal with is the fact that nothing is clear yet.
But as the sector is running out of time, the decision- making process
should be quick and as accurate as possible. In the end the ship owners
must always bear in mind what Aristotle Onassis once said “We must
free ourselves of the hope that the sea will ever rest. We must learn to
sail in high winds”.
Bibliography
ABS (2018). ‘ABS Advisory on Exhaust Gas Scrubber Systems’ [online].
Available at: https://ww2.eagle.org/content/dam/eagle/advisories-
and-debriefs/exhaust-gas-scrubber-systems-advisory.pdf (Accessed:
30 August 2018)
Adamchak, F. and Adede, A. (2013). LNG As Marine Fuel, Paper
presented at the 2013 LNG-17 Conference Sessions.
Bakke, P.H. and Reinsborg, D. (2012). Empirical impacts of
macroeconomic risk factors on tanker shipping equities, Master
Thesis presented at Copenhagen Business School.
Barsamian, A. and Curcio, L. (2017). IMO 0,5%S Global: Scrubbers Yes or
Scrubbers No?, Paper presented at the 116th Annual Meeting of
American Fuel and Petrochemical Manufacturers.
Brekke F. Ø. and Græsdal E. (2015). An Assessment of Optimal
Investment Decision for Emission Control Compliance for Odfjell SE,
Master Thesis presented at the Norwegian Schoolo of Economics,
Bergen, Norway.
Bunkers prices [online] Available at: https://shipandbunker.com
(Accessed 20 December 2018)
Corbett, J.J and Winebrake, J.J. (2012). ‘Emissions Tradeoffs among
Alternative Marine Fuels: Total Fuel Analysis of Residual Oil, Marine

54
Gas Oil, and Marine Diesel Oil’, Journal of the Air Management
Association, 58(4), p538-542.
Cost of scrubbers retrieved from article ‘SOx 2020: Effects On The Oil
Products Markets’ [online]. Available at: http:// www.clarksons.com
(Accessed August 2018)
Dalsøren, S. B., Eide, M. S., Endresen, Ø., Mjelde, A., Gravir, G. and
Isaksen, I. S. A. (2008).“Update on emissions and environmental
impacts from the international fleet of ships: the contribution from
major ship types and ports”, Atmospheric Chemistry and Physics,
9(6).
Entec UK limited (2005a). Service Contract on Ship Emissions Assignment,
Abatement and Market-based Instruments, Report for European
Commission Directorate-General-Environment Directorate C-Unit C1
[online]. Available at:
http://ec.europa.eu/environment/air/pdf/task2_so2.pdf (Accessed:
August 2018)
Faber J., Kampman B. and Schroten A. (2006). Greenhouse Gas Emissions
for Shipping and Implementation Guidance for the Marine Fuel
Sulphur Directive, CE Delft, Germanischer Lloyd, MARINTEK, Der
Norske Veritas.
Fredriksson G. and Wiberg J. (2018). Complying with the 2020 Global
Sulphur Limit, Bachelor Thesis presented at Chalmers University of
Technology, Gothenburg, Sweden.
Górski, W., Abramowicz-Gerigk, T. and Burciu, Z. (2013). ’The influence of
ship operational parameters on fuel consumption’, Scientific Journals
of Maritime University of Szczecin, 36(108), p49-54.
Gu, Y. and Stein, W. W. (2017) ‘Scrubber: A Potential Overestimated Compliance Method for the Emission Control Areas: the Importance of Involving a Ship’s Sailing Pattern in the Evaluation’, Transportation Research art D: Transport and Environment, 55, p51-66.
Grimmer and Michael Myers Ship and Bunkers-IMO 2020 Rule: Ship-owner Perspective, Ralph, 2018
Gullberg, M. and Gahnstrom, J. (2011). North European Infrastructure Project, Trans-European Transport Network.
55
Harms J., (2008). ’Shippers and Refiners: A High-Stakes Game of Wait
and See’, Brown Brother Harriman-Commodity Markets Update,
issue 2018.
Herdzik, J. (2012). ‘Aspects of Using LNG as a Marine Fuel’, Journal of
KONES Powertrain and Transport, 19(2), p201-209.
Jiang, L., Kronbak, J. and Christensen, L. P. (2014). ‘The Costs and
Benefits of Sulfur Reduction Measures: Sulfur Scrubbers Versus
Marine Gas Oil’, Transportation Research Part D, Transport and
Environment, 28, p19-27.
ICS (2015). Delivering CO2 Emissions Reduction [online]. Available at:
http://www.ics-shipping.org/docs/default-
source/resources/environmental-protection/shipsandco2-
cop21.pdf?sfvrsn=16 (Accessed: 20 August 2018)
IMO (2014). Third IMO Green House Gas Study [online]. Available at:
http://www.imo.org/en/OurWork/Environment/PollutionPrevention
/AirPollution/Documents/Third%20Greenhouse%20Gas%20Study/G
HG3%20Executive%20Summary%20and%20Report.pdf (Accessed 20
August 2018)
IMO (2016). IMO Sets 2020 Date for Ships to Comply with Low Sulfur Fuel
Oil Requirement [online]. Available at:
http://www.imo.org/en/MediaCentre/PressBriefings/Pages/MEPC-
70-2020sulphur.aspx (Accessed 20 August 2018)
IMO (2018). The 2020 Global Sulfur Limit [online]. Available at:
http://www.imo.org/en/MediaCentre/HotTopics/GHG/Documents/F
AQ_2020_English.pdf (Accessed 20 August 2018)
Kristensen, H. (2012). Energy Demand and Exhaust Gas Emissions of
Marine Engines, Technical University of Denmark, Project no. 2014-
122, Work Package 2.3, Report no. 03, September 2015.
Le Fevre, N. C. (2018). A Review of Demand Prospects for LNG as a
Marine Transport Fuel, The Oxford Institute for Energy Studies
[online]. Available at: https://www.oxfordenergy.org/wpcms/wp-
content/uploads/2018/07/A-review-of-demand-prospects-for-LNG-
as-a-marine-fuel-NG-133.pdf (Accessed: 20 August 2018)

56
Linstad, H., Sandaas, I. and Stromman, A. (2015). ‘Assessment of Cost as
a Function of Abatement Options in Maritime Emission Control
Areas’, Transportation Research part D: Transport and Environment,
38, p41-48.
MARPOL ANNEX VI, ‘EEDI & SEEMP’ [online]. Available at:
https://www.marpol-annex-vi.com/eedi-seemp/ (Accessed 30
August 2018)
Michot-Foss, M. (2003). LNG Safety and Security, University of Houston
Law Center, Institute for Energy and Enterprises.
Mowat I. (2018). IMO Aims to Halve Global Shipping Emissions – But
What Will It Cost?, News Release at Wood MacKenzie [online].
Available at : https://www.bbh.com/en-us/insights/shippers-and-
refiners--a-high-stakes-game-of-wait-and-see-29568 (Accessed: 7
September 2018)
Noble, G. P. (2009). ‘A Short History of LNG Shipping 1959-2009’, Texas
Section-SNAME, Feb 10th 2009.
Ralli, P. (2015).’Industry Insight: A Survival Guide for Evaluating the Cost
of Converting a Vessel to Use LNG Bunkers’, Ship and Bunker [online].
Available at: https://shipandbunker.com/news/features/industry-
insight/566977-industry-insight-a-survival-guide-for-evaluating-the-
cost-of-converting-a-vessel-to-use-lng-bunkers (Accessed: 20 August
2018)
Sastre Buades, L. (2017). Implementation of LNG as marine fuel in
current vessels. Perspectives and improvements on their
environmental efficiency, Thesis presented at the Facultat de Nàutica
de Barcelona Universitat Politècnica de Catalunya.
Satish K., Hyouk-Tae Kwon, Kwang-Ho Choi, Wonsub Lim, Jae Hyun Cho, Kyungjae Tak and Il Moon. (2011). ‘LNG: an eco-friendly cryogenic fuel for sustainable development’, Applied Energy, 88(12), p4264-4273.
Schinas, O. and Buttler, M. (2016) ‘Feasibility and commercial considerations of LNG-fueled Ships’, Ocean Engineering, 122, p84-96.
Seddiek, I.S. and Elgohary, M.M. (2014). ‘Eco-friendly Selection of Ship Emissions Reduction Strategies with Emphasis on Sox and NOx Emissions’, International Journal of Naval Architecture and Ocean Engineering, 6(3), p737-748.

57
Semolinos P., Olsen G. and Giacosa A. (2013). LNG as Marine Fuel: Challenges to Be Overcome [online]. Available at: http://www.gastechnology.org/training/documents/lng17-proceedings/7-2-pablo_semolinos.pdf (Accessed 6 September 2018)
Sofiev, M., Winebrake, J.J., Johansson, L., Carr, E. W., Prank, M., Soares,
J., Vira, J., Kouznetsov, R., Jalkanen, J.-P., Corbett and J,J. (2018).
‘Cleaner Fuels for Ships Provide Public Health Benefits with Climate
Tradeoffs’, Nature Communications, 9, Article no 406.
Thomson, H., Corbett, J. J. and Winebrake, J. J. (2015). ‘Natural Gas as a
Marine Fuel’, Energy Policy, 87, p153-167.
United Nations Conference on Trade and Development (UNCTAD)
Annual Report 2011. [online]. Available at:
http://unctad.org/en/PublicationsLibrary/dom2012d1_en.pdf
(Accessed 5 September 2018)
Wang, C., Corbett, J.J. and Winebrake, J.J. (2007). ‘Cost-Effectiveness of
Reducing Sulfur Emissions from Ships’. Environmental Science and
Technology, 41, p8233-8239.
Wood Mackenzie (2017). IMO 2020 Regulation could cost shippers extra
US$60 Billion a Year [online]. Available at:
https://www.woodmac.com/press-releases/imo-2020-regulation-
shippers-us$60-billion-year/ (Accessed 30 August 2018)
Vis, R., (2018). ‘Industry Insight: Viability of Scrubbers for different types
of Vessels’, Ship and Bunker, 10 January [online]. Available at:
www.shipandbunker.com (Accessed: August 2018)
Yang, Z.L. Zhang, D., Caglayan, O., Jenkinson, I.D., Bonsall, S., Wang, J.,
Huang, M. & Yan and X.P. (2012). “Selection of Techniques for
Reducing Shipping Nox and Sox Emissions”, Transportation Research
part D, 17(6), p478-486.


