draft final report - cranston, rhode island draft regional stormwater utility... · upper...
TRANSCRIPT

Phase I Feasibility Study Report Upper Narragansett Bay Regional Stormwater Utility Feasibility Study
Upper Narragansett Bay Regional Stormwater Utility
Feasibility Study Phase I
Draft Final Report
April 2014
Prepared for:
City of Providence On behalf of the Upper Narragansett Bay Regional Stormwater Utility Feasibility Steering Committee With funding from: RI Department of Environmental Management
Prepared by: AMEC Environment & Infrastructure, Inc. 271 Mill Road, Chelmsford, Massachusetts 01824
In partnership with:

Phase I Feasibility Study Report Page i Upper Narragansett Bay Regional Stormwater Utility Feasibility Study
Table of Contents
Executive Summary ................................................................................................................. 1
1.0 Introduction and Background...................................................................................... 2
1.1 Stormwater Utilities ................................................................................................ 6
1.2 Regional Stormwater Utilities ................................................................................. 8
1.3 Study Approach ....................................................................................................12
1.4 Steering Committee ..............................................................................................12
1.5 Stakeholder Group ................................................................................................14
2.0 Current Stormwater Programs ...................................................................................16
2.1 Regional Overview ................................................................................................16
2.2 Central Falls .........................................................................................................22
2.2.1 Stormwater System & Local Issues ...........................................................23
2.2.2 Program Management & Level of Service .................................................25
2.3 Cranston ...............................................................................................................26
2.3.1 Stormwater System & Local Issues ...........................................................27
2.3.2 Program Management & Level of Service .................................................29
2.4 East Providence ....................................................................................................31
2.4.1 Stormwater System & Local Issues ...........................................................32
2.4.2 Program Management & Level of Service .................................................34
2.5 North Providence ..................................................................................................35
2.5.1 Stormwater System & Local Issues ...........................................................36
2.5.2 Program Management & Level of Service .................................................38
2.6 Pawtucket .............................................................................................................39
2.6.1 Stormwater System & Local Issues ...........................................................40
2.6.2 Program Management & Level of Service .................................................42
2.7 Providence ............................................................................................................44
2.7.1 Stormwater System & Local Issues ...........................................................46
2.7.2 Program Management & Level of Service .................................................47
2.8 Warwick ................................................................................................................48
2.8.1 Stormwater System & Local Issues ...........................................................49
2.8.2 Program Management & Level of Service .................................................51
3.0 Compelling Case for Enhanced Stormwater Programs ............................................53
3.1 Drivers for Change ................................................................................................53
3.2 Building a Compelling Case ..................................................................................55
3.3 Summary & Key Messages ...................................................................................58
4.0 Proposed Future Stormwater Program ......................................................................60

Phase I Feasibility Study Report Page ii Upper Narragansett Bay Regional Stormwater Utility Feasibility Study
4.1 Level of Service ....................................................................................................60
4.2 Future Cost Estimate ............................................................................................62
4.3 Regional Approaches Considered.........................................................................64
4.4 Preliminary Stormwater Utility Rate Analysis ........................................................71
4.4.1 Rate Methodology – Basic Structure & ERU..............................................71
4.4.2 Preliminary Rate Analysis..........................................................................73
4.4.3 Credits .......................................................................................................75
4.5 Billing & Data Analysis ..........................................................................................77
5.0 Recommendations & Next Steps ................................................................................79
5.1 Summary of Recommendations ............................................................................79
5.2 Next Steps & Roadmap ........................................................................................80
5.3 Budget Estimate for Next Steps – Phase II ...........................................................84
Appendices
Appendix I Impaired Waters in Participating Municipalities & TMDL Requirements
Appendix II Phase I Feasibility Study Scope of Work
Appendix III Stakeholder Group Invite Letter & List
Meeting Materials for Steering Committee & Stakeholder Group (chronology of agendas & meeting summaries), Presentations on CD
Appendix IV Municipal Stormwater Program Survey (template)
Appendix V GIS Data for Each Municipality (electronic files)
Appendix VI Future Program Cost Summary Tables
Appendix VII Rhode Island Stormwater Utility Enabling Legislation and CLF Report (executive summary)

Phase I Feasibility Study Report Page 1 Upper Narragansett Bay Regional Stormwater Utility Feasibility Study
Executive Summary
This section will be completed following the initial round of review and comments.

Phase I Feasibility Study Report Page 2 Upper Narragansett Bay Regional Stormwater Utility Feasibility Study
1.0 Introduction and Background
The City of Providence initiated this Phase I Study to evaluate the feasibility of establishing a
regional stormwater utility with local communities and the Narragansett Bay Commission (NBC).
Interest in the concept began following the December 4, 2012 workshop “Regional Solutions:
Exploring Stormwater Utility Districts”. Subsequently, the Phase I Feasibility Study was funded
by the RI Department of Environmental Management (RIDEM) and included the following
participants:
It is important to note that this is a preliminary study to evaluate
the feasibility of a regional solution that will address the
financial, operational, environmental, and management issues
and needs of communities in the Upper Narragansett Bay
(UNB) Watershed.
This Study:
It is the first of several phases.
It is a concept level assessment.
It is an initial characterization of stormwater issues, costs and drivers in each community.
It explores regional framework alternatives.
The outcome is a “go” or “no-go” decision on continuing the path of in-depth planning for a regional stormwater management and funding approach.
This Report:
Provides an overview of water quality and stormwater management issues in the Upper Narragansett Bay area.
Provides background information related to stormwater utilities and regional stormwater management approaches.
Synthesizes the results of the analysis by the Project Team and information discussed at meetings with the Sustainable Stormwater Solutions Steering Committee (Steering Committee) and the Sustainable Stormwater Solutions Stakeholder Group (Stakeholder Group).
Provides a “roadmap” to lay out the next steps for in-depth planning to support potential implementation of a regional stormwater management approach.
Central Falls
Cranston
East Providence
North Providence
Providence
Pawtucket
Warwick
Narragansett Bay Commission
Primary Objective:
“Work with representatives from the
participating communities to evaluate the feasibility of establishing a regional
stormwater utility”

Phase I Feasibility Study Report Page 3 Upper Narragansett Bay Regional Stormwater Utility Feasibility Study
Ecological Context
The Narragansett Bay's 700 billion
gallons of water cover 150 square miles.
The watershed nurtures thousands of
species of plants, fish, and wildlife as well
as more than two million residents and
ten million tourists each year. It
welcomes more than 100,000 fishermen
each year, and over 32,000 recreational
boats cruise the waters. It’s annual
contribution to Rhode Island's economy
totals billions of dollars. Additional
resource information can be found at
http://www.dem.ri.gov/bart/nbay.htm.
Water quality in the Upper Narragansett
Bay and many of its contributing
tributaries (Providence River, Seekonk River, Ten Mile River, Woonasquatucket River and
Blackstone River) is impaired largely due to stormwater runoff, as
indicated on the above watershed map for water bodies
highlighted in red. Additional information for impaired waters and
the requirements to meet the Total Maximum Daily Load (TMDL)1
studies for each of the Study Area Communities is provided in
Appendix I.
There are multiple driving forces for enhanced stormwater
management and water quality in the UNB region.
From the residents’ perspective these drivers may include:
Polluted waterways that negatively impacts recreation and fishing opportunities, including beach and shellfish closures;
Aging and inadequate stormwater infrastructure that results in flooding of streets and private property;
Failing infrastructure that results in emergency road closures;
River flooding that damages property and disrupts the community; and
Erosion of stream banks and sediment deposits in fresh water streams.
1 A TMDL study is an evaluation of the maximum amount of a pollutant that a water body
can accept and still meet the state's water quality standards for public health and healthy ecosystems. The federal Clean Water Act requires all states to identify water bodies that do not meet state standards and develop TMDL studies for them.
Phase I Feasibility Study Report Page 4 Upper Narragansett Bay Regional Stormwater Utility Feasibility Study
From a regulatory perspective, these drivers primarily include:
The RI Pollution Discharge Elimination System (RIPDES) Phase II General Permit for regulated Municipal Separate Storm Sewer Systems (MS4s);
TMDL studies for waters in the UNB communities; and
NBC’s Consent Agreement with RIDEM for the combined sewer system (CSS) in areas of Providence, Central Falls and Pawtucket.
These regulations provide a framework to address the root causes of water quality problems
that encompass:
Storm drain system operation, maintenance and rehabilitation; and
Inadequate infrastructure for stormwater conveyance and treatment in MS4 and CSS areas.
This information was explored in greater detail to frame the discussion of community-specific
issues and the potential benefit of regionalization to address common and broader issues in the
Upper Narragansett Bay Watershed.
Regionalization
Regional programs can be created with great flexibility, tailored to the participating
municipalities’ needs and the level of cooperation to which they are comfortable. In order for
municipalities to achieve the efficiencies available through regional stormwater programs, each
community must be willing to resign some local authority to the regional effort. Stormwater
program regionalization can have many benefits, as outined below:
Economies of scale when performing services and pursuing contracts for services such as monitoring, street sweeping and specialized stormwater management expertise;
Greater access to sources of specialized expertise;
Ability to direct resources to projects watershed-wide that will have greater benefits to water quality and flooding, for example;
Spread costs across a larger rate payer base;
Increased ability to gain outside funding (i.e., state and federal grants);
Consistency of programs at a watershed level – across jurisdictions;
Ability to address larger problems;
More stable organizational structure that is less influenced by politics and elections; and
Consistency in services across watersheds.
It is important to note that the Rhode Island Stormwater Management and Utility District Act
of 2002 allows municipalities to create stormwater management and utility districts separately or
with other muicipalities in order to “eliminate and prevent the contamination of the state's waters
and to operate and maintain existing stormwater conveyance systems.”
Figure 1.1 provides a detailed outline of elements and considerations in developing a regional
stormwater management and funding (utility) approach. See Section 1.1 for an overview of
stormwater utilities.

Phase I Feasibility Study Report Page 5 Upper Narragansett Bay Regional Stormwater Utility Feasibility Study
Legend:
Solid green areas can be broken out to conduct an initial phase/feasibility study.
Dotted green areas would be touched upon during an initial feasibility study (e.g., Phase II), but would need to be revisited, in detail, in a subsequent phase prior to final implementation.
White items are dependent upon those above and are done as part of final implementation activities (Phase III).
Figure 1.1 Regional Stormwater Utility Implementation Framework
In general, the steps for developing a multi-entity stormwater program and utility begin with a
feasibility study that could progress to implementation along the five parallel “tracks” above.
The scope of services for this study touched upon elements within each track that are part of an
initial feasibility study. While there are almost infinite variations of this figure that can be
General Approach for Phase I Study

Phase I Feasibility Study Report Page 6 Upper Narragansett Bay Regional Stormwater Utility Feasibility Study
Source: US EPA Fact Sheet 841-F-03-003
A stormwater utility is a funding mechanism for a
stormwater program. Much like water and sewer utilities, an equitable fee is
collected for stormwater services provided.
customized based on local realties, the key activities within the figure are all important and
cannot, or should not, be skipped as further study and/or implementation proceeds.
The scope of services completed for this study is discussed in Section 1.3.
1.1 Stormwater Utilities
A stormwater utility is seen as an umbrella under which individual communities address their
own specific needs in a manner consistent with local problems, priorities and practices. It is
generally understood in three ways:
A means of generating revenue – the utility is a fee for stormwater services provided;
A program concept – the utility is a stormwater program, driven by local needs; and
An organizational entity – the utility is a specific entity that performs stormwater services.
It is important when establishing a stormwater utility to
determine which of these three the “utility” actually is. If
the only reason for the establishment of a utility is to
generate revenue and to free up additional tax revenues,
the test for fee for service is not met. Citizens who
thought they were getting stormwater services for free
and now see a line item on a bill will pick up the phone
and expect better service than before. Therefore, it is
important to offer a better level of service (and a well-
defined, program concept) if a utility is to be formed.
A Stormwater Utility Provides a Vehicle for:
Consolidating or coordinating responsibilities that were previously dispersed among several departments and divisions;
Generating funding that is stable, adequate, equitable and dedicated solely to the stormwater function; and
Developing programs that are comprehensive, cohesive and consistent year-to-year.
It is based on the premise that the stormwater drainage system is a public system, similar to a wastewater or water supply system. When a demand is placed on either of these two latter systems, the user pays a service charge. When a natural area is paved, a greater flow of water is placed on the drainage system; thus, creating an increased demand. The greater the demand (i.e., the more the parcel of land is paved), the greater the user fee should be.

Phase I Feasibility Study Report Page 7 Upper Narragansett Bay Regional Stormwater Utility Feasibility Study
Key Advantages of a Stormwater Utility are:
It is Stable because it is not as dependent on the vagaries of the annual budgetary process as taxes are.
It is Adequate because a typical stormwater fee is based on a well thought out stormwater program to meet the needs and demands of the community, as well as other program drivers (e.g., water quality, regulations).
It is Flexible because fees can be established in a variety of manners and the program can be managed to fund activities based on changing priorities and needs.
It is Equitable because the cost is borne by the user on the basis of demand placed on the drainage system.
Since stormwater cannot compete effectively for general fund tax dollars, most local
governments find that only legally dedicated revenue will last the test of time and competing
priorities.
According to the Western Kentucky University 2013 Stormwater Utility Survey:
There are over 1,400 stormwater utilities in 39 states across the country2 and in these communities, the average population is 73,900 and the median is 19,200.
The average fee for a single family residence is $4.57/mo and the median fee is $3.75/mo.
Figure 1.2 Existing Stormwater Utilities (source: Campbell, C. Warren, 2013)
2 The Western Kentucky University survey captures data for known stormwater utilities nationwide based on information that is
readily available and various other sources. As noted in the 2013 study and based on AMEC’s experience, there are likely closer to 2,000 stormwater utilities in the U.S.

Phase I Feasibility Study Report Page 8 Upper Narragansett Bay Regional Stormwater Utility Feasibility Study
1.2 Regional Stormwater Utilities
Regional stormwater management and funding approaches are generally formed when there
are common drivers and economies of scale/efficiency to be gained. A regional approach to
managing stormwater can take on several different forms based on the needs of the
participating communities in the Upper Narragansett Bay region. First, it is important to
consider what “regional” means:
Regional Program: “we share common elements to address local and regional needs”
Regional Organization: “our administration is cooperative and our mission is clear”
Regional Funding: “our funding approach looks the same and saves cost”
Regional stormwater utilities can have varying authority, purpose and structure. Table 1.1
illustrates the range of governance/administration and funding options for a regional stormwater
management and funding approach.
Table 1.1 Variations in Regional Stormwater Management and Funding Approaches
Regional Approaches Independent Funding Each Has Similar Fee
Structure Utility & Fee*
Independent Programs
Move ahead independently
Gain economies in fee development only
Create an organization to collect and disburse funds only
Cooperative Multi-Municipal Programs
Each decides how to pay for partially cooperative program
Cooperate on similar fee and shared program where it makes sense
One “look” to citizens with cooperation in parts of program
Regional Umbrella Program
Each decides how to pay share of one program
Avoid financial entanglement but gain economies of scale
Each gives program and authority to separate entity
*Fees still may be different among the participating municipalities
Advantages and Disadvantages of a Regional Stormwater Program
In order for municipalities to achieve the efficiencies available through regional stormwater
programs, each community must be willing to resign some local authority to the regional effort.
Municipalities may be reluctant to participate in a regional effort because of the perception that:
Their constituents’ money may be spent on projects outside their jurisdiction;
Uncooperative regional members may threaten compliance with permits;
Administrative costs may be too high to coordinate a regional effort and for creating a new organization;
Concerns over creating a new “bureaucracy”;
Loss of local control on decision making and adequate response to local needs; and/or
Loss of control on priority setting.

Phase I Feasibility Study Report Page 9 Upper Narragansett Bay Regional Stormwater Utility Feasibility Study
Photo courtesy City of Warwick DPW
Source: Restoring the Ponds in Roger Williams Park, Horsley Witten Group, October 2013
However, regional programs can be created with great flexibility, tailored to the participating
municipalities’ needs and the level of cooperation to which they are comfortable. As with all
regional planning efforts, individual municipalities must sacrifice some control to the larger
community or authority in order to achieve long term gain. Possible advantages may include:
Economies of scale when performing services and pursuing contracts for services such as monitoring, street sweeping and specialized stormwater management expertise;
Greater access to sources of specialized expertise;
Ability to direct resources to projects watershed-wide that will have greater benefits to water quality and flooding, for example;
Spread costs across a larger rate payer base;
Increased ability to gain outside funding (i.e., state and federal grants);
Consistency of programs at a watershed level – across jurisdictions;
Ability to address larger problems;
More stable organizational structure that is less influenced by politics and elections; and
Consistency in services across watersheds.
Specific to the Upper Narragansett Bay communities, the following examples highlight the
advantages of a regional stormwater program:
Flooding Problems: the Pawtuxet River and Woonasquatucket River regularly flood and have significantly impacted the communities of Cranston, Warwick, Providence and North Providence. Flooding is a regional issue and requires significant resources for flood protection and mitigation.
Water Quality Issues: the Blackstone, Ten Mile, Woonasquatucket and Pawtuxet Rivers as well as Upper Narragansett Bay and Greenwich Bay all suffer water quality impacts from stormwater runoff. Restoring the quality of these waters and the recreational and commercial uses dependent upon improved water quality requires action across the contributing watershed spanning multiple municipalities. Freshwater ponds in the area are also affected. For example, the Roger Williams Park Ponds experience excessive algal growth and routine cyanobacteria blooms due to phosphorous primarily from stormwater runoff. Close to half of the phosphorus comes from the upper watershed (Tongue Pond, Spectacle Pond and Mashapaug Pond) located in Cranston and Providence – all of which experience similar water quality problems. Improvements to these ponds can only be
addressed through a watershed-based management approach.

Phase I Feasibility Study Report Page 10 Upper Narragansett Bay Regional Stormwater Utility Feasibility Study
Lack of Specialized Resources: many communities do not have trained staff or adequate resources for detailed infrastructure assessment to adequately evaluate drainage needs, water quality sampling, and investigation of stormwater improvements to address the RIPDES MS4 permit and TMDL requirements. An adequately funded regional program can more cost-effectively establish in-house technical capacity or contract out for the services needed to address local needs.
Interconnected Infrastructure: the drainage systems in nearly all communities are interconnected with adjacent communities and/or the Rhode Island Department of Transportation (RIDOT). Correcting a flooding or water quality problem often requires that multiple entities “fix” their system and coordination amongst independent departments can be very difficult. Additionally, the delineation of drainage systems and combined sewer systems in the communities of Pawtucket and Providence are poorly defined and the management of this infrastructure has an impact on the Narragansett Bay Commission’s interceptors and overall operations.
Additional feedback from the Steering Committee and Stakeholder Group regarding the pros and cons of a regional stormwater program is discussed further in Section 4.2.
Examples of Regional Stormwater Utilities
Regional stormwater utilities across the country provide examples of what can be done and how
it can be managed on a regional basis. Some national and local models are shown below to
provide some perspective.
The Louisville, Kentucky Metropolitan Sewer District (MSD) is a regional entity that provides the
following core services throughout the Louisville Metro:
Wastewater Collection and Treatment (270,000 accounts)
Stormwater Drainage and Management (376 mi2 area)
Flood Protection (Ohio River)
Under the stormwater program, the Louisville MSD’s responsibilities begin at the bottom of the
catch basin and continue to the stream systems. Small communities were required to
participate in the program under state law and large communities have a choice to be part of the
cooperative program. http://www.msdlouky.org
Other Regional Stormwater Utilities Include . . .

Phase I Feasibility Study Report Page 11 Upper Narragansett Bay Regional Stormwater Utility Feasibility Study
See Section 4.2 for a
more detailed discussion of the
regional approaches evaluated as part of
this study.
While Not the Same, Similar New England Examples Include . . .
The Long Creek Watershed Management District (LCWMD) was created
by interlocal agreement among the municipalities of South Portland,
Portland, Westbrook and Scarborough, Maine to create a collaborative
organizational structure with public entities and private businesses to
implement the Long Creek Watershed Management Plan. The program
focuses on restoration of the stream and 3.45 mi2 watershed using cost-
effective strategies that are funded by a fee of $3,000/year for each acre of impervious area on
properties with at least one acre of total impervious area. http://www.restorelongcreek.org
The Central Massachusetts Regional
Stormwater Coalition (CMRSWC) was
originally formed by a group of 13
communities working together to address
municipal stormwater management. The
CMRSWC has grown to 30 communities with inter-municipal agreements to participate in
collaborative planning efforts for surface water resource protection and to meet the
requirements of the EPA NPDES MS4 Permit in an efficient and cost-effective manner. The
CMRSWC was originally funded by a Community Innovation Grant by the Massachusetts
Executive Office of Administration and Finance. Although the CMRSWC is not a legal entity
that collects a fee, it is an example of a regional approach to stormwater management to
maximize the benefit and efficiency of activities across numerous communities.
http://centralmastormwater.org
Local (Rhode Island) Regional Example
Although it is focused solely on wastewater, the
most familiar example of a regional entity is the
Narragansett Bay Commission. The NBC’s mission
is to “maintain a leadership role in the protection and
enhancement of water quality in Narragansett Bay and its
tributaries by providing safe and reliable wastewater collection
and treatment services to its customers at a reasonable cost.”
NBC’s service area encompasses the metropolitan
Providence and Blackstone Valley areas, which include
Providence, North Providence, Johnston, Pawtucket, Central
Falls, Cumberland, Lincoln, the northern portion of East

Phase I Feasibility Study Report Page 12 Upper Narragansett Bay Regional Stormwater Utility Feasibility Study
Providence and small sections of Cranston and Smithfield. The service area incorporates the
combined sewer system (CSS) for stormwater and sanitary sewer in areas of Providence,
Central Falls and Pawtucket.
It should be noted that this Phase I Feasibility Study considered the NBC in the context of a
regional stormwater management and funding approach based on the physical infrastructure
(i.e., CSS) and inter-relationship with the study communities.
1.3 Study Approach
This study was completed by a Project Team consisting of representatives from RIDEM, the
City of Providence and a group of consultants. The Project Team worked with members of the
Steering Committee and Stakeholder Group to consider and evaluate a variety of topics
according to the following Scope of Work:
Task 1 – Facilitation of Sustainable Stormwater Solutions Steering Committee: 4 meetings
Task 2 – Facilitation of Stormwater Stakeholder Group: 3 meetings
Task 3 – Analysis of Local Stormwater Programs
Task 4 – Exploration of Regional Stormwater Management Alternatives
Task 5 – Roadmap for Implementation, Upper Narragansett Bay Regional Stormwater Utility
Task 6 – Phase I Feasibility Report
Task 7 – Briefing Material and PowerPoint for Local Elected Officials (pending)
Task 8 – Presentation to Local Officials (pending)
A more detailed discussion of each of these tasks and the overall process for this initial
feasibility study is provided in Appendix II.
1.4 Steering Committee
The Project Team worked with the participating municipalities to establish a Sustainable
Stormwater Solutions Committee (Steering Committee). Representatives were designated by
the Mayor or City/Town Manager of each participating municipality, as well as the Narragansett
Bay Commission. The Steering Committee provided direction during the feasibility study
process and reviewed the final recommendations and Phase I Feasibility Report. Steering
Committee members were also responsible for communication to and from their respective
department and/or board chairs. Copies of the Steering Committee meeting agendas,
presentations and meeting summaries are provided in Appendix III.
The members of the Steering Committee represent the participating municipalities, which are
key stakeholders in this process. The Steering Committee members generally consisted of
technical staff involved in stormwater management activities and/or financing of municipal
programs. Therefore, these members met separately from the community-based Stakeholder
Group based on their level of engagement and technical expertise related to the project.

Phase I Feasibility Study Report Page 13 Upper Narragansett Bay Regional Stormwater Utility Feasibility Study
Table 1.2 Sustainable Stormwater Solutions Steering Committee
Name Affiliation
Elaine Partridge Central Falls - Director of Public Works & Code Enforcement
Marie Twohey Central Falls - City Clerk
Ken Mason Cranston - Director of Public Works
Jason Pezzullo Cranston - Principal Planner
Erik Skadberg East Providence - City Engineer
Louis Lanni North Providence - Administrative Assistant to the Mayor
Lance Hill Pawtucket - Director of Public Works
Andrew Silvia Pawtucket - Chief of Project Development
Bill Bombard Providence - Acting Director of Public Works
Josh O’Neill Providence - Emergency Management Agency Recovery Coordinator
Dave Everett Providence - Principal Planner
Eric Earls Warwick - Engineering Division
Eric Hindinger Warwick - Engineering Division
Ray Marshall Narragansett Bay Commission - Executive Director
Tom Uva Narragansett Bay Commission - Director of Planning, Policy & Regulation
During Steering Committee Meeting #1, the members provided the following thoughts regarding
what they hoped to get out of the process and what concerns they had at the outset.
Education and Involvement
Create an ability to explain this to political leadership
Create an ability to explain the benefits even to local municipalities that are facing financial hardship
Define long term benefits and short term costs in an attractive and real way
Be able to quantify the financial gap in simple clear terms
Understand and be able to speak to the public perceptions and natural opposition to higher fees
Be able to differentiate between sewer and stormwater fees, and fees and taxes
Understand the value of past investments – and the return on investment going forward
Cooperation
Facilitate cooperation among communities
Create realistic expectations or objectives, cost and time frame
Define a geographic size or membership for the group that is realistic
Define an approach wherein a single entity cannot stall progress

Phase I Feasibility Study Report Page 14 Upper Narragansett Bay Regional Stormwater Utility Feasibility Study
Define a realistic and helpful state role
Define a realistic and helpful RIDOT role
Ensure we gain efficiencies through cooperation
Program
Take full advantage of experiences elsewhere
Insure all stormwater needs are met, not just water quality (e.g., FEMA)
This was the group’s initial reaction to and understanding of the project and process, but it
provides a good sense of the topics and issues that need to be addressed moving forward with
the broader public. This information is revisited in Section 3.3 to discuss the overall message
for an enhanced stormwater management program and regional approach.
1.5 Stakeholder Group
A Stakeholder Group was established to provide a broader perspective and ensure that the
larger community of interests was informed of the feasibility study process. Members of the
Stakeholder Group represented residents, businesses, developers, labor, academic institutions,
health professionals, community and environmental organizations, and other non-profits to
review the implications of creating an enhanced stormwater program with a sustainable revenue
source. Copies of the Stakeholder Group meeting agendas, presentations and meeting
summaries are provided in Appendix III.
The formation of the Stakeholder Group was led by the City of Providence and RIDEM with
input from the Project Team and Steering Committee to invite a diverse group of potential
stakeholders. The invitation and list of stakeholders invited is provided in Appendix III. Table
1.3 represents the stakeholders that participated in the Phase I Feasibility Study.
Table 1.3 Stormwater Stakeholder Group
Name Affiliation
Mark Van Noppen Armory Revival Company
Jonathan Ford Blackstone Park Conservancy
Meggie Patton Brown University
Kurt Teichert Brown University
Lauren Carson Clean Water Action
Jamie Rhodes Clean Water Action
Scott Duhamel Construction and Building Council
Len Bradley DiPrete Engineering
Meg Kerr Environment Council of RI/Blueways Alliance
John Sinnott Gilbane Building Company

Phase I Feasibility Study Report Page 15 Upper Narragansett Bay Regional Stormwater Utility Feasibility Study
Name Affiliation
Beshka Kendell Groundwork Providence
Sheri Lupoli Groundwork Providence
Marcus Mitchell Mt. Hope Neighborhood Association
Harold Gadon NBC Citizens Advisory Committee
Gale Gennaro Providence College
Dave Caldwell, Jr. RI Builders Association
Bob Vanderslice RI Department of Health
Marc Petrowicz RI Nursery & Landscape Association
Shannow Brawley RI Nursery & Landscape Association
Topher Hamblett Save the Bay
Barnaby Evans Waterfire

Phase I Feasibility Study Report Page 16 Upper Narragansett Bay Regional Stormwater Utility Feasibility Study
2.0 Current Stormwater Programs
This section provides a description of the stormwater programs within the Upper Narragansett
Bay (UNB) study area. A brief description of the region is provided below followed by the data
provided by each of the municipalities and a summary of the data analyzed. Information was
requested through a survey (see Appendix IV for template) and one-on-one interviews.
2.1 Regional Overview
For the purpose of this study, the UNB study area is defined as the following: Central Falls,
Cranston, East Providence, North Providence, Pawtucket, Providence and Warwick. The UNB
study area is home to approximately 510,740 residents and covers an area of nearly 113 square
miles that drains to the Narragansett Bay, as illustrated in Figure 2.1.

Phase I Feasibility Study Report Page 17 Upper Narragansett Bay Regional Stormwater Utility Feasibility Study
Figure 2.1 Upper Narragansett Bay Study Area
Water quality monitoring within the Upper Narragansett Bay Watershed shows that a number of
streams and other water bodies are listed as impaired. Additional information regarding the
impaired waters for each of the participating municipalities and Total Maximum Daily Load
(TMDL) study requirements3 is provided in Appendix I. To date, the RI Department of
3 TMDL requirements will be incorporated into the re-issuance of the RIPDES MS4 Permit and require
regulated municipalities to implement the recommendations of the TMDL study, which include: increased pollution prevention activities (e.g., operation and maintenance of the MS4); illicit discharge detection and elimination activities to remove pollutant sources; and capital construction projects to treat stormwater.
Phase I Feasibility Study Report Page 18 Upper Narragansett Bay Regional Stormwater Utility Feasibility Study
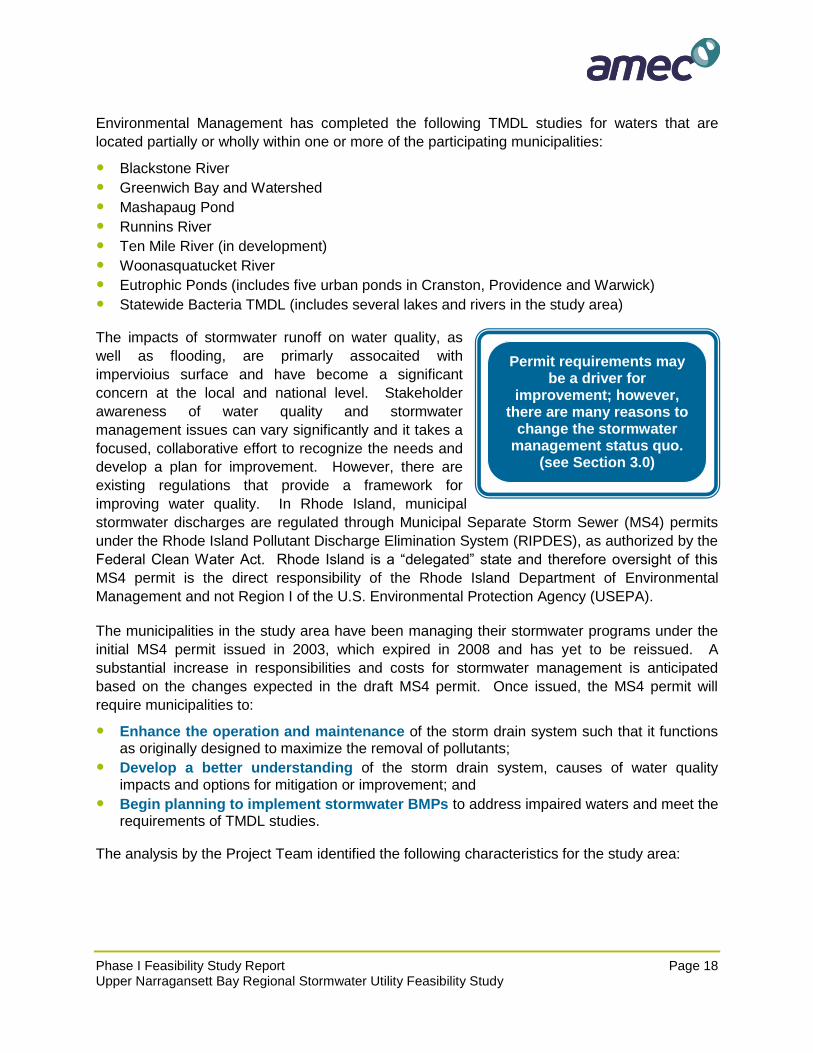
Permit requirements may
be a driver for improvement; however,
there are many reasons to change the stormwater
management status quo. (see Section 3.0)
Environmental Management has completed the following TMDL studies for waters that are
located partially or wholly within one or more of the participating municipalities:
Blackstone River
Greenwich Bay and Watershed
Mashapaug Pond
Runnins River
Ten Mile River (in development)
Woonasquatucket River
Eutrophic Ponds (includes five urban ponds in Cranston, Providence and Warwick)
Statewide Bacteria TMDL (includes several lakes and rivers in the study area)
The impacts of stormwater runoff on water quality, as
well as flooding, are primarly assocaited with
impervioius surface and have become a significant
concern at the local and national level. Stakeholder
awareness of water quality and stormwater
management issues can vary significantly and it takes a
focused, collaborative effort to recognize the needs and
develop a plan for improvement. However, there are
existing regulations that provide a framework for
improving water quality. In Rhode Island, municipal
stormwater discharges are regulated through Municipal Separate Storm Sewer (MS4) permits
under the Rhode Island Pollutant Discharge Elimination System (RIPDES), as authorized by the
Federal Clean Water Act. Rhode Island is a “delegated” state and therefore oversight of this
MS4 permit is the direct responsibility of the Rhode Island Department of Environmental
Management and not Region I of the U.S. Environmental Protection Agency (USEPA).
The municipalities in the study area have been managing their stormwater programs under the
initial MS4 permit issued in 2003, which expired in 2008 and has yet to be reissued. A
substantial increase in responsibilities and costs for stormwater management is anticipated
based on the changes expected in the draft MS4 permit. Once issued, the MS4 permit will
require municipalities to:
Enhance the operation and maintenance of the storm drain system such that it functions as originally designed to maximize the removal of pollutants;
Develop a better understanding of the storm drain system, causes of water quality impacts and options for mitigation or improvement; and
Begin planning to implement stormwater BMPs to address impaired waters and meet the requirements of TMDL studies.
The analysis by the Project Team identified the following characteristics for the study area:
Phase I Feasibility Study Report Page 19 Upper Narragansett Bay Regional Stormwater Utility Feasibility Study
Programs:
– Many municipal programs are very limited with reactive maintenance of the collection system for both the CSS and MS4 systems. These activities include street sweeping and catch basin cleaning.
– Capital expenditures are limited and there is no clearly defined approach to address impaired waters and TMDLs.
– Understanding of the CSS and MS4 systems is poor in areas of some communities.
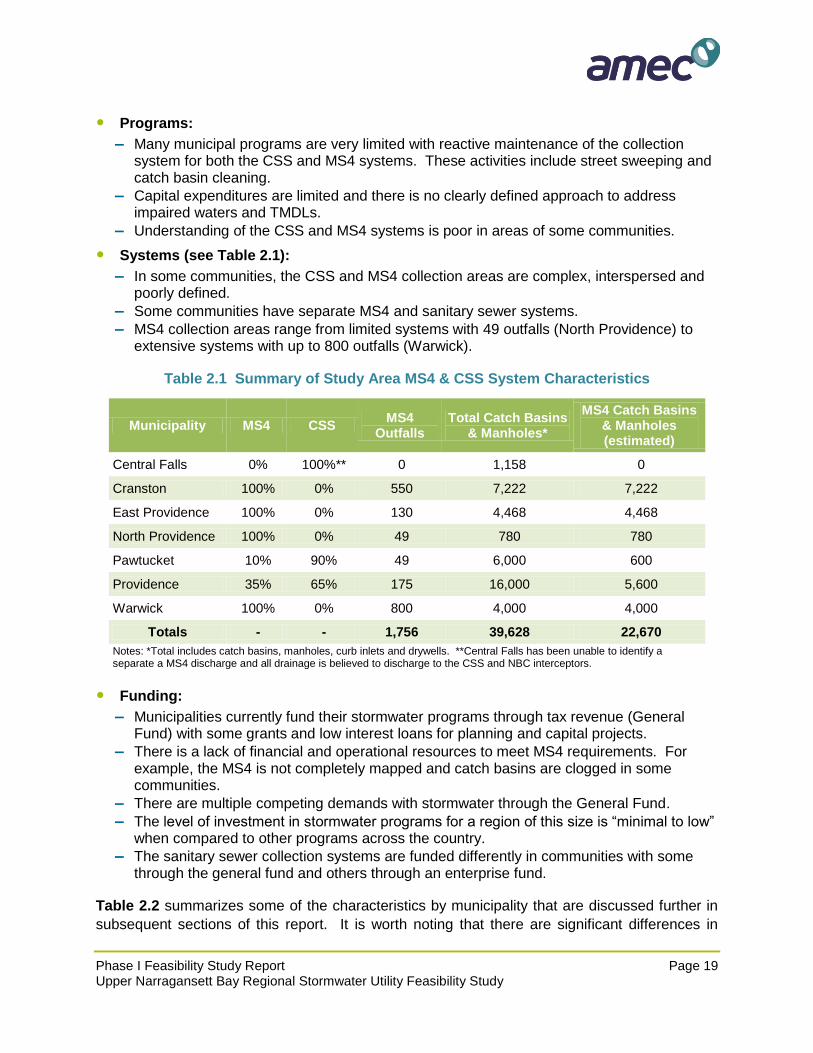
Systems (see Table 2.1):
– In some communities, the CSS and MS4 collection areas are complex, interspersed and poorly defined.
– Some communities have separate MS4 and sanitary sewer systems.
– MS4 collection areas range from limited systems with 49 outfalls (North Providence) to extensive systems with up to 800 outfalls (Warwick).
Table 2.1 Summary of Study Area MS4 & CSS System Characteristics
Funding:
– Municipalities currently fund their stormwater programs through tax revenue (General Fund) with some grants and low interest loans for planning and capital projects.
– There is a lack of financial and operational resources to meet MS4 requirements. For example, the MS4 is not completely mapped and catch basins are clogged in some communities.
– There are multiple competing demands with stormwater through the General Fund.
– The level of investment in stormwater programs for a region of this size is “minimal to low” when compared to other programs across the country.
– The sanitary sewer collection systems are funded differently in communities with some through the general fund and others through an enterprise fund.
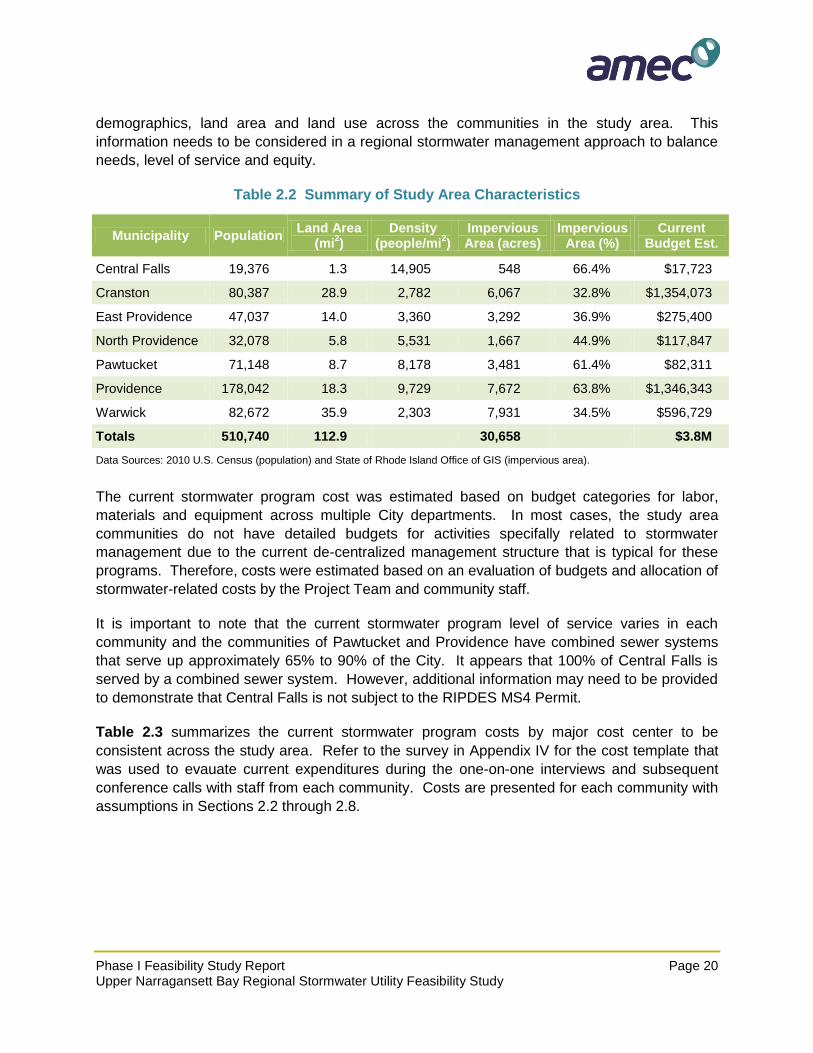
Table 2.2 summarizes some of the characteristics by municipality that are discussed further in
subsequent sections of this report. It is worth noting that there are significant differences in
Municipality MS4 CSS MS4
Outfalls Total Catch Basins
& Manholes*
MS4 Catch Basins & Manholes (estimated)
Central Falls 0% 100%** 0 1,158 0
Cranston 100% 0% 550 7,222 7,222
East Providence 100% 0% 130 4,468 4,468
North Providence 100% 0% 49 780 780
Pawtucket 10% 90% 49 6,000 600
Providence 35% 65% 175 16,000 5,600
Warwick 100% 0% 800 4,000 4,000
Totals - - 1,756 39,628 22,670
Notes: *Total includes catch basins, manholes, curb inlets and drywells. **Central Falls has been unable to identify a separate a MS4 discharge and all drainage is believed to discharge to the CSS and NBC interceptors.
Phase I Feasibility Study Report Page 20 Upper Narragansett Bay Regional Stormwater Utility Feasibility Study
demographics, land area and land use across the communities in the study area. This
information needs to be considered in a regional stormwater management approach to balance
needs, level of service and equity.
Table 2.2 Summary of Study Area Characteristics
The current stormwater program cost was estimated based on budget categories for labor,
materials and equipment across multiple City departments. In most cases, the study area
communities do not have detailed budgets for activities specifally related to stormwater
management due to the current de-centralized management structure that is typical for these
programs. Therefore, costs were estimated based on an evaluation of budgets and allocation of
stormwater-related costs by the Project Team and community staff.
It is important to note that the current stormwater program level of service varies in each
community and the communities of Pawtucket and Providence have combined sewer systems
that serve up approximately 65% to 90% of the City. It appears that 100% of Central Falls is
served by a combined sewer system. However, additional information may need to be provided
to demonstrate that Central Falls is not subject to the RIPDES MS4 Permit.
Table 2.3 summarizes the current stormwater program costs by major cost center to be
consistent across the study area. Refer to the survey in Appendix IV for the cost template that
was used to evauate current expenditures during the one-on-one interviews and subsequent
conference calls with staff from each community. Costs are presented for each community with
assumptions in Sections 2.2 through 2.8.
Municipality Population Land Area
(mi2)
Density (people/mi
2)
Impervious Area (acres)
Impervious Area (%)
Current Budget Est.
Central Falls 19,376 1.3 14,905 548 66.4% $17,723
Cranston 80,387 28.9 2,782 6,067 32.8% $1,354,073
East Providence 47,037 14.0 3,360 3,292 36.9% $275,400
North Providence 32,078 5.8 5,531 1,667 44.9% $117,847
Pawtucket 71,148 8.7 8,178 3,481 61.4% $82,311
Providence 178,042 18.3 9,729 7,672 63.8% $1,346,343
Warwick 82,672 35.9 2,303 7,931 34.5% $596,729
Totals 510,740 112.9 30,658 $3.8M
Data Sources: 2010 U.S. Census (population) and State of Rhode Island Office of GIS (impervious area).

Phase I Feasibility Study Report Page 21 Upper Narragansett Bay Regional Stormwater Utility Feasibility Study
Table 2.3 Summary of Current Budgets by Cost Center for Study Area (2014)
Key Cost Center Totals Central
Falls Cranston
East Providence
North Providence
Pawtucket Providence Warwick
Administration $ 133,067 $ 2,508 $ 23,504 $ 15,000 $ 15,000 $ 497 $ 70,129 $ 6,429
Indirect cost allocation (20%) $ 631,738 $ 2,954 $ 225,679 $ 45,900 $ 19,641 $ 13,719 $ 224,390 $ 99,455
Operations & Maintenance $ 1,902,633 $ 12,261 $ 536,551 $ 157,000 $ 70,750 $ 38,279 $ 899,112 $ 188,681
Engineering & Master Planning
$ 319,547 $ - $ 8,481 $ 37,000 $ - $ 11,118 $ 107,262 $ 155,687
Regulation/ Enforcement $ 68,671 $ - $ 9,858 $ - $ - $ 3,700 $ 45,450 $ 9,663
Capital Improvement Projects*
$ 685,614 $ - $ 550,000 $ - $ - $ 15,000 $ - $ 135,614
Major Capital Projects $ 337,434 $ - $ 300,000 $ - $ - $ - $ - $ 37,434
Minor Capital Projects $ 363,181 $ - $ 250,000 $ - $ - $ 15,000 $ - $ 98,181
Water Quality Monitoring $ 34,156 $ - $ - $ 20,500 $ 12,456 $ - $ - $ 1,200
Totals $ 3,790,426 $ 17,723 $ 1,354,073 $ 275,400 $ 117,847 $ 82,311 $ 1,346,343 $ 596,729

Phase I Feasibility Study Report Page 22 Upper Narragansett Bay Regional Stormwater Utility Feasibility Study
2.2 Central Falls
The City of Central Falls is approximately 1.3 square miles in area. The City is mostly comprised of dense residential, industrial and commercial areas. Table 2.4 below summarizes the land use in the City from 2011 data available through the State of Rhode Island GIS database.
Table 2.4 Land Use in Central Falls
Land Use Type Percent Coverage in
Central Falls
High Density Residential 30.1%
Industrial 19.3%
Commercial 15.4%
Water 11.9%
Wetland 7.8%
Railroad Facilities 6.5%
Institutional 2.8%
Deciduous Forest 1.8%
Cemeteries 1.5%
Developed Recreation 1.4%
Other 1.5%
Central Falls Impervious Cover Map (66.4% Impervious)

Phase I Feasibility Study Report Page 23 Upper Narragansett Bay Regional Stormwater Utility Feasibility Study
Leadership/ Governance: Central Falls currently operates under a Mayor and City Council
form of government. The current mayor is James A. Diossa and the City Council has five
members each from one of five City wards. The council is comprised of a president, claims
committee chair, pro tempore and two other members.
Population: As reported by the Rhode Island Department of Labor and Training the 2000
census reported a population of 18,928 and the 2010 census reported a population of 19,376
marking a 2.4% percent increase in population over the ten year span.
Economic Condition: The State of Rhode Island categorizes the City of Central Falls as a
financially depressed community. This status is assigned when a community has an average
income less than 80% of the average income of the state. The City declared bankruptcy in 2011
and is currently operating under a 5 year recovery plan.
Key Industry: The largest employers in Central Falls include Murdock Webbing Company,
Osram Sylvannia and Fuller Box, making manufacturing (textiles, lighting and packaging) the
leading industry.
2.2.1 Stormwater System & Local Issues
Based on discussions with City staff, 100% of Central Falls is served by a gravity fed combined
sewer system with approximately 1,158 structures that are treated by the NBC’s Bucklin Point
Wastewater Treatment Facility (WWTF) in East Providence. Some stormwater flows overland
to the Blackstone and Moshassuck Rivers, but there are no drainage conveyance structures.
Since 2003, the City of Central Falls has been participating in the RIPDES MS4 Permit program
due to the lack of definitive mapping information for the MS4 and CSS systems. The Rhode
Island Department of Transportation (RIDOT) provided outfall mapping information to the City of
Central Falls in 2006 and identified 7 outfalls associated with the CSS system that represent
combined sewer overflows (CSOs). A drawing of CSO 001 is provided as Figure 2.2.
Figure 2.2 CSO Discharge 001 in Central Falls

Phase I Feasibility Study Report Page 24 Upper Narragansett Bay Regional Stormwater Utility Feasibility Study
The RIDOT 2006 report also discussed dry weather inspections of the CSOs and identified
some locations with dry weather flow that may require further investigation. Based on this
information, it appears that the City’s combined sewer system should be addressed with RIDEM
and NBC, as appropriate and required by existing regulations. CSO #102 has been blocked
according to NBC’s Concept Design Report Amendment – 2nd Reaffirmation, dated 2011. In
Phase 3 of NBC’s CSO program, the NBC plans to either block, modify regulators or do
floatables control at CSOs #101 and #107. The NBC plans to divert CSO #103, #104 and #105
via a new CSO pipeline to the proposed Phase 3 tunnel that will receive treatment at the Bucklin
Point WWTF.
In addition to the CSS, the City has approximately 27 miles of roads that they are responsible
for operating and maintaining. No data is available for structural stormwater BMPs, except for
pervious pavement at the Ledge Street parking lot (muncipal property).
Funding Sources: The City has not set aside funding for capital improvements and current
DPW operations are funded under the general fund, which includes the stormwater program.
Some fees are collected for road opening and sewer permits.
Compelling Issues and Concerns About a Regional Stormwater Utility: During the one-on-
one interview to gather information for this study, City staff identified the following stormwater-
related issues in the City in order of importance:
1. Aging infrastructure
2. Compliance requirements
3. Quality of life and aesthetics
City staff indicated that flooding is not a significant concern, but some localized street flooding
occurs when inlet structures become clogged with debris. For example, this occurs frequently
along Higginson Avenue at the High Street underpass, near the Wyatt Detention Facility.
The concerns for implementing a regional stormwater utility for Central Falls were identified in
the following order of importance:
1. One area “bailing out” another one – “paying for another’s past sins” (tied for first)
2. Building a bureaucracy – “fee creep” (tied for first)
3. Consistency in treatment, fairness – “getting my share”
4. Responsiveness – “who controls priorities”
5. Being penalized for another’s non-compliance
6. Being dominated by one entity
In general, City staff felt that a regional stormwater utility does not seem appropriate for the City
of Central Falls since there is no separate storm sewer system. However, City staff felt that a
regional planning and collaboration may benefit the City to address stormwater issues as they
related to the operation and maintenance of the CSS.

Phase I Feasibility Study Report Page 25 Upper Narragansett Bay Regional Stormwater Utility Feasibility Study
DPW Director
Foreman/ Investigator
Backhoe Operator
Stetco Operator
Aqua-Jetter Operator
Laborer Mechanic
Public Awareness: City staff rated the level of community awareness as low and the following
sensitive issues were noted: rate affordability; no new fees or taxes; and political issues.
Available Data: The City of Central Falls does not maintain a geographic information system
(GIS) and relies on the GIS available through the state. As a result, the updated Statewide
Impervious Cover layer is the best available data for Central Falls. A GIS parcel layer was
acquired from RIDEM, but this layer consisted strictly of physical data and did not contain
attributes such as land use by parcel. The Tax Assessor’s database was not provided during
this study to provide data for land use by parcel. This data will be necessary for a more detailed
revenue and rate analysis under a stormwater utility.
2.2.2 Program Management & Level of Service
Stormwater in the City of Central Falls is handled through the combined sewer system (CSS);
therefore, the management (operation and maintenance) of the system falls under the
Wastewater Collection System Maintenance Department. No significant activities (e.g.,
stormwater master planning, floodplain management) are conducted by other City departments.
An organizational chart for the Wastewater Collection System Maintenance Department is
provided below.
The stormwater program is nearly non-existent in Central Falls since 100% of the City is served
by a combined sewer system. Therefore, activities such as street sweeping and catch basin
cleaning are conducted within areas that drain to the CSS. Approximately 20-30% of the catch
basins within the City are cleaned annually and about 5% of the trunk lines are jetted annually.
The City recently purchased a truck for catch basin cleaning to increase the annual cleaning
frequency and the City has increased street sweeping to 4 days a week from spring to fall. City
staff indicate that grease is a significant issue in the CSS.
The stormwater program cost was estimated based on the percent of DPW labor related to
stormwater program planning (e.g., MS4 annual reports) and coordination of stormwater related

Phase I Feasibility Study Report Page 26 Upper Narragansett Bay Regional Stormwater Utility Feasibility Study
maintenance activities with other entities (i.e., NBC, neighboring communities). This information
was organized by major cost center to be consistent across the study area, as summarized in
Table 2.5 below.
Table 2.5 Central Falls Current Stormwater Program Cost
Major Cost Center Cost Notes/Assumptions
Administration $2,508 Labor for DPW administration (<1%)
Indirect Cost Allocation (20%) $2,954 % total budget
Operations and Maintenance $12,261 Labor for DPW activites (<1%)
Engineering and Master Planning $0 CSS only, none for MS4
Regulation/Enforcement $0 CSS only, none for MS4
Capital Improvement Projects $0 CSS only, none for MS4
Major Capital Projects $0
Minor Capital Projects $0
Water Quality Monitoring $0 None conducted
Total $17,723
2.3 Cranston
Cranston Impervious Cover Map
(32.8% Impervious)

Phase I Feasibility Study Report Page 27 Upper Narragansett Bay Regional Stormwater Utility Feasibility Study
The City of Cranston is 28.9 square miles in area and is mostly comprised of forest, roadways,
and residential areas. Table 2.6 below summarizes the land use in the City from 2011 data
available through the State of Rhode Island GIS database.
Table 2.6 Land Use in Cranston
Land Use Type Percent Coverage in
Cranston
Deciduous Forest 26.0%
Water 12.7%
Roads 11.2%
High Density Residential 10.0%
Medium High Density Residential 9.0%
Medium Density Residential 6.3%
Commercial 5.7%
Mixed Forest 2.6%
Mines, Quarries, Gravel Pits 2.6%
Industrial 2.3%
Institutional 2.1%
Cropland 2.0%
Developed Recreation 1.6%
Other 5.9%
Leadership/ Governance: Cranston operates under a Mayor-City Council form of government.
The current mayor is Allan Fung and the City Council is comprised of members representing six
wards and three councilors at large.
Population: As reported by the Rhode Island Department of Labor and Training the 2000
census reported a population of 79,269 and the 2010 census reported a population of 80,387 in
the City of Cranston. This represents a 1.4% increase in population over the ten year span.
Economic Condition: Staff reports that the City currently operates with no deficits, but that
budgetary flexibility is minimal.
Key Industry: Key industries in Cranston include retail, light manufacturing, and dining. Large
businesses in the City include Pepsi Bottling Group, Falvey Linen & Uniform Supply, and
Walmart.
2.3.1 Stormwater System & Local Issues
Cranston has a completely separate MS4 system. City staff report that the MS4 system was
originally constructed as a separate system and was never combined with the sanitary sewer
system. The City maintains approximately 318 miles of City roads, 117 miles of drainage piping,

Phase I Feasibility Study Report Page 28 Upper Narragansett Bay Regional Stormwater Utility Feasibility Study
7,222 catch basins and manholes and 550 MS4 outfalls. The City inspects and maintains 6
BMPs that were installed as part of the Stillhouse Cove revetment and drainage improvements
to Narragansett Bay.
Funding Sources: The City currently has $300,000 available from a $6M bond (2008) for
capital improvement projects for stormwater infrastructure. The remaining stormwater program
is funded through the General Fund.
Compelling Issues and Concerns About a Regional Stormwater Utility: During the one-on-
one interview to gather information for this study, City staff identified the following stormwater-
related issues in the City, in no particular order:
Flooding problems
Aging infrastructure
Development pressures
Ecological concerns
Preservation of property value
City staff indicated that the Labor Day
floods of 2010 had a major impact and
the City is still recovering. In March
2010, after 5 inches of rain, the Pawtuxet
River overflowed and impacted many
sites such as the Warwick Mall, Contour
Dental Laboratories, and the CLCF
Building.
The following concerns for implementing a regional stormwater utility in Cranston were
identified, in no particular order:
One area “bailing out” another one – “paying for another’s past sins”
Losing local control of zoning, land use, etc. – “big brother decides for me”
Building a bureaucracy – “fee creep”
Consistency in treatment, fairness – “getting my share”
Being dominated by one entity
Public Awareness: Outreach and education efforts in the City include distribution of brochures
regarding stormwater related issues in the City, updates on the City webpage and coordination
with nonprofit organizations. City staff reported the overall stormwater awareness in the general
population to be fairly low; however, a fraction of the population is aware of stormwater related
issues. This group is mostly comprised of individuals in environmental groups and those
subject to recent flooding events. The following sensitive issues were noted: rate affordability;
no new taxes or fees; and flooding issues.
Available Data: The City of Cranston has mapped their storm sewer system in GIS including
outfalls, catch basins, and manholes. In 2012, a cursory update to the 2003 Statewide

Phase I Feasibility Study Report Page 29 Upper Narragansett Bay Regional Stormwater Utility Feasibility Study
Planning Department
DPW Director
Engineering
Survey Crew
Highway Foreman
Sweeper Operators (2)
Equipment Operator
Laborer Truck Drivers
(2)
Parks & Recreation
Fleet Maintenance
IT Division Inspections Department
Impervious Cover layer was conducted for Cranston as part of an initial stormwater utility
feasibility study conducted by the RIDEM Office of Water Resources. In order to maintain a
consistent methodology for the capture of impervious area in the UNB region, the recently
updated Statewide Impervious Cover layer was used for the Phase I Study. A GIS parcel layer,
containing land use data by parcel, was acquired from RIDEM as part of the study. The Tax
Assessor’s database was not provided during this study to provide data for land use by parcel.
This data will be necessary for a more detailed revenue and rate analysis under a stormwater
utility.
2.3.2 Program Management & Level of Service
Management of the stormwater program in the City of Cranston primarily falls under the
Department of Public Works, which includes the Department of Highway Maintenance,
Department of Enginering and the Division of Fleet Maintenance. Other City departments play a
role in stormwater management, including: Department of Planning for floodplain management
and stormwater master planning; Department of Inspections for enforcement; and Division of
Information Technology for GIS and stormwater program data management. An organizational
chart for management of the stormwater program is provided below.

Phase I Feasibility Study Report Page 30 Upper Narragansett Bay Regional Stormwater Utility Feasibility Study
The MS4 system in Cranston is
extensive and requires a significant effort
for operation and maintenance.
Approximately 1,500 (20%) catch basins
within the City are cleaned annually and
over 1,000 road miles are swept
annually. The City has a more frequent
inspection and maintenance schedule for
catch basins in areas that drain to
impaired waters with a completed TMDL
Study, which include: Stillhouse Cove,
Spectacle Pond and the Roger Williams
Park Ponds. The City evaluated the
TMDL study for Spectacle Pond and
subsequently developed the Lake Street
Outfall Maintenance Project to address stormwater management and nutrient issues that are
impacting Spectacle Pond. The project is scheduled to be constructed in 2014.
The stormwater program cost was estimated based on DPW budget categories for labor,
materials and equipment and the percent that City staff felt was solely dedicated to stormwater.
This information was organized by major cost center to be consistent across the study area, as
summarized in Table 2.7 below.
Table 2.7 Cranston Current Stormwater Program Cost
Major Cost Center Cost Notes/Assumptions
Administration $23,504 Labor for DPW administration
Indirect Cost Allocation (20%) $225,679 % total budget
Operations and Maintenance $536,551 Labor across multiple depts., materials & expenses
Engineering and Master Planning $8,481 Labor across multiple departments
Regulation/Enforcement $9,858 Labor across multiple departments
Capital Improvement Projects $550,000 Total
Major Capital Projects $300,000 City-wide drainage improvements
Minor Capital Projects $250,000 Water quality projects (Lake St. Outfall)
Water Quality Monitoring $0 None conducted
Total $1,354,073

Phase I Feasibility Study Report Page 31 Upper Narragansett Bay Regional Stormwater Utility Feasibility Study
2.4 East Providence
The City of East Providence is approximately 14 square miles and land use is generally more
residential than many of the other municipalities in the study area, but also includes significant
forested area and commercial areas. Table 2.8 below summarizes the land use in the City of
East Providence from 2011 data available through the State of Rhode Island GIS database.
Table 2.8 Land Use in East Providence
Land Use Type Percent Coverage in
East Providence
Medium High Density Residential 24.0%
Deciduous Forest 20.7%
High Density Residential 11.6%
Commercial 9.9%
Developed Recreation 6.0%
Industrial 4.3%
Water 3.5%
Institutional 2.8%
Wetland 2.6%
East Providence Impervious Cover Map
(36.9% Impervious)

Phase I Feasibility Study Report Page 32 Upper Narragansett Bay Regional Stormwater Utility Feasibility Study
Land Use Type Percent Coverage in
East Providence
Roads 2.4%
Medium Density Residential 1.8%
Vacant Land 1.6%
Brushland 1.4%
Cemeteries 1.4%
Other Transportation 1.3%
Transitional Areas 1.2%
Other 3.5%
Leadership/ Governance: East Providence has a City Council with a City Manager (currently
Paul Lemont). The City Council consists of five elected officials, one from each of the four wards
within the City and one elected at-large. The Mayor and Assistant Mayor are elected by the
Council from among its members. The Mayor presides at Council meetings and is the
ceremonial head of City Government. The Assistant Mayor acts as Mayor during the absence or
disability of the Mayor.
Population: As reported by the Rhode Island Department of Labor and Training the 2000
Census reported a population of 48,688 and the 2010 Census reported a population of 47,037
in the City of East Providence, marking a -3.4% percent change in population over the ten year
span.
Economic Condition: The City of East Providence is considered to be financially stable. The
City initiated a budget commission to assure the implementation of appropriate measures to
secure the financial stability of the City. The Commission was established by the Director of
Revenue on December 11, 2011 and was dissolved by the Director of Revenue on September
16, 2013, pursuant to the determination of fiscal stability.
Key Industry: Key Industries in East Providence include manufacturing (Aspen Aerogels),
energy management (Eaton Corporation), automotive sales, banking, technology, insurance
provision, recreation and medical services.
2.4.1 Stormwater System & Local Issues
East Providence has a fully separate storm sewer system. Staff report that the system was built
as a separate system. The existing storm drain system was constructed between the 1800s and
1980s. There are 66 miles of drains all connected to a MS4. Additionally there are two miles of
drainage swales. The City has 2,109 catch basins, 955 curb inlets, 1,354 drainage manholes,
50 drywells and 133 outfalls. The City also maintains 28 BMPs annually and sweeps 150 City-
owned miles of road twice a year. BMPs maintained by the City include: detention basins, grass
swales, and proprietary systems (e.g., Stormceptors).
Phase I Feasibility Study Report Page 33 Upper Narragansett Bay Regional Stormwater Utility Feasibility Study
Funding Sources: Funding for the City’s stormwater services is budgeted through the General
Fund. Additional funding for water quality improvement projects has historically been provided
through grants.
Compelling Issues and Concerns About a Regional Stormwater Utility: During the one-on-
one interview to gather information for this study, City staff identified the following stormwater-
related issues in order of priority:
1. Flooding problems
2. Quality of life and aesthetics
3. Aging infrastructure
4. Water quality protection
The following concerns for implementing a regional stormwater utility in East Providence were
identified, in no particular order:
One area “bailing out” another one – “paying for another’s past sins
Losing local control of zoning, land use, etc. – “big brother decides for me”
Building a bureaucracy – “fee creep”
Consistency in treatment, fairness – “getting my share”
Being dominated by one entity
Public Awareness: The City of East Providence has developed a number of community
outreach programs. Recently the City distributed recycling pamphlets, completed a shoreline
clean-up project and included educational brochures in water bills. City staff reported the
overall stormwater awareness in the general population to be low and noted the following
sensitive issues in the community, in no particular order:
Rate affordability
No new fees or taxes
Political issues
Flood reduction
Regarding rate affordability, the City is well aware of the recent sanitary sewer rate increases
due to the upgrades at the Wastewater Treatment Plant for nitrogen removal and pump station
rehabilitation that were completed in May 2013 at a cost of $52M. Also, water rates will likely
increase due to system improvements that are needed. A $19M bond for the improvements is
currently before the City for approval.
Available Data: The City of East Providence has a GIS database that includes parcel
boundaries, the storm drain network and sanitary sewer network. However, this database does
not include an impervious cover layer. As a result, the updated Statewide Impervious Cover
layer was used for East Providence. A GIS parcel layer was acquired from RIDEM, but this
layer contained geospatial data and did not contain attributes such as land use by parcel. The
Tax Assessor’s database was not provided during this study to provide data for land use by

Phase I Feasibility Study Report Page 34 Upper Narragansett Bay Regional Stormwater Utility Feasibility Study
DPW Director
City Engineer
Inspector GIS Coordinator
Highway Superintendent
Equipment Operators (3)
Laborers (3)
Asst. Highway Superintendents
(2)
parcel. This data will be necessary for a more detailed revenue and rate analysis under a
stormwater utility.
2.4.2 Program Management & Level of Service
Management of the stormwater program in the City of East Providence primarily falls under the
Department of Public Works. The DPW coordinates with staff in the Planning Department, but
these staff do not have a significant role in stormwater management. An organizational chart for
management of the stormwater program is provided below.
The MS4 system in East Providence requires a significant effort for operation and maintenance,
including the inspection and maintenance of BMPs by the Public Works Department.
Approximately 525 (25%) catch basins within the City are cleaned annually and pipes are
cleaned as needed using a jet/vac truck.
The stormwater program cost was estimated based on DPW budget categories for labor,
materials and equipment and the percent that City staff felt was solely dedicated to stormwater.
This information was organized by major cost center to be consistent across the study area, as
summarized in Table 2.9 below.

Phase I Feasibility Study Report Page 35 Upper Narragansett Bay Regional Stormwater Utility Feasibility Study
Table 2.9 East Providence Current Stormwater Program Cost
Major Cost Center Cost Notes/Assumptions
Administration $15,000 Labor for DPW administration
Indirect Cost Allocation (20%) $45,900 % total budget
Operations and Maintenance $157,000 Labor across multiple depts., materials & expenses
Engineering and Master Planning $37,000 Labor across multiple departments
Regulation/Enforcement $0 No significant costs
Capital Improvement Projects $0 None at this time
Major Capital Projects $0 N/A
Minor Capital Projects $0 N/A
Water Quality Monitoring $20,500 RIPDES Permit, water quality monitoring, IDDE
Total $275,400
2.5 North Providence
The Town of North Providence is approximately 5.8 square miles and is made up of primarily
residential land use with some forest, commercial and industrial areas. Table 2.10 below
summarizes the land use in North Providence from 2011 data available through the State of
Rhode Island GIS database.
North Providence Impervious Cover Map
(44.9% Impervious)

Phase I Feasibility Study Report Page 36 Upper Narragansett Bay Regional Stormwater Utility Feasibility Study
Table 2.10 Land Use in North Providence
Land Use Type Percent Coverage in
North Providence
Roads 26.8%
High Density Residential 23.3%
Deciduous Forest 22.2%
Medium High Density Residential 18.4%
Commercial 2.4%
Institutional 1.5%
Water 1.3%
Medium Density Residential 1.0%
Other 3.1%
Leadership/ Governance: North Providence is governed by a Mayor and Town Council form of
government. The current Mayor is Charles Lombardi, who serves as the executive chief and
administrative officer, as well as the Town’s Public Safety Director. The Town Council consists
of seven members: two elected from each of three Town districts and a Council-at-Large.
Population: As reported by the Rhode Island Department of Labor and Training the 2000
Census reported a population of 32,411 and the 2010 Census reported a population of 32,078
in the Town of North Providence, marking a -1.0% percent change in population over the ten
year span.
Economic Condition: Educational, health care and social assistance industries experienced
the most growth in recent years while the manufacturing industry experienced a downturn.
Key Industry: Based on 2009 employment rates from the North Providence Comprehensive
Plan, key industries in the Town include manufacturing; retail trade; finance and insurance;
educational, social and health care services; and arts, entertainment and recreation.
2.5.1 Stormwater System & Local Issues
The existing storm drain system is approximately 100 years old and several areas of flooding in
North Providence have been noted during wet weather by Town representatives. North
Providence is partially built on the Woonasquatucket River and West River, which occasionally
experience flooding and overtopping. Each river has a number of tributaries throughout North
Providence which also experience flooding during wet weather, causing issues for many
neighborhoods throughout the Town. The Town has approximately 115 miles of public streets,
780 municipally owned catch basins and 49 outfalls.
Funding Sources: The DPW has an annual budget of approximately $70,000 for all stormwater
related activities that is paid through the General Fund. An additional $15,000 budget for a part
time Stormwater Coordinator has historically been paid for through grants. Since the beginning

Phase I Feasibility Study Report Page 37 Upper Narragansett Bay Regional Stormwater Utility Feasibility Study
of the MS4 General Permit the Town has spent approximately $12,500 per year on permit
compliance activities that include: annual reporting, equipment, ordinances, BMP surveys and
planning documents. This money has been paid with reimbursable grant funding. Tables 2.11
and 2.12 below show recent fiscal year budgets and MS4 costs incurred from 2003 - 2012,
respectively.
Table 2.11 Department of Public Works Stormwater-Related Budget
for Two Recent Fiscal Years
Budget Item Existing
FY 2011 - 2012 Proposed
FY 2012 - 2013
Street Sweeping $20,000 $20,000
Water Jet Operator $34,174 $35,193
Sand, Gravel and Pea Stone $1,000 $1,000
Weed and Pest Control $750 $750
Sewer Maintenance $10,000 $10,000
Pipes and Collars $1,500 $1,500
Supplies $2,500 $2,500
TOTAL $69,924 $70,943
Table 2.12 Costs Incurred by North Providence for
MS4 Storm Water General Permit Compliance from 2003-2012
Item Approximate Cost
Annual Reporting (x8) $24,000
Outfall Surveys and Equipment $30,500
Ordinances (x3) $9,000
BMP Surveys $2,000
Planning Documents $34,150
Total (8 years) $99,650
Approximate Annualized Cost $12,456
Available Data: The Town of North Providence does not currently maintain its own GIS. The
Town does have its outfalls mapped in GIS and this was completed by its on-call engineer in
2012. The Town has digitally mapped its parcels; however, remapping is underway to enhance
the current accuracy of this data. As a result, the updated Statewide Impervious Cover layer
was used for North Providence and no parcel layer was provided during this study. The Tax
Assessor’s database was not provided during this study to provide data for land use by parcel.
This data will be necessary for a more detailed revenue and rate analysis under a stormwater
utility.
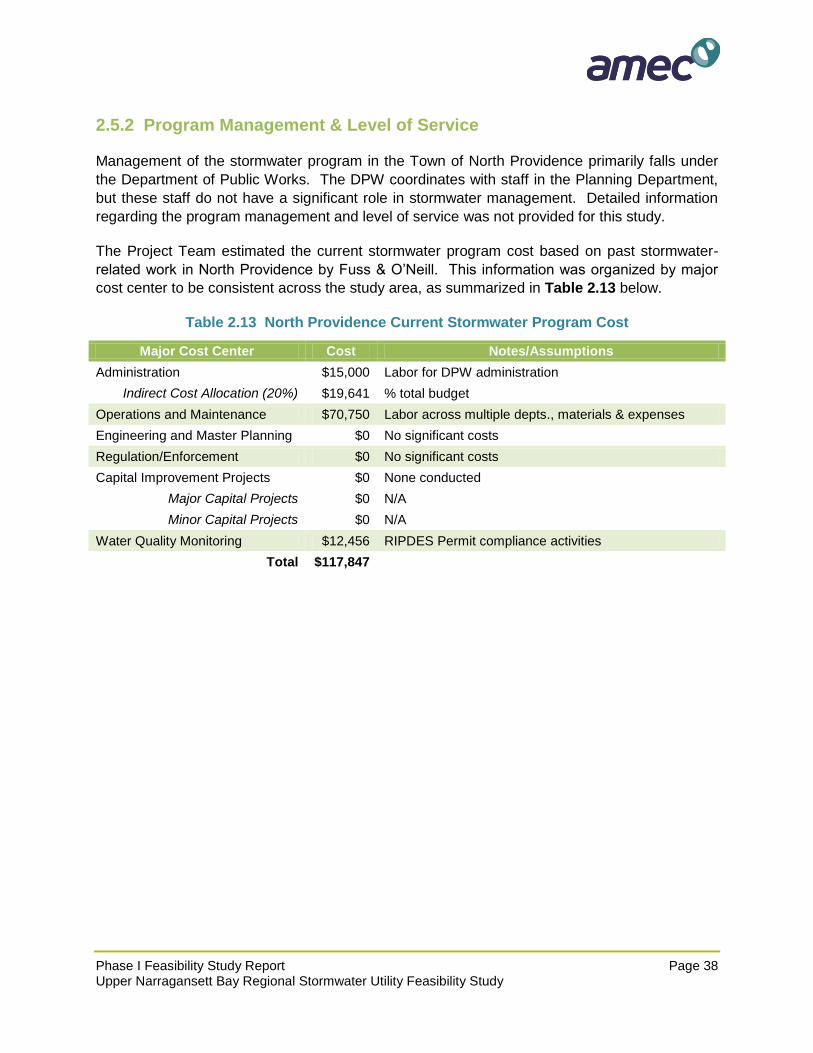
Phase I Feasibility Study Report Page 38 Upper Narragansett Bay Regional Stormwater Utility Feasibility Study
2.5.2 Program Management & Level of Service
Management of the stormwater program in the Town of North Providence primarily falls under
the Department of Public Works. The DPW coordinates with staff in the Planning Department,
but these staff do not have a significant role in stormwater management. Detailed information
regarding the program management and level of service was not provided for this study.
The Project Team estimated the current stormwater program cost based on past stormwater-
related work in North Providence by Fuss & O’Neill. This information was organized by major
cost center to be consistent across the study area, as summarized in Table 2.13 below.
Table 2.13 North Providence Current Stormwater Program Cost
Major Cost Center Cost Notes/Assumptions
Administration $15,000 Labor for DPW administration
Indirect Cost Allocation (20%) $19,641 % total budget
Operations and Maintenance $70,750 Labor across multiple depts., materials & expenses
Engineering and Master Planning $0 No significant costs
Regulation/Enforcement $0 No significant costs
Capital Improvement Projects $0 None conducted
Major Capital Projects $0 N/A
Minor Capital Projects $0 N/A
Water Quality Monitoring $12,456 RIPDES Permit compliance activities
Total $117,847

Phase I Feasibility Study Report Page 39 Upper Narragansett Bay Regional Stormwater Utility Feasibility Study
2.6 Pawtucket
The City of Pawtucket is approximately 8.7 square miles and is heavily residential with some
commercial and industrial land. Table 2.14 below summarizes the land use in the City from
2011 data available through the State of Rhode Island GIS database.
Table 2.14 Land Use in Pawtucket
Land Use Type Percent Coverage in
Pawtucket
High Density Residential 31.4%
Roads 26.8%
Deciduous Forest 16.7%
Commercial 6.2%
Industrial 4.0%
Water 3.3%
Cemeteries 2.6%
Medium High Density Residential 2.2%
Institutional 1.6%
Developed Recreation 1.4%
Railroads 1.2%
Other 2.6%
Pawtucket Impervious Cover Map (61.4% Impervious)

Phase I Feasibility Study Report Page 40 Upper Narragansett Bay Regional Stormwater Utility Feasibility Study
Leadership/ Governance: The City is has a Mayor and City Council form of government.
Pawtucket’s current Mayor is Donald R. Grebien, who is responsible for chief executive and
administrative duties, as well as overseeing all other City departments. The City Council is
comprised of nine members: three councilors-at-large and six district councilors from each of six
districts. The current City Council is in term from 2013 - 2015.
Population: As reported by the Rhode Island Department of Labor and Training 2000 census,
the City had a population of 72,958 and the 2010 census reported a population of 71,148
indicating a -2.5% percent change in population over the ten year span.
Economic Condition: Although the City has struggled economically in recent years,
discussions with City staff and review of the 2011 Community Comprehensive Plan indicate
conditions are improving.
Key Industry: The largest employers in Pawtucket include Hasbro, Pawtucket Red Sox, and
Apex, tenants of the shopping plaza on Newport Avenue and the tenants of the Narragansett
Industrial Park.
2.6.1 Stormwater System & Local Issues
The City of Pawtucket currently maintains approximately 182 miles of road, 200 miles of
combined sewer and separate storm drain pipes, 6,000 catch basins and manholes (city-wide),
and 49 MS4 outfalls. Stormwater outfalls are shown on Figure 2.3. The City inspects and
maintains one stormwater BMP (detention basin). City staff estimate that approximately 90% of
Pawtucket drains to a combined sewer system and the remaining 10% drains to the separate
MS4.

Phase I Feasibility Study Report Page 41 Upper Narragansett Bay Regional Stormwater Utility Feasibility Study
Figure 2.3 Stormwater Outfalls in Pawtucket
The City of Pawtucket is nearly 100% sewered and the sanitary sewer and combined sewer
systems discharge to NBC interceptor sewers that convey flow to the Bucklin Point wastewater
treatment plant in East Providence. A total of 19 CSO structures are located within Pawtucket
along the Blackstone and Seekonk Rivers to provide relief of excess flows in the combined
system.
Funding Sources: The City funds the stormwater program through the General Fund.
Compelling Issues and Concerns About a Regional Stormwater Utility: During the one-on-
one interview to gather information for this study, City staff identified the following stormwater-
related issues in order of importance:
1. Aging infrastructure
2. Preservation of property value
3. Compliance requirements
Obstacles identified against implementation of a stormwater utility district in Pawtucket include
the following in order of severity:
1. Losing local control of zoning, land use, etc. - “big brother decides for me”
2. Responsiveness - “who controls priorities”

Phase I Feasibility Study Report Page 42 Upper Narragansett Bay Regional Stormwater Utility Feasibility Study
DPW Director
Engineering Department
Traffic Engineering
Highway Manager
Operations Manager
Equipment Operators
Laborers Truck Drivers
Maintenance Manager
Public Services Manager
Parks Maintenance
Supervisor
Planning Department
3. Consistency in treatment, fairness - “getting my share”
4. Being dominated by one entity
5. One area “bailing out” another one - “paying for another’s past sins”
Public Awareness: The City relies upon the Stormwater Education and Outreach Program in
cooperation with the University of Rhode Island (URI) to assist in meeting the RIPDES MS4
Permit requirements. City staff have indicated that the community level of awareness regarding
stormwater-related issues is low and the key sensitive issue is not wanting a new fee or tax.
City staff also felt that the community perception is such that a new fee would scare businesses
and that most people think they are already taxed for such programs.
Available Data: The City of Pawtucket has zoning boundaries as well as parcel boundary data
available in GIS. City outfalls have also been mapped in GIS, but Pawtucket does not have an
impervious cover layer. As a result, the updated Statewide Impervious Cover layer was used
for Pawtucket. A GIS parcel layer was acquired from RIDEM, but this layer consisted strictly of
physical data and did not contain attributes such as land use by parcel. An extract from the Tax
Assessor’s database was provided for Phase I of the study, but the extract only contains basic
residential vs. non-residential data. The database does not differentiate between single family
residential and other residential, which will be necessary for a more detailed revenue and rate
analysis under a stormwater utility.
2.6.2 Program Management & Level of Service
Management of the stormwater program in the City of Pawtucket primarily falls under the
Department of Public Works and Engineering Department. The DPW and Engineering
Department coordinate with staff in the Planning Department, but these staff do not have a
significant role in stormwater management. An organizational chart for management of the
stormwater program is provided below.
The MS4 system is estimated to be encompass approximately 10% of the City, but the extent
and drainage areas for the MS4 and CSS have not been accurately mapped. Approximately
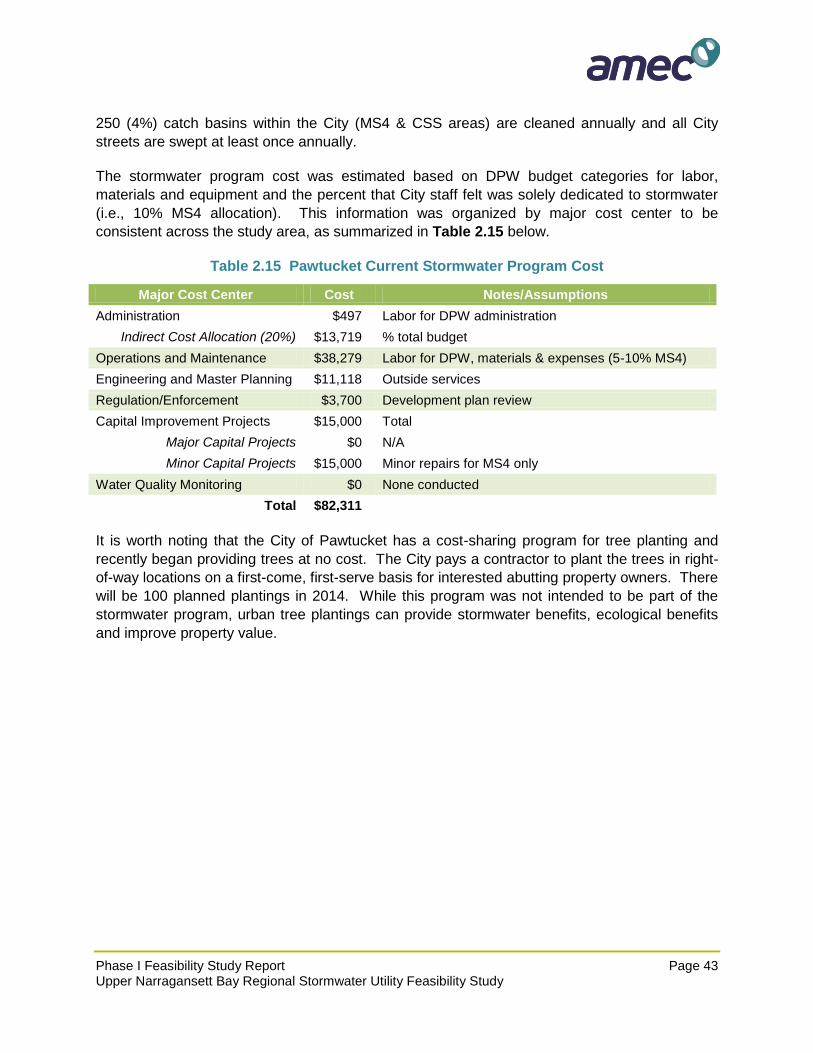
Phase I Feasibility Study Report Page 43 Upper Narragansett Bay Regional Stormwater Utility Feasibility Study
250 (4%) catch basins within the City (MS4 & CSS areas) are cleaned annually and all City
streets are swept at least once annually.
The stormwater program cost was estimated based on DPW budget categories for labor,
materials and equipment and the percent that City staff felt was solely dedicated to stormwater
(i.e., 10% MS4 allocation). This information was organized by major cost center to be
consistent across the study area, as summarized in Table 2.15 below.
Table 2.15 Pawtucket Current Stormwater Program Cost
Major Cost Center Cost Notes/Assumptions
Administration $497 Labor for DPW administration
Indirect Cost Allocation (20%) $13,719 % total budget
Operations and Maintenance $38,279 Labor for DPW, materials & expenses (5-10% MS4)
Engineering and Master Planning $11,118 Outside services
Regulation/Enforcement $3,700 Development plan review
Capital Improvement Projects $15,000 Total
Major Capital Projects $0 N/A
Minor Capital Projects $15,000 Minor repairs for MS4 only
Water Quality Monitoring $0 None conducted
Total $82,311
It is worth noting that the City of Pawtucket has a cost-sharing program for tree planting and
recently began providing trees at no cost. The City pays a contractor to plant the trees in right-
of-way locations on a first-come, first-serve basis for interested abutting property owners. There
will be 100 planned plantings in 2014. While this program was not intended to be part of the
stormwater program, urban tree plantings can provide stormwater benefits, ecological benefits
and improve property value.

Phase I Feasibility Study Report Page 44 Upper Narragansett Bay Regional Stormwater Utility Feasibility Study
2.7 Providence
The City of Providence is approximately 18.8 square miles and is mostly comprised of high
density residential, roads and commercial/industiral areas. Table 2.16 below summarizes the
land use in the City from 2011 data available through the State of Rhode Island GIS database.
Table 2.16 Land Use in Providence
Land Use Type Percent Coverage in
Providence
High Density Residential 37.9%
Roads 18.8%
Medium High Density Residential 9.7%
Commercial 6.5%
Institutional 6.1%
Deciduous Forest 4.2%
Industrial 4.2%
Developed Recreation 3.7%
Other Transportation 1.9%
Cemeteries 1.6%
Providence Impervious Cover Map
(63.8% Impervious)

Phase I Feasibility Study Report Page 45 Upper Narragansett Bay Regional Stormwater Utility Feasibility Study
Land Use Type Percent Coverage in
Providence
Commercial/Industrial Mixed 1.5%
Water 1.3%
Railroads 0.9%
Vacant Land 0.6%
Transitional Areas (urban open) 0.4%
Water and Sewage Treatment 0.2%
Mixed Forest 0.1%
Brushland 0.1%
Waste Disposal 0.1%
Medium Density Residential 0.1%
Commercial/Residential Mixed 0.1%
Wetland 0.1%
Leadership/ Governance: Providence has a Mayor and City Council form of government. The
current mayor is Angel Taveras and the City Council consists of fifteen (15) City Councilors, one
for each of the City’s wards.
Population: According to the Rhode Island Department of Labor and Training the 2000 census
reported a population of 173,618 and the 2010 census reported a population of 178,042 in the
City of Providence. This represents a 2.5% increase in population over the ten year span.
Economic Condition: The following information was obtained from the City of Providence
Comprehensive Annual Financial Report (FY ending June 30, 2013): “Upon taking office in
January 2011, Mayor Angel Taveras signed an Executive Order creating an independent
Municipal Finances Review Panel to conduct a full review of the City's finances. On March 3,
2011, the Panel delivered a report that identified a $110 million structural deficit in FY2012.
Through collaborative efforts and shared sacrifice, the Taveras administration, with the
partnership of the Providence City Council and stakeholders across the City, has all but
eliminated the City's $110 million structural deficit and ended FY2013 with a $1.57 million
surplus in the general fund.”
Key Industry: Key industries in Providence include education, healthcare, finance and trade.
Large businesses in the City include Rhode Island Hospital, Brown University, Bank of America,
Women and Infants Hospital, Miriam Hospital, Roger Williams Medical Center, Citizens Bank,
Verizon, Johnson & Wales University and Pinkerton Government Services. The Port of
Providence is the second largest deepwater seaport in New England and handles cargo such as
cement, chemicals, heavy machinery, petroleum and scrap metal.

Phase I Feasibility Study Report Page 46 Upper Narragansett Bay Regional Stormwater Utility Feasibility Study
2.7.1 Stormwater System & Local Issues
City staff estimate that approximately 60-70% of the land area in the City of Providence drains
to the combined sewer system. Maps of the CSS and MS4 systems do not fully delineate the
drainage areas and inter-connections for each of these systems. City staff estimate that the
MS4 system is approximately 75% mapped and the City has started an asset evaluation
program that will include additional detailed mapping.
The City is responsible for maintaining approximately 12,000 catch basins and 4,000 gutter
inlets along 370 miles of City roads. The exact number of catch basins and inlets draining to
each of the CSS and MS4 systems is unknown at this time. The City mapped all of its MS4
outfalls 2008 and identified 175 discharges.
Funding Sources: The stormwater program is funded through the General Fund. In November
2012 the City approved a $40M Road Bond to improve over 65 miles of streets from 2013-2015.
While the Road Paving Plan focuses primarily on reconditioning the roads, the construction
activities will result in minor repairs and inspection/cleaning of the storm drain infrastructure.
Compelling Issues and Concerns About a Regional Stormwater Utility: During the one-on-
one interview to gather information for this study, City staff identified the following stormwater-
related issues in the City, in no particular order:
Aging infrastructure
Flooding problems (local streets)
MS4 Permit compliance
Water quality concerns
City staff indicated that there is a significant gap in funding for routine maintenance of the CSS
and MS4 systems, as well as capital improvements to address water quality. City staff were
interested in regionalizing the operation and maintenance of the CSS and MS4 systems to be
performed by a separate entity.
City staff did not express any significant concerns regarding the implementation of a regional
stormwater utility and noted that a regional approach seemed to be the most appropriate.
Public Awareness: Outreach and education efforts in the City primarily include working with
Save The Bay for a marine science based education program with the Providence Public
Schools. City staff reported the overall stormwater awareness in the general population to be
fairly low; however, a fraction of the population is acutely aware of stormwater related issues.
This group is mostly comprised of individuals in local environmental organizations. City staff
noted that the general public would likely be sensitive to the following issues:
Building a bureaucracy – fear of creating an effective entity to manage stormwater.
Rate affordability – ability to bear the cost of aging infrastructure and stormwater issues.
No new fees or taxes – rate payers may not support the need for a better program and only see a new fee or tax burden.

Phase I Feasibility Study Report Page 47 Upper Narragansett Bay Regional Stormwater Utility Feasibility Study
Available Data: The City of Providence has a comprehensive GIS database that includes
parcel boundaries, the storm drain network and sanitary sewer network, impervious cover, etc.
GIS data, including a parcel layer containing land use attributes and an impervious cover layer
was acquired from the City. The Tax Assessor’s database was not used during this study to
provide data for land use by parcel. This data will be necessary for a more detailed revenue
and rate analysis under a stormwater utility.
2.7.2 Program Management & Level of Service
Management of the stormwater program in the City of Providence primarily falls under the
Department of Public Works, which includes the Highway Division, Enginering Division and
Traffic Engineering. Other City departments play a role in stormwater management, including:
Department of Planning for floodplain management, master planning and GIS related analysis;
Providence Emergency Management Agency for flooding and emergency reponse; Department
of Inspections and Standards for enforcement; and Information Technology Department for GIS
support. It is worth noting that the Providence Water Supply Board provides an advisory role
and coordinates with other departments in the City to assist with various planning efforts and
collaborative efforts to promote water conservation. An organizational chart for management of
the stormwater program in Providence is provided below.
The MS4 and CSS systems in Providence are extensive and require a significant effort for
operation and maintenance, but the City lacks the resources to adequately inspect and maintain
MS4 and CSS structures. Approximately 760 (5%) catch basins within the City (MS4 & CSS
areas) are cleaned annually to address key areas of concern based on public complaints and to
prevent local street flooding. The DPW sweeps all streets in the City 3-4 times a year, and
some of the downtown areas are swept more often.
The stormwater program cost was estimated based on DPW budget categories for labor,
materials and equipment and the percent that City staff stated was dedicated to stormwater (i.e.,
Information Technology
Planning Department
Providence Emergency
Management Agency
DPW Director
Highway Division
Sweeper & Equipment Operators
Laborers Truck Drivers
Engineering Division
Survey Crew
Traffic Engineering
Department of Inspection &
Standards

Phase I Feasibility Study Report Page 48 Upper Narragansett Bay Regional Stormwater Utility Feasibility Study
30-40% MS4 system). This estimate considered the effort and cost associated with
management of the CSS and MS4 systems. This information was organized by major cost
center to be consistent across the study area, as summarized in Table 2.17 below.
Table 2.17 Providence Current Stormwater Program Cost
Major Cost Center Cost Notes/Assumptions
Administration $70,129 Labor for DPW administration
Indirect Cost Allocation (20%) $224,390 % total budget
Operations and Maintenance $899,112 Labor across multiple depts., materials & expenses
Engineering and Master Planning $107,262 Labor across multiple departments
Regulation/Enforcement $45,450 Labor across multiple departments
Capital Improvement Projects $0 None conducted, periodic grants only
Major Capital Projects $0 N/A
Minor Capital Projects $0 N/A
Water Quality Monitoring $0 None conducted
Total $1,346,343
2.8 Warwick
Warwick Impervious Cover Map (34.5% Impervious)

Phase I Feasibility Study Report Page 49 Upper Narragansett Bay Regional Stormwater Utility Feasibility Study
The City of Warwick is approximately 35.9 square miles in area. The City is mostly comprised of
forest, roadways, and residential areas. Table 2.18 below summarizes the land use in the City
from 2011 data available through the State of Rhode Island GIS database.
Table 2.18 Land Use in Warwick
Land Use Type Percent Coverage
in Warwick
Med ium High Density Residentia l 24.9%
Dec iduous Forest 17.7%
Water 13.3%
Road s 11.5%
Commerc ia l 6.7%
Med ium Density Residentia l 3.9%
High Density Residentia l 3.5%
Developed Rec rea tiona l 3.2%
Airports 2.7%
Mixed Forest 2.2%
Industria l 2.0%
Institutiona l 1.4%
Other 7.0%
Leadership/ Governance: Warwick has a Mayor and City Council form of government. The
current mayor is Scott Avedisianand the City Council is comprised of nine members
representing nine wards.
Population: As reported by the Rhode Island Department of Labor and Training the 2000
census reported a population of 85,880 and the 2010 census reported a population of 82,672 in
the City of Warwick. This represents a 3.7% decrease in population over the ten year span.
Economic Condition: The 2014 City budget indicates that the City is in relatively good financial
condition, noting “Warwick has weathered the economic crises far better than many other cities
and towns.” The City has reported a surplus in 12 of the last 13 years.
Key Industry: Key industries in Warwick include air transportation and hotels/lodging (TF
Green Airport is located in Warwick) and retail shopping. Warwick is home to two regional
shopping malls: the Warwick Mall and the Rhode Island Mall, as well as a large area of
commercial development along Bald Hill Road.
2.8.1 Stormwater System & Local Issues
Warwick has a fully separate storm sewer system and nearly 100% of the system is mapped on
paper. Approximatley 30% of the system is mapped in GIS. Staff report that the system was

Phase I Feasibility Study Report Page 50 Upper Narragansett Bay Regional Stormwater Utility Feasibility Study
Warwick Wastewater Treatment Plant under water. Photo courtesy: City of Warwick DPW.
built as a separate system and was never combined. The City estimates it includes
approximately 450 miles of road, 3,000 catch basins, 1,000 manholes and 800 outfalls.
Funding Sources: Funding for stormwater management is through the general fund.
Compelling Issues and Concerns About a Regional Stormwater Utility: During the one-on-
one interview to gather information for this study, City staff identified the following stormwater-
related issues in the City, in order of priority:
Flooding problems & preservation of property value
Ecological concerns: minimize beach and shellfish closures (e.g., Greenwich Bay)
Aging infrastructure & maintenance of infrastructure
Regulatory compliance
City staff indicated that the floods of 2010
had a major impact on the City similar to that
in the City of Cranston. As discussed
previously, in March 2010, after 5 inches of
rain, the Pawtuxet River overflowed and
impacted many sites such as the Warwick
Mall. Additionally, the City’s wastewater
treatment plant was completely inundated
during the flood.
The following concerns for implementing a
regional stormwater utility in Warwick were
identified, in the following order of concern:
Building a bureaucracy – “one new fee” and “fee creep”
Responsiveness to and prioritization of local issues
Consistency in treatment, fairness – “getting my share”
One area “bailing out” another one – “taking on other people’s bigger problems”
Being dominated by one entity
Public Awareness: Stormwater and water quality outreach and education efforts in the City of
Warwick include:
DPW created an informational brochure to inform the public about the benefits of improving water quality, the steps currently being taken, and what the public can do to assist. Brochures will be distributed at City Hall, libraries, recreation facilities, and other public areas.
Buckeye Brook Coalition – the City is working with the Buckeye Brook Coalition on a plan for implementing the recommendations of the RIDEM 2007 TMDL study. DPW is also working to establish a team of volunteers to assist with storm drain inspections, monitoring and to educate residents in the Buckeye Brook Watershed.
DPW assists various Neighborhood Associations with collection of wastes after volunteer clean-ups.

Phase I Feasibility Study Report Page 51 Upper Narragansett Bay Regional Stormwater Utility Feasibility Study
Planning Department
DPW Director
Engineering
Survey Crew
Highway Foreman
Sweeper Operators
Equipment Operators
Laborers
DPW maintains pet waste stations at several locations throughout the City.
The City of Warwick Recycling Calendar is sent to every home owner in the City to inform residents of how to properly dispose of household and yard wastes.
City staff reported the overall stormwater awareness in the general population to be fairly low,
but there is a moderate level of awareness for specific issues, such as flooding, beach closures
and shellfish closures (e.g., Greenwich Bay). The following sensitive issues were noted: rate
affordability; no new taxes or fees; and flooding issues.
Available Data: The City of Warwick has paper maps of nearly their entire storm sewer system
including outfalls, catch basins, etc. GIS data for the stormwater system is limited (30%) and
the City does not have an impervious cover layer. As a result, the updated Statewide
Impervious Cover layer was used for Warwick. A GIS parcel layer was acquired from RIDEM
containing land use attributes for each parcel. The Tax Assessor’s database was not provided
during this study to provide data for land use by parcel. This data will be necessary for a more
detailed revenue and rate analysis under a stormwater utility.
2.8.2 Program Management & Level of Service
Management of the stormwater program in the City of Warwick primarily falls under the
Department of Public Works and Engineering Department. The DPW and Engineering
Department coordinate with staff in the Planning Department, but these staff do not have a
significant role in stormwater management. An organizational chart for management of the
stormwater program is provided below.
The MS4 system in Warwick requires a significant effort for operation and maintenance.
Approximately 900 (30%) catch basins within the City are cleaned annually and all streets are
swept at least once annually. A catch basin cleaning and insection form is completed and the
City is planning to sweep more sensitive areas twice a year.

Phase I Feasibility Study Report Page 52 Upper Narragansett Bay Regional Stormwater Utility Feasibility Study
The stormwater program cost was estimated based on DPW budget categories for labor,
materials and equipment and the percent that City staff felt was solely dedicated to stormwater.
This information was organized by major cost center to be consistent across the study area, as
summarized in Table 2.19 below.
Table 2.19 Warwick Current Stormwater Program Cost
Major Cost Center Cost Notes/Assumptions
Administration $6,429 DPW Labor
Indirect Cost Allocation (20%) $99,455 % total budget
Operations and Maintenance $188,681 Labor & expenses across multiple departments
Engineering and Master Planning $155,687 Labor & expenses across multiple departments
Regulation/Enforcement $9,663 Labor for Building Inspection Department
Capital Improvement Projects $135,614 None conducted
Major Capital Projects $37,434 Debt service on drainage bonds
Minor Capital Projects $98,181 Minor drainage repairs & rehabilitation
Water Quality Monitoring $1,200 Beach testing
Total $596,729

Phase I Feasibility Study Report Page 53 Upper Narragansett Bay Regional Stormwater Utility Feasibility Study
3.0 Compelling Case for Enhanced Stormwater Programs
This section discusses the importance of making a compelling case when considering a
stormwater utility and the information that was considered by both the Steering Committee and
the Stakeholder Group. Commonly utilized “drivers” are called out and examples that were
voted most relevant to the study area by participants are highlighted. Section 2.0 identified
compelling issues in each community with specific examples and this section represents the
thought process for creating a compelling case and summarizes the collective feedback from
the Steering Committee and Stakeholder Group.
3.1 Drivers for Change
Understanding the stormwater issues and concerns that face the Upper Narragansett Bay
region is the starting point for building a “compelling case for action”. In every community there
are good, even compelling, reasons to improve the way stormwater programs are executed.
When we look at stormwater programs around the country and identify the impetus for improved
stormwater programs, we have found that the reasons for change are generally motivated by
some combination of key common “drivers” or forces. Each of these drivers can be understood
and expressed in various ways depending on the local situation, but the generic categories are
provided below with examples.
Water quality and ecology: beach and shellfish bed closures; nutrient-impaired embayments
and recreational waters; fish kills; reduced ecological health; reduced number of game fish,
destroyed habitat; toxic pollution; eutrophication of lakes and ponds; bacterial pollution; illicit
connections and illegal dumping; combined sewer or sanitary sewer overflows, or other point
discharge issues; urban hot spot pollution.
Quality of life and aesthetics: degrading water quality
near beaches and subsequent loss of tourism; detention
basin safety hazards or appearance; weeds, erosion or
other stream impacts; loss of natural appearance; desire
for greenways or trails; toxic or dangerous organisms that
can effect human health and safety, and curtail
recreational use.
Preservation of property value: reduction in waterfront
property values; floodplain property values declining;
opportunities for waterfront enhancement; loss of reputation for safety or for natural features;
development pressures eroding natural features; protection of unique water-related features.
Drinking water supply protection and enhancement: pollution of groundwater and drinking
water supplies; well head pollution issues; filling of reservoirs; eutrophication and water taste
issues; declining low flows for water treatment; effluent pollution.

Phase I Feasibility Study Report Page 54 Upper Narragansett Bay Regional Stormwater Utility Feasibility Study
Flooding problems: flooding along both major and minor streams; system backups and other
capacity issues; tidal influenced flooding; culvert and other conveyance infrastructure under
sizing or failure.
Aging infrastructure: limited life and need to replace leaching facilities; clogged systems;
erosion of property; damaged systems; rusted culvert inverts; cracked and failing concrete;
undersized systems due to new development; failing dams and detention ponds.
Development pressures: development related increased flows and flooding; filled detention
ponds; increasing pollution and erosion.
Erosion of channels and creeks: major stream erosion; bridge undermining; infrastructure
failure due to erosion; minor ditch erosion; head cutting; sediment buildup; filling lakes and
ponds.
Regulatory mandates: RIPDES permit (including anticipated requirements of renewed MS4
general permit); FEMA regulations; TMDLs; endangered species act; drinking water protection;
well head protection; wetlands permitting; other state, regional, or local regulations.
Lawsuits: flooding caused by roads; environmental compliance law suites; nuisance flooding;
erosion or other issues; health and safety suits.
UNB Regional Drivers
During the first meetings, the Steering Committee and Stakeholder Group identified the key
issues and concerns that participants felt were compelling reasons (needs) they could address
through an enhanced stormwater program if they had an adequate source of revenue.
Responses are listed in Table 3.1 and the Meeting #1 summaries in Appendix III provide a more
detailed breakdown of the issues and voting.
Table 3.1 Compelling Case Voting Summary
Stakeholder Group Steering Committee
Rank Category Votes Rank Category Votes
1 Policy 29 1 Water Quality 26
2 Education 25 2 Flooding 26
3 Flooding 20 3 Infrastructure 24
4 Cost Related 18 4 Policy & Administration 11
5 Social & Land Use 15
6 System 13
7 Water Quality 11
The contrast in voting between the Stakeholder Group and Steering Committee is noteworthy in
the case of “policy” issues where it received 29 votes by Stakeholder Group members and 11

Phase I Feasibility Study Report Page 55 Upper Narragansett Bay Regional Stormwater Utility Feasibility Study
While the Stakeholder Group is clearly more focused on policy and education issues, the
Steering Committee is more concerned about water
quality and flooding issues.
votes by Steering Committee members. Examples of
“policy” issues identified by the Stakeholder Group
include: zoning and other hurdles, incentives and
uncontrolled infill. While the Stakeholder Group is
clearly more focused on policy and education issues,
the Steering Committee is more concerned about water
quality and flooding issues based on this group’s
understanding of infrastructure needs and concerns
about the level of effort to mitigate stormwater impacts
and address water quality issues.
“Compliance with RIPDES Permits” did not rate high as compared to the other stormwater
management categories. This is a very important distinction to make when framing the
compelling case and supporting rationale for an enhanced stormwater management program
and implies that there are real stormwater needs that communities need to address, not
just because the “RIPDES MS4 Permit requires it”. In the same breath, each community
needs to remember that TMDLs have been developed for numerous water bodies in the UNB
study area. These TMDL studies outline specific activities that are required to be completed. A
summary of these activities by community is provided in Appendix I.
Where stormwater is found to be contributing to water quality impairments, RIPDES MS4
General Permit requires the regulated municipalities to implement the recommendations of the
TMDL study. TMDL requirements become effective once the MS4 operator is notified by RIDEM
that the TMDL has been approved and contains provisions that must be addressed in a revised
Stormwater Pollution Prevention Plan (refered to as a TMDL Implementation Plan). These
requirements generally include:
Targeted public education and outreach activities;
Detailed mapping, investigation and condition assessment for MS4 infrastructure;
Litter and pet waste management programs;
Increased pollution prevention activities (e.g., operation and maintenance of the MS4);
Illicit discharge detection and elimination activities to remove pollutant sources; and
Capital construction projects for installing structural BMPs to treat stormwater.
It makes sense to address needed infrastructure issues that are also impacting water quality
and an enhanced (and adequate) stormwater program is the intended outcome of the RIPDES
MS4 Permit. The estimated level of effort to meet the RIPDES MS4 Permit for the next permit
cycle (anticipated 2015-2019) was considered in the development of the future stormwater
program costs for each community in Section 4.2.
3.2 Building a Compelling Case
Assembling a “compelling case” is an initial step in framing the key reasons for change to
improve the stormwater program. Now that the UNB municipalities have initially identified the
drivers for change, the next step is to use this information to develop a compelling case. This

Phase I Feasibility Study Report Page 56 Upper Narragansett Bay Regional Stormwater Utility Feasibility Study
compelling case serves as the municipality’s publicly-stated rationale for why an enhanced
stormwater management program is needed and a regional approach may be the most
appropriate and effective strategy.
In creating a compelling case to address a wide variety of stakeholders it will be helpful to
remember that, in general, people are motivated along two complimentary courses of
persuasion: information (data) and stories. Some people, classified as Left Brain thinkers, want
facts and statistics (data), while others, known as Right Brain thinkers, are moved to action by
horror stories and pictures. When begining to quantify the community’s perception of program
need or make the case for change and new funding, it is important to address both types of
people. Table 3.2 gives some examples taken from successful stormwater utilities and some
visual illustrations specific to UNB municipalities are provided below.
Table 3.2 Compelling Case Examples
“Left Brain” “Right Brain”
Statistics on repair costs
Cost information
Infrastructure information
Lost revenue or tourist dollars
Regulatory facts
Backlog information on flooding
Unfunded mandate information
Flooding pictures
Horror stories
Movies
Testimonials
Environmental or aesthetic appeals
Drawings of a future greenway, trail, etc.

Phase I Feasibility Study Report Page 57 Upper Narragansett Bay Regional Stormwater Utility Feasibility Study
Building a compelling case and knowing when, how, and to whom it should be presented is
more of a political and technical art form than it is a science. Taking time to build an informed
consensus to move forward and to support program change and new funding methods is vitally
necessary. It is important to note that in some cases what could end up being the most
compelling case may not yet be on the rate payer’s radar screen. It will therefore be incumbent
upon the municipalities and advocates to first educate stakeholders about the importance of an
issue. During the last meeting for this study, several of the members of the Stakeholder Group
volunteered to participate in outreach to their colleagues and other community leaders in order
to help explain the case for a regional approach to stormwater management.
Water quality, flooding, policy and education issues received the greatest number of
votes as the most compelling reasons to improve stormwater management. In general,
the study participants provided “left brain” and “right brain” examples of stormwater issues that
support the need for changing the current status quo. The study participants also discussed a
“no action” alternative/option, understanding there are consequences for such an approach.
The most compelling reasons to improve stormwater management in each of the study area
communities are summarized in Table 3.3.
Sediment deposits at Waterplace Park in Providence
Example of maintenance needs
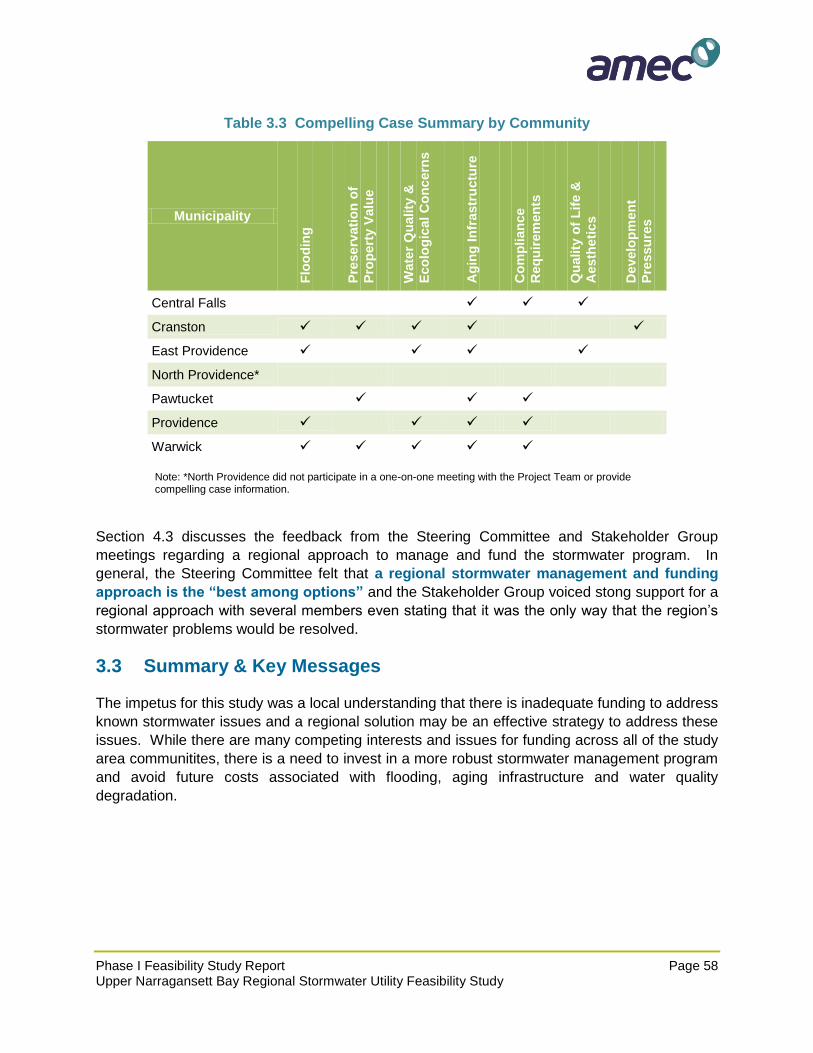
Phase I Feasibility Study Report Page 58 Upper Narragansett Bay Regional Stormwater Utility Feasibility Study
Table 3.3 Compelling Case Summary by Community
Municipality
Flo
od
ing
Pre
se
rvati
on
of
Pro
pe
rty V
alu
e
Wate
r Q
uality
&
Eco
log
ical C
on
cern
s
Ag
ing
In
frastr
uctu
re
Co
mp
lian
ce
Req
uir
em
en
ts
Qu
ality
of
Lif
e &
Aesth
eti
cs
Develo
pm
en
t
Pre
ssu
res
Central Falls
Cranston
East Providence
North Providence*
Pawtucket
Providence
Warwick Note: *North Providence did not participate in a one-on-one meeting with the Project Team or provide compelling case information.
Section 4.3 discusses the feedback from the Steering Committee and Stakeholder Group
meetings regarding a regional approach to manage and fund the stormwater program. In
general, the Steering Committee felt that a regional stormwater management and funding
approach is the “best among options” and the Stakeholder Group voiced stong support for a
regional approach with several members even stating that it was the only way that the region’s
stormwater problems would be resolved.
3.3 Summary & Key Messages
The impetus for this study was a local understanding that there is inadequate funding to address
known stormwater issues and a regional solution may be an effective strategy to address these
issues. While there are many competing interests and issues for funding across all of the study
area communitites, there is a need to invest in a more robust stormwater management program
and avoid future costs associated with flooding, aging infrastructure and water quality
degradation.
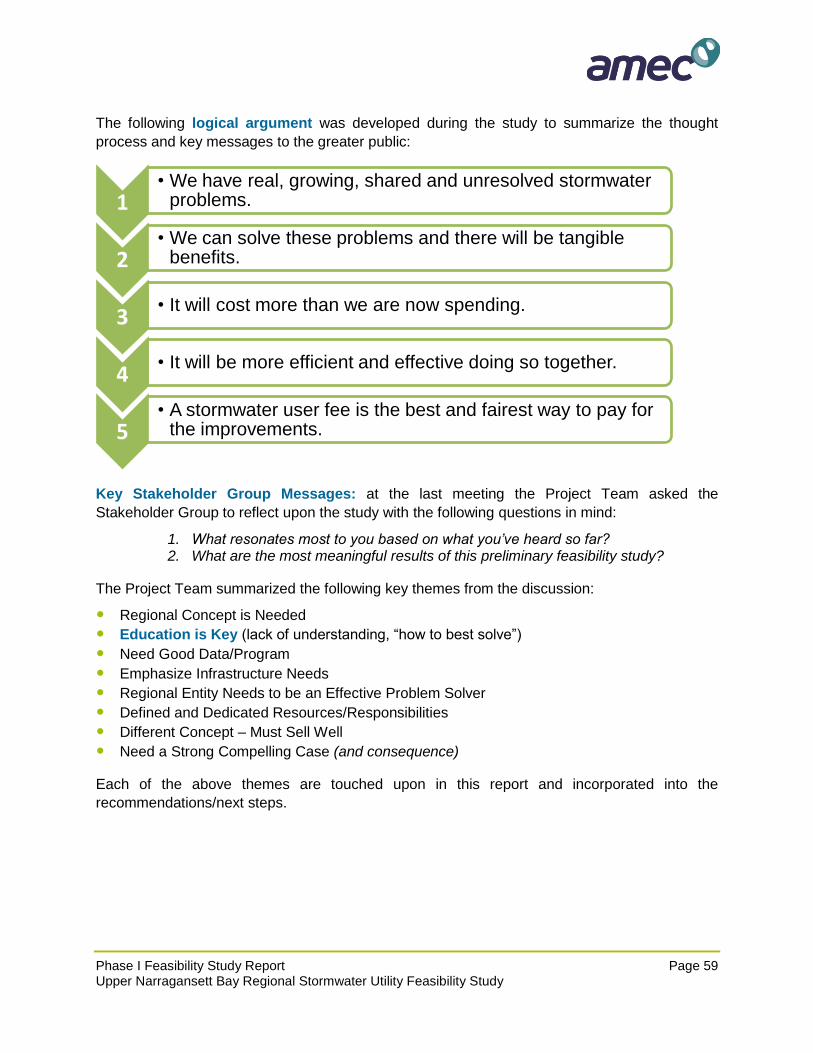
Phase I Feasibility Study Report Page 59 Upper Narragansett Bay Regional Stormwater Utility Feasibility Study
The following logical argument was developed during the study to summarize the thought
process and key messages to the greater public:
Key Stakeholder Group Messages: at the last meeting the Project Team asked the
Stakeholder Group to reflect upon the study with the following questions in mind:
1. What resonates most to you based on what you’ve heard so far? 2. What are the most meaningful results of this preliminary feasibility study?
The Project Team summarized the following key themes from the discussion:
Regional Concept is Needed
Education is Key (lack of understanding, “how to best solve”)
Need Good Data/Program
Emphasize Infrastructure Needs
Regional Entity Needs to be an Effective Problem Solver
Defined and Dedicated Resources/Responsibilities
Different Concept – Must Sell Well
Need a Strong Compelling Case (and consequence)
Each of the above themes are touched upon in this report and incorporated into the
recommendations/next steps.
1 • We have real, growing, shared and unresolved stormwater
problems.
2 • We can solve these problems and there will be tangible
benefits.
3 • It will cost more than we are now spending.
4 • It will be more efficient and effective doing so together.
5 • A stormwater user fee is the best and fairest way to pay for
the improvements.

Phase I Feasibility Study Report Page 60 Upper Narragansett Bay Regional Stormwater Utility Feasibility Study
4.0 Proposed Future Stormwater Program
This section provides a discussion of the level of service and cost estimate for the future
stormwater programs in the study area. Potential regional stormwater management approaches
are presented with a more detailed discussion of a preferred regional approach by the Steering
Committee. A preliminary revenue analysis is provided to consider a stormwater utility funding
mechanism, followed by a brief discussion about credits to illustrate one of many future policy
decisions that need to be made under the next phase of study.
4.1 Level of Service
It is important to understand the needs or “level of service” for the future stormwater program as
this will drive the cost and approach for funding and implementation. In the context of a regional
management and funding approach, the level of service can also drive the organizational
structure and rate approach. During the study, the Steering Committee noted that the level of
service needed to be clearly defined across the region and that each municipality should be
held to certain minimum standards.
The figure to the right illustrates the
typical investment (cost) per
developed acre of land per year for
stormwater programs with increasing
levels of service. For example,
communities that invest $50-
$100/developed acre/year typically
have a very minimal stormwater
management program. Programs
within the “moderate” range are
generally considered to provide a level
of service that adequately maintains
the current MS4 system and
incorporates a moderate effort to address priority stormwater management areas. A moderate
to advanced level of service should be the minimum starting point in the UNB study area
given the current understanding of stormwater issues and the need to develop and
construct capital projects to improve water quality.
The future level of service was estimated using available data, information provided by
participating municipalities and best professional judgement by the Project Team. One of the
most critical components necessary to gauge an appropriate level of service is a detailed
understanding of the CSS and MS4 systems, specifically: age and condition of infrastructure;
system capacity and the level of stormwater treatment provided. The Steering Committee and
Stakeholder Group both noted at multiple meetings that the MS4 systems need to be assessed
to determine the most appropriate level of service to be provided through a local or regional

Phase I Feasibility Study Report Page 61 Upper Narragansett Bay Regional Stormwater Utility Feasibility Study
stormwater management program. Since this detailed information was not available for this
study, the Project Team estimated a future level of service based on the following criteria:
At a minimum, communities need to meet the requirements of the RIPDES MS4 Permit:
– Implement the six (6) Minimum Control Measures
– Perform maintenance and repairs of the MS4 to prevent failure
– Conduct a planning analysis for impaired waters, focusing on those with TMDL studies
– Design at least 1 BMP annually for impaired waters and/or TMDLs: this will develop “shovel ready” projects to seek/obtain alternative funding and/or leverage with upcoming redevelopment projects.
– Construct at least 1 BMP in the first 5 years targeting an impaired water body: this is a reasonable goal for a municipal program given the upfront planning effort and timeline for design, permitting and construction. In subsequent years, the planning and design expenditures will shift to provide for more capital construction.
The estimated effort, as a percent (%) increase from current efforts, with an understanding of the current level of service provided and needs stated by City staff.
Future stormwater program estimates are for each community and do not assume a regional approach and associated economies of scale.
The majority of the future program is funded through annual revenues to avoid debt service.
It is important to note that insufficent data were available for each municipality to specifically
determine the costs of future level of services that will result in compliance with MS4 permit
requirements. Also, the estimate for the future level of service did not incorporate an analysis of
the following components, which will likely increase future program costs that will have to be
balanced with other competing interests in the region:
Major capital expenditures to retrofit MS4 systems and meet all TMDL recommendations;
Major MS4 system rehabilitation or “capital replacement” costs (due to lack of data); and
Major capital expenditures for flood mitigation (not yet defined).
The estimates of program expenditures in Section 4.4.2 provide a comparative analysis based
on a moderate level of service for similar communities across the country and the cost on the
basis of developed acres for the UNB study area communities.
Steering Committee Feedback: during the study, the Steering Committee noted that “the
program needs to be affordable, utilize an integrated approach, and push back schedules for
compliance. This is a new permit process so there will be changes over time.” These are
legitimate concerns considering the potential level of effort to address infrastructure needs
within a specific timeframe given the level of investment in public infrastructure, such as the
sanitary wastewater and the combined sewer system in some communities. The Project Team
emphasized that the program will take time to develop and priorities for infrastructure and
funding will need to be balanced.

Phase I Feasibility Study Report Page 62 Upper Narragansett Bay Regional Stormwater Utility Feasibility Study
4.2 Future Cost Estimate
A preliminary analysis of future program costs was presented at Steering Committee Meeting #3
and updated following further review and discussion with the participating communities. The
future estimated annual costs for the UNB study area communities are summarized in Table 4.1
and represent a significant increase above current expenditures. Table 4.1 includes an initial
estimate of the future program cost by the Project Team and an estimate based on a moderate-
advanced level of service using a cost of $175/developed acre for developed acres in each
community, assuming that each community has no CSS system.
It is important to note that the current level of service is minimal in most communities, although
some communities have significant CSS systems. The cost difference may be even greater
once more data is avilable and future needs are better understood.
Table 4.1 Estimated Future Stormwater Cost Estimate & Comparison
It appears that the future level of service and annual cost for the UNB study area is at least in
the range of $7.7-11 million, but may be even higher once additional infrastructure data is
available. Table 4.2 provides a more detailed breakdown of the estimated future stormwater
program costs by key cost center. A summary of future costs with assumptions for each
community are provided in Appendix VI.
Municipality Current Budget Future Program* Initial Estimate
Future Program Assuming $175/developed acre/year
Central Falls (100% CSS) $17,723 $29,510 $134,400
Cranston $1,354,073 $1,635,193 $2,562,560
East Providence $275,400 $692,700 $1,500,800
North Providence $117,847 $490,853 $649,600
Pawtucket (90% CSS) $82,311 $388,237 $974,400
Providence (65% CSS) $1,346,343 $3,315,647 $2,072,000
Warwick $596,729 $1,177,473 $3,180,800
Totals $3,790,426 $7,729,612 $11,074,560
Note: *as determined by municipal officials.

Phase I Feasibility Study Report Page 63 Upper Narragansett Bay Regional Stormwater Utility Feasibility Study
Table 4.2 Estimated Future Stormwater Costs by Key Cost Center*
Notes: *as determined by municipal officials. **Represents the total of major and minor capital projects.
Key Cost Center Totals Central
Falls Cranston
East Providence
North Providence
Pawtucket Providence Warwick
Administration $ 166,632 $ 3,135 $ 28,205 $ 18,000 $ 22,500 $ 993 $ 84,155 $ 9,643
Indirect cost allocation (20%) $ 1,288,269 $ 4,918 $ 272,532 $ 115,450 $ 81,809 $ 64,706 $ 552,608 $ 196,245
Operations & Maintenance $ 3,623,464 $ 21,457 $ 804,827 $ 235,500 $ 141,500 $ 66,988 $ 2,023,002 $ 330,191
Engineering & Master Planning
$ 719,408 $ - $ 39,841 $ 89,750 $ 32,500 $ 75,000 $ 212,708 $ 269,609
BMP Design $ 300,000 $ - $ 50,000 $ 50,000 $ 50,000 $ 50,000 $ 50,000 $ 50,000
Regulation/ Enforcement $ 108,091 $ - $ 14,788 $ 7,500 $ - $ 5,549 $ 68,174 $ 12,079
Capital Improvement Projects**
$ 1,259,705 $ - $ 375,000 $ 125,000 $ 125,000 $ 100,000 $ 275,000 $ 259,705
Major Capital Projects $ 837,434 $ - $ 300,000 $ 75,000 $ 75,000 $ 75,000 $ 200,000 $ 112,434
Minor Capital Projects $ 422,271 $ - $ 75,000 $ 50,000 $ 50,000 $ 25,000 $ 75,000 $ 147,271
Water Quality Monitoring $ 264,044 $ - $ 50,000 $ 51,500 $ 37,544 $ 25,000 $ 50,000 $ 50,000
Totals $ 7,729,612 $ 29,510 $ 1,635,193 $ 692,700 $ 490,853 $ 388,237 $ 3,315,647 $ 1,177,473

Phase I Feasibility Study Report Page 64 Upper Narragansett Bay Regional Stormwater Utility Feasibility Study
4.3 Regional Approaches Considered
The Steering Committee was asked to narrow the universe of options to one preferred regional
approach to be considered for further evaluation in this initial feasibility study. The Project
Team developed a suite of regional programs considerations, potential regional frameworks,
assumptions, and objective criteria that were presented to the Steering Committee with an
explanatin of each. “Regional” stormwater programs were described and discussed in the
context of 3 essential building blocks:
A. Regional Program Management: activities are done together and/or consistently
across the region with consideration of the varying MS4 and CSS systems. The Project
Team provided several potential regional program approaches with a combination of the
following regional or local major program elements:
1. Combined Sewer System (CSS) lateral collection systems
2. Water quality programs
3. Municipal Separate Storm Sewer (MS4) collector systems & local flooding
4. Streams and floodplain management
5. Stormwater review and support for development
The Steering Committee was then asked to consider their preference for how each of
those above 5 elements should be handled: regionally or locally. The preliminary
approaches focused on preferences for regional program management.
B. Regional Organization: work is done or administered by multiple cooperative entities,
an existing entity or a new “regional entity”. The NBC’s potential role in the
organizational structure was reviewed and relevant discussion is provided following the
review of preliminary regional approaches. Regional organization preferences included
options for either “NBC” or “Regional” as the regional entity in which “Regional” would be
a new, separate regional entity.
C. Regional Funding: programs across the region are funded using a consistent or similar
approach, such as a stormwater utility. For simplification purposes, fees were assumed
to be collected regionally but redistributed to the communities for implementing “local”
options. The Steering Committee voiced concern about the complex allocation of funds
and expressed a desire to ensure that each participating community got value back.
The Project Team emphasized that although one preferred regional approach would be
considered for further evaluation, the approach may be transitional and not permanent to
accommodate changes and growth over time. The preliminary approaches presented to the
Steering Committee are summarized in Table 4.3 and described below.

Phase I Feasibility Study Report Page 65 Upper Narragansett Bay Regional Stormwater Utility Feasibility Study
Table 4.3 Preliminary Regional Approaches Considered by the Steering Committee
Approach A: Regional
Local governments manage CSS laterals, explained as everything up to the interceptors.
Regional entity responsible for all other elements.
Local governments would have little stormwater responsibility.
Approach A1 – NBC is Responsible for (#1) CSS Laterals
Similar to Approach A, but NBC would have responsibility for all CSS infrastructure. This approach for management of the CSS infrastructure has already been discussed between NBC and CSS communities.
Approach A2 – Local Community is Responsible for (#5) Stormwater Review
Similar to Approach A1, but local communities maintain control of stormwater review to provide more local control and reduce burden on developers.
Approach B: Regional/Local
Regional entity would be responsible for (#2) Water Quality and (#3) MS4 collector systems (e.g. pipes, catch basins, man holes, outfalls, BMPs) and local flooding resulting from issues with infrastructure.
Local governments would be responsible for (#4) streams and floodplain management and (#5) review of stormwater designs for permitting and development.

Phase I Feasibility Study Report Page 66 Upper Narragansett Bay Regional Stormwater Utility Feasibility Study
Approach B1 – Local Community is Responsible for (#3) MS4 Collector System
Similar to Approach B, but local communities would also have responsibility for their own MS4 infrastructure and local flooding resulting from issues with infrastructure.
In Approach B1, the regional entity is only responsible for water quality and not the MS4 infrastructure.
Approach C & C1: NBC/Local
Similar to Approach B & B1, but NBC was recognized as the specific organization for the regional entity.
The following pros and cons were discussed by the Steering Committee for Approach A:
PROS CONS
Takes burden off of understaffed municipalities.
One more level for developers to have to go through for approvals. Could be overcome through a one-stop shop service.
Watershed planning for water quality and flooding.
Residents being concerned about regional authority’s responsiveness to local issues like flooding events.
Dedicated professional stormwater staff can provide technical support.
Additional overhead costs.
TMDLs addressed regionally. Prioritization of projects may result in funding going to projects in other communities. Fee payers may not immediately see what their money is going towards since it’s not in their city.
Economies of scale – work shared and equipment shared means lower local operating costs.
Might not see local projects.
The following pros and cons were discussed by the Steering Committee for Approach B:
PROS CONS
More local control and flexibility. Concern about fees returning to local towns.
More responsive to citizens. Spending controlled by local councils.
The following pros and cons were discussed by the Steering Committee for Approach C:
PROS CONS
NBC already successfully runs a regional program.
Currently, the NBC is only responsible for CSS from the interceptors to the plant.
NBC already has a billing system and administrative support. Wet weather fee component can be added.
Not all the communities in the regional study are serviced by NBC. What would be the perception of those users receiving a bill from NBC?
Integrated approach for water quality. NBC does not currently have the regulatory authority to manage stormwater.

Phase I Feasibility Study Report Page 67 Upper Narragansett Bay Regional Stormwater Utility Feasibility Study
Discussion of NBC Role as Regional Entity
In addition to the pros and cons of NBC acting as the “regional entity” under Approach C, the
Stakeholder Group discussed the following important question: Can we build on NBC instead of
creating a separate program? The following key points were discussed:
The NBC is already a regional entity. It is respected, well run and their program incorporates stormwater management for areas that drain to NBC interceptors.
There are concerns that the early wastewater program track record was not as good as it is today and people may remember that.
NBC just raised their rates and won’t want to add another fee.
The CSO initiative (long-term control plan) is demanding on NBC staff.
NBC does interceptors and treatment. Smaller pipes belong to town.
NBC does permitting for projects.
NBC handles large infrastructure and may not be willing to take on lots of smaller projects, as well as operation and maintenance.
NBC is not currently authorized to charge a stormwater fee.
Local communities still have to deal with flooding issues and NBC is not well equipped to handle these types of issues.
In the past, NBC proposed to conduct a study and report about the organization potentially
taking over community wastewater collection systems through state legislature. NBC did not
want to force communities into this model if they didn't want to participate. They decided to go
forward with the plan internally and a legislative proposal was introduced but did not pass in the
senate. As far as NBC taking over the CSS laterals under the regional approaches discussed
above, this would be less than taking over the entire NBC service area and would focus on the
CSS systems in Central Falls, Pawtucket and Providence. See Section 4.5 for a discussion of
the NBC’s thoughts on billing for a regional stormwater utility.
Approach D – “Do Nothing”
The Steering Committee also suggested an Approach D – “Do Nothing” in which all program
elements remained local. The following information was provided in support of a “Do Nothing”
approach:
There are concerns about another fee for residents, particularly in economically challenged communities where people are already struggling to pay existing utility fees.
Cities who are doing things well don’t want to pay/support others who aren’t.
Regional Approach “Straw Poll”
Following the review of preliminary options and a discussion of the pros and cons, the Steering
Committee participated in a straw poll to rank each of the approaches from 1 – 5, with 1 being
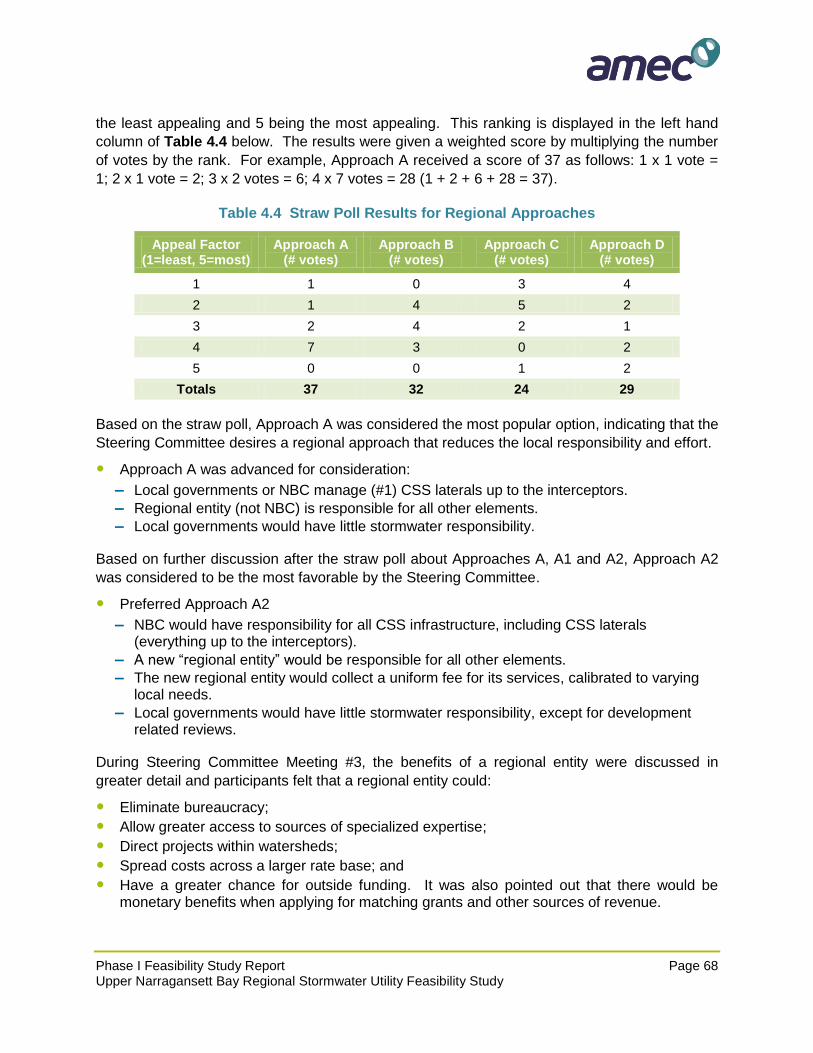
Phase I Feasibility Study Report Page 68 Upper Narragansett Bay Regional Stormwater Utility Feasibility Study
the least appealing and 5 being the most appealing. This ranking is displayed in the left hand
column of Table 4.4 below. The results were given a weighted score by multiplying the number
of votes by the rank. For example, Approach A received a score of 37 as follows: 1 x 1 vote =
1; 2 x 1 vote = 2; 3 x 2 votes = 6; 4 x 7 votes = 28 (1 + 2 + 6 + 28 = 37).
Table 4.4 Straw Poll Results for Regional Approaches
Appeal Factor (1=least, 5=most)
Approach A (# votes)
Approach B (# votes)
Approach C (# votes)
Approach D (# votes)
1 1 0 3 4
2 1 4 5 2
3 2 4 2 1
4 7 3 0 2
5 0 0 1 2
Totals 37 32 24 29
Based on the straw poll, Approach A was considered the most popular option, indicating that the
Steering Committee desires a regional approach that reduces the local responsibility and effort.
Approach A was advanced for consideration:
– Local governments or NBC manage (#1) CSS laterals up to the interceptors.
– Regional entity (not NBC) is responsible for all other elements.
– Local governments would have little stormwater responsibility.
Based on further discussion after the straw poll about Approaches A, A1 and A2, Approach A2
was considered to be the most favorable by the Steering Committee.
Preferred Approach A2
– NBC would have responsibility for all CSS infrastructure, including CSS laterals (everything up to the interceptors).
– A new “regional entity” would be responsible for all other elements.
– The new regional entity would collect a uniform fee for its services, calibrated to varying local needs.
– Local governments would have little stormwater responsibility, except for development related reviews.
During Steering Committee Meeting #3, the benefits of a regional entity were discussed in
greater detail and participants felt that a regional entity could:
Eliminate bureaucracy;
Allow greater access to sources of specialized expertise;
Direct projects within watersheds;
Spread costs across a larger rate base; and
Have a greater chance for outside funding. It was also pointed out that there would be monetary benefits when applying for matching grants and other sources of revenue.

Phase I Feasibility Study Report Page 69 Upper Narragansett Bay Regional Stormwater Utility Feasibility Study
Using the preferred Approach A2, the Steering Committee members were asked what they felt a
Regional Entity might do. Participants were given 2 votes for their top priorities and the results
are summarized in Table 4.5 below.
Table 4.5 Priorities for New Regional Entity
Top Duties for "New" Regional Entity Votes (2/person)
1. Construction & Engineering 8
2. MS4 Collection System Operator 8
3. Compliance Manager 3
4. Information Manager 3
5. Floodplain Manager 1
6. Regulator and Inspector 1
7. Watershed Manager 0
8. Development Partner 0
9. Public Educator 0
10. Finance and Administration 0
The Steering Committee provided feedback about what they liked and did not like about the
concept of regionalization. The following is a summary of the information discussed:
Likes about the Regional Approach
Watershed wide approach.
Consistency of funding.
Municipalities could move stormwater off their plate.
Consistency of services and solutions.
Only way problem will be addressed (current approach isn’t working).
Consistent regulation/enforcement and inspection.
Expertise fixing the problem.
Project consistency.
Dislikes about the Regional Approach
Loss of control over system.
Cities will be less accountable for stormwater issues.
Cost is going to be significant – the entire project costs are significantly underestimated.
Fee creep.
Public perception of a “rain tax”.
Unforeseen challenges (e.g., lawsuits, costs).
Concerns about fair play and municipal priorities.
Following discussion of likes and dislikes about the regional approach, both the Steering
Committee and Stakeholder Group were asked if this approach should be explored further.
Table 4.6 summarizes the results of the voting and indicates that the members felt that a
regional user fee approach warrants further investigation.

Phase I Feasibility Study Report Page 70 Upper Narragansett Bay Regional Stormwater Utility Feasibility Study
Table 4.6 Voting to Continue Exploring a Regional User Fee Approach
Continue w/Regional User Fee Approach
Steering Committee Votes
Stakeholder Group Votes*
1 (Strong No) 0 0
2 (Don't Like It) 2 0
3 (Neutral) 3 0
4 (Best Among Options) 5 1
5 (Strong Support) 2 11
6 (Other/ No Vote) 0 0
Note: *one member left early.
Table 4.7 summarizes the Project Team’s review of the potential benefits of regionalization
using Approach A2 and the current understanding of compelling issues in each community.
Benefits are color-coded according to their potential to provide a positive benefit to address
community specific needs. Further analysis is provided in Section 4.4 to consider the future
cost of a regional versus independent program.
Table 4.7 Qualitative Summary of Regionalization Benefits Using Approach A2
Municipality
Flo
od
ing
Pre
se
rvati
on
of
Pro
pe
rty V
alu
e
Wate
r Q
uality
&
Eco
log
ical C
on
cern
s
Ag
ing
In
frastr
uctu
re
Co
mp
lian
ce
Req
uir
em
en
ts
Qu
ality
of
Lif
e &
Aesth
eti
cs
Develo
pm
en
t
Pre
ssu
res
CS
S L
ate
rals
Op
era
tio
n &
Main
ten
an
ce
Central Falls
Cranston
East Providence
North Providence*
Pawtucket
Providence
Warwick
Relative Benefit:
High
Moderate
Low Note: *North Providence did not participate in a one-on-one meeting with the Project Team or provide compelling case information.

Phase I Feasibility Study Report Page 71 Upper Narragansett Bay Regional Stormwater Utility Feasibility Study
As outlined in Table 4.7 above, the regional Approach A2 has the potential to provide a
relatively high benefit for communities in the Upper Narragansett Bay to address multiple
compelling issues and stormwater management needs.
4.4 Preliminary Stormwater Utility Rate Analysis
This section discusses the preliminary analysis for a stormwater utility rate that was considered
to illustrate the concept of a stormwater utility and obtain Steering Committee and Stakeholder
Group feedback. It is important to note that this analysis is very preliminary and detailed data
for land use by parcel was not readily available in most communities and the level of service for
the future stormwater program is not finalized. However, this information provides a sense of
what a stormwater utility might look like for participating communities in the Upper Narragansett
Bay region based on what we know now.
4.4.1 Rate Methodology – Basic Structure & ERU
Background
A stormwater utility recognizes a property’s demand on the stormwater system for discharging
their runoff. The stormwater system is a public system that carries runoff away from both public
and private properties. The framework that describes how much each property pays is called
the “rate structure”. The rate structure developed for a particular utility is divided into three
modules:
Basic rate methodology;
Modification factors, which can be applied to any of the rate concepts to enhance equity, reduce costs, and meet other objectives; and
Secondary funding methods that can be adopted in concert with the service charges.
Rate structures differ among utilities and the differences sometimes reflect program goals or
priorities such as the desire to encourage green designs or preserve open space, the influence
of other policy objectives such as growth management or economic development, technical
constraints, or the availability of resources like GIS or other databases.
A key attribute of utility service fee funding is that the governing body of a utility’s jurisdiction
has broad authority to design its rate methodology to fit local circumstances and practices and
achieve an allocation of the cost of services and facilities that it desires, while staying within
legal boundaries. The goal of a utility’s funding decisions is to design a user fee structure that
reflects the character and desires of the community and that meets five tests:
1. It is equitable and reasonable;
2. It is not discriminatory or confiscatory;
3. It has costs that are substantially related to provision of facilities and services; 4. It has a rate that is related to demand of the stormwater systems and services for each
individual property (rational nexus); and 5. It reflects the authority inherent in state law.

Phase I Feasibility Study Report Page 72 Upper Narragansett Bay Regional Stormwater Utility Feasibility Study
Basic Rate Methodology
The basic rate methodology defines the basis for the rate that users will be paying. The three
main impacts on surface water of urban development are increases in peak flow, volume of
discharge, and amount of pollution. All impacts can fit into these three basic categories.
Accommodating the runoff that occurs when pervious area that typically absorbs rainwater, is
converted to impervious area requires the City to invest in the public drainage system.
Therefore, it is appropriate to use a measurement of impervious area or surrogate of impervious
area in rate methodologies. Stormwater billing is often based on a unit of imperviousness that
reflects a typical residence – called the Equivalent Residential Unit (ERU). Figure 4.1 shows an
example of the impervious coverage on a non-residential parcel in Providence that has
approximately 67,200 square feet of impervious area. Using an ERU size of 2,500 square feet
results in this parcel containing 27 ERUs (rounded) and would be billed based on the
stormwater program cost/ERU.
Figure 4.1 Sample Non-Residential Parcel ERU Calculation
Analysis Completed
This initial feasibility study did not include a detailed rate evaluation or consideration of multiple
rate options and policies. Land use data by parcel was not available for each of the
participating communities to calculate a median ERU by community. Therefore, the Project
Team calculated the total number of billed impervious acres, billable parcels and total number of
ERUs by community assuming an ERU size of 2,500 sqft. Non-billable parcels were assumed
to be roads, state properties and parcels with <400 sqft of impervious area. These parcels and
their associated impervious area from the 2012 RI GIS state-wide impervious GIS data layer
were excluded from the analysis. The results are presented in Table 4.8.
235 Promenade Street, Providence

Phase I Feasibility Study Report Page 73 Upper Narragansett Bay Regional Stormwater Utility Feasibility Study
Table 4.8 Total Equivalent Residential Units (ERUs)
Municipality Parcels Total Acres IA Acres Billed
IA Acres ERUs
Central Falls 2,854 825 548 344 5,991
Cranston 32,130 18,505 6,067 3,805 66,305
East Providence 15,544 8,953 3,292 2,064 35,971
North Providence 11,124 3,708 1,667 1,064 18,222
Pawtucket 19,305 5,670 3,481 2,184 38,046
Providence 40,840 12,037 7,672 4,812 83,839
Warwick 38,086 22,971 7,931 4,974 86,672
Totals 159,883 72,669 30,658 19,229 335,048
4.4.2 Preliminary Rate Analysis
The stormwater program drives the utility rate resultin in a cost/ERU based on total progrm cost
and total ERUs, assuming a basic rate approach. Based on the total number of ERUs across
the study area, a fee of $1.00/ERU/Month could support a stormwater program cost of
approximately $4M, as outlined in Table 4.9 below.
Table 4.9 Potential Revenue at $1.00/ERU/Month
Municipality Parcels ERUs Annual Revenue
$1/ERU/Month Fee
Central Falls 2,854 5,991 $71,892
Cranston 32,130 66,305 $795,660
East Providence 15,544 35,971 $431,652
North Providence 11,124 18,222 $218,664
Pawtucket 19,305 38,046 $456,552
Providence 40,840 83,839 $1,006,068
Warwick 38,086 86,672 $1,040,064
Totals 159,883 335,046 $4,020,552
Due to a lack of data and for simplification purposes, the Project Team evaluated the rates for
the study area communities based on the current and future estimated stormwater program
costs. This information is summarized in Table 4.10 below and indicates that initial rates would
be less than $4/ERU/month. However, it is important to note that the service area for the
stormwater utility in Central Falls, Pawtucket and Providence would be significantly less and
result in a higher fee based on the number of ERUs for properties that drain to the MS4. This
analysis requires additional work to better define the necessary level of service and cost for the
future stormwater program, as well as an appropriate rate structure using better data.

Phase I Feasibility Study Report Page 74 Upper Narragansett Bay Regional Stormwater Utility Feasibility Study
Table 4.10 Rates Based on Future Stormwater Program Costs
Municipality ERUs Current Budget
Future Program Initial Estimate
Fee $/ERU/Mo
Future Program $175/dev. acre/year
Fee $/ERU/Mo
Central Falls 5,991 $17,723 $29,510 $0.41 $134,400 $1.87
Cranston 66,305 $1,354,073 $1,635,193 $2.06 $2,562,560 $3.22
East Providence 35,971 $275,400 $692,700 $1.60 $1,500,800 $3.48
North Providence 18,222 $117,847 $490,853 $2.24 $649,600 $2.97
Pawtucket 38,046 $82,311 $388,237 $0.85 $974,400 $2.13
Providence 83,839 $1,346,343 $3,315,647 $3.30 $2,072,000 $2.06
Warwick 86,672 $596,729 $1,177,473 $1.13 $3,180,800 $3.06
Totals 335,046 $3,790,426 $7,729,612 $1.66 $11,074,560 $2.68
(avg.) (avg.)
The Steering Committee and Stakeholder Group were polled to gauge the following:
Steering Committee Willingness to Pay – the monthly fee per billing unit (ERU or single-family residence) that each member would be willing to pay based on the current understanding of stormwater program needs.
General Population Willingness to Pay – the amount that members felt the general population would be willing to pay.
Table 4.11 Evaluation of “Willingness to Pay”
Steering Committee Voting Stakeholder Group Voting
Willingness to Pay ($/Mo/ERU)
SC Members General
Population Stakeholder
Members General
Population
$0 0 2 0 0
$1 0 1 0 0
$2 0 1 0 0
$3 0 1 0 1
$4 3 4 0 9
$5 1 2 3 2
$6 0 1 1 -
$7 1 - 1 -
$8 2 - 0 -
$9 0 - 0 -
$10 2 - 5 -
$15 0 - 3 -
$20 1 - 0 -
The voting generally indicates that some of the Steering Committee and Stakeholder Group
members are willing to pay a much higher fee than the perceived willingness of the general
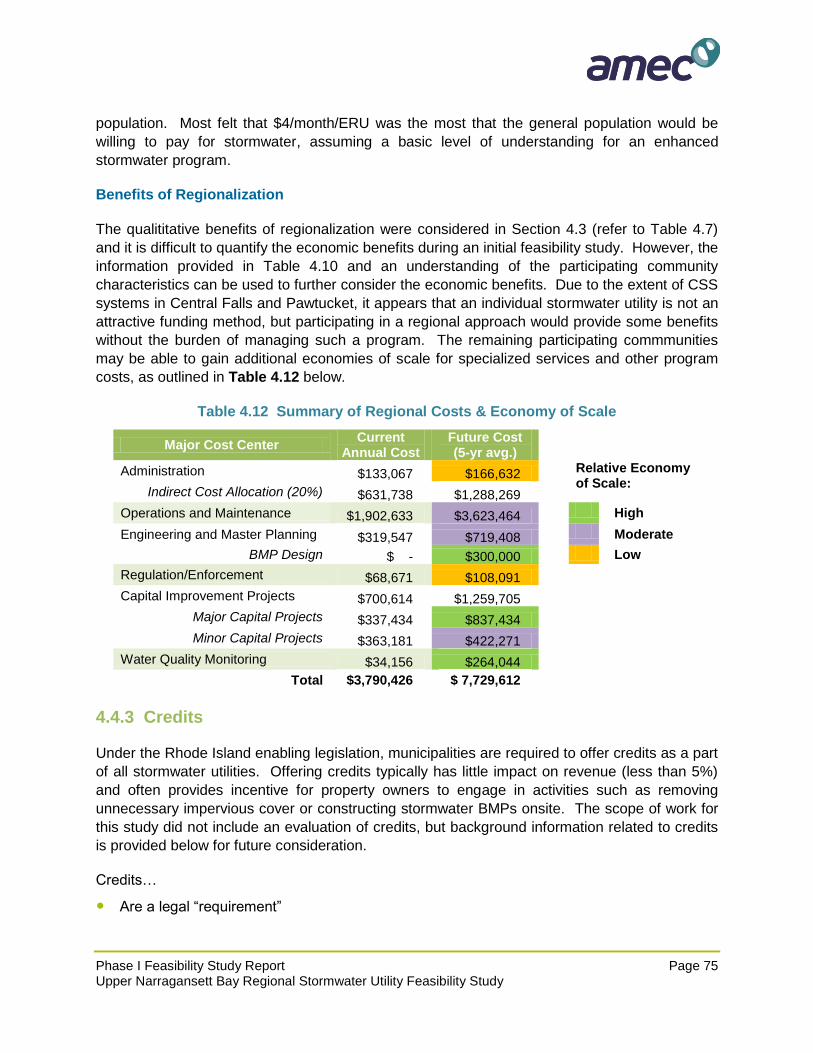
Phase I Feasibility Study Report Page 75 Upper Narragansett Bay Regional Stormwater Utility Feasibility Study
population. Most felt that $4/month/ERU was the most that the general population would be
willing to pay for stormwater, assuming a basic level of understanding for an enhanced
stormwater program.
Benefits of Regionalization
The qualititative benefits of regionalization were considered in Section 4.3 (refer to Table 4.7)
and it is difficult to quantify the economic benefits during an initial feasibility study. However, the
information provided in Table 4.10 and an understanding of the participating community
characteristics can be used to further consider the economic benefits. Due to the extent of CSS
systems in Central Falls and Pawtucket, it appears that an individual stormwater utility is not an
attractive funding method, but participating in a regional approach would provide some benefits
without the burden of managing such a program. The remaining participating commmunities
may be able to gain additional economies of scale for specialized services and other program
costs, as outlined in Table 4.12 below.
Table 4.12 Summary of Regional Costs & Economy of Scale
Major Cost Center Current
Annual Cost Future Cost (5-yr avg.)
Administration $133,067 $166,632 Relative Economy of Scale:
Indirect Cost Allocation (20%) $631,738 $1,288,269
Operations and Maintenance $1,902,633 $3,623,464 High
Engineering and Master Planning $319,547 $719,408 Moderate
BMP Design $ - $300,000 Low
Regulation/Enforcement $68,671 $108,091
Capital Improvement Projects $700,614 $1,259,705
Major Capital Projects $337,434 $837,434
Minor Capital Projects $363,181 $422,271
Water Quality Monitoring $34,156 $264,044
Total $3,790,426 $ 7,729,612
4.4.3 Credits
Under the Rhode Island enabling legislation, municipalities are required to offer credits as a part
of all stormwater utilities. Offering credits typically has little impact on revenue (less than 5%)
and often provides incentive for property owners to engage in activities such as removing
unnecessary impervious cover or constructing stormwater BMPs onsite. The scope of work for
this study did not include an evaluation of credits, but background information related to credits
is provided below for future consideration.
Credits…
Are a legal “requirement”

Phase I Feasibility Study Report Page 76 Upper Narragansett Bay Regional Stormwater Utility Feasibility Study
Normally little revenue impact (<5%)
Offers a carrot
Credits are earned, not given, and not an “exemption” or “incentive”
Ongoing recognition of ongoing private investment for a public good
Credit systems are becoming increasingly important in stormwater utilities because they create
incentives for property owners to reduce the amount or improve the quality of stormwater
generated on their property. It is not enough to simply provide funding for the stormwater
program, property owners need to help manage stormwater on-site, at the point it is generated.
For example, roof runoff can be directed to a dry well on the property, and depending on the
size, parking lot runoff can also be “disconnected” by draining to a lawn area, rain garden or
other on-site infiltration or treatment system. Improvements made by property owners reduce
the volume of runoff that must be managed by the town and thus reduce the town’s overall
stormwater program costs.
There are two types of credits:
1. Impact Reduction – Measure of IA does not reflect a property’s true impact to the system – Often tied to managing stormwater on-site and thus reducing impact to the larger
system or meeting design criteria.
2. Cost Reduction – Reduces the City’s or regional entity’s costs through private efforts (less common)
– Take on a public responsibility such as education or maintenance (i.e. education on water quality, maintenance of larger areas or RIPDES permit compliance).
The following policy questions must be considered:
Policy Question #1: What private action and investment should qualify for a credit?
Policy Question #2: How much of the stormwater program should be available for crediting and how generous should the credit be?
There are a few additional things worth noting about credits. Credit systems can be complex to
administer and may not be large enough to cause any real change. The majority of property
owners will likely decide that their bill is not large enough to necessitate behaviors that will
qualify for credits. Credits are also mismatched to development. The owner of the property, not
the developer, receives the credit. This reduces the incentive for developers to take credits into
consideration when designing and constructing new developments. Credits are also a “zero
sum game.” The more credits the City of regional entity gives away, the higher everyone else’s
bill can become.
Reasons to cap credits:
Fixed costs – 5%±
– this cost will not decrease
Irreducible and unrelated program costs – 15%±
– this cost is not tied to impervious area

Phase I Feasibility Study Report Page 77 Upper Narragansett Bay Regional Stormwater Utility Feasibility Study
Roads – everybody should pay – 35%±
– this cost is allocated to everyone now
Limits on treatment effectiveness
– can’t eliminate all impacts of development
If the UNB region moves forward with a regional stormwater utility, policy decisions addressing
a credit system will need to be analyzed from both a policy and finance perspective.
4.5 Billing & Data Analysis
This subsection provides an introduction to billing and considerations for a regional stormwater
utility. When most people think of municipal bills to support revenue or services the most
common are tax, water and sewer bills. These bills are associated with a specific billing or
physical address and are typically billed monthly, quarterly, or semi‐annually. In the case of
stormwater utility bills, the key association is “account,” which may not be a unique address or a
unique parcel. Therefore, a stormwater utility billing system requires the development of a new
“master account file” (MAF) and potentially the development of a new mechanism to deliver the
bill.
There are generally four options for billing systems: Tax bill; public utility bill (water or
wastewater ‐ most common); private utility bill (e.g., electric); and a new stand‐alone bill. In
Rhode Island, water and sewer billing account files are typically based on the Tax Assessor’s
database and the relationship of parcel ID to billing account is clear, including parcels with
multiple accounts and multiple parcels with the same account. Water and sewer bills are often
delivered with taxes, as would likely be the case with stormwater.
Data for existing billing systems was not reviewed since land use codes per parcel and parcel
IDs were not available in all communities to evaluate properties that would receive a stormwater
bill compared to what is available in other billing systems. The level of effort to develop a MAF
for billing will be based on the quality of future data, which will determine the amount of cas-by-
case analysis and manual matching that may be required.
NBC Discussion on Billing
Billing for a regional stormwater utility by the NBC was discussed during Steering Committee
Meeting #3. In general, the NBC Board of Directors does not want to do billing for another entity
in the case of a new “regional entity” that would be managing the stormwater program. The
following feedback and information was provided during the meeting:
The NBC doesn't want to be labeled as trying to impose new fees on the community, and therefore, has no interest in taking on those duties.
Although there may be efficiencies through integration of administrative functions and customer service, the NBC service area does not include all communities.
NBC’s current position is that they don’t want to take on billing for a regional stormwater entity. The two biggest hurdles to change that position are the NBC Board of Directors and

Phase I Feasibility Study Report Page 78 Upper Narragansett Bay Regional Stormwater Utility Feasibility Study
the Public Utilities Commission (PUC). There are other entities that serve more people that might be willing to do billing.
NBC is regulated by the PUC so everything that appears on their bill has to be approved by them.
Data Evaluation and Future Needs
Based on the data reviewed during the initial feasibility study, the following data needs were
identified to support an in-depth planning study to develop a regional stormwater utility:
Impervious Data: the existing state-wide impervious cover GIS data layer provides good capture of impervious surfaces and may only need minor updating as new imagery is available. A basic review and update of major non-single family residential (NSFR) features is recommended to capture any significant data gaps in coverage. Prior to implementation-phase rate modeling or development of a billing master account file (MAF), AMEC recommends that the impervious for all properties be reviewed/updated on a finer scale to improve accuracy at a capture scale that would support measurements to the nearest 500 sq ft.
Parcel/Imagery Alignment: the parcel data alignment in some communities such as North Providence is very poor and requires updates to the parcel GIS data layer. Other communities have less severe alignment issues, but may require some per-property spatial alignment to appropriately assign impervious area polygons to parcels. AMEC understands that the Town of North Providence is in the process of updating its parcel GIS data layer.
Imagery: AMEC reviewed aerial imagery provided online by ESRI and Bing and it is anticipated that this image source is suitable for any future stormwater utility effort, unless another source is provided. That said, the available imagery is recent and of high-quality but has differing resolutions for some communities and may be from slightly different timeframes. Impervious capture should be planned based on lowest resolution available.
Parcel Data: existing parcel data needs to provide enough information to cleanly separate detached-single-family (SFR) from NSFR properties.
Parcel/Utility Account Association: using updated parcel GIS data layers, matching between parcels and existing water/sewer accounts will be needed to identify any stormwater-only properties and to develop the correct account/parcel associations in the MAF.
Rate Model and Credit Support: an analysis/query/report of properties and impervious information will be necessary as rate structure, billing units, credits, and rate model are evaluated.
MAF Development: one of the final steps in utility implementation includes the development of the MAF for billing. This effort incorporates all rate factors, parcel classification, final parcel/account association, fee calculation, fee-testing and verification, test-file integration with billing system, technical implementation support, and basic documentation. The development of the MAF will depend largely on how the new “regional entity” operates and carries out administrative functions.

Phase I Feasibility Study Report Page 79 Upper Narragansett Bay Regional Stormwater Utility Feasibility Study
5.0 Recommendations & Next Steps
5.1 Summary of Recommendations
Based on the results of the initial feasibility study, the weight of evidence indicates that:
1. Maintaining status quo is not an option: flooding, water quality problems, and
deteriorating infrastructure require action;
2. The costs for the future stormwater management programs for each municipality will be
significantly higher than current expenditures;
3. Compliance with TMDL requirements will require a combination of non-structural and
structural controls implemented over time and through a comprehensive strategy; and
4. The likelihood that the general fund in each community can continue to fully support
implementation is low.
The following recommendations were developed through meetings with the Steering Committee
and Stakeholder Group:
1. Continue to explore a stormwater user fee to fund an enhanced stormwater
program: the majority of the Steering Committee members felt that a user fee funding
approach was the best approach among the available options and Stakeholder Group
members showed strong support.
2. Continue to explore a regional approach with a stormwater user fee: the majority of
the Steering Committee and Stakeholder Group members were neutral or felt that a
regional approach for stormwater management with funding through a user fee versus
tax revenue was the best approach among the available options.
3. Pursue funding for the implementation of next steps: a grant application was
submitted on January 31, 2014 for the Hurricane Sandy Coastal Resiliency Competitive
Grants Program with the National Fish and Wildlife Foundation (NFWF). The NFWF
anticipates awarding grants in April 2014.
4. Engage and update stakeholders in each of the participating communities:
schedule meetings with key municipal staff and other stakeholders to provide an update
on the results of the project and develop support for next steps.
5. Conduct public presentations for elected officials on the Phase I Study: this is
already planned as a continuation of the study to be completed by the Project Team.
6. Engage the current stakeholder group in additional public presentations: work with
interested members to make presentations about the regional approach to other
community leaders, including: trade associations, chambers of commerce, and other
property owner groups.

Phase I Feasibility Study Report Page 80 Upper Narragansett Bay Regional Stormwater Utility Feasibility Study
5.2 Next Steps & Roadmap
Concurrent with the completion of the initial feasibility study, the City of Providence acting on
behalf of the regional study participants, prepared an application for the Hurricane Sandy
Coastal Resiliency Competitive Grants Program to continue what has become defined as the
Phase II Upper Narragansett Bay Regional Stormwater Management (UNBRSM) Initiative. The
application was submitted on January 31, 2014 and discussed the progress to date for the
Phase I study with a proposed scope of work and road map for the Phase II Planning Project
and a future Phase III for final implementation. The grant application included the following six
communities from the Phase I Study:
Central Falls
Cranston
East Providence
Providence
Pawtucket
Warwick
The overall goal of the UNBRSM Initiative is to develop and implement a regional solution to
address the financial, operational, environmental, and management issues and needs of
communities in the Upper Narragansett Bay watershed. The Phase II Planning Project will
explore the viability of a regional stormwater management and funding approach through a
regional stormwater utility, which will address infrastructure improvements, water quality, habitat
protection, and flooding issues. The UNBRSM initiative will provide a more integrated program
across the six communities with model approaches for implementation of activities to meet each
community’s needs. Final adoption of a regional stormwater utility or an alternative funding
approach will be completed under Phase III – Implementation.
The five key goals of the Phase II Planning Project are as follows:
1. Evaluate priority areas and establish a process for consistent asset mapping, asset inventory, and condition assessment related to coastal resiliency and stormwater management planning;
2. Assess current and future stormwater management program operational and capital needs and costs;
3. Develop a strategic organizational structure and governance plan for sustainable UNBRSM and coastal resiliency;
4. Complete all aspects of tactical planning to support a regional stormwater utility under Phase III – Implementation; and
5. Enhance public awareness of the UNBRSM initiative and regional issues through planned public outreach.
As depicted on the organization chart in Figure 5.1, the City of Providence with support and
assistance from RIDEM, a consultant team, and interns, will continue to lead a Project Team of
partnering municipalities and stakeholders for the detailed planning phase of the Upper
Narragansett Bay Regional Stormwater Management Initiative. The Project Team will be
UNBRSM INITIATIVE
PHASE I
Feasibility Study
PHASE II
Planning Project
PHASE III
Implementation

Phase I Feasibility Study Report Page 81 Upper Narragansett Bay Regional Stormwater Utility Feasibility Study
supported by an advisory stakeholder group that has been actively involved in the Phase I
Feasibility Study.
Figure 5.1 Phase II Project Team Organization
The project manager will be Sheila Dormody, City of Providence’s Director of the Office of
Sustainability. Sheila along with support from the Deputy Chief of RIDEM’s Office of Water
Resources, Elizabeth Scott, has been spearheading efforts to improve the City and region’s
resiliency efforts and was the project manager for the Phase I Feasibility Study for the regional
stormwater utility.
UNBRSM Initiative (Phase II) Work Plan
Figure 5.2 presents the comprehensive work plan envisioned for the three-phased UNBRSM
Initiative and the key activities associated with each of the three phases. For effective planning
and implementation, the key activities are grouped into the following five distinct tracks:

Phase I Feasibility Study Report Page 82 Upper Narragansett Bay Regional Stormwater Utility Feasibility Study
Stakeholders: Involves all activities pertaining to engaging internal and external stakeholders, and activities associated with the broader public/rate payer outreach.
Program: Involves both strategic and tactical activity components ranging from program planning and prioritization to in-depth asset inventory development and mapping.
Organization: Involves defining all activities that relate to policy, legislation, inter-governmental agreement issues and organizational authority, staffing and structure.
Finance: Involves financial planning including funding strategies and rate structure, and defining all aspects of accounting, budgeting, and financing processes.
Billing Systems / Management: Involves activities that relate to defining parcel data management and billing systems, and developing draft manuals, regulations, and business processes.
Phase II includes twenty-eight (28) key activities that span these five tracks. While some
activities build upon each other, many others will be performed concurrently.
Figure 5.2 Comprehensive Work Plan: UNBRSM Initiative
Table 5.1 provides a brief summary of the entities responsible, the anticipated outputs, and the
proposed timeline for the Work Plan.

Phase I Feasibility Study Report Page 83 Upper Narragansett Bay Regional Stormwater Utility Feasibility Study
Table 5.1 Work Plan Logistics
# Activity Lead entity Completion
timeline Key outputs
Stakeholders Track
S1 Quarterly Steering Meetings Consultant September 2015 Presentations / Papers
S2 Quarterly Stakeholder Meetings Consultant September 2015 Presentations / Papers
S3 Public Outreach Plan Consultant March 2015 Outreach Plan
S4 Public Outreach Materials Consultant April 2015 Brochures / Media Info
S5 Awareness Campaign Partners August 2015 Six outreach events
Program Track
P1 GIS Asset Mapping & Inventory Interns October 2014 GIS Asset Database
P2 Asset Condition & Impervious Cover Assessment
Consultant December 2014 Parcel Database
P3 Coastal Resiliency Objectives, Needs & Priorities
Providence & Partners
December 2014 Strategic Objectives
P4 Storm Drain Infrastructure Vulnerability Assessment
Consultant January 2015 Key Infrastructure Prioritization Scheme
P5 Capital & Operational Program Assessment
Consultant January 2015 Tactical Needs Report
P6 10-year Prioritized CIP Providence & Partners
February 2015 10-year CIP Project Schedule
P7 O&M and CIP Cost Estimates Consultant March 2015 Preliminary Costs
Organization Track
O1 Co-operative and Interactive Regional Utility Framework
Consultant March 2015
Regional Utility Organizational Plan
O2 Operational, Financial, Administrative Policy Development
Consultant March 2015
O3 Regional Utility Charter & Ordinances
Providence April 2015 UNBRSM Draft Charter
O4 Service Level Agreements (SLAs) Providence May 2015 Draft SLAs
O5 Resource / Cost Sharing Agreements
Providence June 2015 Draft MOUs
O6 Organizational Structure & Staffing
Consultant March 2015 Regional Utility Organizational Plan

Phase I Feasibility Study Report Page 84 Upper Narragansett Bay Regional Stormwater Utility Feasibility Study
# Activity Lead entity Completion
timeline Key outputs
Finance Track
F1 10-year Revenue Requirement Projections
Consultant May 2015 UNBRSM Financial Plan
F2 Financial Policies & Funding Plan Consultant April 2015
F3 Credits/Appeals Program Policies & Procedures
Consultant April 2015 Draft Credit Program Manual
F4 Rate Methodology & Structure Analysis
Consultant May 2015 UNBRSM Financial Plan
F5 Draft Rate Schedule & Ordinances
Consultant & Providence
June 2015 Draft Rate Ordinances
Billing Systems/Management Track
B1 Billing & Collections Policies / Procedures
Consultant July 2015 Draft Billing Operations SOP
B2 Parcel Data Analysis Database Consultant March 2015 Master Account File
B3 Finalization of Billing System Providence July 2015 Billing System Plan
B4 Staffing Roles & Responsibilities Providence June 2015 Staffing and Training Plan
B5 Training Plan and Materials Consultant August 2015 Training Plan
B6 Draft Stormwater Management Regulations
Consultant August 2015 Draft UNBRSM Regulations
Phase II – UNBRSM Planning Project Completion September 2015
5.3 Budget Estimate for Next Steps – Phase II
A budget summary was developed for the Phase II Planning Project and submitted as part of the Hurricane Sandy Grant. The grant proposal requested $499,685 that will supplement the existing $150,000 available from the RI Bays, Rivers and Watersheds Coordination Team and match (in-kind services) from the RIDEM and participating communities. The full project cost is summarized in Table 5.2 below and includes in-kind services (staff time, fully-burdened labor) for the 6 municipal partners and the RIDEM.

Phase I Feasibility Study Report Page 85 Upper Narragansett Bay Regional Stormwater Utility Feasibility Study
Table 5.2 Budget Summary for Phase II Planning Project & NFWF Grant Application
Phase Description Cost
1 Stakeholder Track $ 128,140
2 Program Track $ 315,623
3 Organization Track $ 70,560
4 Finance Track $ 86,479
5 Billing System/Management Track $ 86,682
6 Project Management / Project Meetings $ 65,701
7 Draft & Final Plans $ 39,920
8 Data Compilation & Analysis Contingency $ 10,000
9 Project Meetings/Field Work Travel (Trips) $ 18,000
Total $821,105 In-Kind Match $171,420 Cash Match $150,000 Requested NFWF Grant $499,685
If the NFWF grant is not successful, the Steering Committee discussed the options to continue
the project with the current committed funds from the RI Bays, Rivers and Watersheds
Coordination Team of $150,000 while continuing to seek additional grant funds. This would
require additional community support (staff time and/or financial contribution) to accelerate the
project with funding contributions and/or provide infrastructure mapping and assessment and an
evaluation of future program needs. A preliminary 2-step approach was developed for future
consideration:
Phase II
Step 1
•Communities provide infrastructure & future cost data
•Communities provide updated GIS data & impervious cover
•Contractor to facilitate regional program & level of service analysis
Phase II
Step 2
•Finance evaluation & data/billing systems
•Public outreach campaign
•Development of policies, regional framework and agreements
Phase III
•Finalize/adopt organizational structure & legal agreements
•Roll-out implementation activities