decision-support tools and databases to inform regional stormwater utility development ... · ·...
TRANSCRIPT
Decision-Support Tools and Databases to
Inform Regional Stormwater Utility
Development in New England
Detenbeck, N.E.1, A. Morrison2, J. Morgan2, V. Zoltay3, R. Abele4, J. LeClair4, and T. Garrigan4
1 U.S. Environmental Protection Agency, Atlantic Ecology Division, Narragansett,RI 2 ORISE interns at US EPA Atlantic Ecology Division
3 Abt Associates, Inc., Cambridge, MA 4 US EPA Region 1, Boston, MA
March 25, 2015 1
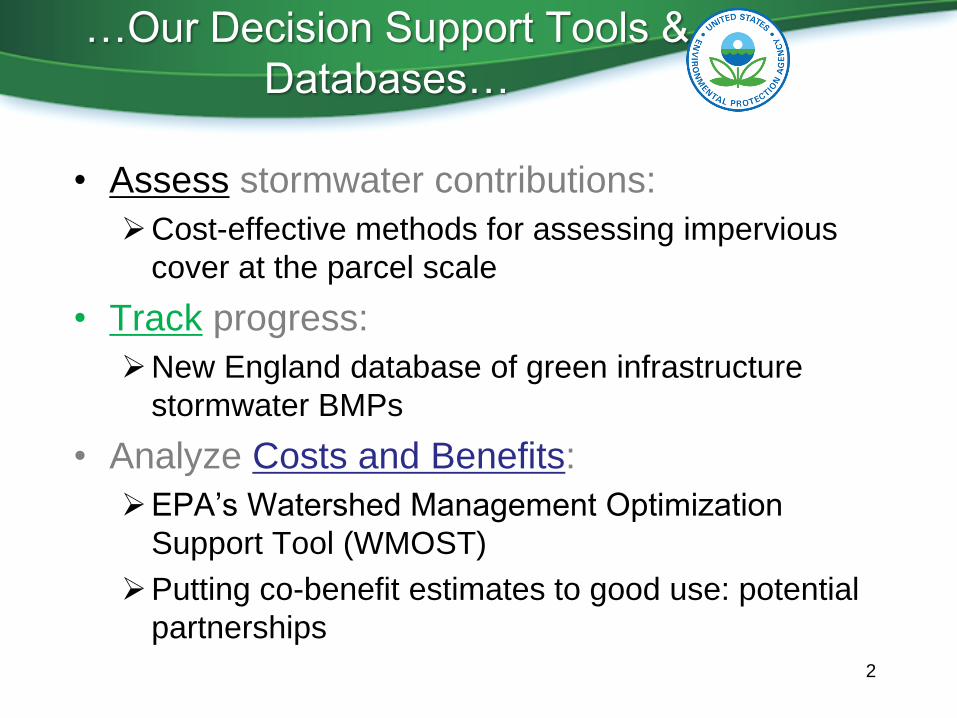
…Our Decision Support Tools &
Databases…
• Assess stormwater contributions:
Cost-effective methods for assessing impervious
cover at the parcel scale
• Track progress:
New England database of green infrastructure
stormwater BMPs
• Analyze Costs and Benefits:
EPA’s Watershed Management Optimization
Support Tool (WMOST)
Putting co-benefit estimates to good use: potential
partnerships
2
Assessing stormwater runoff
contributions
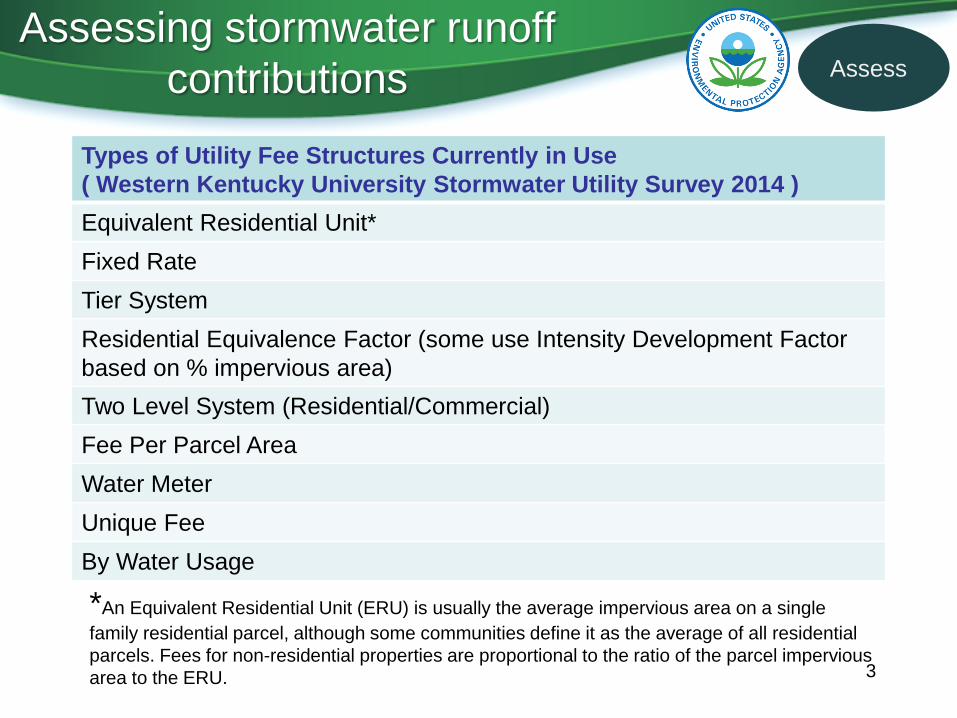
Types of Utility Fee Structures Currently in Use
( Western Kentucky University Stormwater Utility Survey 2014 )
Equivalent Residential Unit*
Fixed Rate
Tier System
Residential Equivalence Factor (some use Intensity Development Factor
based on % impervious area)
Two Level System (Residential/Commercial)
Fee Per Parcel Area
Water Meter
Unique Fee
By Water Usage
3
*An Equivalent Residential Unit (ERU) is usually the average impervious area on a single
family residential parcel, although some communities define it as the average of all residential
parcels. Fees for non-residential properties are proportional to the ratio of the parcel impervious
area to the ERU.
Assess
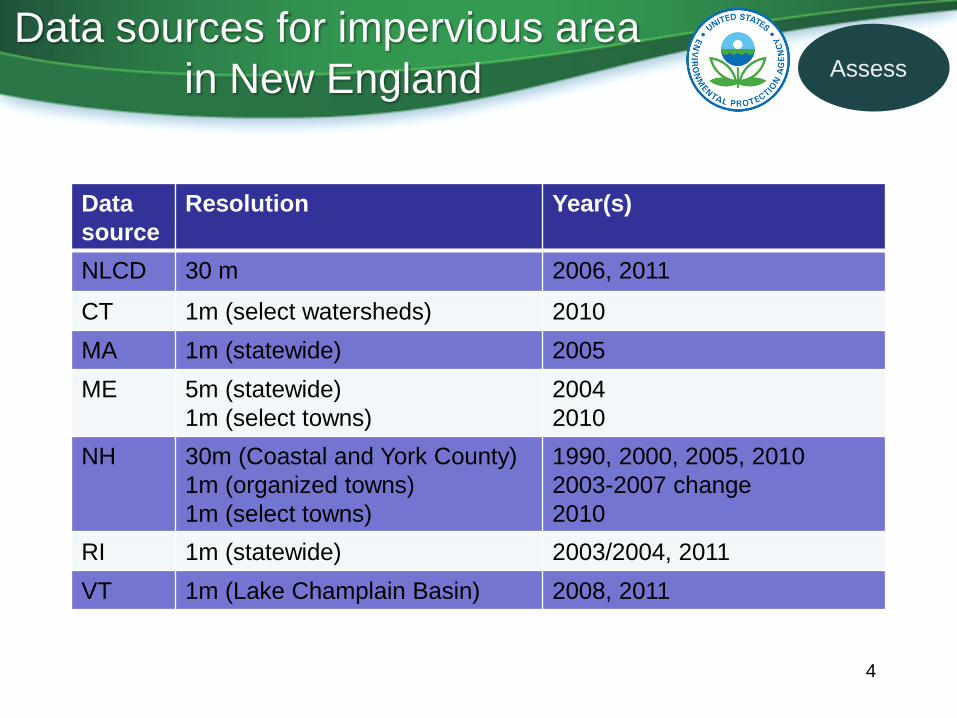
Data sources for impervious area
in New England
Data
source
Resolution Year(s)
NLCD 30 m 2006, 2011
CT 1m (select watersheds) 2010
MA 1m (statewide) 2005
ME 5m (statewide)
1m (select towns)
2004
2010
NH 30m (Coastal and York County)
1m (organized towns)
1m (select towns)
1990, 2000, 2005, 2010
2003-2007 change
2010
RI 1m (statewide) 2003/2004, 2011
VT 1m (Lake Champlain Basin) 2008, 2011
4
Assess
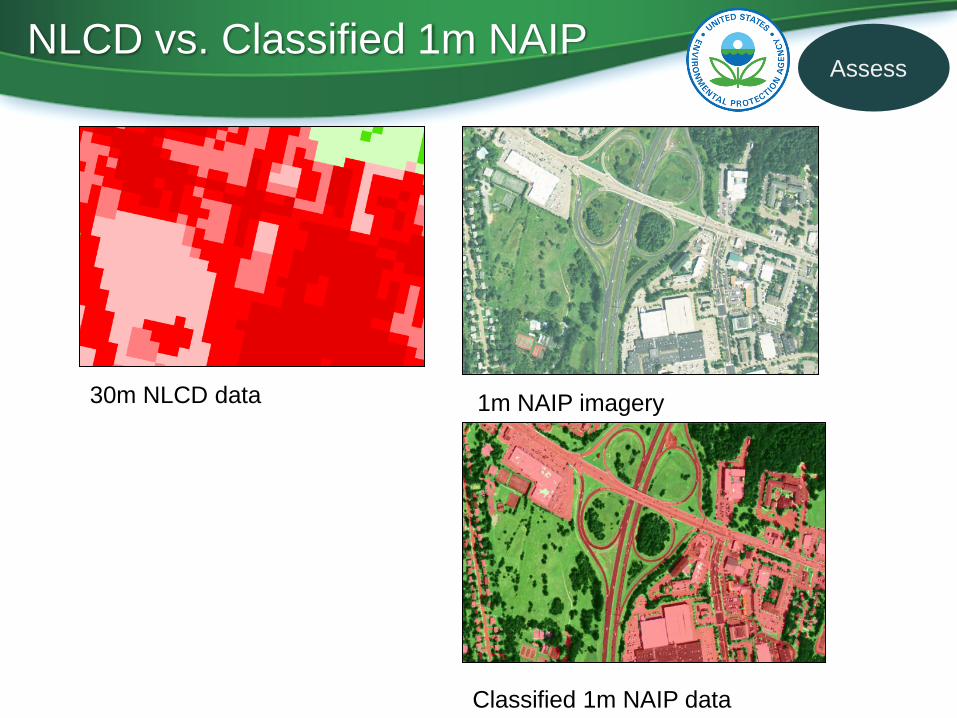
NLCD vs. Classified 1m NAIP
1m NAIP imagery
Classified 1m NAIP data
30m NLCD data
Assess
6
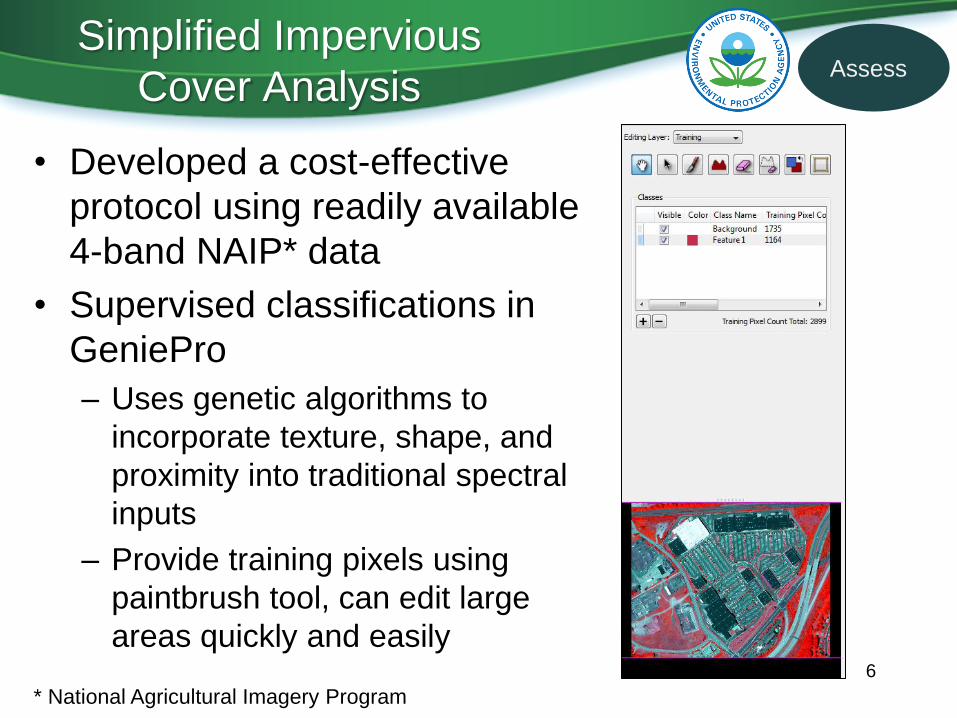
Simplified Impervious
Cover Analysis
• Developed a cost-effective
protocol using readily available
4-band NAIP* data
• Supervised classifications in
GeniePro
– Uses genetic algorithms to
incorporate texture, shape, and
proximity into traditional spectral
inputs
– Provide training pixels using
paintbrush tool, can edit large
areas quickly and easily
* National Agricultural Imagery Program
Assess
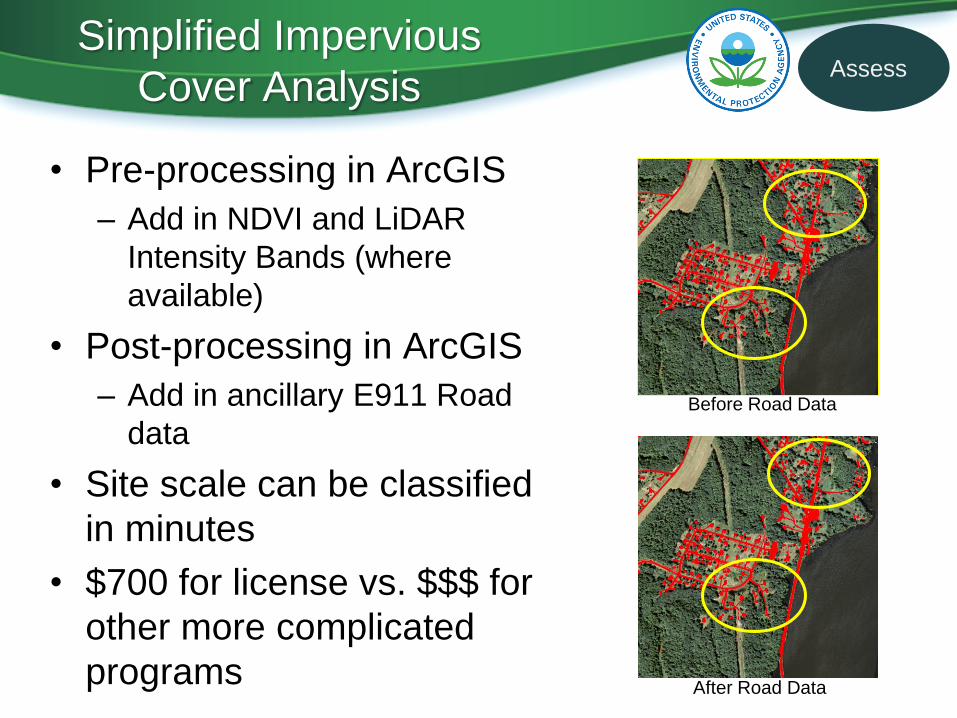
Simplified Impervious
Cover Analysis
• Pre-processing in ArcGIS
– Add in NDVI and LiDAR
Intensity Bands (where
available)
• Post-processing in ArcGIS
– Add in ancillary E911 Road
data
• Site scale can be classified
in minutes
• $700 for license vs. $$$ for
other more complicated
programs
7
Before Road Data
After Road Data
Assess
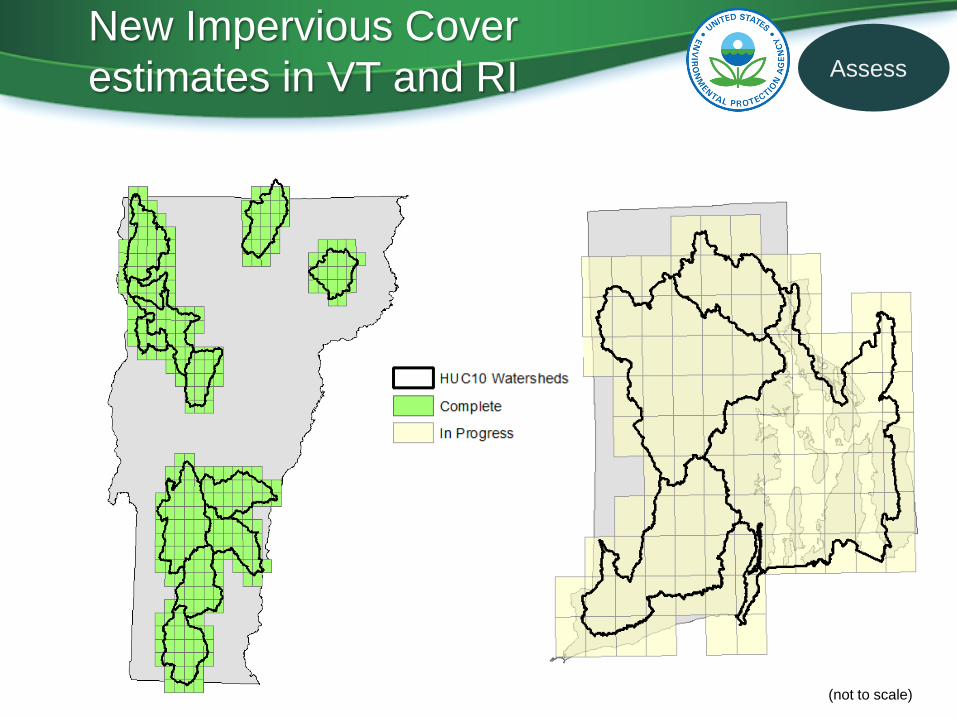
New Impervious Cover
estimates in VT and RI
8 ¯(not to scale)
Assess
• Stormwater rebates
• Compliance with MS4 permits
• Best Management Practice (BMP) inventory
for maintenance
• Watershed planning and adaptive
management
9
Why track treated impervious cover? Track
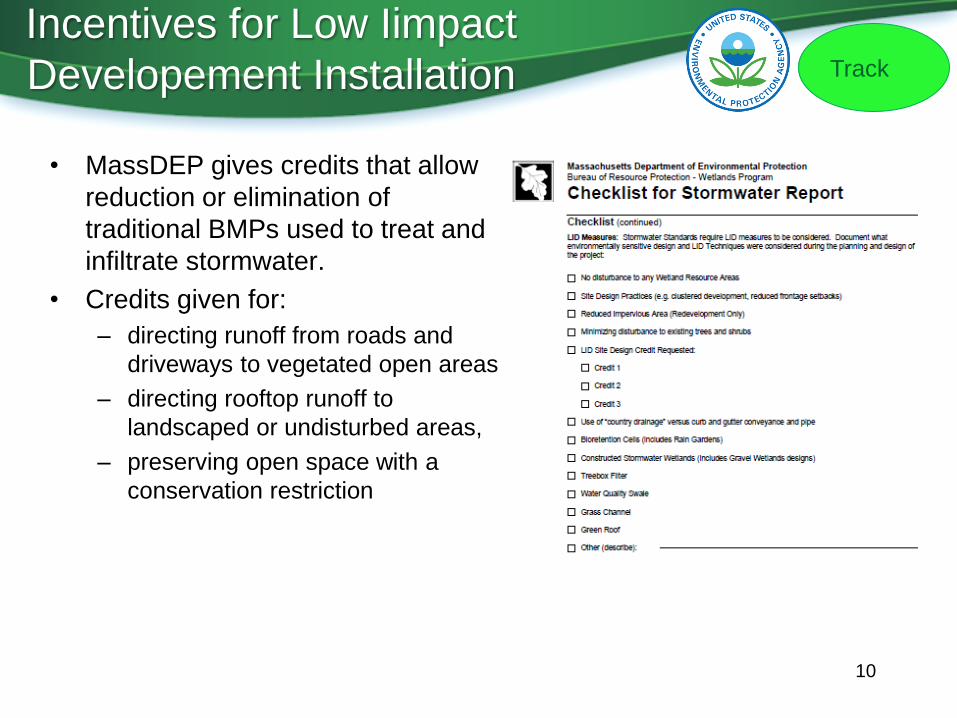
Incentives for Low Iimpact
Developement Installation
10
• MassDEP gives credits that allow
reduction or elimination of
traditional BMPs used to treat and
infiltrate stormwater.
• Credits given for:
– directing runoff from roads and
driveways to vegetated open areas
– directing rooftop runoff to
landscaped or undisturbed areas,
– preserving open space with a
conservation restriction
Track
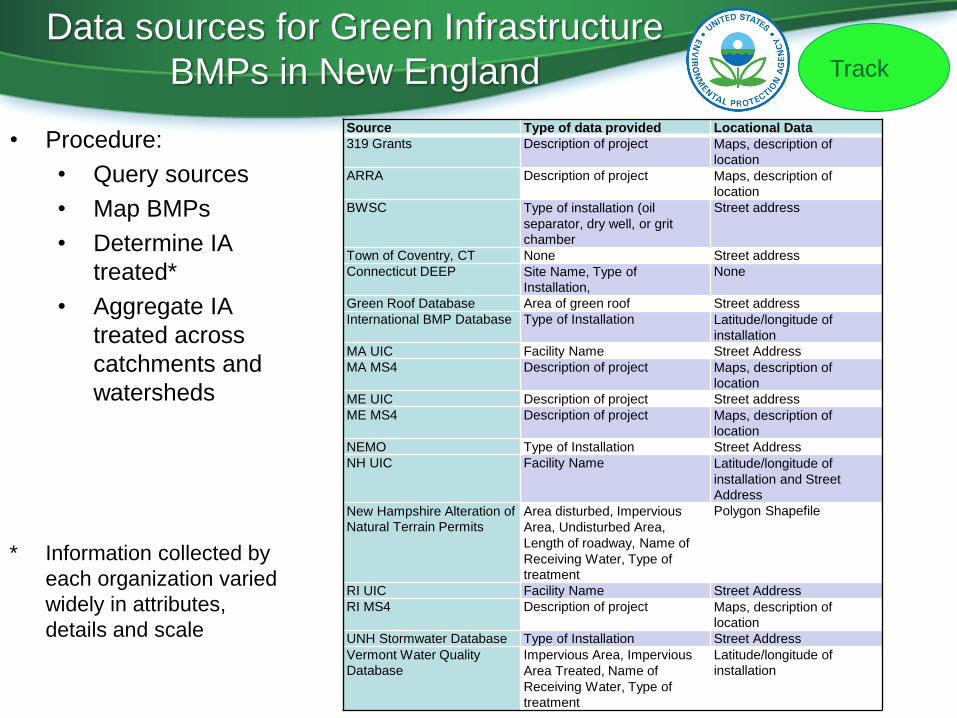
* Information collected by
each organization varied
widely in attributes,
details and scale
Data sources for Green Infrastructure
BMPs in New England
Source Type of data provided Locational Data 319 Grants Description of project Maps, description of
location ARRA Description of project Maps, description of
location BWSC Type of installation (oil
separator, dry well, or grit
chamber
Street address
Town of Coventry, CT None Street address Connecticut DEEP Site Name, Type of
Installation, None
Green Roof Database Area of green roof Street address International BMP Database Type of Installation Latitude/longitude of
installation MA UIC Facility Name Street Address MA MS4 Description of project Maps, description of
location ME UIC Description of project Street address ME MS4 Description of project Maps, description of
location NEMO Type of Installation Street Address NH UIC Facility Name Latitude/longitude of
installation and Street
Address New Hampshire Alteration of
Natural Terrain Permits Area disturbed, Impervious
Area, Undisturbed Area,
Length of roadway, Name of
Receiving Water, Type of
treatment
Polygon Shapefile
RI UIC Facility Name Street Address RI MS4 Description of project Maps, description of
location UNH Stormwater Database Type of Installation Street Address Vermont Water Quality
Database Impervious Area, Impervious
Area Treated, Name of
Receiving Water, Type of
treatment
Latitude/longitude of
installation
• Procedure:
• Query sources
• Map BMPs
• Determine IA
treated*
• Aggregate IA
treated across
catchments and
watersheds
Track
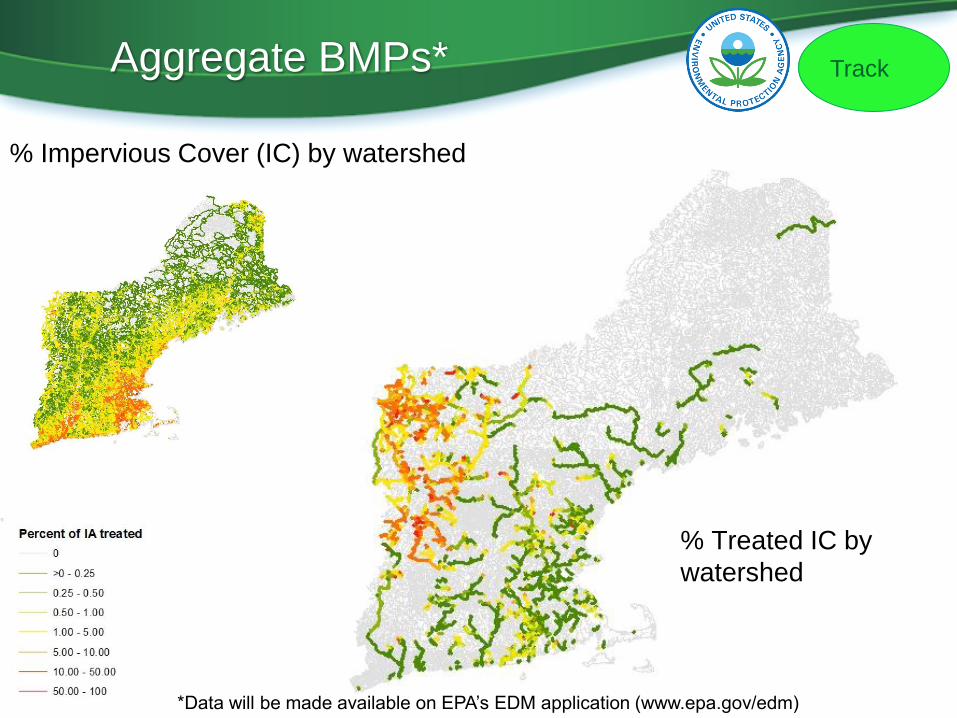
Aggregate BMPs*
% Treated IC by
watershed
% Impervious Cover (IC) by watershed
*Data will be made available on EPA’s EDM application (www.epa.gov/edm)
Track
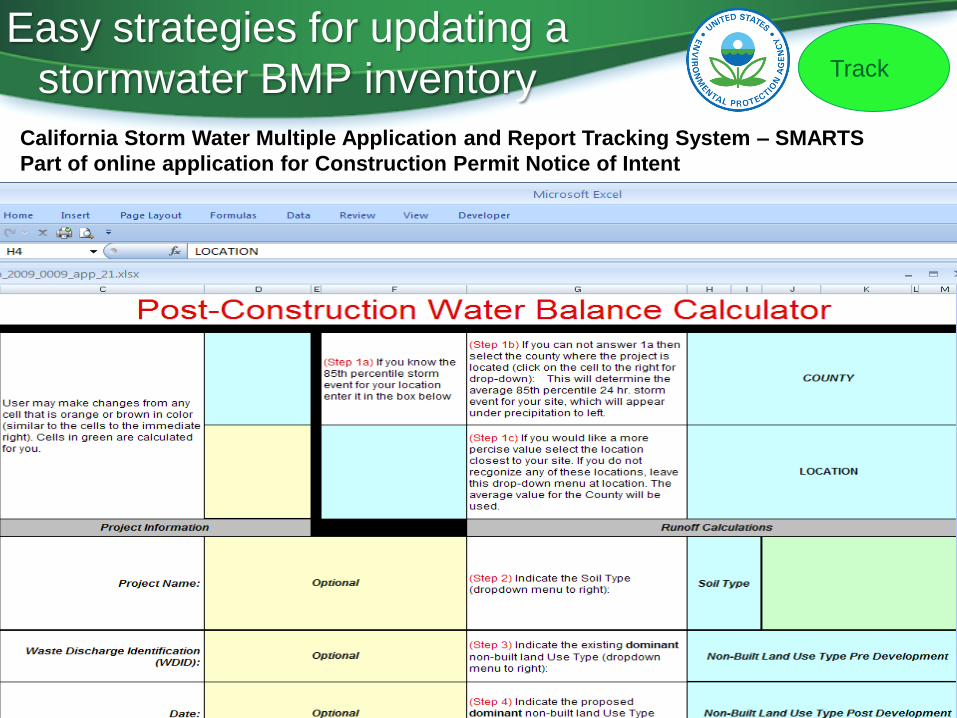
Easy strategies for updating a
stormwater BMP inventory
13
California Storm Water Multiple Application and Report Tracking System – SMARTS
Part of online application for Construction Permit Notice of Intent
https://smarts.waterboards.ca.gov/smarts/faces/SwSmartsLogin.jsp
Track
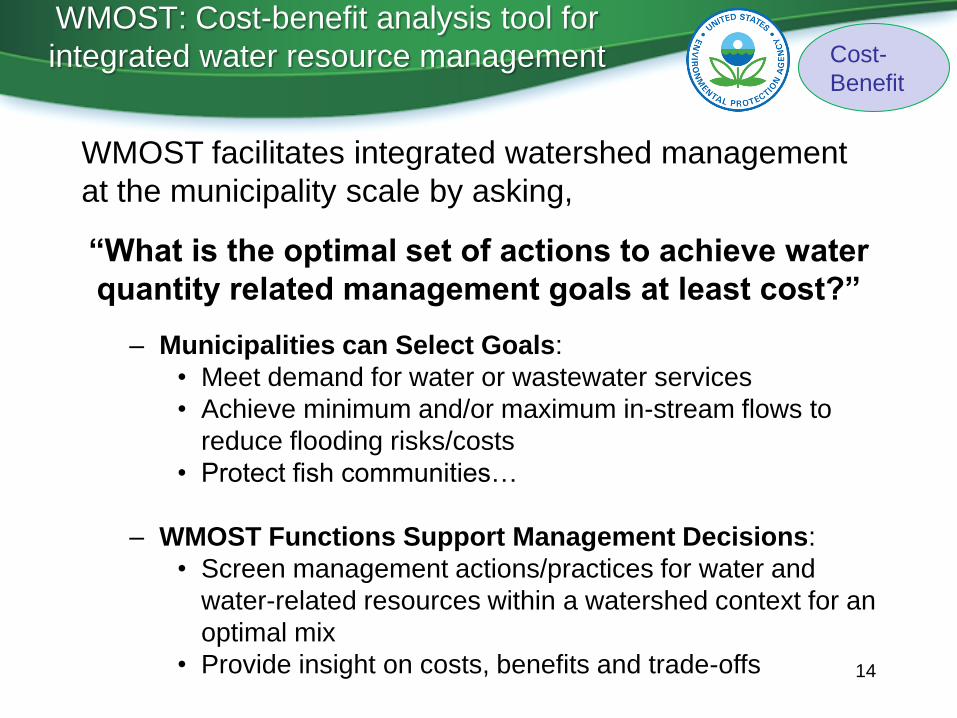
WMOST: Cost-benefit analysis tool for
integrated water resource management
WMOST facilitates integrated watershed management
at the municipality scale by asking,
“What is the optimal set of actions to achieve water
quantity related management goals at least cost?”
– Municipalities can Select Goals:
• Meet demand for water or wastewater services
• Achieve minimum and/or maximum in-stream flows to
reduce flooding risks/costs
• Protect fish communities…
– WMOST Functions Support Management Decisions:
• Screen management actions/practices for water and
water-related resources within a watershed context for an
optimal mix
• Provide insight on costs, benefits and trade-offs 14
Cost-
Benefit

WMOST Optimization Tool
Optimization Capabilities
Output Support
Desired Characteristics
Elements
Generic
Familiar, Accessible Software
Natural hydrologic cycle
Human hydrologic system
Interaction points and
processes
Management practices
Decision support system
Comprehensive & Integrated
Framework
15
Cost-
Benefit
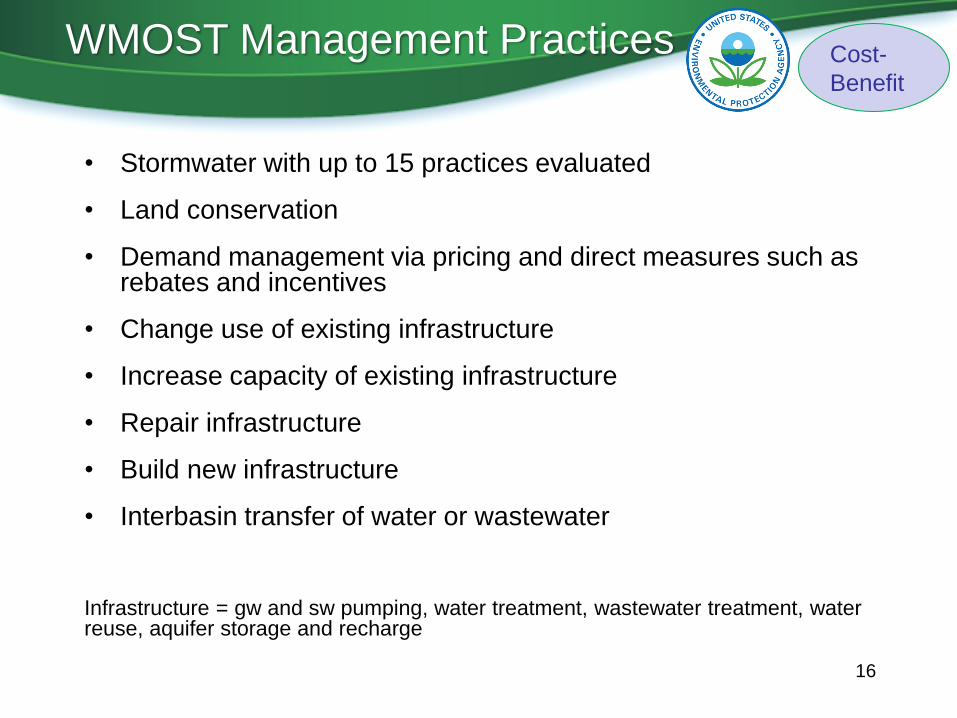
• Stormwater with up to 15 practices evaluated
• Land conservation
• Demand management via pricing and direct measures such as rebates and incentives
• Change use of existing infrastructure
• Increase capacity of existing infrastructure
• Repair infrastructure
• Build new infrastructure
• Interbasin transfer of water or wastewater
Infrastructure = gw and sw pumping, water treatment, wastewater treatment, water reuse, aquifer storage and recharge
WMOST Management Practices
16
Cost-
Benefit
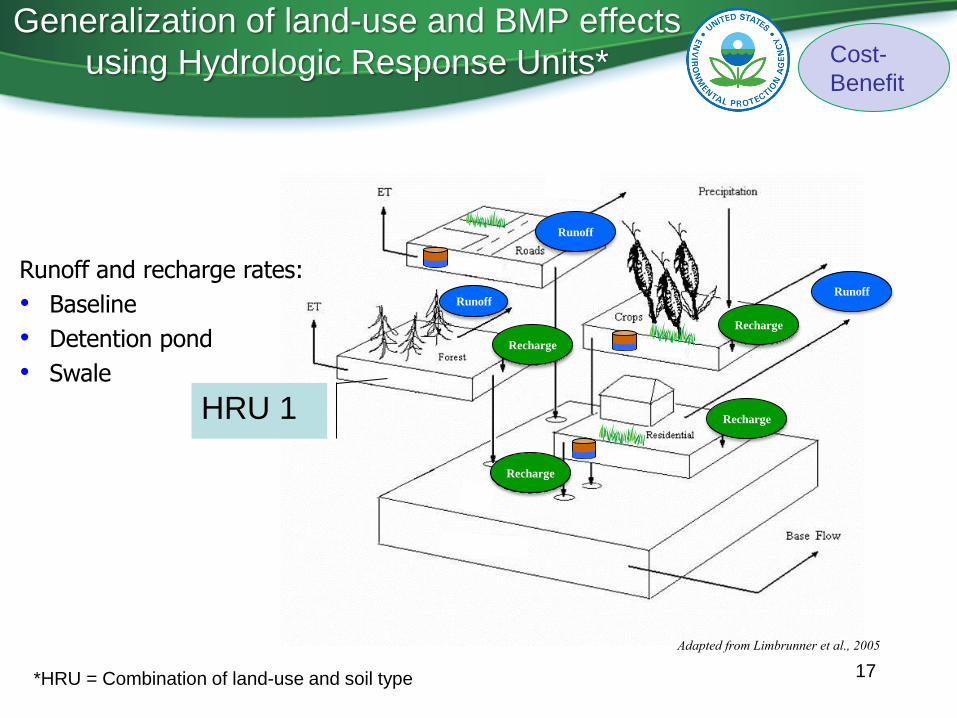
Adapted from Limbrunner et al., 2005
Recharge
Recharge
Recharge
Runoff
Recharge
Runoff
Runoff
Runoff and recharge rates:
• Baseline
• Detention pond
• Swale
Generalization of land-use and BMP effects
using Hydrologic Response Units*
HRU 1
*HRU = Combination of land-use and soil type 17
Cost-
Benefit
18
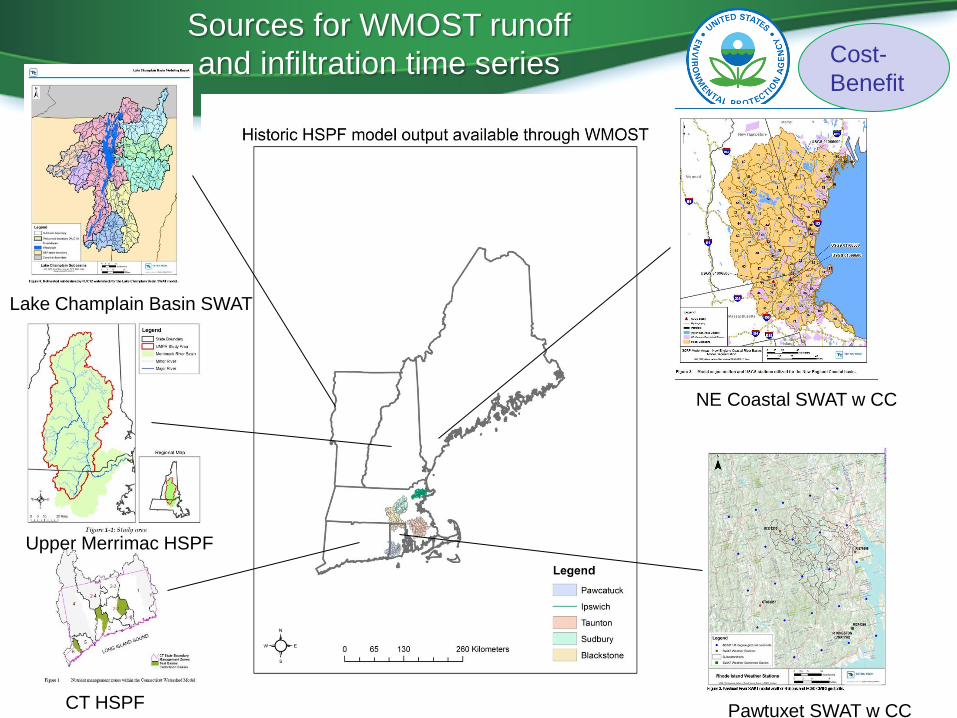
Sources for WMOST runoff
and infiltration time series
Pawtuxet SWAT w CC
NE Coastal SWAT w CC
CT HSPF
Upper Merrimac HSPF
Lake Champlain Basin SWAT
Cost-
Benefit
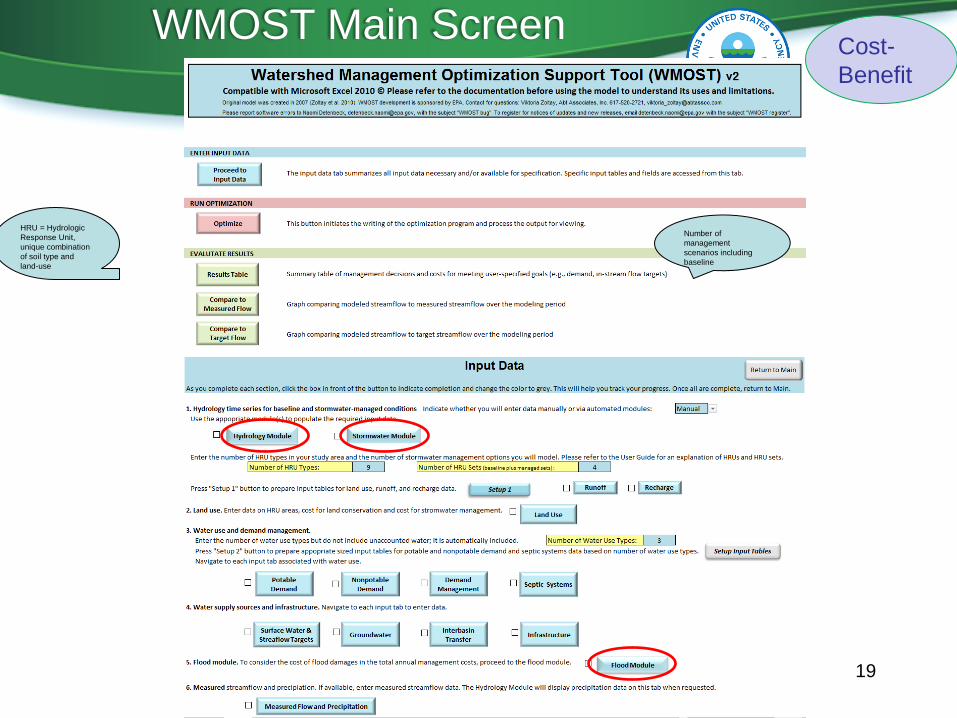
19
HRU = Hydrologic
Response Unit,
unique combination
of soil type and
land-use
Number of
management
scenarios including
baseline
WMOST Main Screen Cost-
Benefit
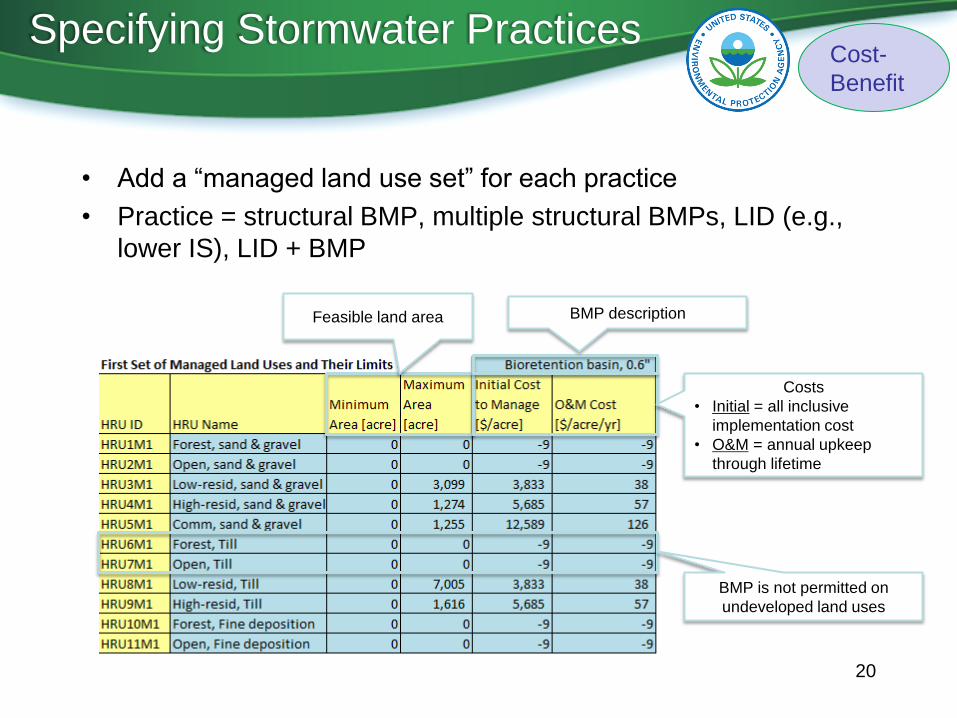
Specifying Stormwater Practices
• Add a “managed land use set” for each practice
• Practice = structural BMP, multiple structural BMPs, LID (e.g.,
lower IS), LID + BMP
Feasible land area
Costs
• Initial = all inclusive
implementation cost
• O&M = annual upkeep
through lifetime
BMP description
BMP is not permitted on
undeveloped land uses
20
Cost-
Benefit
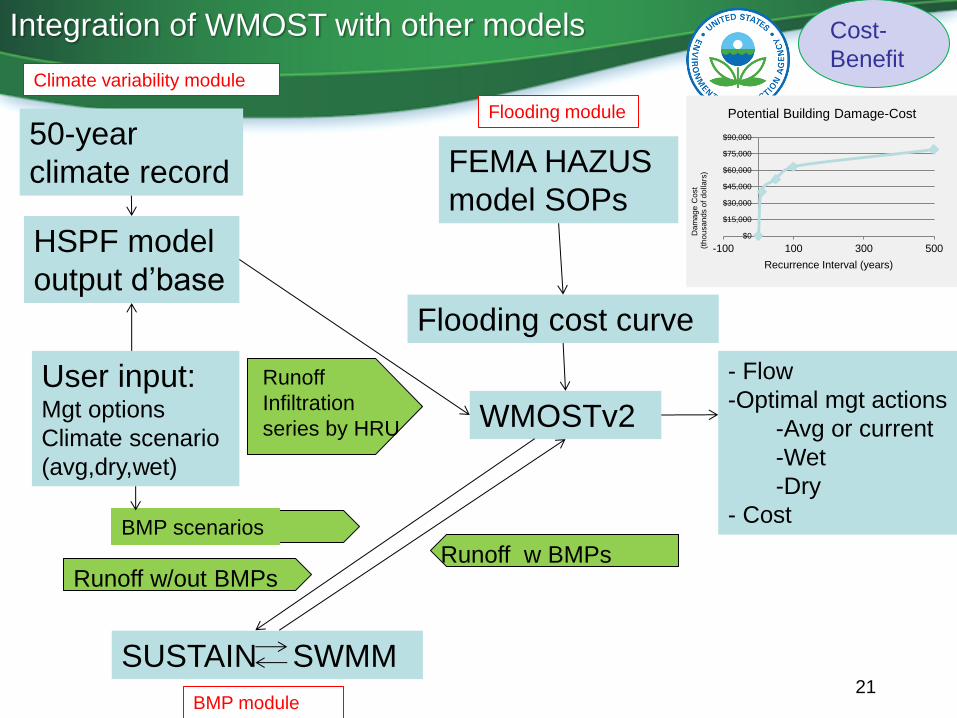
21
WMOSTv2
HSPF model
output d’base
50-year
climate record FEMA HAZUS
model SOPs
Flooding cost curve
SUSTAIN SWMM
User input: Mgt options
Climate scenario
(avg,dry,wet)
BMP scenarios
Runoff w/out BMPs Runoff w BMPs
- Flow
-Optimal mgt actions
-Avg or current
-Wet
-Dry
- Cost
Runoff
Infiltration
series by HRU
Climate variability module
Flooding module
BMP module
$0
$15,000
$30,000
$45,000
$60,000
$75,000
$90,000
-100 100 300 500
Dam
ag
e C
ost
(th
ou
sa
nd
s o
f d
olla
rs)
Recurrence Interval (years)
Potential Building Damage-Cost
Integration of WMOST with other models Cost-
Benefit
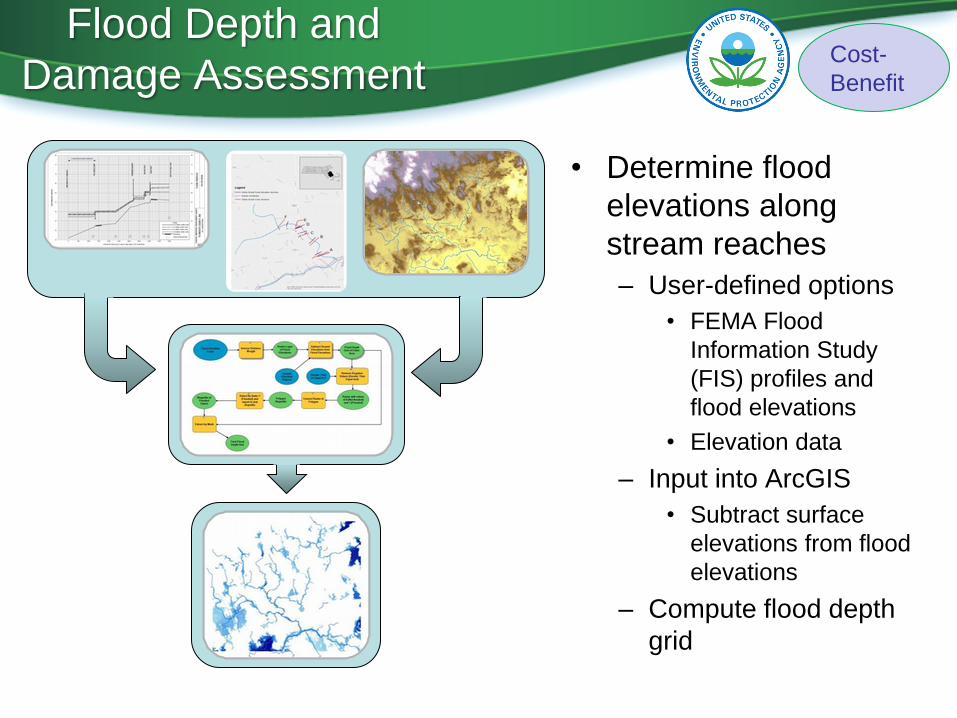
Flood Depth and
Damage Assessment
• Determine flood
elevations along
stream reaches
– User-defined options
• FEMA Flood
Information Study
(FIS) profiles and
flood elevations
• Elevation data
– Input into ArcGIS
• Subtract surface
elevations from flood
elevations
– Compute flood depth
grid
Cost-
Benefit
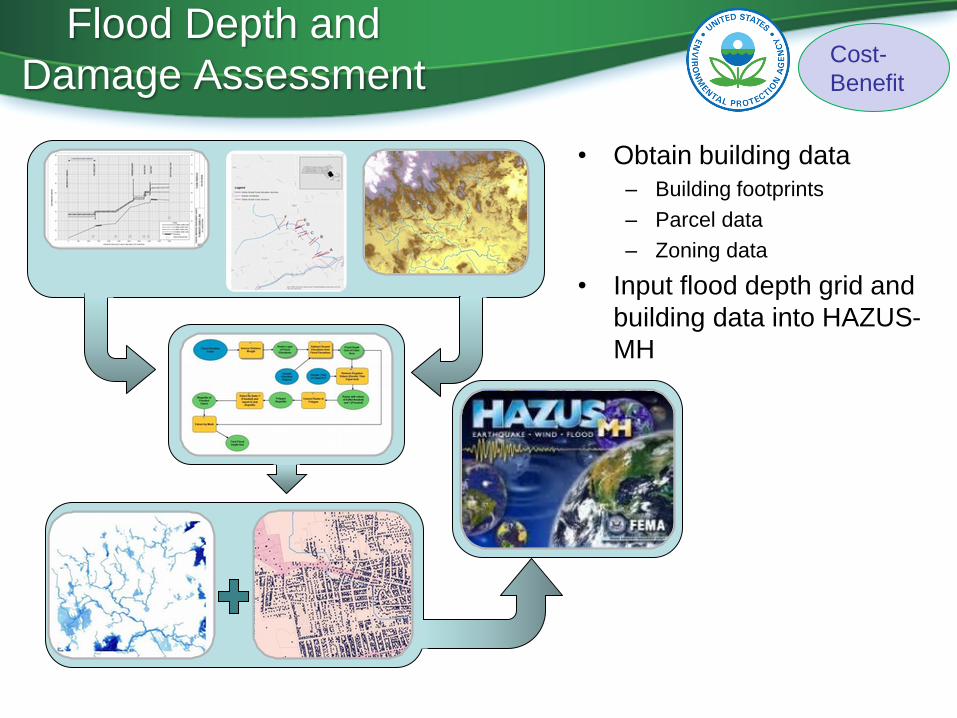
Flood Depth and
Damage Assessment
• Obtain building data
– Building footprints
– Parcel data
– Zoning data
• Input flood depth grid and
building data into HAZUS-
MH
Cost-
Benefit
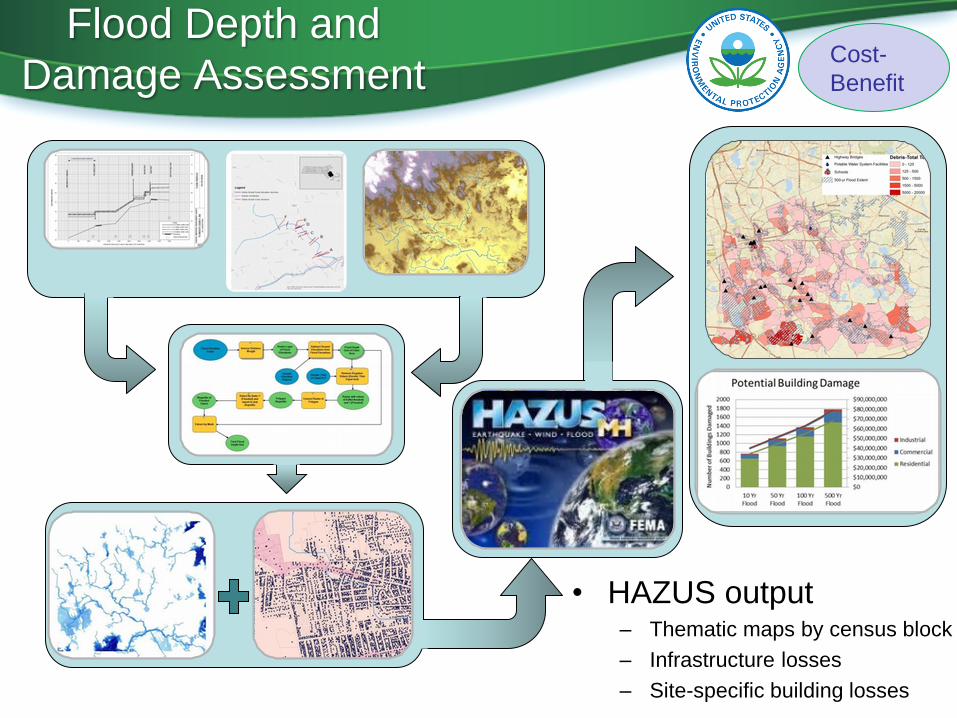
Flood Depth and
Damage Assessment
• HAZUS output – Thematic maps by census block
– Infrastructure losses
– Site-specific building losses
Cost-
Benefit

Flooding within Plymouth County, MA
Potential Building Damage
10 Year Flood
50 Year Flood
100 Year Flood
500 Year Flood
10-Year Flood Depth Grid
500-Year Flood Depth Grid 100-Year Flood Depth Grid
50-Year Flood Depth Grid
Building Count
Commercial 83
Industrial 27
Residential 657
Total
Buildings 767
Building Count
Commercial 240
Industrial 60
Residential 1476
Total
Buildings 1776
Building Count
Commercial 135
Industrial 39
Residential 937
Total
Buildings 1111
Building Count
Commercial 159
Industrial 48
Residential 1161
Total
Buildings 1368
Cost-
Benefit
26
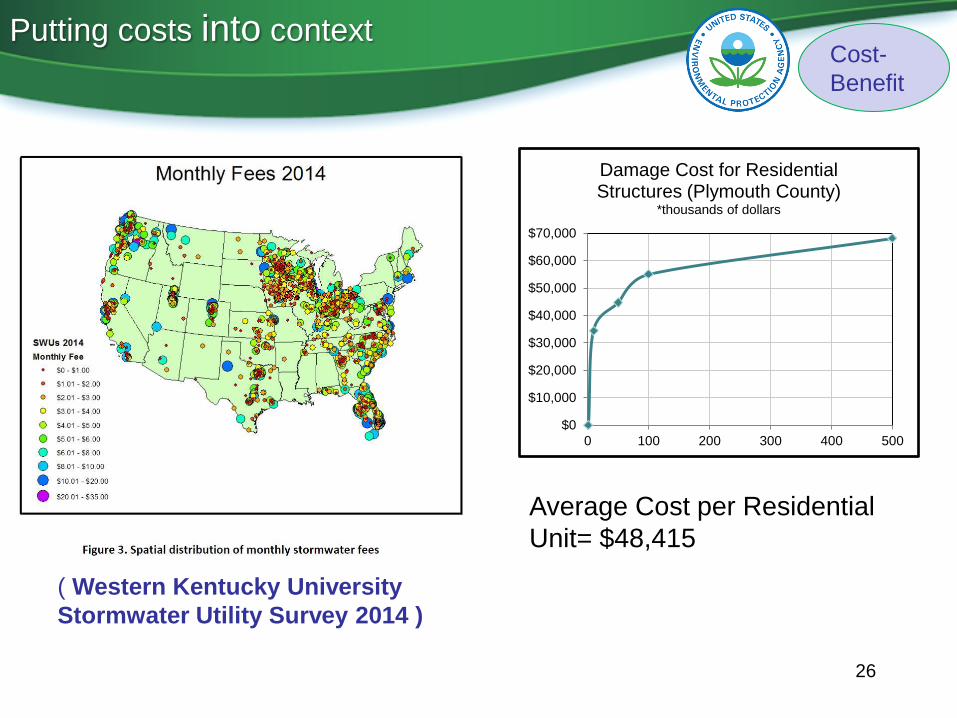
( Western Kentucky University
Stormwater Utility Survey 2014 )
$0
$10,000
$20,000
$30,000
$40,000
$50,000
$60,000
$70,000
0 100 200 300 400 500
Damage Cost for Residential Structures (Plymouth County)
*thousands of dollars
Average Cost per Residential
Unit= $48,415
Putting costs into context Cost-
Benefit

27
Quantifying benefits of green infrastructure
BMPs provides information to support
public-private partnerships
Cost-
Benefit
Demonstrations can be arranged
GeniePro Impervious Cover Analysis
EDM application data downloads
Watershed Optimization Support Tool +
HAZUS
28