gvb stormwater utility feasibility study
TRANSCRIPT

JULY, 2007
GVB
STORMWATER UTILITY FEASIBILITY STUDY
PREPARED BY RUTGERS UNIVERSITY
JULY 2007 CONFIDENTIAL

JULY, 2007
This feasibility study was prepared by:
School of Environmental & Biological Sciences
Rutgers University
Chris Obropta, Ph.D. Peter Kallin, Ph.D.
Beth Ravit, Ph.D. Katie Buckley
Rob Miskewitz, Ph.D. Richard Lathrop, Ph.D.
Caroline Phillipuk
Rutgers Environmental Law Clinic
Carter Strickland, Esq. Eric Giuliano
Business Advisory Services
Mary Ellen Cronk
Rutgers Environmental Research Clinic would like to give
special thanks to the following individuals for their
contributions and assistance in providing content, research
data and editing assistance.
NJMC Staff
Nicholas W. Agnoli, PE Dom Elefante Eric Yadlovski
Tammy Marshall
2
CONFIDENTIAL

JULY, 2007
The purpose of this Feasibility Study is to
provide the New Jersey Meadowlands
Commission (NJMC) management and staff with
information related to stormwater management
within the Meadowlands District. The study is
available to individuals on a CONFIDENTIAL
basis. Reproduction of this document in whole or
in part is illegal without expressed written
permission from the NJMC.
3
CONFIDENTIAL

JULY, 2007
4
I.I. EXECUTIVE SUMMARY EXECUTIVE SUMMARY
Since the 19th century the Hackensack River watershed has been altered as a result of
human activities. These alterations have changed the natural flow patterns of waters
moving within and through the Hackensack Meadowlands District (hereafter the
“District”). Extensive ditching, diking, and damming activities have taken place in the
District, in combination with the placement of millions of cubic yards of fill materials,
which now support an extensive impervious infrastructure. These multiple changes
have reduced functional ability of the system to absorb even low volumes of
precipitation. The inability to store, and then gradually release water during storm
events currently produces extensive flooding, both within the District and in adjacent
municipalities.
Flooding in the District causes major transportation and economic disruptions, and
these disruptions threaten the economic vitality of the District and the surrounding
region. The purpose of this study was to investigate the feasibility of addressing the
District‘s flooding issues through creation of a Stormwater Utility. The New Jersey
Meadowlands Commission (NJMC) has recently completed a hydrological engineering
analysis of the District. Using this hydrological data, in conjunction with District land
use data and a review of existing NJ statutes, Rutgers University prepared this report.
The hydrological engineering review highlights the current lack of consistent oversight
to keep the District’s stormwater infrastructure maintained. This lack of regular
maintenance has contributed to a broken or non-functional stormwater infrastructure,
including tide gates, drainage ditches, pipes, etc., that produces a system which floods
even during small storm events. These flooding problems increase dramatically during
large storm events and when storms or sea surges occur in combination with high tidal
cycles. The current estimated cost to repair the District’s damaged infrastructure is
CONFIDENTIAL

JULY, 2007
$24,177,151 dollars, a sum that is most probably beyond the financial means of the
District municipalities working on an individual basis. In addition to the infrastructure
repairs needed, many of the current flooding problems would be preventable with a
program of dedicated District-wide infrastructure maintenance and oversight.
To provide the infrastructure improvements needed in the District, to finance routine
operation, maintenance, and management of stormwater flows, and to cover the
administrative costs associated with these activities, a predictable revenue stream is
required. Generating the revenues required to accomplish these objectives is quite
probably beyond the scope of any individual District municipality. Based upon a
review of the models provided by over 400 Stormwater Utilities currently operating in
the U.S., this report describes two possible fee structure approaches that could be used
to finance a District-wide Stormwater Utility.
The primary goal in creating a fee structure is to equate the conditions found on a
property with the amount of stormwater the property generates, and to use this
relationship as the basis for any fee(s) charged. A financial analysis based upon land use
parcels within the District boundaries (15% of the total watershed) is included in this
study. A parcel analysis was also conducted for the remaining portions of four District
municipalities (8% of the total watershed) that are beyond the District boundaries
(Addendum I). Because the size of this non-District drainage area is 50% as large as the
total District drainage area, the stormwater generated in portions of the municipalities
that are outside the District boundary can have a direct effect on District flooding
events, and based on the size of this out of District drainage area, we estimate that
approximately one-third of the runoff flowing into the District during flood events may
come from non-District areas.
The specifics of setting fees and generating the revenues required to manage a District-
5
CONFIDENTIAL
JULY, 2007
wide Stormwater Utility need to be determined in conjunction with public input. Issues
raised by this feasibility study that need to be addressed through a Public stakeholder
process include determining the appropriate fee structure components for a District
Stormwater Utility, and deciding how to address stormwater generated in portions of
the District municipalities that lie outside District boundaries.
After review of the legal authority delegated to NJ municipalities, it appears that with
fairly minor modifications to the current regulations, there is legal justification for the
creation of a Stormwater Utility within the District. Based on its legislative mandate, a
Stormwater Utility could conceivably be administered by the NJMC within the
Meadowlands District. Although the NJMC is authorized to provide improvements
supported by fees or assessments within the District, the conservative course of action
would be for the Legislature to amend the current regulations to grant the NJMC
specific authority to operate a Stormwater Utility.
Given the high costs associated with addressing the District’s flooding problems, the
disruption of the District transportation infrastructure during flood events, the number
of alterations to both the watershed and the District’s natural hydrological patterns, and
the hydrologic connections between District municipalities, it would be highly desirable
to have a central authority capable of dealing with these multiple issues. A District-
wide Stormwater Utility would support the region’s economic vitality through
reduction of business interruption from avoidable flood-related downtime. Such an
authority would provide a reliable, continual funding system for identified flood
control projects, and could independently rank proposed projects based on their
importance to the economic needs of the District. A District Stormwater Utility would
be uniquely suited to provide these services, as well as to expedite interactions required
between the appropriate regulatory and permitting agencies when improving the
District’s flood-related infrastructure. A Meadowlands District-wide Stormwater
6
CONFIDENTIAL

JULY, 2007
Utility would also be able to initiate long-term strategies to deal proactively with the
stormwater and flooding issues facing the District.
7
CONFIDENTIAL

JULY, 2007
8
BBAACCKKGGRROOUUNNDD
A.A. HACKENSACK RIVER HYDROLOGICAL HISTORY HACKENSACK RIVER HYDROLOGICAL HISTORY
The Hackensack Meadowlands District (hereafter the “District”) has undergone
significant hydrological alteration and ecological degradation during the last two
hundred years. Beginning in the 19th century Dutch salt hay farmers began ditching and
diking portions of the vast salt marshes in the New Jersey Meadowlands to “reclaim”
land for the purpose of growing flax, grain, and vegetables (Quinn 1997). The Paterson-
Hudson Railroad, the first railroad linking New York and New Jersey, was built
through the middle of the Meadowlands marshes in 1832. Other railroads and
roadways followed, all being built on elevated beds with little or no consideration of
how these beds disrupted natural hydrologic flows, or fragmented the floodplain and
marsh ecosystems. Construction of the Oradell Dam, 22 miles upriver of Newark Bay
in the early 20th century, resulted in diversion of virtually the entire freshwater flow of
the Hackensack River (USACE 2004). Currently rising sea levels, combined with
construction of the reservoir system in the northern upper reaches of the Hackensack
River has shifted the estuary from a basically freshwater tidal ecosystem to a brackish
tidal system.
The filling and diking of salt marshes accelerated in the 20th century when the Mosquito
Control Commissions were created by the New Jersey General Health Act. By 1906
these Commissions had authorized the New Jersey State Agricultural Experiment
Station to develop drainage plans and specialized ditching tractors to reclaim the State’s
marshlands. Between 1904 and 1945 the Bergen County Mosquito Control Commission
installed one million feet of drainage ditches through salt marshes and another 500,000
feet of upland ditches (USACE 2004).
In 1928 the Meadowlands Reclamation Commission was appointed by the New Jersey
CONFIDENTIAL
JULY, 2007
State Legislature. This Commission worked with the Bergen County Chamber of
Commerce to develop a plan to “reclaim” 30,360 acres of Meadowlands marshes for
industrial development through the addition of 172 million cubic yards of fill. Over the
next half-century large tracts of the Hackensack Meadowlands were filled with
household and municipal waste, dredge spoils, and other fill materials. Industrial and
residential development took place on this “reclaimed” low-lying land, as well as on the
higher ground in the surrounding Hackensack River watershed. As a result, the
Hackensack River watershed became more impermeable, producing greater volumes of
water running off more rapidly, at a time when the vast flood storage capacity of the
Hackensack Meadowlands was simultaneously being eliminated. Bulkheads were built
along the banks of the river and its tributaries, preventing water from easily spilling
onto the flood plains. The inevitable result of these multiple alterations was increased
flooding within the District.
The District is located within the lower drainage area of the Hackensack River, which
flows into the northern end of Newark Bay. The Hackensack Meadowlands drain an
area of approximately 193 square miles (522 square kilometers), which includes the
Hackensack River, Overpeck Creek, numerous smaller tributaries, as well as direct
runoff from the basin (USFWS 1997). The District includes both tidal and adjacent
palustrine wetlands and the uplands adjacent to these water bodies. Wetland elevations
within the District range from sea level to about 10 feet (3 meters) above sea level, and
average District tidal range (NAVD88) is from –3 ft. at mean low water (MLW) to +2 ft.
or more at mean high water (MHW); storm surges in the District can reach 6 ft. or
higher (Meadowlands Floodplain Management Plan 2005).
9
B.B. THE MEADOWLANDS DISTRICT THE MEADOWLANDS DISTRICT
The thirty-two square mile Hackensack Meadowlands District was created by the New
CONFIDENTIAL

JULY, 2007
Jersey State legislature as a special planning region in 1969, and the District is managed
by the New Jersey Meadowlands Commission (hereafter the “NJMC”). The District
encompasses portions of two counties, Bergen and Hudson, and is composed of either
all, or a part of, fourteen separate municipalities (Carlstadt, East Rutherford, Jersey City,
Kearny, Little Ferry, Lyndhurst, Moonachie, North Arlington, North Bergen, Ridgefield,
Rutherford, Secaucus, South Hackensack, Teterboro). At the time of the District’s
formation, the NJMC had three mandates: 1) to promote orderly development; 2) to
manage solid waste; and 3) to preserve ecological balance. These considerations drove
development in the District for over thirty years.
The District today is situated at the heart of the urban industrialized center of the New
York/New Jersey metropolitan region. The location of the District and the extreme
degree of surrounding urbanization produce high levels of human activity related to
commercial, industrial, residential, and transportation needs and interests. In spite of
this high degree of urban activity, the District contains over 8,000 acres of tidal
wetlands, which provide habitat for over 260 bird and 39 fish species (USACE 2004,
NJMC Fish Resource Inventory 2005, respectively). The District also contains three
superfund sites (USACE 2004 and references therein). Industrial discharges (61), power
generating plants (3), sewage treatment plants (3), combined sewer overflows (29), an
active (1) and inactive (26) landfills located within the District contribute to District-
wide water quality and quantity disturbances (WMA5 2006).
The historical alterations in the natural hydrologic patterns within the Hackensack
River estuary have affected the ecosystem’s functional ability to store and gradually
release water inputs during storm events. The District’s low lying elevations, the
extensive presence of historic fill material coupled with extensive changes to the basin’s
natural hydrology and the high degree of urbanization, have resulted in an inability to
10
CONFIDENTIAL

JULY, 2007
absorb even low volumes of precipitation. This means that many locations in the
District regularly experience significant flooding events (Figs. 1 & 2). These events
disrupt, and in some cases halt, business activities within the District and the
surrounding urban areas, as well as passage on major transportation corridors.
Stormwater negatively affects District residents, due to both residential flooding and
through the discharges into the Hackensack River of untreated sewage from outdated
combined sewer overflow (CSO) wastewater systems.
11
Fig. 2. Flood event in Moonachie NJ, March 2007.
Fig. 1. Flood event on Rt. 7 in Kearny NJ, July 2006.
Stormwater management infrastructure within the District currently includes dry
detention basins, vegetated channels, drainage ditches, stormwater sewers, levees,
pump stations, and tide gates. These structures vary in age, states of repair and
functionality. In many District sub-watersheds these devices have not been properly
serviced, resulting in predictable flooding events (Meadowlands Floodplain
Management Plan 2005). The system as it is currently structured and maintained cannot
prevent serious flooding, which occurs at government (Fig. 3), industrial, and
commercial buildings (Fig. 4), residences, on major highway connectors (Meadowlands
Parkway, Rt. 7, Secaucus Rd.), and in recreational areas (Meadowlands Floodplain
CONFIDENTIAL

JULY, 2007
Management Plan 2005).
To deal with these local flooding issues, a number of tide gates and pump stations have
been installed in a piecemeal fashion by various agencies and organizations. As of 2006,
there were 34 water control structures in place within the boundaries of the District, and
these structures were in varying states of functionality. In the recently completed
NJMC assessment, just over half of these systems (19 of 34) were found to be “fully
functional” (NJMC 2006).
Fig. 3. Moonachie NJ, DPW, March 2007 Fig. 4. Moonachie NJ, March 2007
12
C.. CURRENT FLOOD ISSUES WITHIN THE NJ MEADOWLANDS DISTRICT TRICTC CURRENT FLOOD ISSUES WITHIN THE NJ MEADOWLANDS DIS
The District suffers from both regional and local flooding. According to the Federal
Emergency Management Agency (FEMA) Flood Insurance Study for Bergen County
(2005), major flooding can occur during any season of the year, although the worst
storms tend to occur during the late summer and early fall, typically the hurricane and
tropical storm season. According to the U.S. Army Corps of Engineers, the storm surge
from a Category I hurricane could flood 80-90% of the land area within the District
(USACE Philadelphia 2005). Until the nor’easter of April 2007, the previous flood of
record for the Hackensack River occurred September 16, 1999 during Hurricane Floyd,
CONFIDENTIAL
JULY, 2007
which had been downgraded to a Tropical Storm by the time it reached New Jersey.
There are significant areas within the Meadowlands District that are chronically flooded
by nor’easter storms or large thunderstorms. From 1980 to 1998, the New Jersey coast
has been affected by 12 major nor’easters. A comparison of these storm events with
storms of previous decades shows an increase in storm frequency and intensity since
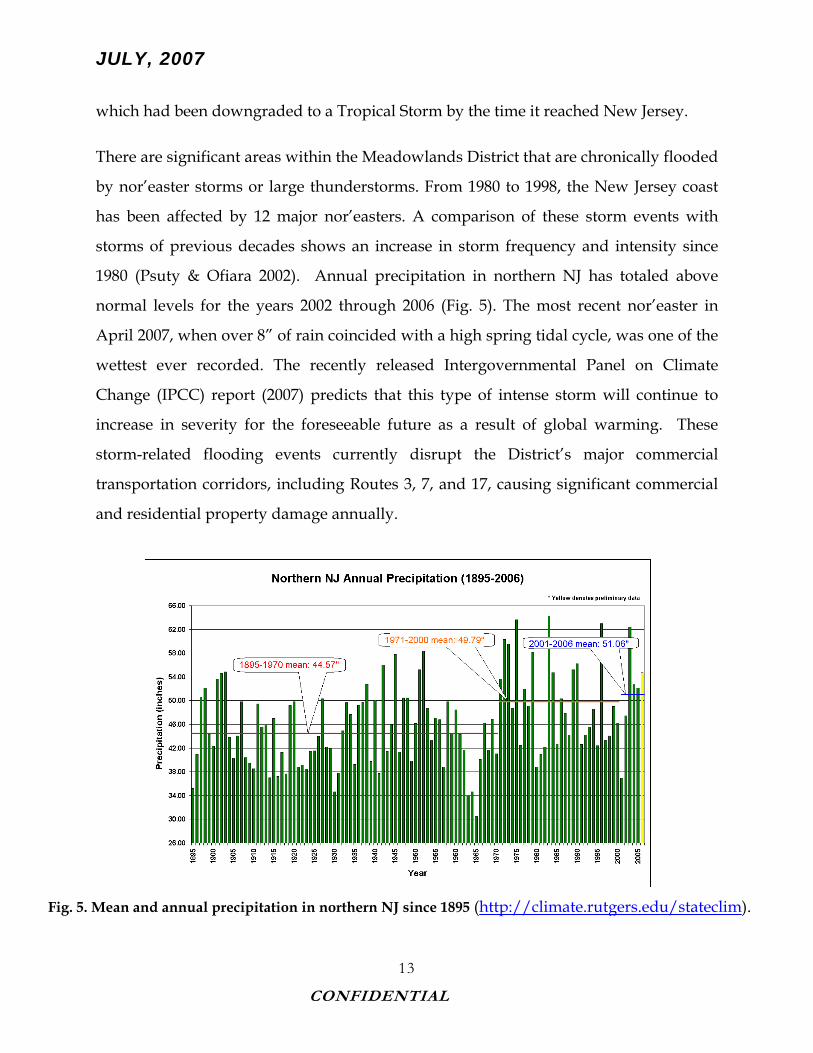
1980 (Psuty & Ofiara 2002). Annual precipitation in northern NJ has totaled above
normal levels for the years 2002 through 2006 (Fig. 5). The most recent nor’easter in
April 2007, when over 8” of rain coincided with a high spring tidal cycle, was one of the
wettest ever recorded. The recently released Intergovernmental Panel on Climate
Change (IPCC) report (2007) predicts that this type of intense storm will continue to
increase in severity for the foreseeable future as a result of global warming. These
storm-related flooding events currently disrupt the District’s major commercial
transportation corridors, including Routes 3, 7, and 17, causing significant commercial
and residential property damage annually.
13
Fig. 5. Mean and annual precipitation in northern NJ since 1895 (http://climate.rutgers.edu/stateclim).
CONFIDENTIAL

JULY, 2007
Most of the District lies within the 100-year flood plain as mapped by FEMA (reference:
FEMA maps Appendix 1). The NJMC recently completed an in-depth study using
FEMA guidelines, and has developed a Floodplain Management Plan that identifies
thirty specific areas within the District where localized flooding occurs (NJMC 2005).
These areas include commercial, residential, and municipal properties, as well as
County and State roadways served by both public and private stormwater
infrastructure.
The NJMC study found that much of the District’s infrastructure is in poor condition
and is not being maintained or serviced on a regular basis. Based on measurements and
modeling conducted by the U.S. Army Corps of Engineers as part of their Hackensack
Meadowlands Project, the major sources that contribute to regional flooding are tidal
flows entering the Hackensack River from Newark Bay and, to a lesser degree,
freshwater flows from the Hackensack River watershed. Because of the very high
proportion of impervious cover in the majority of the Meadowlands region and the
shallow groundwater table, relatively little rainfall infiltrates, so virtually all
precipitation becomes surface runoff. The high groundwater table also affects the
capacity and functionality of both water quantity and water control systems District-
wide. When the storm surge from a major storm coincides with the high tidal cycle,
major District flooding results.
1. CONTRIBUTING FACTORS Under low volume storm conditions the Oradell Dam mitigates the contribution from
the upper reaches of the watershed to flooding in the lower Hackensack estuary, but
when the reservoir is full the dam can overtop. This has occurred at least 5 times since
1972 (NJMC 2005). Generally, the flooding from the upper Hackensack via the Oradell
14
CONFIDENTIAL

JULY, 2007
Reservoir lags the local flood peaks below the dam.
While the primary contributors to regional flooding are major storms and their
backwater tidal effects, localized flooding frequently occurs during smaller storms. This
flooding is due to either the inability of the local stormwater infrastructure systems to
transport stormwater flows as a result of sedimentation or other blockages, or is related
to tidal effects (discussed below). In the chronically flooded areas identified by the
Meadowlands Floodplain Management Plan (NJMC 2005) blockage of catch basins,
ditches filled with vegetation or debris, and sedimentation of sewer pipes were found to
be the major factors contributing to flooding in virtually every location.
Tidal Influences
The tidal regime of the Hackensack River has a significant effect on the severity of
flooding within the District. Major storms that generate a storm surge, which coincides
with a high tide(s) cause the most damage. Storms that last over multiple tidal cycles
are especially harmful since they can produce several flood stages, which affect large
areas.
Even smaller storms that in themselves do not generate a storm surge can cause
flooding that is tidally dependant. Because so much of the District land area is only a
few feet above sea level, many of the storm sewers that drain these low areas are barely
above sea level and are equipped with tide gates that control the discharge from the
pipes. If a significant runoff event such as an intense summer thunderstorm happens to
occur near high tide, the sewers may simply be unable to drain until the tide recedes
and there is positive head between the flood levels and the invert of the stormwater
sewers. This tidal backwater effect can be present even with completely functional tide
gates. If the tide gates are malfunctioning or blocked the flooding problems are
exacerbated and may persist over multiple tide cycles.
15
CONFIDENTIAL
JULY, 2007
16
DD.. SSTTOORRMMWWAATTEERR MMAANNAAGGEEMMEENNTT WWIITTHHIINN TTHHEE NNJJ MMEEAADDOOWWLLAANNDDSS DDIISSTTRRIICCTT
1. Stormwater Management To address flooding related problems such as those experienced in the Meadowlands
District, many communities across the country have considered the option of forming a
utility specifically for the purpose of managing their stormwater. Although the concept
of a “Stormwater Utility” was first proposed in the 1970s it is within the last ten years
that the growth of such utilities, with a specific mandate to manage stormwater, has
increased rapidly. These utilities perform various services, which may include
overseeing the collection, treatment, and disposal of stormwater, and in some cases,
assuming the responsibility for maintenance of the stormwater collection systems.
These Stormwater Utilities are typically funded through a dedicated revenue stream.
As of May 2005 there were over 400 utilities operating throughout the U.S. to manage
stormwater flows, but to date, no municipality or county within New Jersey has created
such a utility (NJDEP 2005).
Municipal stormwater discharges are regulated as point sources under the Clean Water
Act (1972). However, control of stormwater is often extremely difficult in urban
environments such as the Meadowlands District. Uncontrolled stormwater flows pose a
danger to both constructed and natural environments, and the collection and rapid
routing of water through urban stormwater infrastructure results in problems related to
both water quantity and quality. The difficulties encountered in managing urban
stormwater are due to both the large volumes of stormwater generated, as well as the
physical space constraints.
Municipal surface water runoff in urban areas is typically collected in storm sewer
systems and conveyed to the nearest receiving water body. The volume of the runoff,
the rate of flow, and the quality of the runoff are determined by the amount of the
CONFIDENTIAL

JULY, 2007
watershed’s impervious surface, modifications of the original landscape, and the
natural drainage patterns and topography within a drainage basin. Older storm sewer
systems were designed to rapidly route stormwater out of developed areas to the
discharge point. As previously undeveloped land is transformed with impervious
covers such as blacktop, rooftop, and concrete the volume of stormwater runoff
increases.
While original stormwater systems were built to efficiently move water downstream,
today’s modern approach views stormwater as an important component in the
management of integrated urban water resources. Current strategies are multi-
dimensional, and consider both water quantity and quality issues, multiple-use
facilities, riparian corridors, wetland preservation and creation, and groundwater
recharge (NSFMA 2006). In forward-looking communities stormwater is considered a
resource, and the management of stormwater is viewed as an important function of
local government, on a par with oversight of the drinking water supply and sewage
treatment operations.
Today stormwater management includes planning, design, construction, operation, and
maintenance of specific water control structures and dedicated financial resources
required to support these activities. The benefits of successful stormwater management
include handling of excess drainage, protection of transportation systems, protecting
property values, reduction of the damage caused by flooding, providing long term
system maintenance, and environmental enhancement (NSFMA 2006). However, the
costs of construction, operation, and maintenance of flood control measures is
typically beyond the financial resources available to individual property owners, and
in many cases, individual municipalities.
17
CONFIDENTIAL

JULY, 2007
2. STORMWATER UTILITY FEASIBILITY STUDY
In July 2006 the NJMC entered into a Memorandum of Understanding with the School
of Environmental & Biological Sciences, Rutgers University to determine the feasibility
of establishing a Stormwater Utility to address the issues related to flooding within the
Meadowlands District. The NJMC has acquired a significant data set, which describes
flooding events, District infrastructure, CSO discharges, and District land use. The
purpose of this study was to analyze the existing data sets to evaluate whether a
Stormwater Utility could be beneficial in managing District storm waters to alleviate
flooding. We were also asked to provide recommendations to the NJMC with respect to
implementation issues, and to comment on the legality of establishing a Stormwater
Utility given the current regulations governing the Meadowlands District.
This feasibility analysis includes a Hydrological and Engineering Assessment, which
evaluates the existing District infrastructure and the infrastructure maintenance issues.
Based on the engineering assessment and recommendations, a financial analysis was
conducted. This analysis discusses various financial options to support the maintenance
of the stormwater management infrastructure. A legal review of existing regulations
related to stormwater utilities, and recommendations for NJ regulatory changes with
respect to stormwater management in the Meadowlands District complete this
feasibility study.
18
CONFIDENTIAL
JULY, 2007
III. ENGINEERING ANALYSIS
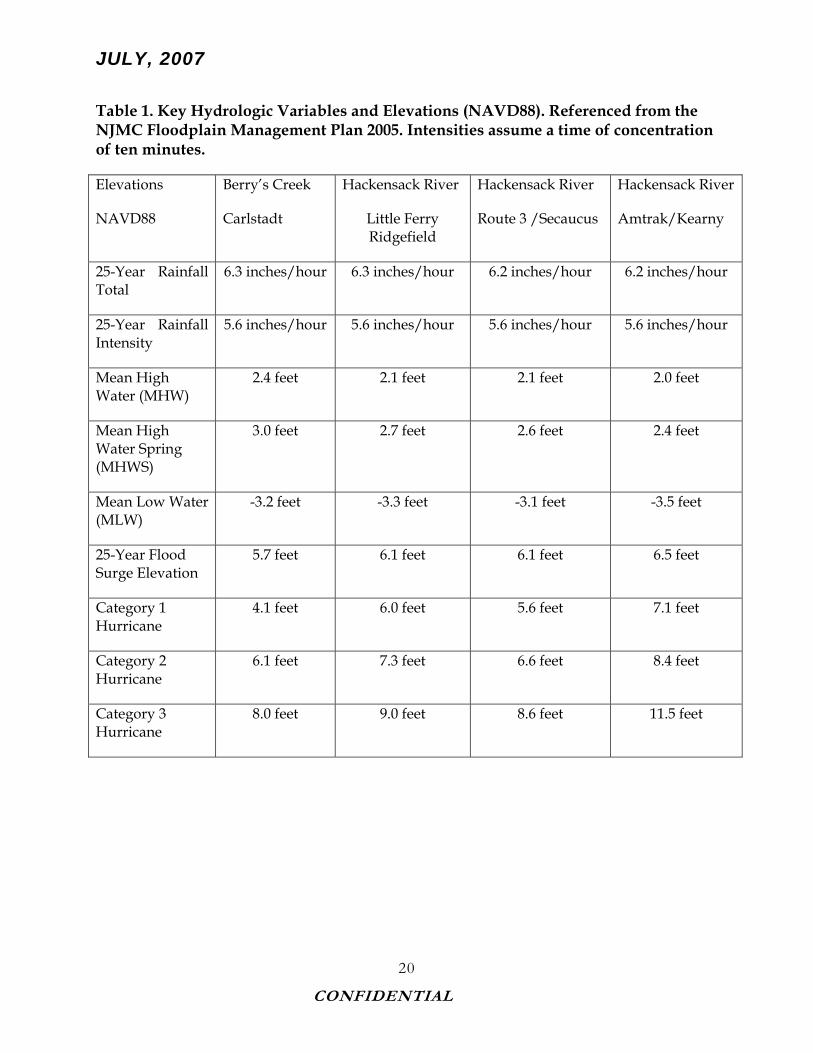
The magnitude of the potential flooding problems faced by the District is illustrated in
Table 1. While the Mean High Water Spring (MHWS) varies a bit with distance from
Newark Bay, the Meadowlands District MHWS is in the range of 2.4 to 3.0 feet above
sea level (NAVD88). It should be noted that spring tides occur at least twice each month
just before the new and full moons, so are a common occurrence. With a storm surge
from a 25-year storm (the storm with a 4% probability of occurring in any given year),
flood levels can reach 5.7 to 6.5 feet. According to the FEMA maps for the District
(FEMA Firm Panels, Appendix 1), the 100-yr flood (the storm with a 1% probability of
occurring in any give year) has an elevation in the range of 8-9 feet.
It is important to recognize that over time these basic hydrologic variables will change.
Recent studies predicting the effects of climate change on sea levels along the New
Jersey Coast (Cooper et al. 2005) estimate that by the end of this century sea level is
likely to rise between 0.31 and 1.10 meters (1.02 - 3.63 ft). Shorter-term predictions
estimate a 25 cm (10 in) rise in sea level by the 2020s (Columbia University 2007). This
sea level rise has the potential to transform the daily high tide levels in the
Meadowlands to the equivalent of today’s 25-year storm (see discussion of Sea Level
Rise Addendum 2). The effects of climate change on the hydrology of the District
should clearly be studied further. If today’s 25-year storm surge becomes a daily
occurrence, the creation of a regional utility with the resources to proactively manage
stormwater flows in the District will be of critical importance.
19
CONFIDENTIAL
JULY, 2007
Table 1. Key Hydrologic Variables and Elevations (NAVD88). Referenced from the NJMC Floodplain Management Plan 2005. Intensities assume a time of concentration of ten minutes.
Elevations
NAVD88
Berry’s Creek
Carlstadt
Hackensack River
Little Ferry Ridgefield
Hackensack River
Route 3 /Secaucus
Hackensack River
Amtrak/Kearny
25-Year Rainfall Total
6.3 inches/hour 6.3 inches/hour 6.2 inches/hour 6.2 inches/hour
25-Year Rainfall Intensity
5.6 inches/hour 5.6 inches/hour 5.6 inches/hour 5.6 inches/hour
Mean High Water (MHW)
2.4 feet 2.1 feet 2.1 feet 2.0 feet
Mean High Water Spring (MHWS)
3.0 feet 2.7 feet 2.6 feet 2.4 feet
Mean Low Water (MLW)
-3.2 feet -3.3 feet -3.1 feet -3.5 feet
25-Year Flood Surge Elevation
5.7 feet 6.1 feet 6.1 feet 6.5 feet
Category 1 Hurricane
4.1 feet 6.0 feet 5.6 feet 7.1 feet
Category 2 Hurricane
6.1 feet 7.3 feet 6.6 feet 8.4 feet
Category 3 Hurricane
8.0 feet 9.0 feet 8.6 feet 11.5 feet
20
CONFIDENTIAL

JULY, 2007
21
A.A. SUMMARY OF CURRENT DISTRICT FLOOD WATER CONTROLS SUMMARY OF CURRENT DISTRICT FLOOD WATER CONTROLS
During the preparation of the Floodplain Management Plan the NJMC, in conjunction
with the various municipal public works officials, inspected almost all the current
floodwater controls within the District and prepared a comprehensive report on
existing conditions (NJMC 2006). A few, mostly privately owned structures, could not
be inspected due to restricted site access. The 34 flood control structures within the
District that were inspected include 25 tide gates and 9 pump stations. Of these, just
over half (14 of 25 tide gates and 5 of 9 pump stations were assessed as fully functional
(Fig. 6). Some of the structures (7 tide gates, 2 pump stations) were functional with
restrictions but 4 tide gates and 2 pump stations were assessed as “non-functional,” 5
tide gates and 2 pump stations were identified as needing immediate repair or
replacement, and 6 additional tide gates and 2 pump stations were assessed as
requiring repair. All flood control structures require ongoing inspections and routine
maintenance to ensure proper functioning. Appendix 1 contains a summary reproduced
from the Tide Gate Inspection Report (Pg 6-9 of Section 3) that contains additional
information. Repair of the highest priority item, the Rutherford Tide Gates, is currently
underway by the U.S. Army Corps of Engineers (USACE).
B.B. DISTRICT STORMWATER INFRASTRUCTURE MANAGEMENT DISTRICT STORMWATER INFRASTRUCTURE MANAGEMENT
The NJMC owns none of the District’s stormwater infrastructure, and currently has no
regulatory responsibility for either the stormwater infrastructure maintenance or for
management of the District’s stormwater. Infrastructure associated with State and
Federal highways is owned and maintained by the New Jersey Department of
Transportation (NJDOT). Similarly, infrastructure associated with county roadways
(storm sewers and catch basins) is owned by either Bergen or Hudson County. Hudson
County maintains their infrastructure, while Bergen County relies on the individual
CONFIDENTIAL

JULY, 2007
22
Fig. 6. Water control structures within the New Jersey Meadowlands District (NJMC 2006).
CONFIDENTIAL

JULY, 2007
municipalities within the county for infrastructure maintenance. The fourteen
individual District municipalities own and maintain the stormwater infrastructure
associated with municipal roadways and sidewalks. Infrastructure such as detention
basins or catch basins located on private property is owned and maintained by the
individual property owners.
C. CURRENT STORMWATER MANAGEMENT ACTIVITIESS CURRENT STORMWATER MANAGEMENT ACTIVITIEAlthough not charged with responsibility for District stormwater management or
infrastructure maintenance, the NJMC is currently responding to flooding emergencies
through preparation of detailed reports describing the flooding events that are
occurring within the District. The NJMC is also undertaking small- and medium-scale
interim repairs and clean-outs, while aggressively pursuing a program to complete the
needed repairs and clean outs of the District’s water control infrastructure. The
Commission is also coordinating the interagency response (see below) to infrastructure
issues raised in the FEMA Floodplain Management Study (2005).
A number of stormwater management activities throughout the District are being
undertaken by both the NJMC and the various District municipalities and counties. The
NJMC has recently completed a comprehensive Floodplain Management Plan in
accordance with FEMA guidelines (NJMC 2005). To produce the District Plan a
committee was formed with representatives from the 14 District municipalities and an
interagency committee comprised of representatives from 16 different regulators and
agencies involved in flood control. This group worked with the various municipalities
and the general public to assess flooding issues within the District and to develop and
prioritize the action plan for implementation. As part of this process, the NJMC
developed a database for recording and investigating flood incidents. This database is
23
CONFIDENTIAL

JULY, 2007
maintained by the NJMC in order to identify new areas that are flooding, as well as to
provide documentation for future grant or loan applications. The NJMC has also
integrated floodplain management into their master planning process, and the changes
proposed by the NJMC to help mitigate flood hazards have been approved and are now
incorporated into the Meadowlands Zoning Regulations.
The major goals of the Floodplain Management Plan are listed below. Additional
information can be found in the Plan itself (NJMC 2005, Appendix 1, and available
online at www.rerc.rutgers.edu/Stormwater Management/Publications):
1. Restore, replace, or decommission the 34 regional tide gate, levee, and pump stations within the District.
2. Prepare the permitting necessary for the cleanout of the Asia Place, Gotham Parkway, and Barell Avenue stormwater drainage systems.
3. Address each of the affected watersheds that are not improved by the above actions in accordance with the priority score developed in Section 6 of the Plan.
4. Update the New Jersey Hurricane Evacuation Study’s Storm Surge Map of the District in coordination with USACE, Philadelphia District.
5. Develop and implement a District Flood Hazard Warning System that utilizes both real-time rainfall and stream elevation data collection systems deployed by the NJMC in the District, as well as real-time systems upstream of the District.
6. Assemble the Floodplain Management Plan and Interagency Committees on a quarterly basis.
7. Assume responsibility from the NJDEP for approving Stream Encroachment Permits for flood control projects within the District in non-tidal (tide separated) waters.
8. Continue to provide data to the Committees and the general public via the NJMC website.
24
CONFIDENTIAL

JULY, 2007
CONFIDENTIAL
25
In order to begin the process of implementing the first goal of the Floodplain
Management Plan, the NJMC evaluated the functionality of all the tide gates and pump
stations within the District, developed maintenance recommendations, and prepared a
prioritized list of repairs. The NJMC has also evaluated the condition of other drainage
infrastructure such as storm sewers and drainage ditches in the District’s flood-prone
areas, and has prepared recommendations for needed repairs. Table 2 summarizes the
projected cost of the prioritized plan (N. Agnoli, personal communication) for the next
five years (additional detail is contained in Appendix 1). The 23 repairs identified below
total $24,277,150 through 2012, although we note that these costs are based on estimates
available at the time the prioritized list was prepared, and so may be subject to revision.
In addition to the District-wide efforts discussed above, the fourteen municipalities and
two counties comprising the District have their own stormwater maintenance programs
as summarized in Table 3. These programs are largely restricted to street sweeping and
catch basin cleaning. The work is performed by the various public works departments
in additional to their many other non-stormwater related duties, and as a result,
receives varying degrees of priority. Since all the municipalities comprising the District
also contain at least some property outside the District boundaries, municipal out of
District needs may compete with the stormwater management needs of the District.

JULY, 2007 Table 2. Projected Costs to Repair Malfunctioning District Stormwater Infrastructure.
Design/Construction Management Construction
Rank/Project Name In-House Consultants Permit
Fee Estimated
Budget
Sub-Total 20% Contingency Total Project
1. Rutherford/East Rutherford Drainage Ditch System Restoration, Bergen County
$22,512 $304,900 $20,000 $400,000 $747,412 $149,482 $896,894
2. Rutherford Tide Gates Restoration Project, Rutherford, Bergen County $36,190 $126,300 $20,000 $1,000,000 $1,182,490 $236,498 $1,418,988
3. Route 17 Stormwater System Improvement Project Rutherford, East Rutherford, Bergen County
$34,818 $293,150 $20,000 $2,400,000 $2,747,968 $549,594 $3,297,562
4. Asia Place/Kero Road Drainage Ditch Restoration, Carlstadt, Bergen County $14,808 $5,000 Completed $290,000 $309,808 $61,962 $371,770
5. Polito Avenue Elevation & Storm Sewer Restoration Concept Design $17,178 $68,250 $7,000 $400,000 $492,428 $98,486 $590,914
6. Carol Place Storm Sewer System Investigation and Restoration Project, Carlstadt, Bergen County
$26,271 $75,150 $7,000 $150,000 $258,421 $51,684 $310,105
7. Broad Street & 16th Street Tide Gate Replacement Project, Carlstadt, Bergen County
$26,271 $65,900 $7,000 $100,000 $199,171 $39,834 $239,005
8. Bellmans Creek/Wolf Creek Regional Tide Gate/Pump Station Study - H&H Analysis ONLY
$12,474 $37,000 $0 $0 $49,474 $9,895 $59,369

JULY, 2007
9. NJ Route 7 Regional Flood Mitigation Study, Kearny, Hudson County
$45,486 $216,200 $25,000 $2,000,000 $2,286,686 $457,337 $2,744,023
10. Murray Hill Parkway Storm System Study - H&H Analysis ONLY, East Rutherford, Bergen County
$4,795 $27,750 $0 $0 $32,545 $6,509 $39,054
11. East Riser Tide Gates Restoration Project, Moonachie, Bergen County $29,603 $117,600 $14,000 $1,500,000 $1,661,203 $332,241 $1,993,444
12. West Riser Tide Gates Restoration Project, Moonachie, Bergen County $65,609 $135,600 $14,000 $1,000,000 $1,215,209 $243,042 $1,458,251
13. Meadowlands Parkway Drainage System Investigation and Restoration Project, Secaucus, Hudson County
$21,861 $77,200 $7,000 $300,000 $406,061 $81,212 $487,273
14. Fish House Road Flood Mitigation Project, Kearny, Hudson County $19,572 $116,600 $14,000 $1,000,000 $1,150,172 $230,034 $1,380,206
15. Penhorn Creek Regional Tide Gate/Pump Station Study, Secaucus, Hudson County
$35,812 $208,650 $14,000 $2,500,000 $2,758,462 $551,692 $3,310,154
16. Michelle Place Drainage System Investigation & Restoration Project, Carlstadt, Bergen County
$24,416 $68,500 $7,000 $500,000 $599,916 $119,983 $719,899
CONFIDENTIAL
27

JULY, 2007
CONFIDENTIAL
28
17. Peach Island Creek Tide Gates Restoration Project, Carlstadt, Bergen County
$26,719 $108,350 $7,000 $1,000,000 $1,142,069 $228,414 $1,370,483
18. DePeyster Creek Drainage Ditch Restoration Project - H&H Analysis ONLY, Little Ferry, Bergen County
$18,914 $0 $7,000 $100,000 $125,914 $25,183 $151,097
19. Barell Avenue Drainage Ditch Restoration Project, Carlstadt, Bergen County
$27,454 $100,300 $7,000 $750,000 $884,754 $176,951 $1,061,705
20. Farm Road Flood Mitigation Project - H&H Analysis and Stream Encroachment Permit, Secaucus, Hudson County
$24,416 $36,750 $7,000 $500,000 $568,166 $113,633 $681,799
21. Maiden Lane Flood Investigation Project, Little Ferry, Bergen County $3,703 $0 $0 $0 $3,703 $741 $4,444
22. Yellow Freight Tide Gates Restoration Project, Carlstadt, Bergen County
$26,208 $100,300 $7,000 $1,000,000 $1,133,508 $226,702 $1,360,210
23. Belezza Tide Gate Restoration Project - H&H Analysis and Stream Encroachment Permit, Kearny, Hudson County
$16,835 $18,250 $7,000 $150,000 $192,085 $38,417 $230,502
TOTAL PROJECTED COSTS $581,925 $2,307,700 $218,000 $17,040,000 $20,147,625 $2,729,526 $24,177,151

JULY, 2007
Table 3. Routine Stormwater Maintenance Schedules in the Meadowlands District.
Phone Street Sweeping Municipality Contact Name Frequency of Cleanout Equipment Owned
Number Frequency
Carlstadt 201-939-2850 (Main Line) Paul Ritchie
Annual cleanout of all catch basins
Entire Town - Once a week 1 Vac Truck / 2 Sweepers
Moonachie 201-935-2344 Henry Van Saders
1/3 of town's catch basins cleaned annually
Entire Town - Once a week 1 Vac Truck / 1 Sweeper
Kearny 201-998-3700 Paul Carratura Periodically / As-Needed Residential - Once a week Industrial Zone - 4 Times a Week
1 Sweeper
North Arlington 201-955-5665 Jim McCabe Annual cleanout of all catch
basins Entire Town - Once a week
2 Sweepers / 1 Vac Truck / 1 Sewer Truck
North Bergen 201-392-2161 Frank Gargiulo Annual cleanout of all catch basins
Entire Town - Bi-Weekly County Roads - Once a week
1 Vac Truck / 6 Large Sweepers / 12 Sidewalk size Sweepers
Rutherford 201-460-3040 Chris Seidler 3/4 of town's catch basins cleaned annually
Entire Town - Once a week
1 Vac Truck / Jet Truck / 2 Sweepers
East Rutherford 201-933-3444 (Main Line)
Alan De Rosa Annual cleanout of all catch basins
Entire Town - Twice a week
1 Vac Truck / 2 Sweepers / 1 small sidewalk sweeper
Secaucus 201-330-2080 Michael Gonnelli
Annual cleanout of all catch basins at times bi-annual
Entire Town - Once a week 4 Sweepers / 1 Vac Truck
Teterboro 201-288-0628 John Fantacone Periodically / As-Needed / With the use of NJMC Vac Truck
Entire Town - Once a week 1 Sweeper
Little Ferry 201-641-0023 (Main Line) William Holley
Annual cleanout of all catch basins
Entire Town - Bi-Monthly 1 Vac Truck / 1 Sweeper
Ridgefield 201-945-5319 / 201-741-8807 (Cell)
Nick Gambardella
Annual cleanout of all catch basins
Entire Town - Once a week 1 Vac Truck / 2 Sweepers
Jersey City 201-547-4402 John Yurchak Periodically / As-Needed Entire Town - Once a week
1 Vac Truck / 26 Sweepers
South Hackensack
201-440-1815 or 440-3283 (direct)
(Main Line) Lawrence Paladino-ext 119
Annual cleanout of all catch basins
Entire Town - Every three weeks
1 combination Vactor/sweeper truck
Lyndhurst 201-438-5478 Matthew Ruzzo Annual cleanout of all catch basins
Entire Town - Once a week 1 Vac Truck / 2 Sweepers
Bergen County Roads Department
201-646-2813 Mike Berk
Left to municipalities / County owns a vac truck and its in use when needed or by complaint
Local D.P.W.'s sweep individual municipalities. However if needed, County will assist.
1 Vac Truck / 2 Sweepers available to municipalities
County has over 5000 catch basins - daily cleanouts as needed and/or when a repair is requested
Local D.P.W.'s sweep individual municipalities. However if needed, County will assist.
2 Sweepers / Backhoe / New Vac Truck is expected soon
Hudson County Roads Department
201-915-1374 Michael LoPresti
CONFIDENTIAL
29

JULY, 2007
D. OUT OF DISTRICT FACTORSS OUT OF DISTRICT FACTOR
There are a number of factors outside the District that have a direct and significant
effect on stormwater management within the District. The total watershed of the
Hackensack River that drains into the District is approximately 193 square miles
(123,520 acres). Of this total acreage, only 18,860 acres are actually within the District
boundaries. This means that only 15.3% of the watershed that drains into the District is
actually under the regional planning authority of the NJMC. Another 10,083 acres
(8.2% of the total watershed) drain into the District from those portions of District
municipalities that are outside the District boundaries (Fig. 7). While the runoff from
the upper portions of the watershed is generally not as important a factor in District
flooding as the tidal flows from Newark Bay, stormwater practices outside the District
can still have a significant effect on both the quantity and quality of runoff that drains
into the District (See Addendum 1). Key factors that can significantly affect the amount
of stormwater in the District are the volume of water flowing or released over the
Oradell Dam and/or water volume discharging into the Hackensack River from the
combined sewer overflows (CSOs) in Kearny, Ridgefield, Jersey City, and North
Bergen.
CONFIDENTIAL
30
The DISTRICT
Fig. 7. Boundaries of the Hackensack Meadowlands District

JULY, 2007
Another key factor is the local priority placed on municipal stormwater programs
affecting the District. Within four of the fourteen municipalities that comprise the
Meadowlands District, the portion of upland area inside the District boundary varies
considerably. Additionally, stormwater related tasks are just one aspect of the many
responsibilities that the municipal public works directors must perform. Routine
maintenance of stormwater catch basins is often the last item on a list of Municipality
priorities. Several public works directors admitted that their stormwater maintenance
program was essentially “as needed” to resolve flooding complaints.
E.E. PROPOSED STORMWATER MANAGEMENT ACTIVITIES PROPOSED STORMWATER MANAGEMENT ACTIVITIES1. Rationale Flooding within the District is a complex and serious problem. There is no simplistic
solution that will easily resolve all the issues related to the District’s flooding events.
The tidal regime and the complexity of the District’s hydrology means that virtually all
major District flood control maintenance projects require coordination between the
NJMC, NJDEP and the USACE. Depending on the issue at hand, i.e., tides vs. storms,
either the USACE New York or Philadelphia Districts will be involved. The individual
municipalities may lack the unique expertise necessary to successfully navigate both
state and federal bureaucracies simultaneously. Piecemeal solutions from fourteen
different municipalities are unlikely to be successful in solving flood-related issues on a
District-wide level.
What is necessary is a highly coordinated and centralized program that is capable of
addressing flood-related issues in a comprehensive fashion. Having a single entity
perform this role can significantly streamline the required permitting and interagency
processes. A strong centralized maintenance program that is rigorously carried out by
stormwater experts will contribute to the economic vitality of the District and will pay
for itself in the long run. Malfunctioning systems such as clogged catch basins routinely
result in ponding in and around roadways. In addition to the disruption caused to
CONFIDENTIAL
31

JULY, 2007
major transportation corridors, this ponding softens and erodes the subgrade, the
adjacent drainage ditches, and the material that supports the pavement edge. As a
result of routine stormwater infrastructure maintenance, major road repairs would be
required on a much less frequent basis.
We therefore recommend the formation of a specialized and highly focused Stormwater
Project Team, which would be devoted to both stormwater management and
maintenance of the District’s stormwater infrastructure. This team should be given the
authority to develop structural and non-structural remedies to alleviate the number of
flood events, as well as the financial resources needed to implement these remedies. The
Stormwater Project Team should be responsible for:
1. Routine stormwater infrastructure inspection and maintenance including development of inspection standards and schedules
2. As-needed repair and improvement of stormwater facilities and infrastructure including development of GIS infrastructure databases to document and monitor conditions of the system
3. Development of major and minor capital improvement plans, including the pursuit of various funding mechanisms such as grants or infrastructure loan programs
4. Planning and implementation for flood control management including integration into the master planning process to ensure preservation of wetlands and acquisition of open space to enhance natural water storage capabilities
5. Serving as a local resource by providing proactive development of public education programs, including providing technical advice, BMPs, and assistance to private landowners and District Municipalities
6. Coordination with FEMA, USACE, NJDEP, and other potential regulating or funding agencies to develop effective regulations and responsibility for obtaining funding for infrastructure improvements
7. Planning and implementation of water quality programs including NJPDES permitting and coordination with CSO communities
CONFIDENTIAL
32

JULY, 2007
8. Coordination with NJDOT to ensure state and federal highway and bridge drainage issues are addressed
CONFIDENTIAL
33

JULY, 2007
In the capital spending described in the Financial Analysis (Section IV), we examined
three potential cost scenarios for management of the District’s stormwater (these cost
estimates were derived from publicly available information provided by Stormwater
Utilities in other sections of the U.S., and would be subject to revisions should a
Stormwater Utility be established in the NY/NJ region). The first option is essentially a
bare bones routine maintenance program that includes semiannual cleanout of catch
basins, minor cleaning of ditches and culverts, weekly street sweeping, annual
inspection of tide gates and pump stations, and remedial repair of culverts and catch
basins as complaints are received (Appendix 1, Table A). The second option includes all
of the above maintenance plus the addition of more sophisticated inspection
equipment, a more aggressive sewer replacement program, and the replacement
and/or major overhaul of one large water control structure (tide gate or pump station)
per year (Appendix 1, Table B).
The third option includes the first two scenarios plus the addition of a much more
sophisticated planning team that would oversee the implementation of all the required
maintenance actions identified in the Floodplain Management Plan (Appendix 1, Table
C). This option also includes a “Flood Control Team” that would work with both
municipal officials and private property owners to inspect sites and present a detailed
list of recommendations to improve the ability of the municipality and/or the specific
property owner to deal with stormwater flows.
It is envisioned that this team would function like the energy audit teams employed by
some power companies, which perform a free audit of a property and leave a detailed
list of recommendations to be implemented. As a cost saving measure, these audits
could be prepared for a collective group of properties at any given time.
Implementation of best management practices (BMPs) that reduce the stormwater
generated by a property could become the basis for “Credits” awarded to a property
owner that would reduce the property’s Stormwater Utility fee.
CONFIDENTIAL
34

JULY, 2007
As an example of this process, the Rutgers hydrology team visited many of the sites
identified in the FEMA Flood Management Plan (2005). At the Broad Street location in
Carlstadt one property owner had recently implemented improvements that would
have a positive effect on the amount of stormwater the property was generating (NJMC
2005):
1. Increased the hydraulic capacity of inlet grates,
2. Added a high-power pump with backup,
3. Redirected roof water away from parking areas,
4. Installed a one-way valve on the system outlet,
5. Constructed a flood wall around critical properties to the 10 year surge elevation,
6. Repaved the lot to reduce the amount of grit entering the pump chamber.
Additional measures that could be taken on this property to further reduce stormwater
runoff volume include:
1. Converting some of the area between the buildings to a detention pond that could hold water at least through a tide cycle or two (this would take cooperation between adjacent property owners, but would benefit all),
2. Installing several large cisterns to capture roof runoff that would be released at low tide,
3. Installation of additional one-way valves in local drains,
4. Repair of the Broad St. & 20th St. Tide Gate,
5. Cleanout of all catch basins and drainage ditches, and
6. Installation of additional pump stations.
The above are given as examples of the type of recommendations that the “FLOOD
CONTROL TEAM” could provide.
CONFIDENTIAL
35

JULY, 2007
2. TIDAL INFLUENCES
As discussed previously, tidally influenced conditions and flows play a significant role
in flooding events within the Meadowlands District. This means that flooding solutions
for low lying areas of the District need to provide physical and mechanical protections,
including flood walls, pumps, levees, and check valves.
Natural opportunities for temporary storage of stormwater in the District also need to
be identified. Some of this storage capacity could come from utilization of existing
open space within the District. An example of this natural approach is considering the
feasibility of developing an extensive wetland system as part of the Richard P. Kane
Natural Area mitigation/restoration activities. The large open space of the Richard P.
Kane Natural Area may be suitable for the creation of a wetland system that could
contribute to the District’s flood storage capacity, while at the same time helping to
reduce stormwater sediment loadings. Another example of this approach is utilization
of space near the Kearny Marsh (adjacent to the Keegan Landfill) to construct a water
storage wetland. Such a system could contain flood waters that are currently associated
with the Frank’s Creek drainage area, while simultaneously contributing to significantly
improved water quality. Additional study is necessary to flesh out these and other
opportunities to mitigate flood surges through utilization of the District’s +8,000 acres
of wetlands.
F. FUTURE NEEDSS FUTURE NEED
One of the key advantages of having a dedicated group of professionals responsible for
dealing with stormwater issues is the enhanced ability to do comprehensive planning in
order to identify, anticipate and deal proactively with emerging needs. There are a
number of obvious situations contributing the current flooding events that will need to
be addressed, and professionals dealing with the District’s flood issues on a daily basis
will quickly identify others.
CONFIDENTIAL
36

JULY, 2007
For example, one of the key issues that will need to be resolved is how to deal with
stormwater issues on private property. If a property owner is paying a fee that is
identified specifically for stormwater management, they will quickly feel a sense of
entitlement and begin demanding solutions for their problems. This visibility is a
double-edged sword. While it can be a positive factor in helping to identify issues that
are causing problems, it also creates expectations and adds to work backlog. In reality,
there are limits to what can be done on private property. In general, public money
cannot be used for improvements to private property. Mechanisms such as the Flood-
Proofing team described above can help identify solutions and provide
recommendations, but it is generally up to the individual property owner to implement
(and pay for) them.
On the other hand, a Stormwater Utility team could provide help to identify potential
funding mechanisms such as FEMA grant or loan programs for which the property
owner may be eligible and provide assistance in applying for those programs. The
utility could potentially maintain a list of qualified engineers and contractors who could
perform stormwater BMP work, perhaps even administering some type of certification
program. The team could develop and staff a monitoring/inspection program for
stormwater management measures and BMPs within the District, and provide input
into the Utility’s fee-reduction Credit Program. The team could apply for grants that
benefit the District as a whole, such as funding from the USACE to repair major flood
control infrastructure or funding from the USEPA or NJDEP to improve water quality
under the 319(h) program. The utility could partner with groups such as the Bergen
County Utilities Authority (BCUA) or the Passaic Valley Sewerage Commission (PVSC)
to pursue water quality programs such as the PVSC’s floatables removal program.
Natural Resource Damage Assessment (NRD) funds could be applied for to support
these and other programs.
CONFIDENTIAL
37

JULY, 2007
The basic hydrologic variables that affect stormwater and flooding are changing. By the
end of the 21st century, sea level along the New Jersey Coast is predicted to rise between
0.31 and 1.10 meters (12 to 44 inches, respectively) due to the effect of climate change
(Cooper et al. 2005). The shorter-term projection for sea level rise is an additional 25 cm
(8”) by the 2020s decade (Columbia University 2007). A rise in sea level of this
magnitude has the potential to transform the daily high tide levels in Newark Bay to
the equivalent of today’s 25-year storm (See Addendum 2). Additionally, the
intensification of the hydrologic cycle will lead to larger and more intense storms
becoming more frequent. While beyond the scope of this study, the local effects of
climate change should clearly be studied further. Dealing with this critical issue makes
an even stronger case for a dedicated Stormwater Utility so the District can be proactive
in developing solutions.
CONFIDENTIAL
38

JULY, 2007
II IIII .. LLEEGGAALL AANNAALLYYSSIISS
There are several distinct legal issues related to the creation and operation of
stormwater utilities. At the outset there must be the legal authority to create a utility.
Once that threshold is crossed, any program must be structured to ensure that the
utility rate is not vulnerable to legal challenges. This section discusses the relevant legal
principles.
AA.. AAUUTTHHOORRIITTYY
1. MUNICIPAL AND COUNTY AUTHORITY TO ESTABLISH UTILITIES The New Jersey Legislature has specifically delegated the authority to establish utilities
to municipalities and counties.1 This law, dating from 1957 and overhauled several
times between 1977 and 1984, has detailed provisions for the creation of local utilities,
the construction of infrastructure, and the calculation, assessment and collection of fees.
At the time this law was passed, the Legislature clearly had in mind the creation of
water and sewage disposal authorities, which is the title of the chapter as codified.
Existing law now authorizes four types of governmental “utility systems”: water
systems, solid waste systems, sewerage systems, or hydroelectric systems.2
One could argue that the definition of utility is more elastic, and that the existing
categories could encompass stormwater controls. The statement of purpose, for
example, is quite broad:
1 Municipal and County Utilities Authorities Law, N.J.S.A. 40:14B-1 et seq. See also Sewerage Authorities Law, N.J.S.A 40:14A-1 et seq.
2 N.J.S.A. 40:14B-3(10). As the Senate County and Municipal Government Committee explained, the 1984 amendments broadened the authorization beyond sewer and water utilities by amending the definition section to authorize “water, sewerage, utility and solid wastes systems.” Senate Statement No. 1284 to L. 1984, c.178.
CONFIDENTIAL
39

JULY, 2007
to foster and promote by all reasonable means the provision and distribution of an adequate supply of water for the public and private uses of counties and municipalities and their inhabitants, the collection, disposal and recycling of solid waste, including sewage sludge, in an environmentally sound manner, the relief of lands and waters in or bordering the State from pollution, from domestic, industrial and other sources, including pollution derived from chemical and hazardous wastes, and thus the reduction and ultimate abatement of the menace to the public health resulting from such pollution, . . . by (1) . . . works for the collection, treatment, purification or disposal of sewage or other wastes . . . ; * * * (5) . . . granting to counties and municipalities and to such municipal authorities discretionary powers to provide for utility services designed to provide or distribute such a supply of water, to recycle or dispose of solid waste, to relieve pollution of such waters in or bordering the State . . . .3
These broad purposes are buttressed by the definition of “sewerage system” as all
facilities for the “collection . . . or disposal in a sanitary manner of any sewage, liquid or
solid wastes, night soil or industrial wastes”4 and “solid waste” as “other waste
materials, including . . . liquids . . . .”5 In addition, the Legislature recently defined
“wastewater treatment” as encompassing stormwater controls.6
A broad interpretation of the law makes sense on several levels. On a conceptual level,
a stormwater utility, like a sewer utility (or garbage utility), removes harmful
3 N.J.S.A. 40:14B-2; see also N.J.S.A. 40:14B-19, N.J.S.A. 40:14A-6.
4 N.J.S.A. 40:14B-3(9).
5 Id. at -3(29).
6 P.L. 1999 Ch. 23, Sec. 15(37) (amending N.J.S.A. 40A:11-15).
CONFIDENTIAL
40
JULY, 2007
substances from a property.7 On a practical level, in many of the cities and older urban
areas of New Jersey, the sewer and stormwater systems are combined, leading to the
problem of combined sewer overflows (CSOs) when sewage treatment plants become
overwhelmed during precipitation events. The implementation of a stormwater utility
would be eased if it could be combined with a sewer system because the public would
better understand the benefit provided by a stormwater system that is similar to sewer
services, and a separate line item for stormwater bills would allow comparison of rates.
These are policy arguments, however, and may not overcome the arguably narrow
scope of the authorizing statutes.
Property owners will likely argue that that the Legislature would have to grant
municipalities specific authority to establish stormwater authorities and that the
Legislature would again have to authorize stormwater utilities through an express
statutory amendment. For example, in 1977 the Legislature recognized the need to
amend the Utilities Law to reflect the additional dictates of the Solid Waste
Management Act, rather than assuming that existing categories could be interpreted to
include solid waste utilities. Although a little farther afield, the Legislature similarly
enacted a statute to provide specific authority for the creation of fire districts.8
Challengers could support their argument by noting that flood control and drainage are
excluded from the specific list of utility purposes in the “public” utility law governing
7 In at least one matter, the BPU has approved the ability of a municipality to contract out the operation of its water, sewer and stormwater systems. In re Application Between the City of Orange Township and U.S. Water L.L.C. for Approval of an Operating Agreement, BPU Dkt. No. WO 03080614 (Apr. 28, 2004). That decision refers to the operation of Orange’s stormwater system by the Essex County Improvement Authority and the East Orange Water Commission under the rubric of the “water system.” Id., p. 3. The transaction was governed by enabling legislation to allow municipalities to enter into partnerships with private entities to provide water supply services. L. 1993, c.381; N.J.S.A. 58:28-1 et seq.
8 L.1991, c.223, N.J.S.A. 40A:14-70 et seq.
CONFIDENTIAL
41

JULY, 2007
investor-owned utilities.9 A recent New Jersey Supreme Court case strictly interpreted
authorizing legislation and held that an innovative fee arrangement (Environmental
Investment Charges) to pay bonds issued for a solid waste incinerator was not
authorized under the Municipal and Counties Utilities Authorities Law or under
general authorization for a local finance board.10
With regard to authorized local utilities, a fee may be imposed upon “the owner or
occupant . . . of any real property which directly or indirectly . . . has been supplied or
furnished such use, products or services [provided by the utility]” as long as the fees are
“as nearly as the municipal authority shall deem practicable and equitable [and]
uniform throughout the district for the same type, class and amount of use, products or
services.”11 Fees may be set by actual consumption or by proxies such as the number of
plumbing fixtures, and may also include the costs of treatment and initial connections.12
Procedural protections include advance notice of charges and a hearing.13
If the utility option is not available, counties and municipalities have other powers to
create a stormwater system supported by separate assessments rather than tax
revenues. Counties have the general authority to construct and maintain public
improvements or works.14 These powers include the provision of “public facilities” for
9 N.J.S.A. 48:2-13.
10 In re Passaic County Utilities Authority, 164 N.J. 270 (2000) (rejecting charge on non-users of incinerator that was never built after flow-control regimes were declared unconstitutional).
11 See N.J.S.A. 40:14B-21 (water charges), -22 (sewerage charges), -22.1 (solid waste charges).
12 Id.
13 N.J.S.A. 40:14B-23.
14 N.J.S.A. 40:23-14; County Improvements Law. N.J.S.A. 40:37A-44 et seq.
CONFIDENTIAL
42

JULY, 2007
any “governmental purpose” including “garbage and solid waste disposal systems” but
the main thrust of the law is for the construction of facilities that will aid economic
development.15 Separate statutes authorize the creation of Joint Flood Control
Commissions16 and flood control improvements financed by special assessments on
benefited property owners.17 Similarly, County Pollution Control Financing
Authorities
may finance needed pollution control facilities.18 Municipalities also have powers to
make improvements, which are defined to include drains and drainage systems19 and
to assess costs to real estate benefited by the improvements, subject to procedural and
other protections for such funds.20 As with all special assessments, those for drainage
must be linked to some benefit to the landowner, and New Jersey courts have closely
oked at the particular facts of each case.21
lo
15 N.J.S.A.40:37A-54.
16 N.J.S.A. 40:14-18.
17 N.J.S.A. 40A:27-1 et seq.; see generally N.J.S.A. 40:56-1(I).
18 N.J.S.A. 40:37C-1 et seq.
19 Local Improvements Law, N.J.S.A. 40:56-1(i).
20 N.J.S.A. 40:56-52.
21 See, e.g., Twp. of Maplewood v. Smith, 112 N.J. L. 233 (1934) (gutter did not specifically benefit one adjoining property where waters carried to a drain further along, but assessment could be levied against properties along brook through which water was increased because they benefited by drain that improved main outlet of drainage system, which in turn improved the passage of waters); Deamer v. Borough of Bergenfield, 8 N.J. Misc. 627 (1930); see generally St. Vincent’s Church, Madison v. Borough of Madison, 86 N.J.L. 567 (1914) (lands within sewerage area benefited indirectly from sewer facilities and could be assessed costs). Many older cases dating to the 1800s denied assessments for indirect benefits.
CONFIDENTIAL
43

JULY, 2007
Municipalities also have general nuisance abatement powers,22 and municipalities are
required to prepare storm water management plans and ordinances.23 Stormwater
plans are an integral part of any master plan24 and must conform to applicable State
laws.25 New State of NJ regulations encourage the creation of regional stormwater
management plans that may include “innovative stormwater measures and
strategies.”26
2. IMPLIED AUTHORITY
We are unaware of any direct statutory authority allowing the NJMC to establish a
utility, and property owners can be expected to challenge any utility for lack of
authority.27 Indeed, many utility services in the Meadowlands are provided by
municipal utilities (e.g., sewer by the Bergen County Utilities Authority) or private
companies that are regulated by the Board of Public Utilities (e.g., water by United
Water, gas and electric by PSE&G, phone by Verizon). A reviewing court is likely to
look to analogous statutory authority of the NJMC, the general statutory authority for
municipalities and counties to establish utilities, and the implied powers necessary for a
utility’s operation. We address each of these in turn.
22 N.J.S.A. 40:48-2.12f.
23 N.J.S.A. 40:55D-93.
24 N.J.S.A. 40:55D-94. The master plans at issue are authorized by the Municipal Land Use Law, N.J.S.A. 40:55D-94.
25 N.J.S.A. 40:55D-95.
26 N.J.A.C. 7:8-3.3(b)(2).
27 See, e.g., Densmore v. Jefferson County, 813 So.2d 844 (Ala. 2001); Hospitality Ass’n of S.C. Inc. v. County of Charleston, 464 S.E.2d 113, 118 (1995); City of Witchita, Kansas v. Kansas Taxpayers Network, 874 P.2d 667 (Kan. 1994).
CONFIDENTIAL
44
JULY, 2007
Analogous NJMC Authority The Legislature has authorized the NJMC to make
improvements that are supported by fees or special assessments.28 With special
assessments, charges are limited to “the cost of improvements from the increase of
property values attributable to such improvements.”29 Separately, and more generally,
the Legislature has authorized the NJMC “to fix and revise from time to time and to
charge and collect rates, fees and other charges for the use of any facilities operated and
maintained by the [NJMC].”30 The capital cost of improvements may be funded
through bonds payable from the income and revenues of the improvement and bonding
resolutions may include covenants setting the rates of fees to be charged.31 The NJMC
may contract with municipalities, counties or other public agencies for the operation of
improvements.32
One might assume that the nature of assessments and improvements might imply a
project of limited duration, as opposed to a perpetual public works project. This is not
necessarily the case [and we are not aware of any cases in New Jersey that imposed any
time limit on assessments for benefits]. In one older case, property owners in Belleville,
28 See N.J.S.A. 13:17-3(p) (defining “improvement” to include curbing, guttering, constructing drains and drainage systems), -3(v) (defining “special assessment” to include “benefits accruing from the construction of improvements by or at the direction of” NJMC).
29 N.J.S.A. 13:17-6(l).
30 N.J.S.A. 13:17-6(m).
31 N.J.S.A. 13:17-23.
32 N.J.S.A. 13:17-80.
CONFIDENTIAL
45
JULY, 2007
New Jersey challenged assessments for a project that started in 1920 and was completed
in 1931. The challengers argued that the assessments, which were first levied at the
completion of construction, “must be made within a reasonable time after the work is
done.” The New Jersey Supreme Court, following courts in other states, found “this is a
matter for legislative action and the courts will not impose a limit where the legislature
does not.”33 Indeed, the general rule is that assessments cannot be levied or enforced
until the benefit is fully conferred upon property, which may pose problems for
financing the initial costs of construction.34
Special assessments are also governed by a stand-alone article in the statute that
authorized the formation of improvement districts, the levy of special assessments, and
the creation of a revolving fund.35 As with all actions that proceed through resolution,
NJMC must give public notice and hold a hearing, followed by a second resolution
authorizing the special assessment.36 The substantive limitation on this power is that
assessments shall “be as nearly as may be in proportion to and not in excess of the
benefit, advantage or increase in value which respective lots and parcels of land shall be
deemed to receive by reason of such improvement.”37 Unpaid assessments are given
priority as a first lien on the land, paramount to all prior or later encumbrances.38
(footnote continued)
33 Vanderbilt v. Belleville, 11 N.J. Misc. 775, 776 (N.J. Sup. Ct. 1933).
34 Green v. Town of Montclair, 125 N.J.L. 19 (1940).
35 N.J.S.A. 13:17-39, -52
36 N.J.S.A. 13:17-43 to -45.
37 N.J.S.A. 13:17-46.
38 N.J.S.A. 13:17-53, -54.
CONFIDENTIAL
46

JULY, 2007
The NJMC also has extensive general land use authority, including the power to
prepare and implement a Master Plan and “to adopt and enforce codes and standards
for the effectuation of such plan”; to adopt a building code with drainage provisions,
and to regulate plans for development within the Meadowlands District.39 The NJMC
is a political subdivision of the State and as such may exercise “public and essential
governmental functions, and the exercise by the commission of the powers . . . shall be
deemed and held to be an essential governmental function of the State.”40 These
powers are likely very limited, and impact development fees have been upheld only in
very limited circumstances involving the limited context of constitutional fair housing
rights and only upon the promulgation of regulatory guidelines.41
3. CONCLUSIONS
The New Jersey Meadowlands Commission has several options to find the authority to
create a Stormwater Utility using existing authorities. The Commission may be able to
obtain an opinion from the Attorney General’s office about whether it has the authority
to create a Stormwater Utility. The Commission may attempt to characterize a
stormwater system as an “improvement” that can be supported by special assessments.
Special assessment generally must benefit a narrow class of property owners and might
be more complex and burdensome to establish than fees. The Commission may try to
coordinate a regional stormwater utility made up of municipalities and counties that do
have clear statutory authority to create utilities. Under this approach, the municipal
39 N.J.S.A. 13:17-6(i), -6(k), -6(r).
40 N.J.S.A. 13:17-5(a).
41 Holmdel Builders Ass’n v. Twp of Holmdel, 121 N.J. 550 (1990).
CONFIDENTIAL
47

JULY, 2007
and county parties would have to be comfortable with the argument that existing
statutes authorize the creation of a stormwater utility.
The most conservative approach would be to obtain specific statutory authority from
the Legislature for the NJMC, or for the counties and municipalities on an individual or
regional basis, to establish a stormwater utility. If such specific statutory authority is
sought, it would also provide a good opportunity to clarify the permissible basis of
charges, and thereby to defuse the inevitable litigation over whether the charges are an
impermissible tax. After a decade of litigation over the propriety of connection fees to
municipal utilities, for example, the Legislature provided a statutory formula.42
BB.. CCLLAASSSSIIFFIICCAATTIIOONN OOFF TTHHEE IINNCCOOMMEE SSTTRREEAAMM –– TTAAXX VVEERRSSUUSS FFEEEE
In general, payments made by citizens to the government are classified as taxes, fees or
special assessments. These categories are somewhat flexible and depend on fact-
specific factors about the degree to which the payment arises from one’s status as a
property owner or as a user of services. Nevertheless, the legal categories give rise to
separate legal implications and may have separate procedural and substantive
requirements that could be raised in any legal challenge brought by property owners.
The ultimate categorization of the stormwater charge is crucial to the program.
We assume that the NJMC would not want to impose an additional tax for stormwater
disposal for a number of reasons. As a practical matter, taxes cannot be imposed on
churches, schools, federal government installations and other tax-exempt properties,
which although tax exempt nonetheless generate stormwater. A tax-based program
42 See L. 1985, c.526; N.J.S.A. 40:14A-8, 40:14A-23.
CONFIDENTIAL
48

JULY, 2007
would therefore raise less money – or fall upon fewer payors – than a fee-based
program. More fundamentally, the NJMC has no general taxing authority.43
1. GENERAL CONSIDERATIONS
Financing a stormwater utility can raise issues not typically found in the financing of
other utilities such as sewer, power and drinking water utilities. This is because the
benefits being paid for may not be immediately apparent to the citizen. That perceived
“unfairness” has lead to legal challenges to municipalities’ right to charge stormwater
fees, when the same citizen does not challenge water or sewer fees. To help insure a
stormwater utility charge is upheld if challenged in the courts consideration should be
given to how the charge will be characterized.
Taxes. Like taxes levied at the state and federal level, local taxes are general charges to
raise revenue for the operational costs of government. Taxes are assessed against all
who are within the scope of the government's taxing authority, and without
consideration of whether the individual taxpayer will benefit from the services to be
funded by the tax. In this matter the cost of services is collectivized and spread over the
43 The general rule is that political subdivisions of the State do not have the power to tax except as delegated by the legislature. See generally N.J. Const. Art. IV, § I, para. 1 (State may not delegate taxing power to an agency that does not exercise the power of self-government); Robinson v. Cahill, 62 N.J. 473, cert. denied, 4141 U.S. 976 (1973); Local Tax Authorization Act of 1970, N.J.S.A. 40:48C-6. The Hackensack Meadowlands Reclamation and Development Act, L. 1968, c. 404, codified at N.J.S.A. 13:17-1 et seq. (the “Act”), only provides the Commission authority to determine a municipality’s tax-sharing obligation under the inter-municipality tax sharing provision at N.J.S.A. 13:17-60 to -76 and to allot proceeds from that fund. See Meadowlands Regional Development Agency v. State, 112 N.J. Super. 89, 115-16 (Chancery Div. 1970) (Commission lacks direct power to levy taxes), aff’d, 63 N.J. 35, 42 (1973). Municipalities and counties, on the other hand, have the power to raise taxes to pay for improvements. N.J.S.A. 40:48-7, 40:23-7.
CONFIDENTIAL
49
JULY, 2007
entire taxable population. New Jersey municipalities have limited taxing power that does
not extend to a stormwater tax, which would be overturned on appeal. Even in
municipalities having the legal authority to assess taxes there are advantages to the
charge being regarded as a fee as opposed to a tax. Based on our research of other
jurisdictions, organizations that are exempt from paying taxes such as Federal or State
government facilities, schools, religious and charitable institutions, would not be
exempt from paying stormwater utility fees. These entities pay water and sewer fees
under statutes that specifically define "persons" who own property subject to fees or
assessments as including the State and its subdivisions.44 A number of New Jersey
courts have upheld such fees charged on public entities.45
Assessments. In some instances, the government, or residents themselves, seek to install
or construct an improvement for which the benefited group can be narrowly and
precisely drawn. For example if one street of residents wants sidewalks, the
municipality may decide it unfair for the general tax revenues to pay for such
improvements that will be bestowed on a single narrowly defined group. A special
assessment allows the sponsor to recoup the cost of projects directly from those who
benefit, preserving general tax revenues to be spent for the more generalized welfare of
the community. In most jurisdictions that we have researched, special assessments
must satisfy two court-imposed criteria: (1) they must provide a special benefit to the
44 N.J.S.A. 40:14A-3; N.J.S.A. 40:14B.
45 Jersey City Sewerage Authority v. Housing Authority of City of Jersey City, 40 N.J. 145 (1963); Camden County v. Pennsauken Sewerage Authority, 15 N.J. 456 (1954); Middlesex County Sewerage Authority v. Borough of Middlesex, 74 N.J.Super. 591, (L. Div. 1962), affirmed 79 N.J. Super. 24, certification denied 40 N.J. 501. We note that the NJMC's authorization for charging for improvements does not carve out state agencies. N.J.S.A. 13:17-6(l), (m).
CONFIDENTIAL
50
JULY, 2007
property assessed and (2) the amount of the assessment imposed can be no greater than
the value of that special benefit to the payer.
Fees. Fees are imposed on a regulated individual, entity, property, or business in order
to offset the cost of services or regulatory programs. Courts in various states have
expanded, rejected, or restricted differently the criteria for fees, but the common factor
is that there is some benefit to the property owner, which is based on and proportional
to the fee. The criteria for designating payments to be fees are similar to the
requirements for special assessments. However, fees may be levied to recoup the cost
of a government service or to pay for the implementation of a governmental regulatory
program, and are not limited to structural or physical improvements. Therefore, fees
potentially apply to a greater scope of governmental services then assessments and in
the case of funding a Stormwater Utility are the better option.
New Jersey courts follow the above distinctions, and have adopted a rather forgiving
test. As long as a charge bears a reasonable relationship to the cost incurred by the
government to regulate it is a fee; only if the primary purpose of a charge is to raise
general revenue is it a tax.46
Stormwater Fees. We are not aware of any New Jersey case that has involved user
charges for stormwater utilities, but there are several decisions from the courts of other
states (see Appendix 1, Table D). In general those courts have upheld charges that
could be considered a fee based on the presence of the three “fee factors” set forth
below. While there have been a handful of successful challenges to stormwater fees,
where courts have rejected charges that were determined to be taxes and that violated
procedural or substantive limitations on the taxing power, typically this occurred when
46 In New Life Gospel Church v. State, 257 N.J. Super. 241, 246 (App. Div. 1992).
CONFIDENTIAL
51
JULY, 2007
one of the three “fee factors” was ignored. It is worth noting that some of the cases
discussed below are outlier cases that describe the extreme bounds of the law on
unlawful taxes. In general, a stormwater utility rate is valid if it is designed to defray
the costs of the service provided by the municipality and is roughly proportional to the
amount of runoff generated by a property owner.
The Criteria for Stormwater Fees: Benefit to Landowner. The party paying a fee must
benefit from the governmental service being funded or the regulatory program being
implemented. Benefits do not have to be precisely quantifiable, and any property in a
particular watershed can be said to have derived an indirect benefit from a stormwater
system if there is an overall improvement in health, comfort, convenience and enhanced
property values.47
In contrast, a tax does not require that the payor receive any particular benefit. A
Michigan court found a stormwater utility charge to be a tax and not a fee because
seventy-five percent of the property owners were already paying a charge for a
stormwater utility and the challenged charge was for a new stormwater utility to serve
the other twenty-five percent of the city.48 The new charge was a tax because it applied
to all and not only those who would benefit from the stormwater system.
The Criteria for Stormwater Fees: Proportionality. Fees must relate to the payer’s
contribution to a problem and/or the costs of addressing the problem. In this case, the
problem is stormwater runoff, and the closer a fee comes to the amount of runoff
generated, the better. In California, a stormwater fee was invalidated because it was
47 Kentucky River Auth. v. City of Danville, 932 S.W.2d 374, 377 (Ky. App. 1996); Long Run Baptist Ass’n Inc. v. Louisville and Jefferson County Metro. Sewer Dist., 775 S.W.2d 520, 522 (1989).
48 Bolt v. City of Lansing, 459 Mich. 152. (Mich. 1998)
CONFIDENTIAL
52

JULY, 2007
applicable to "each and every developed parcel of land within the City" and was not
directly based on or measured by use.49
A service charge that generates excess funds will most likely be considered a tax that is
not proportional to use, especially if the excess is put toward other purposes. In North
Carolina, a stormwater fee was invalidated because the charges were not completely
directed towards, nor used for maintaining, planning or implementing a stormwater
facility. There the court found that “little of the program's emphasis is on the
maintenance and construction of a structural and natural stormwater and drainage
system [and] instead focuses on educational programs, guidance manuals, used oil
recycling, household hazardous waste collection, and enforcement efforts against illegal
dumping of hazardous materials” such that sixty-eight percent of the total budget was
used for things other then stormwater utility maintenance.50 In other jurisdictions,
stormwater rates may generate surplus funds as long as the excess money is not
diverted for other purposes.51
The Criteria for Fees: Voluntariness. Fees are voluntary, at least to some degree.
Courts have abandoned a strict test for voluntariness, whereby a user can opt out of a
fee entirely by not using a service. Rather than use municipal water, for example, a
farmer might decide to continue to use well water. It is harder to opt-out entirely from
stormwater impacts, and courts have greatly diluted the requirements to show that a
49 Howard Jarvis Taxpayers Ass'n v. City of Salinas, 98 Cal. App. 4th 1351 (2002). The California Constitution, Art. XIIID, § 6, required the city to subject the proposed storm drainage fee to a vote by the property owners or the voting residents of the affected area. The city claimed the fee was a user fee, comparable to the metered use of water, and not a fee for a property-related service, and was therefore exempt from the vote.
50 Smith Chapel Baptist Church v. City of Durham, 350 N.C. 805, 814-815 (1999). 51 City of Wooster v. Grains, 52 Ohio St.3d 180, 183, 556 N.E. 2d 1163, 1166 (1990).
CONFIDENTIAL
53

JULY, 2007
fee is voluntary. Generally, voluntariness is present if a property owner can reduce
their fee by voluntary methods. In the stormwater context, voluntariness is present if a
landowner can show that he or she has reduced the amount of runoff by removal of
impervious surfaces, by systems such as infiltrating catch basins, or by cistern-type
collection systems.
In the Michigan case discussed above, the court also found the fee charged for
stormwater utility usage was not voluntary because property owners had no choice
whether to use the service and were unable to affect the level of their fee except by
building less on their land.52 Similarly, an Oregon tax court rejected stormwater fees
that were based on the amount of impervious surfaces on a property, where owners
could only avoid the fee by removing the impervious surfaces.53
In sum, the propriety of a stormwater utility rate depends on a connection between the
fee and the ongoing need for stormwater management services, i.e., the amount of
runoff contributed by existing users. Stormwater fees should be used only for
stormwater-related services and not other uses, or they may be construed as general
taxes. Eligible stormwater services include tangible benefits such as necessary capital
improvements and services to maintain existing structures, as well as intangible
benefits. Such benefits include an enforcement system, studies of flooding and runoff,
and even educational efforts, that are designed to benefit the current and near future
stormwater system. A comprehensive stormwater plan with detailed budgets for capital
and operational expenses is crucial in articulating the benefits from the stormwater
services provided to the existing stormwater users, and especially for linking the
intangible services provided to real benefits of the stormwater system. For example,
52 Bolt v. City of Lansing, 459 Mich. 152,(Mich. 1998)
53 Dennehy v. Gresham, 12 OTR 194, 197 (Or. T.C. 1992)
CONFIDENTIAL
54

JULY, 2007
educational efforts and technical assistance may bolster a credit program or lower the
maintenance or both. In addition, any stormwater system must include a credit system
so that users may take steps to reduce their rate, which stands in contrast to their
inability to affect their level of taxation.
Lessons from New Jersey Sewage Connection Fee Cases: We have examined several
New Jersey sewage connection fee cases for insights into how this State’s courts might
rule in a stormwater utility fee case.
Several New Jersey cases have involved the reasonableness of fees. In one New Jersey
case involving a challenge to sewage system rate schedules and connection charges, the
court found that a township and municipality could include a capital-cost-recovery
item in utility ratemaking, subject to the overall requirement that the rates be free from
patent unreasonableness.54 One important element of the reasonableness was found in
N.J.S.A. 40:56-27, which states that special assessments must “be as nearly as may be in
proportion to and not in excess of the peculiar benefit, advantage or increase in value
which the respective lots and parcels of real estate shall be deemed to receive by reason
of such improvement.” 55
Another New Jersey case involved two sewage system districts: one was a preexisting
system funded by general taxes, and the newer one was to be funded solely by fees in
that part of the newly formed sewer district. 56 Residents of the new district argued
that the dual system was unconstitutional because those in the old district paid only
general taxes for sewer services while those in the new district had to pay both taxes
and a fee for the same service. The court held that the action of the municipality was
54 Meglino v. Twp. Comm. of Eagleswood, 103 N.J. 144, 161 (1986).
55 N.J. Stat. § 40:56-27.
56 Airwick Indus. v. Carlstadt Sewerage Auth., 57 N.J. 107, 117 (1970).
CONFIDENTIAL
55
JULY, 2007
constitutional because the classification of the plaintiffs' lands rested on real and not
feigned differences: the newly created district was industrial while the existing was
residential, and the lands covered in the newly created district were marshlands
requiring a more expensive system then the existing one. The court went on to say that
the statute authorizing the sewage authority to charge fees (N.J.S.A. § 40:14A-8(b)), need
not be read to require precise mathematical equality, but rather to contemplate rough
equality, keeping in mind that we are in an area in which, as with respect to other tax
impositions, absolute equality is neither feasible nor constitutionally vital. 57
In a third sewage fee case, a court upheld as having a rational basis a rate schedule that
classified single-family dwellings and one- and two-bedroom apartments together with
multi-family dwellings, and the rate structure was formulated using one of the methods
available under N.J. Stat. Ann. § 40:14A-8(b). 58
We are aware of at least one New Jersey case that has decided whether charges are taxes
or fees. 59 The issue was whether assessments on real property in a municipal Special
Improvement District were unconstitutional because residential properties were
excluded. The court found that whether the special assessments should be deemed real
property taxes depended in part on the nature of the benefits received by the properties
within the Special Improvement District as well as the method of determining the
amount assessed. It held that the special assessments did not violate the State
constitution because they were not taxes, because the fees benefited specific properties,
and were not clearly out of relation to the amount assessed. The court went on to
distinguish special assessments from taxes, stating that “traditionally, the differences
between an assessment and a tax include: an assessment supports local improvements,
57 Id at 122.
58 Phoenix Associates, Inc. v. Edgewater Park Sewerage Authority, 178 N.J. Super. 109, 121-122 (App. Div. 1981).
59 2nd Roc-Jersey Assocs. v. Town of Morristown, 158 N.J. 581 (1999).
CONFIDENTIAL
56
JULY, 2007
while a tax finances general operations; an assessment is a one-time charge, while a tax
is annual; and an assessment requires that the benefit be direct, while a tax requires no
such direct benefit. The improvement must benefit the assessed property, and that
benefit must be special and local, that is, the benefit to the specific property must be
substantially greater than to the public in general. The benefit can be measured by
increased market value or by the overall economic effect of the improvement. Lastly,
the benefit must be certain rather than speculative, although it may arise in the
future.”60
All assessments levied under this chapter for any local improvement shall in each case
be as nearly as may be in proportion to and not in excess of the peculiar benefit,
advantage or increase in value which the respective lots and parcels of real estate shall
be deemed to receive by reason of such improvement. 61
CC.. RREEGGUULLAATTOORRYY RREECCOOMMMMEENNDDAATTIIOONNSS
A 2005 report prepared for the Morris County Planning Board identifies the municipal
and county laws applicable to the formation of a Stormwater Utility in the State of New
Jersey.62 We agree with the statutory amendments proposed by the Morris County
Planning Board to existing authority for municipal and county improvements and
60 Id. at 606.
61 N.J.S.A. § 40:56-27.
62 CDM and Morris County Planning Board, Recommendations for Stormwater Utility Implementation in New Jersey, Table 1 (Sept. 2005) (available at http://www.rerc.rutgers.edu/). Our assessment of the potential applicability of existing authority to make “improvements” is more optimistic than CDM’s assessment. However, we agree that improvements must be funded by special assessments, which are not a dependable or long-term source of ongoing funds.
CONFIDENTIAL
57
JULY, 2007
utilities.63 These suggestions should be augmented with appropriate language to make
clear that an entity such as the NJMC can coordinate the efforts of municipalities and
counties.
Additional statutory changes would clarify that the NJMC itself has the authority to
create and operate a Stormwater Utility. Any comprehensive statutory amendment
would consist of several parts and would be similar to the multi-section authorization
for special assessments at N.J.S.A. 17:17-39 to -59. However, the following short
amendments may be sufficient.
Alternatively, NJMC could examine the statutes of other jurisdictions (e.g., Fla. Stat. §
403.0893 or 403.031, or enabling legislation in Texas or some other jurisdiction), pick one
that best suits its needs, and urge the wholesale adoption of a New Jersey version of
that statute.
Suggested Statutory Changes If NJMC chooses to seek a package of amendments to existing laws to clarify its
authority under existing law to establish a Stormwater Utility, we suggest the following
changes:
N.J.S.A. 13:17-3(p): amend definition of “improvement” to include “stormwater
management systems.”
General powers in N.J.S.A. 13:17-6 (new section highlighted):
63 CDM and Morris County Planning Board, Recommendations for Stormwater Utility Implementation in New Jersey, Appendix A (Sept. 2005) (available at http://www.rerc.rutgers.edu).
CONFIDENTIAL
58

JULY, 2007
The commission shall have perpetual succession and shall have the following
powers:
* * *
(g) To acquire in the name of the commission by purchase, lease as lessee, or
otherwise, on such terms and conditions and in such manner as it may deem
proper, or by the exercise of the power of eminent domain, any land or interest
therein and other property, including land under water and riparian lands, land
or highways held by any municipality or other governmental subdivision of the
State, or any fee simple absolute in, easements upon, or the benefit of restrictions
upon abutting property, that it may determine is reasonably necessary for the
performance of any of its duties under this act; provided that the power of
eminent domain shall not be exercised by the commission to acquire any
property owned or used by a non-stormwater public utility, as defined in section
48:2-13 of the Revised Statutes, in furnishing any commodity or service which by
law it is authorized to furnish;
* * *
(k) To establish engineering standards for land reclamation, including the type of
fill, drainage, stormwater management and grading, and to promulgate a
building code specifying the maximum weight, size and density of all buildings
and structures to be placed on any land within its jurisdiction according to the
method of reclamation employed and the load-bearing quality of the reclaimed
land;
(l) To recover by special assessments or user fees the cost of improvements from
the increase of property values attributable to such improvements;
(m) Generally to fix and revise from time to time and to charge and collect rates,
fees and other charges for the use of any facilities operated and maintained by
the commission, including without limitation user fees for stormwater facilities;
CONFIDENTIAL
59
JULY, 2007
(x) To provide stormwater management facilities for the collection, treatment
and disposal of stormwater, to create a utility to construct and maintain those
facilities and to conduct any necessary planning, and to fund those facilities
through user fees that are rationally related to the use of the facilities.
N.J.S.A. 13:17-10.1 (new section)
(a) Within 6 months of the effective date of this act the commission shall
undertake and complete a survey of the district to determine the total amount of
stormwater created and discharged in the district for appropriate time periods
and storm events.
The commission is hereby authorized, empowered and directed to guarantee (b)
that stormwater facilities sufficient to treat and dispose of the total amount of
stormwater determined by its survey shall be available or be provided by the
commission, provided that such facilities meet all applicable requirements
promulgated and enforced by the New Jersey Department of Environmental
Protection.
c) In providing the stormwater facilities, which it is hereby authorized,
empowered and directed to provide, the commission may:
(1) Acquire or construct any such facilities as an improvement, and may
recover the cost of such acquisition or construction in the same manner
and pursuant to the same procedure provided for any other improvement
undertaken by the commission pursuant to this act;
(2) Operate and maintain any such facilities and generally fix and collect
rates, user fees or other charges for any such facilities in the same manner
CONFIDENTIAL
60
JULY, 2007
and pursuant to the same procedure provided for any other facilities
operated and maintained by the commission; or as part of a stormwater
utility; or lease as lessor or lessee any such facilities, or provide by
agreement or contract with any person for the operation of any such
facilities.
(3) Join and participate in any agency, instrumentality or authority created
by the State, or by any political subdivision or subdivisions thereof, for the
purpose of treating or disposing of stormwater in which it may be
authorized by law to join and participate, under any terms or conditions,
subject to any duties and entitled to any rights and powers provided by
such law.
(4) Permit, by contract or agreement, any agency, instrumentality or
authority created by the State, or by any political subdivision or
subdivisions thereof, for the purpose of treating or disposing of
stormwater to acquire, construct, or operate and maintain any stormwater
facilities which such agency, instrumentality or authority is authorized by
law to acquire, construct, or operate and maintain. Any such facilities
acquired, constructed, or operated and maintained by any such agency,
instrumentality or authority may be located either within the district or
without the district but within the jurisdiction of such agency,
instrumentality or authority.
order to acquire or construct any solid waste disposal facility the (d) In
comm onds and notes and to pay or redeem said ission is authorized to issue b
bonds and notes from revenue derived from the user fees, special assessments
and other charges collected for such facilities. Any cost incurred by the
commission in providing any stormwater facilities shall be charged by the
commission to the persons using such facilities, and nothing herein contained
CONFIDENTIAL
61

JULY, 2007
shall be interpreted as requiring the commission to bear the cost of any
stormwater facility provided by the commission pursuant to this act.
. 13:17-23(m) (new section): clarify that bonding resolutions may include
nts setting the rates of user fees to be charged through a stormwater fa
N.J.S.A
covena cility.
CONFIDENTIAL
62

JULY, 2007
IV. FINANCIAL ANALYSIS
In creating a stormwater utility, there are many financial and business
considerations that must be addressed. Some of the obvious considerations
include program costs, operating expenses, funding options, fee methodologies,
rates, timing, and program policies. A comprehensive Business Plan will need to
be developed that incorporates all of these issues, and that also includes a long-
term financial forecast. Several aspects, namely legal and engineering program
costs, have been addressed in previous sections of this study. This section of the
feasibility study focuses on two primary financial aspects. They are the:
a) Fee methodology: Evaluating fee methodologies includes analyzing
property data, considering the various fee structure components,
estimating the revenue potential of the fee structure, and commenting
on enhancements to the fee structure such as base fees, credit programs,
and other revenue sources.
b) Preliminary financial analysis: This entails a review of property data
and an estimate of potential rates based on the projected stormwater
program cost assumptions of the three operating and capital spending
scenarios presented in Engineering Section III.
The choice to consider a fee for stormwater management services is based on the
assumption that other potential revenue sources are not sufficient or as practical. While
stormwater services could be funded by taxpayer general funds, in practice these funds
are typically used for other municipal purposes, such as public safety, health, and
education. With the increase in the number of Federal and State stormwater regulations,
stormwater service costs have increased significantly, making it difficult for many
municipalities’ general funds to cover stormwater operating expenses, or to make the
capital investments required to comply with the new regulations. Other funding
CONFIDENTIAL
63

JULY, 2007
alternatives, such as local or special assessments, increasing permit/license fees,
development contributions and penalty fees can be used to fund stormwater services.
However, these are not consistent sources of revenue, and in all probability would not
generate the level of financing needed to address the stormwater issues facing the
Meadowlands District.
AA.. FFEEEE MMEETTHHOODDOOLLOOGGYY
1. Balancing Fairness & Efficiency
Over 400 stormwater utilities throughout the country charge “user service fees” to
generate revenue (NJDEP 2005). The flooding history of a property is not the
determinant for charging a stormwater fee. User fees are based on the legal principle
that the costs of providing stormwater management services are directly related to the
conditions found on an individual property, and all properties have conditions that
affect the amount, peak rate, and pollutant loading of stormwater runoff. These
characteristics include the property size, the degree of impervious cover, the soil type,
topography, and intensity of the site development. All properties use municipal
stormwater programs and systems such as storm drains, drainage basins, gutters, and
other structures, and benefit from regional infrastructure such as tide gates.
USER FEE METHODOLOGIES
A fee methodology incorporates one or more factors, which are used in a formula that
determines a calculated fee per user. Examples of such factors are gross square footage,
impervious square footage, a runoff co-efficient, a base fee rate, or a flat fee rate.
CONFIDENTIAL
64

JULY, 2007
The goal in designing a fee structure is to
maximize fairness for an acceptable level
of administrative efficiency – to balance
the ease of implementation and the
fairness or equality of the methodology
(Figure 8). Typically, the easier it is to
administer the fee (as in a flat rate for all
users) the less equality or fairness the
methodology provides (PVPC 1999).
Fee Structure
MaximumFairness/Equity
Calculated RateCalculated Rate
Conversely, the more factors used to calculate the fee, greater “fairness” may be
achieved by refining the relationship between a property’s individual conditions and
the effect these specific conditions have on the stormwater runoff generated by that
property. However, adding multiple factors into the fee structure has two important
negative consequences. First, the administration costs can increase significantly, because
a more complex fee structure requires collecting, processing and storing more property
data. Results from other utilities show that administration costs can increase from $1 to
$6 per account by increasing the parameters in the fee methodology from one to two.
The amount of the increase will vary based on the type of factor(s) added (AMEC, 2002).
Second, the more complicated the fee structure, the harder it is for the public to
understand and support the system, especially the residential customers. It is
important to remember that all costs of the utility are ultimately billed back to the users,
so customers may prefer a simpler fee structure to avoid the higher administrative costs
entailed in a more complicated fee structure.
There are many types of fee structures, but more than half the stormwater utilities in the
United States base their fee on some measure of impervious coverage (Black & Veatch,
2001-2002). Impervious coverage can include parking lots, buildings, driveways, patios,
sheds, etc., and is widely used as a fee base, because imperviousness has a direct
Industrial/CommercialIndustrial/Commercial ResidentialResidential
Easy Implementation/Efficiency
Flat RateFlat Rate
Fee Structure
MaximumFairness/Equity
Calculated RateCalculated Rate
Easy Implementation/Efficiency
Flat RateFlat Rate
Fee Structure
MaximumFairness/Equity
Calculated RateCalculated Rate
Easy Implementation/Efficiency
Flat RateFlat Rate
MaximumFairness/Equity
Calculated RateCalculated Rate
Easy Implementation/Efficiency
Flat RateFlat Rate
Industrial/CommercialIndustrial/Commercial ResidentialResidentialIndustrial/CommercialIndustrial/Commercial ResidentialResidentialIndustrial/CommercialIndustrial/Commercial ResidentialResidential
Figure 8. Fairness versus ease of implementation.
CONFIDENTIAL
65

JULY, 2007
correlation to stormwater runoff contributions in terms of both water quantity and
quality. The optimal fee structure for a District Stormwater Utility should satisfy the
following criteria.
SSTTOORRMMWWAATTEERR UUTTIILLIITTYY FFEEEE CCRRIITTEERRIIAA (NAFSM 2006, AMEC 2002)
1. Achieve the maximum amount of fairness given the need to maintain an efficient and cost-effective administrative structure
2. Balance rates with the desired level of service and operating costs
3. Provide financial sustainability by ensuring long-term revenue stability and funding source(s) for implementation, administration, maintenance and operations, capital spending, and contingencies
4. Provide accurate and technically defendable data to support the fee structure on an on-going basis
5. Be compatible with existing rate policies and other local financing
6. Comply with existing and anticipated federal, state and local regulations
7. Provide flexibility in operations and financing
2. Components of Fee Structures
Before reviewing possible fee structures, an understanding of the various potential fee
components is helpful. The best fee components relate individual property conditions to
the stormwater runoff that directly affects the municipal system(s). Components can be
used either independently or in combination with other factors in constructing a fee
methodology. The principal test for whether or not a fee structure is defendable is that
it “must be fair and reasonable and the resulting charges must have a substantial
relationship to the cost of providing the services and facilities” (AMEC 2002). This is
commonly referred to as the “rational nexus” test. It is also important to note that any
fee structure or policy must not discriminate among customers based on gender, age,
religion, race, ethnicity or other arbitrary attributes.
CONFIDENTIAL
66

JULY, 2007
Flat Rates involve charging one rate for property owners within the same land
use category, and are typically used when the variances between the parcels
(size, imperviousness, etc.) are insignificant. Often residential parcels have
homogeneous property conditions, justifying a flat rate approach. Given the
wide diversity of residential, industrial, commercial, and other property types in
the District, a flat fee would provide the lowest level of “fairness.” This factor
would only make sense for the residential single family detached units, but these
properties account for less than 10% of all parcels in the District (See Figure 10).
While the clear advantage to flat fees is the low administration cost, the trade off
in fairness is typically unacceptable when land use is not homogeneous.
Gross Parcel Area achieves more “fairness” than the flat rate, because it takes
into account the size of the property, but this approach is weak in linking parcels
to the amount of stormwater runoff generated. Using gross parcel area only,
particularly in the Meadowlands District, would unfairly charge properties
containing large areas of open space, while undercharging the many small highly
developed properties. This approach would also provide property owners little
incentive to preserve open spaces that enhance stormwater storage capacity.
Impervious Coverage Area is an essential component in constructing an
equitable fee structure, because the amount of impervious coverage has a direct
and profound effect on the amount of stormwater runoff a property generates.
The amount of impervious coverage can be determined through tax records or
aerial interpretation of Geographical Information Systems (GIS) maps, which are
available through the NJMC and the NJDEP.
Intensity Development Factor (IDF) is typically measured as the amount of
impervious coverage relative to the total gross square footage of a parcel. As
with impervious coverage, this factor is a meaningful measure of a property’s
contribution to stormwater runoff. When using an IDF, parcels are typically
CONFIDENTIAL
67

JULY, 2007
grouped into land use categories when applying rates. IDF may be used in
combination with some other factors, but not with comparable measures (such as
a runoff coefficient), because this would result in duplicating like factors.
Runoff Coefficient measures the quantity of runoff based on the multiple
conditions of a specific property. Complex engineering models are used as the
basis for this calculation. While this rate method can achieve a high amount of
“fairness” in the fee structure, collecting and maintaining the data is expensive.
This fee component is not as easily explained to the average customer as the
other fee factors. Like the IDF component, this measure would be used to
categorize the parcels by land use, and then group rates would be applied. This
method could not be used in conjunction with an IDF methodology, because the
factors duplicate each other.
Fixed Base Amount can be used to recover the basic administration costs of
operating a stormwater utility. Similar to the base rates of other types of utilities,
this fee would be charged to all properties equally in combination with other fee
components that would vary by the amount of runoff a property contributed.
Since the public is familiar with fixed base amounts, this could be a way of
covering fixed administrative costs, as well as other operating costs that support
all properties, such as GIS data management.
Billing Units: Regardless of the components that comprise a stormwater utility
fee formula, a “billing unit” is needed. Other service utilities have billing units,
such as the price per kilowatt, the price per gallon, or the price per household.
Similarly, a stormwater utility should have a suitable billing unit.
Equivalent Residential Unit (ERU) or “average single family unit” is a common billing
unit for stormwater utilities throughout the country. ERU is unique in every
community, varying in its calculation from one utility to another. The ERU is commonly
CONFIDENTIAL
68

JULY, 2007
used for three reasons: 1) it is usually based on the smallest size of all property types,
serving as a common denominator; 2) single family homes typically have homogeneous
property conditions that are related to the amount of stormwater runoff generated; and
3) the available property data is often not sufficiently complete or accurate to use more
precise measurements, such as the size of impervious cover or a runoff coefficient.
Through analysis of single family properties, either in total or by random sampling, a
standard unit of impervious area is calculated. This standard unit, or ERU, is associated
with a rate for all detached single family homes, and is then used as a basis for charging
all other land use classes. For example, if the ERU was 1 for every 2,000 square feet of
impervious coverage, then a commercial property with 10,000 square feet of impervious
coverage would pay 5 times the ERU rate. A major benefit to using an ERU is that the
concept is easy to communicate to rate-payers and it simplifies the fee administration
and any rate changing processes.
Despite the advantages of using an ERU, it is not necessarily the most practical
approach in highly urban environments that contain a high concentration of multiple
dwelling properties, such as apartment mid/high rise dwellings, condos, townhouses,
and garden apartments. These various housing types are typically classified in the land
use code as Residential High Density or Multiple Dwelling In the Meadowlands District
the High Density Residential category represents 25% of land use. Residential Single
Family parcels are a significantly smaller component of land use, accounting for only
9% (Table 4).
Table 4. Types of District residential units.
Residential High Density / Multiple DwellingsResidential Single Family / Medium DensityTotal District 1
926 25%346 9%
3,702 100%
# of Parcels
% of Total Parcels
District Residential Unit Types
1 Assumes the NJ Turnpike is a single parcel.
Residential High Density / Multiple DwellingsResidential Single Family / Medium DensityTotal District 1
926 25%346 9%
3,702 100%
# of Parcels
% of Total Parcels
District Residential Unit Types
1 Assumes the NJ Turnpike is a single parcel.
CONFIDENTIAL
69

JULY, 2007
The question is whether to determine fees for high density residential properties on the
basis of a property’s total imperviousness, or relate each property type to an ERU. Both
approaches have been used. If the different types of multiple dwellings are treated as a
single parcel, the fee would be calculated on the entire development and then divided
among the residences.64 This approach has been found to be effective in creating
fairness for multi-storied housing, such as apartment buildings.
Alternatively, the different multiple dwelling types could be treated as individual land
use classes. An average of the impervious coverage of each multiple dwelling type, e.g.
apartments, condos, townhouses, etc., would be determined, and then related to the
ERU. The weakness of this approach is that conditions on multiple dwelling properties
in the District vary significantly, far more than those of single family detached
residences. This makes using an “average” rather meaningless, raising questions about
the fairness of such an approach. As the number and type of multiple dwellings in the
District increases, so does the potential for inequality. Given the large amount of
multiple dwelling properties in the Meadowlands, an attempt to relate these properties
to a single family unit would most likely create significant inequalities. In order to use
the ERU billing unit in the District, the type and number of units on each multiple
dwelling parcel would need to be evaluated.
Other Billing units (such as impervious cover or the volume of runoff) can also be
established with a defined value. If sufficient and accurate property data are available,
then such a measurement would be preferred as the basis for a billing unit. Some
stormwater utility fees are based on a fixed dollar amount for a set amount of
impervious area. As an example, if the billing rate was $10.00 per 1,000 impervious
square feet, and a property had 4,000 square feet of impervious coverage, the owner
would pay $40.00 per year. This factor can be applied regardless of land use and in
combination with other fee components. Since high quality impervious data is available
(footnote continued) 64 A single bill for a multiple dwelling property would not be evenly prorated among residential units if impervious areas such as
CONFIDENTIAL
70

JULY, 2007
for the District, this approach could be useful to directly correlate stormwater runoff
with a specific property.
To determine which factors to use in this feasibility study, numerous reports and
studies of other stormwater utilities as well as industry data were reviewed (see
bibliography in Appendix II). Two reports are worth noting, because they relate to the
development of stormwater utilities in the State of New Jersey. Both reports emphasize
the importance of impervious coverage in designing a fee structure.
Recommendations for Stormwater Utility Implementation in New Jersey (2005): was commissioned by the NJDEP through the Morris County Planning Board. The report recommends adopting “… a model user service fee system that can be implemented to fund stormwater management….” and that such fees “…identify a system that connects the fee charged to the general amount of impervious surface on a property that generates stormwater runoff.”
Guidance For Municipal Stormwater Funding (2006): This document was prepared by the National Association of Flood and Stormwater Management Agencies under a grant provided by the USEPA. This comprehensive document covers various aspects of establishing a stormwater utility. The report notes: “Empirical studies have demonstrated that impervious surface area on a property is the single most significant factor influencing [stormwater] impacts. Impervious area is also relatively easy to identify and quantify numerically and is the most common parameter used in stormwater service fee calculations.”
In a National Urban Runoff Program studying stormwater quality, impervious
coverage also was characterized as the dominant factor in runoff pollutant loadings
(Florida Stormwater Association 2003). Thus impervious coverage has significant
impact on water quality as well as runoff quantity and rates.
parking were assigned to units in their property deeds. In these cases, the deed boundaries would be used to allocate the cost.
CONFIDENTIAL
71

JULY, 2007
3. Comparison of Fee Structures
As part of this feasibility study, we were asked to present alternative fee methodologies.
Numerous fee structures were considered and two were chosen, which could provide
an acceptable level of 1) user fairness, 2) ease of communicating to users, and 3)
reasonable administration costs. These methodologies are summarized in Table 5.
Table 5. Comparison of Rate Methodologies
Fee Methodology Fairness for Property Owners
Ease Of Communicating
To Users
Administration Costs
ONE FACTOR
Standard billing unit ($/1,000 sq.ft. impervious cover)
Fairness for all users
Very Good
Medium to Low
TWO FACTORS
Intensity Density Factor Intervals with standard billing unit ($/1,000 sq.ft. impervious cover)
Achieves fairness for most users
Good
Medium
Both fee methodologies are based on the amount of impervious coverage on each parcel
as the basis for a billing unit. Because impervious cover has a direct and significant
impact on the generation of stormwater runoff and water quality, it is an ideal factor to
measure relative stormwater service costs for a property. These approaches also take
advantage of the high quality property data compiled using GIS maps, and provided by
the NJMC and NJDEP. Although all data needs to be field-verified in the
implementation process, our assumption is that the gross acreage and impervious data
is relatively reliable for parcels in the District.
CONFIDENTIAL
72
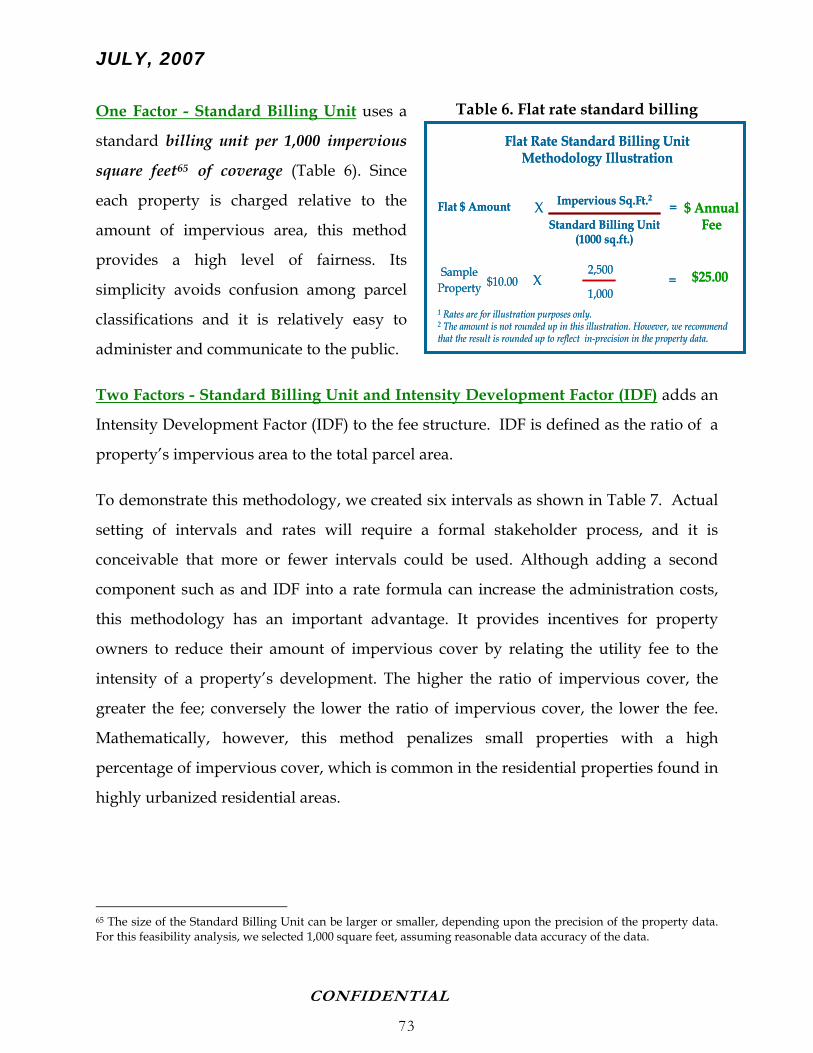
JULY, 2007
Table 6. Flat rate standard billing One Factor - Standard Billing Unit uses a
standard billing unit per 1,000 impervious
square feet65 of coverage (Table 6). Since
each property is charged relative to the
amount of impervious area, this method
provides a high level of fairness. Its
simplicity avoids confusion among parcel
classifications and it is relatively easy to
administer and communicate to the public.
Flat Rate Standard Billing Unit Methodology Illustration
1 Rates are for illustration purposes only.2 The amount is not rounded up in this illustration. However, we recommend that the result is rounded up to reflect in-precision in the property data.
Impervious Sq.Ft.2XStandard Billing Unit
(1000 sq.ft.)
= $ AnnualFee
Flat $ Amount
$25.00$10.00Sample
Property2,500
1,000=X
Two Factors - Standard Billing Unit and Intensity Development Factor (IDF) adds an
Intensity Development Factor (IDF) to the fee structure. IDF is defined as the ratio of a
property’s impervious area to the total parcel area.
To demonstrate this methodology, we created six intervals as shown in Table 7. Actual
setting of intervals and rates will require a formal stakeholder process, and it is
conceivable that more or fewer intervals could be used. Although adding a second
component such as and IDF into a rate formula can increase the administration costs,
this methodology has an important advantage. It provides incentives for property
owners to reduce their amount of impervious cover by relating the utility fee to the
intensity of a property’s development. The higher the ratio of impervious cover, the
greater the fee; conversely the lower the ratio of impervious cover, the lower the fee.
Mathematically, however, this method penalizes small properties with a high
percentage of impervious cover, which is common in the residential properties found in
highly urbanized residential areas.
65 The size of the Standard Billing Unit can be larger or smaller, depending upon the precision of the property data. For this feasibility analysis, we selected 1,000 square feet, assuming reasonable data accuracy of the data.
CONFIDENTIAL
73

JULY, 2007
Table 7. Methodology utilizing an IDF Interval comparing small and large properties.
IDF Interval Methodology Illustration And Equity Comparison
Impervious Sq.Ft.
Gross Sq.Ft.
IntensityDevelopmentFactor (IDF %)
=
IDF %
> 60% < 80%
Interval Rate/ 1000 Impervious Sq.Ft..1
< 10%> 10% < 25%> 25% < 40%> 40% < 60%
> 80%
$10.00$10.05$11.03$11.58$12.16$12.76
Differential between categories = 5%
Impervious Sq.Ft.2XStandard Billing Unit
(1000 sq.ft.)
= $ AnnualFee
1 Rates are for illustration purposes only.2 Amount is not rounded up in this illustration. However, we recommend that the result is rounded up to reflect in-precision in the property data.
5,000
2,50050.0% $11.58Small
Property
LargeProperty 7,500
2,50033.3% $11.03
$28.95
$27.58
2,500
1,000
2,500
1,000=
==
= =
=
IDF Interval Methodology Illustration And Equity Comparison
Impervious Sq.Ft.
Gross Sq.Ft.
IntensityDevelopmentFactor (IDF %)
=
IDF %
> 60% < 80%
Interval Rate/ 1000 Impervious Sq.Ft..1
< 10%> 10% < 25%> 25% < 40%> 40% < 60%
> 80%
$10.00$10.05$11.03$11.58$12.16$12.76
< 10%> 10% < 25%> 25% < 40%> 40% < 60%
> 80%
$10.00$10.05$11.03$11.58$12.16$12.76
Differential between categories = 5%
Impervious Sq.Ft.2XStandard Billing Unit
(1000 sq.ft.)
= $ AnnualFee
1 Rates are for illustration purposes only.2 Amount is not rounded up in this illustration. However, we recommend that the result is rounded up to reflect in-precision in the property data.
5,000
2,50050.0% $11.58Small
Property
LargeProperty
SmallProperty
LargeProperty 7,500
2,50033.3% $11.03
$28.95
$27.58
$28.95
$27.58
2,500
1,000
2,500
1,000=
=
=
==
= =
=
=
=
As seen in Table 7, a small property with a 50% IDF would pay more than a larger
property with a 33% IDF, assuming both properties had 2,500 square feet of impervious
cover. Other rate charges that contribute to fairness, such as “flood risk” surcharges,
would have to be supported by data that demonstrate a property contributed to greater
demands on the stormwater management system.
4. CREDIT PROGRAMS
A District Stormwater Utility should include credit programs, as incentives for property
owners to adopt Best Management Practices (BMPs) that reduce the impact of
stormwater runoff on the public stormwater infrastructure. These types of programs
reduce the fee charged to the user in exchange for measurable improvements in
stormwater management. Such Credit Programs emphasize the importance of good
stormwater management practices, offer monetary incentives, and make clear to the
property owners that they can take voluntary, proactive steps to reduce their fee.
The following examples of credit programs are organized by the type of stormwater
benefit they provide – reduce quantity, reduce rate and improve quality. In addition to
the activities listed, credits could also be available for programs that educate property
CONFIDENTIAL
74

JULY, 2007
owners on Best Management Practices (BMPs) that reduce stormwater quantity and
improve stormwater quality.
Stormwater Fee Reduction Credit Program Components
1. Reduction of the quantity of stormwater runoff:
a. Natural area conservation such as preservation of wetlands b. Creation of infiltration structures such as rain gardens c. Improvement of groundwater recharge on the property d. Alteration of the slope of a property e. Disconnection of Rooftop Runoff f. Disconnection of Non-Rooftop Runoff
2. Reduction of the rate of stormwater runoff:
a. Water detention areas b. Natural area buffers e.g. stream buffers, grass channels c. Incorporation of wetland areas into water flow paths
3. Improvements in runoff water quality:
a. Decouple stormwater and sewerage systems b. Natural area buffers e.g. stream buffers, grass channels c. Increase water residence time in wetland areas
The above credit system would be a crucial component in the fee structure of any utility
whose rate is based upon the amount of impervious cover or an IDF. If however, the
fee structure utilized a runoff-coefficient factor, such a credit program would not be
appropriate. Under this rate methodology, the above factors would already be reflected
in the fee charged, because any property runoff improvements would reduce the value
of the coefficient. However, maintaining runoff co-efficient values for all District
properties could be cost prohibitive.
5. Base Fee A base fee in the rate structure can be used to fund “fixed” overhead costs. Typically, a
base fee is a relatively small amount, charged to all customers regardless of land use
class, property size, or contribution to stormwater runoff. It is considered the base cost
CONFIDENTIAL
75

JULY, 2007
of offering the utility’s services, including administration, billing, basic planning
functions, etc. While a base fee was not included in the two example methodologies
used in this study, it should be considered during the stakeholder and rate setting
process. The NJMC has regulated regional land use, solid waste, and environmental
research activities for decades, and has significant experience in assessing the
administrative costs of services within the 14 municipalities it serves. Given its
relatively long history and known operating costs, the NJMC is well-positioned to
participate in defining minimum overhead costs required for operating an independent
Stormwater Utility.
6. Other Revenue Sources Consideration should be given to other sources of revenue that can supplement the
revenues derived from service fees. Other revenue sources may include local/special
assessments, developer contributions or impact fees, and various one-time fees for
permits, licenses, and penalties. Local or special assessments are appropriate for capital
projects that benefit only a specific group of properties, such as an on-site detention
basin. While these sources are not sufficient or reliable to fund the on-going costs of a
utility, they contribute to a utility’s financial stability and provide incentives to use best
development practices.
While not a source of revenue, user fees could be off-set with possible property tax
reductions. A District Stormwater Utility could assume some responsibilities of local
municipalities, such as street sweeping, cleaning of catch basins, and routine
stormwater infrastructure maintenance. Municipalities would enjoy significant costs
savings by transferring these stormwater management responsibilities to a utility, and
therefore could consider property tax relief.
CONFIDENTIAL
76

JULY, 2007
7. Billing Options
The NJMC has established financial arrangements with the 14 District municipalities,
which it serves. As part of the implementation process, the Commission should
evaluate its existing processes and other billing alternatives. As requested by the NJMC,
the evaluation of billing options and the related costs were not part of the scope of this
study.
B.B. FINANCIAL ANALYSIS FINANCIAL ANALYSIS
1. Overview
The following financial analysis is based on preliminary reviews of property data,
secondary research, and documents made available by the NJMC for the purposes of
providing this feasibility study. Before creating a District Stormwater Utility,
stakeholders throughout the District need to make key service and policy decisions that
would affect the ultimate rates and spending levels of such a utility. Once these
decisions are made, a formal Business Plan needs to be prepared and approved,
including a 5-year financial forecast that identifies specific revenues, operating costs,
capital spending and funding sources. This approach mirrors a long-term business
planning process, which will be important to support the Stormwater Utility rate-
setting process and ensure compliance with due diligence standards.
In lieu of comprehensive forecast assumptions, this financial analysis is based on the
following costs of the three program service levels presented in Engineering Section III:
Scenario 1 - Operation and Maintenance (O&M) Only ($1.8 million)
Scenario 2 – O&M Plus Minor Capital Expenditures ($4.0 million)
Scenario 3 - O&M Plus Major Capital Expenditures ($6.7 million)
These program costs include only estimated costs for routine maintenance, operation,
and capital expenditures, and an overall estimate of administration and other overhead
CONFIDENTIAL
77

JULY, 2007
costs. As part of a rate study and business plan, all potential costs related to creating a
District Stormwater Utility will need to be evaluated in detail (See Appendix II).
Estimated user rates were derived by equating the potential revenue with program
costs, based on specific property data for the District (see Table 11). The total number of
properties in the District is 3,702 and the total District impervious cover is 215 million
square feet. Using available property data, and various annual program costs of $1.8 to
$6.7 million, user rates per billing unit would range from $8.44 to $31.06 per year. This
is equivalent to an average single family household fee of $20.54 to $75.57 per year. To
account for future additional costs, sensitivity analyses estimated the affect of
increasing program costs on user rates. For every $100,000 in program expenditures,
the average dollar increase in the standard billing unit rate would be about $0.50, or just
over $1.00 per single family household per year.
The two proposed fee structures were applied to the District property data. The “Flat
Fee” aligned the program costs in equal proportions for those properties having
impervious area. Within the District, the industrial properties bear the majority of the
program costs, representing 58%. Using the “IDF Interval Rate” methodology shifts the
program costs to more intensely developed properties. District properties with an IDF
over 60% assume nearly 75% of the program costs.
2. Program Cost Analysis
Three different levels of program spending were examined in order to evaluate
potential estimated costs of operating a Stormwater Utility (excluding some
administration, financing and start-up costs that were not part of this study). The first
scenario provides basic operation and maintenance services only, essentially utilizing
the existing infrastructure; the second scenario adds minor capital improvements; and
the third scenario adds major capital improvements, proactive planning, and complete
implementation of the Floodplain Management Plan (2005). In all three scenarios it was
CONFIDENTIAL
78
JULY, 2007
assumed that new equipment was purchased, owned and maintained by the
Stormwater Utility, and that salaries for stormwater personnel were paid for by the
utility.
However, there is a large market in used equipment and so considerable savings could
potentially be achieved in the capital budget. If the Stormwater Utility took over
responsibilities now being carried out by municipalities within the District, some of
their equipment could be made available to the utility to significantly reduce the capital
costs. It should be emphasized that these cost scenarios were developed for feasibility
and scoping analysis and are estimates only. More in-depth studies would need to be
done to further refine these estimates prior to implementation.
Scenario 1. Operation and Maintenance only - $1.8 million
In this scenario, only basic operations and maintenance (O+M) are performed,
including periodic catch basin cleaning and weekly street sweeping. Repairs are
performed on an as-needed basis in a reactive fashion. This scenario essentially calls for
what is currently being required of the public works departments of the Counties or the
District municipalities, but adds some inspections and increases the cleanout frequency.
For this analysis it was assumed that the Stormwater Utility would be cleaning 5,000
catch basins twice a year. Studies (Mineart & Singh 1994) have shown that in most
situations cleaning catch basins twice a year is significantly more effective than once a
year. In areas of high sedimentation, even more frequent cleaning may be warranted.
With semi-annual cleaning and twice a day disposal, the typical 10-15 cubic yard vactor
truck should be sufficient to clean 750-1,000 catch basins each (CASQA 2003) per year.
No costs were included for disposal of sediments on the assumption that collected
material would disposed of at minimal charge in one of the District landfills.
This program cost option assumes annual inspection of tide gates, pump stations, and
other water control structures, but does not include a budget for repairs. It was
assumed that catch basins and sewers would be repaired in a reactive fashion as
CONFIDENTIAL
79

JULY, 2007
complaints were received and that ditches would be cleaned when they became clogged
or obstructed. Capital equipment was amortized over a ten year period. This scenario
includes 17 full time personnel, 6 vactor trucks, 10 large sweepers and 4 smaller
sweepers. The estimated costs are provided in more detail in Table A in Appendix I.
This scenario requires an annual budget of approximately $1.8 million per year.
Scenario 2. Maintenance Plus Critical Improvements – “Minor Capex” $4.0
million
This scenario includes everything describe in Scenario 1, and adds critical annual capital
improvements, including the replacement of one major water control structure (tide
gate or pump) per year. It also adds more sophisticated equipment, such as a video
camera inspection unit and a jet truck, as well as additional maintenance equipment,
such as dump trucks, pickup trucks, and a backhoe. This option assumes the
reconstruction or replacement of deteriorated catch basins and critical storm sewers
totaling $55,000 per year. This scenario funds an additional five personnel, some with
specialized skills in the maintenance and repair field, and includes a professional
planner. This second scenario requires an annual budget of approximately $4.0 million.
Additional details regarding this scenario can be found in Table B in Appendix I.
Scenario 3. Maintenance Plus Critical Improvements Plus Plan – “Major Capex”
$6.7 million
The third scenario examined includes everything in the first two programs and adds the
complete implementation of the Floodplain Management Plan over a ten-year period. It
also includes implementing the “Flood Control” Team discussed in Engineering Section
III, as well as in-depth planning and coordination. This scenario funds an additional
five people, at least one whose primary duties include researching and applying for
grants to implement capital projects and various education and outreach programs. It
also includes some water quality specialists to oversee water quality programs. The
annual budget for this program scenario is approximately $6.7 million, much of which
CONFIDENTIAL
80

JULY, 2007
is outsourced to repair major water control structures. Additional details can be found
in Table C in Appendix I. These three program spending scenarios (“service levels”) are
summarized in Table 8.
Table 8. Stormwater Utility costs to support three service levels.
Program Costs By Service Level
Program Services:Number of personnelCleaning catch basinsStorm sewer and ditch repairStreet sweepingMinor road maintenanceNumber of tide gate repairsAnnual inspection of tide gates and pumpsPlanning and coordinationFEMA research and reportingImplement 10 -year flood control plan
17 22 27X X XX X XX X XX X X0 1 1-3
X XX XX X
X
Program Operating Costs
Scenario 1 -Maintenance
Only
Scenario 2 -Maintenance
+ Minor Capex
Scenario 3 -Maintenance
+ Major Capex
Salaries & Benefits $1,073,310 $1,425,760 $1,784,860Repairs & Maintenance $35,000 $1,555,000 $3,555,000Equipment Operating $270,000 $321,500 $343,500Administration / Overhead $181,257 $400,418 $666,707
Equipment Capex $2,530,000 $3,015,000 $3,170,000Depreciation % 10% 10% 10%Annual Depreciation $ $253,000 $301,500 $317,000
Annual Program Operating Costs $1,812,567 $4,004,178 $6,667,067
Program Costs By Service Level
Program Services:Number of personnelCleaning catch basinsStorm sewer and ditch repairStreet sweepingMinor road maintenanceNumber of tide gate repairsAnnual inspection of tide gates and pumpsPlanning and coordinationFEMA research and reportingImplement 10 -year flood control plan
17 22 27X X XX X XX X XX X X0 1 1-3
X XX XX X
X
17 22 27X X XX X XX X XX X X0 1 1-3
X XX XX X
X
Program Operating Costs
Scenario 1 -Maintenance
Only
Scenario 2 -Maintenance
+ Minor Capex
Scenario 3 -Maintenance
+ Major Capex
Scenario 1 -Maintenance
Only
Scenario 2 -Maintenance
+ Minor Capex
Scenario 3 -Maintenance
+ Major Capex
Salaries & Benefits $1,073,310 $1,425,760 $1,784,860Repairs & Maintenance $35,000 $1,555,000 $3,555,000Equipment Operating $270,000 $321,500 $343,500Administration / Overhead $181,257 $400,418 $666,707
Equipment Capex $2,530,000 $3,015,000 $3,170,000Depreciation % 10% 10% 10%Annual Depreciation $ $253,000 $301,500 $317,000
Annual Program Operating Costs $1,812,567 $4,004,178 $6,667,067
Program Costs By Service Level
Program Services:Number of personnelCleaning catch basinsStorm sewer and ditch repairStreet sweepingMinor road maintenanceNumber of tide gate repairsAnnual inspection of tide gates and pumpsPlanning and coordinationFEMA research and reportingImplement 10 -year flood control plan
17 22 27X X XX X XX X XX X X0 1 1-3
X XX XX X
X
17 22 27X X XX X XX X XX X X0 1 1-3
X XX XX X
X
Program Operating Costs
Scenario 1 -Maintenance
Only
Scenario 2 -Maintenance
+ Minor Capex
Scenario 3 -Maintenance
+ Major Capex
Scenario 1 -Maintenance
Only
Scenario 2 -Maintenance
+ Minor Capex
Scenario 3 -Maintenance
+ Major Capex
Salaries & Benefits $1,073,310 $1,425,760 $1,784,860Repairs & Maintenance $35,000 $1,555,000 $3,555,000Equipment Operating $270,000 $321,500 $343,500Administration / Overhead $181,257 $400,418 $666,707
Equipment Capex $2,530,000 $3,015,000 $3,170,000Depreciation % 10% 10% 10%Annual Depreciation $ $253,000 $301,500 $317,000
Annual Program Operating Costs $1,812,567 $4,004,178 $6,667,067
3. Revenue Analysis
As part of the revenue analysis, major assumptions are first detailed, including the area
studied, land use exclusions and the standard billing unit.
Major Assumptions:
Areas Studied: Properties within the NJMC boundaries, including parts of 14
municipalities, were included as ratepayers with minimal exclusions (see “Land Use
CONFIDENTIAL
81

JULY, 2007
Exclusions” below). Portions of the four District municipalities that are beyond the
District boundaries (“District-Plus”) were evaluated separately for two reasons.
First, the stormwater runoff from these areas ultimately affects flooding within the
District. And second, the entire municipality would benefit from receiving
stormwater utility services. However, the decision to consider a stormwater
management plan beyond the District border is one for stakeholders, government
and the general public (See Addendum II).
Land Use Exclusions: In all revenue calculations wetlands, waterways, forests, and
Phragmites-covered areas were excluded from the potential population of ratepayers.
Other stormwater utilities typically excluded such areas from paying service fees,
because they contain little to no impervious coverage and actually serve as buffers in
stormwater systems. Major roads and bridges, except the NJ Turnpike, were
excluded because they are viewed as common areas to all users within the District.
The NJ Turnpike is included as a potential rate payer, because the primary turnpike
users do not own property in the District.
The NJMC has identified about 5% of District land use as Public/Quasi Public Use.66
Public areas, such as parks, office buildings, police and fire stations were not
excluded from the analysis. Other land uses that should be reviewed are cemeteries,
altered lands, undeveloped lands, and schools. Since a stormwater utility user fee is
not a tax, no user is excluded automatically. Policies must be developed through the
stakeholder process to determine which types of land uses would be excluded from
paying stormwater utility fees. Any additional fee-exempted land uses, not in this
analysis, would reduce the number of potential ratepayers and thus increase the fee
paid by the remaining property owners.
66 NJMC Master Plan, Figure 3.2 page 3-5.
CONFIDENTIAL
82

JULY, 2007
Standard Billing Unit: Both proposed fee methodologies use a Standard Billing
Unit. For illustration purposes, a dollar figure was chosen per 1,000 impervious
square feet, an area that could be determine using existing GIS capabilities. As part
of the public comment process other amounts of impervious cover should be
considered to ensure fairness and to reflect the accuracy of the available GIS data.
District Financial Analysis:
Most important to estimating user rates is the cost analysis of the stormwater
management program, which drives the rate analysis. Stormwater utility revenues may
support all aspects of stormwater management programs, including start-up costs,
administration, regulatory, financing, operating, maintenance costs and capital
expenditures. The following two sections present an analysis for the District, including:
a) land use, b) parcel data, c) revenue analysis and d) methodology application. The
user rate was estimated by equating the program costs to revenue potential, based on
user data provided by the NJDEP and the NJMC.
Land Use: The New Jersey
Meadowlands Master Plan combines
significant preservation of wetlands
and waterways within a highly
urbanized landscape (Figure 9). With
over 8,000 acres of wetlands and
waterways, these areas represent
about 44% of the District land use.
Urban gross acres also account for
44%, forest 9% and barren land 5%. Source: New Jersey Department of Environmental Protection 2002 Land Use Data
BARREN LAND
FOREST
URBAN
WATER
WETLANDS
984, 5%
1,758, 9%
8,586, 44%3,785, 20%
4,288, 22%984, 5%
1,758, 9%
8,586, 44%3,785, 20%
4,288, 22%
NJ Meadowlands In-District(Acres and Percentage of Total)
Source: New Jersey Department of Environmental Protection 2002 Land Use Data
BARREN LAND
FOREST
URBAN
WATER
WETLANDS
BARREN LAND BARREN LAND
FORESTFOREST
URBANURBAN
WATERWATER
WETLANDSWETLANDS
984, 5%
1,758, 9%
8,586, 44%3,785, 20%
4,288, 22%984, 5%
1,758, 9%
8,586, 44%3,785, 20%
4,288, 22%984, 5%
1,758, 9%
8,586, 44%3,785, 20%
4,288, 22%984, 5%
1,758, 9%
8,586, 44%3,785, 20%
4,288, 22%
NJ Meadowlands In-District(Acres and Percentage of Total)
Fig. 9. Meadowlands District land use components.
CONFIDENTIAL
83

JULY, 2007
Parcel Analysis: The number of parcels included in the District analysis is 3,702.67 The
largest proportion of parcels by land use is industrial (44.4%), followed by residential
high density (25.0%), residential single units (9.3%), transportation/
communication/utilities (8.7%), commercial (7.2%), other urban (2.5%), and all others
(2.8%). However, when analyzing impervious area, three land use categories increase in
significance (Figure 10): the industrial segment rises to 58.4%, transportation/
communication/utilities doubles to 15.6%, stadiums/cultural facilities increases to 7.4%
and the NJ Turnpike 7.4%. Other segments remain about the same or decline,
commercial/services 7.0%, residential high density 2.9%, all other 1.3%.
Fig. 10. Meadowlands District impervious cover by land use.
NJ Meadowlands DistrictParcels and Impervious Area
44.4%
8.7%7.2%
25.0%
9.3%
0%
10%
20%
30%
40%
50%
60%
70%
80%
90%
100%
% of Parcels % of Total Impervious Area
MIXED RESIDENTIAL
UPLAND RIGHTS-OF-WAY DEVELOPED
MIXED URBAN, OTHER URBAN OR BUILT-UP LAND
RECREATIONAL LAND
ALTERED LANDS/TRANSITIONAL
RESIDENTIAL, SINGLE UNIT, MEDIUM DENSITY
RESIDENTIAL, HIGH DENSITY OR MULTIPLE DENSITY
COMMERCIAL/SERVICES
NJ TURNPIKE
STADIUM THEATERS CULTURAL CENTERS
TRANSPORTATION/COMMUNICATION/UTILITIES
INDUSTRIAL/COMMERCIAL COMPLEXES
2.5%
All Other 2.8%
58.4%
15.6%
7.4%7.4%7.0%2.9%
All Other 1.4%
Source: New Jersey Department of Environmental Land Use 2002Total excluding wetlands, waterways, forest, major roads, bridges and Phragmites urban areas.
NJ Meadowlands DistrictParcels and Impervious Area
44.4%
8.7%7.2%
25.0%
9.3%
44.4%
8.7%7.2%
25.0%
9.3%
0%
10%
20%
30%
40%
50%
60%
70%
80%
90%
100%
0%
10%
20%
30%
40%
50%
60%
70%
80%
90%
100%
% of Parcels % of Total Impervious Area
MIXED RESIDENTIAL
UPLAND RIGHTS-OF-WAY DEVELOPED
MIXED URBAN, OTHER URBAN OR BUILT-UP LAND
RECREATIONAL LAND
ALTERED LANDS/TRANSITIONAL
RESIDENTIAL, SINGLE UNIT, MEDIUM DENSITY
RESIDENTIAL, HIGH DENSITY OR MULTIPLE DENSITY
COMMERCIAL/SERVICES
NJ TURNPIKE
STADIUM THEATERS CULTURAL CENTERS
TRANSPORTATION/COMMUNICATION/UTILITIES
INDUSTRIAL/COMMERCIAL COMPLEXES
2.5%
All Other 2.8%All Other 2.8%
58.4%
15.6%
7.4%7.4%7.0%2.9%
58.4%
15.6%
7.4%7.4%7.0%2.9%
All Other 1.4%All Other 1.4%
Source: New Jersey Department of Environmental Land Use 2002Total excluding wetlands, waterways, forest, major roads, bridges and Phragmites urban areas.
Revenue Analysis: User rates were estimated by equating the potential utility revenue
to the three different annual program costs, based on specific market data. Rate paying
District parcels totaled 3,702 and impervious square feet totals 215 million, resulting in
estimated user rates/billing unit ranging from about $8.44 to $31.06, varying by service
67 Total number of parcels treats the NJ Turnpike as one parcel.
CONFIDENTIAL
84

JULY, 2007
level (Table 9). Additional capital projects would increase these rates by approximately
$4.52, assuming a 25-year average project life.68
Table 9. Stormwater utility operating costs by service level and estimated District rates.
Program Costs & Estimated Rates DistrictProgram Costs & Estimated Rates District
Scenario 3 -Maintenance
+ Major Capex
Scenario 1 -Maintenance
Only
Scenario 2 -Maintenance
+ Minor Capex
Potential District Rates:District - parcels 3,702 3,702 3,702District - impervious sq.ft. 214,679,411 214,679,411 214,679,411
Estimated Average Annual RateRate/1,000 Sq. Ft.1 $8.44 $18.65 $31.06Rate Increase/Additional $100,000 costs 2 $0.47 $0.47 $0.47Average Single Family Household (sq.ft.) 3 2,433 2,433 2,433Rate/Average SFH $20.54 $45.39 $75.57Rate Increase/Additional $100,000 costs 2 $1.13 $1.13 $1.13
$1,812,567 $4,004,178 $6,667,067Annual Program Operating Costs= Annual Utility Revenue
Scenario 3 -Maintenance
+ Major Capex
Scenario 1 -Maintenance
Only
Scenario 2 -Maintenance
+ Minor Capex
Potential District Rates:District - parcels 3,702 3,702 3,702District - impervious sq.ft. 214,679,411 214,679,411 214,679,411
Estimated Average Annual RateRate/1,000 Sq. Ft.1 $8.44 $18.65 $31.06Rate Increase/Additional $100,000 costs 2 $0.47 $0.47 $0.47Average Single Family Household (sq.ft.) 3 2,433 2,433 2,433Rate/Average SFH $20.54 $45.39 $75.57Rate Increase/Additional $100,000 costs 2 $1.13 $1.13 $1.13
$1,812,567 $4,004,178 $6,667,067Annual Program Operating Costs= Annual Utility Revenue $1,812,567 $4,004,178 $6,667,067Annual Program Operating Costs= Annual Utility Revenue
1 The estimated rates are based on program engineering, operating and capital costs only. Additional costs, operating assumptions and policy decisions must be considered further in a comprehensive rate study. For example, other operating assumptions may include development growth rates in the region, alternative financing available, annual cost increases, other assets and liability assumptions. (Also see footnote 2.)2 The estimated rate will increase if estimated costs are too low. Administrative and overhead costs, such as billing, legal, accounting, supplies, education, consulting, insurance, and utilities were estimated by the NJMC at 10% of total program costs. 3 The average impervious square feet of an average Single Family Household (SFH) is calculated by dividing the totalimpervious square feet for the NJDEP land use category “1120 Residential, Single Unit, Medium Density” by the total parcels in that category. This does not include potential single family residences in other land use categories, for simplicity.
Program Costs & Estimated Rates DistrictProgram Costs & Estimated Rates District
Scenario 3 -Maintenance
+ Major Capex
Scenario 1 -Maintenance
Only
Scenario 2 -Maintenance
+ Minor Capex
Potential District Rates:District - parcels 3,702 3,702 3,702District - impervious sq.ft. 214,679,411 214,679,411 214,679,411
Estimated Average Annual RateRate/1,000 Sq. Ft.1 $8.44 $18.65 $31.06Rate Increase/Additional $100,000 costs 2 $0.47 $0.47 $0.47Average Single Family Household (sq.ft.) 3 2,433 2,433 2,433Rate/Average SFH $20.54 $45.39 $75.57Rate Increase/Additional $100,000 costs 2 $1.13 $1.13 $1.13
$1,812,567 $4,004,178 $6,667,067Annual Program Operating Costs= Annual Utility Revenue
Scenario 3 -Maintenance
+ Major Capex
Scenario 1 -Maintenance
Only
Scenario 2 -Maintenance
+ Minor Capex
Potential District Rates:District - parcels 3,702 3,702 3,702District - impervious sq.ft. 214,679,411 214,679,411 214,679,411
Estimated Average Annual RateRate/1,000 Sq. Ft.1 $8.44 $18.65 $31.06Rate Increase/Additional $100,000 costs 2 $0.47 $0.47 $0.47Average Single Family Household (sq.ft.) 3 2,433 2,433 2,433Rate/Average SFH $20.54 $45.39 $75.57Rate Increase/Additional $100,000 costs 2 $1.13 $1.13 $1.13
Potential District Rates:District - parcels 3,702 3,702 3,702District - impervious sq.ft. 214,679,411 214,679,411 214,679,411
Estimated Average Annual RateRate/1,000 Sq. Ft.1 $8.44 $18.65 $31.06Rate Increase/Additional $100,000 costs 2 $0.47 $0.47 $0.47Average Single Family Household (sq.ft.) 3 2,433 2,433 2,433Rate/Average SFH $20.54 $45.39 $75.57Rate Increase/Additional $100,000 costs 2 $1.13 $1.13 $1.13
$1,812,567 $4,004,178 $6,667,067Annual Program Operating Costs= Annual Utility Revenue $1,812,567 $4,004,178 $6,667,067Annual Program Operating Costs= Annual Utility Revenue
Scenario 3 -Maintenance
+ Major Capex
Scenario 1 -Maintenance
Only
Scenario 2 -Maintenance
+ Minor Capex
Potential District Rates:District - parcels 3,702 3,702 3,702District - impervious sq.ft. 214,679,411 214,679,411 214,679,411
Estimated Average Annual RateRate/1,000 Sq. Ft.1 $8.44 $18.65 $31.06Rate Increase/Additional $100,000 costs 2 $0.47 $0.47 $0.47Average Single Family Household (sq.ft.) 3 2,433 2,433 2,433Rate/Average SFH $20.54 $45.39 $75.57Rate Increase/Additional $100,000 costs 2 $1.13 $1.13 $1.13
$1,812,567 $4,004,178 $6,667,067Annual Program Operating Costs= Annual Utility Revenue
Scenario 3 -Maintenance
+ Major Capex
Scenario 1 -Maintenance
Only
Scenario 2 -Maintenance
+ Minor Capex
Potential District Rates:District - parcels 3,702 3,702 3,702District - impervious sq.ft. 214,679,411 214,679,411 214,679,411
Estimated Average Annual RateRate/1,000 Sq. Ft.1 $8.44 $18.65 $31.06Rate Increase/Additional $100,000 costs 2 $0.47 $0.47 $0.47Average Single Family Household (sq.ft.) 3 2,433 2,433 2,433Rate/Average SFH $20.54 $45.39 $75.57Rate Increase/Additional $100,000 costs 2 $1.13 $1.13 $1.13
Potential District Rates:District - parcels 3,702 3,702 3,702District - impervious sq.ft. 214,679,411 214,679,411 214,679,411
Estimated Average Annual RateRate/1,000 Sq. Ft.1 $8.44 $18.65 $31.06Rate Increase/Additional $100,000 costs 2 $0.47 $0.47 $0.47Average Single Family Household (sq.ft.) 3 2,433 2,433 2,433Rate/Average SFH $20.54 $45.39 $75.57Rate Increase/Additional $100,000 costs 2 $1.13 $1.13 $1.13
$1,812,567 $4,004,178 $6,667,067Annual Program Operating Costs= Annual Utility Revenue $1,812,567 $4,004,178 $6,667,067Annual Program Operating Costs= Annual Utility Revenue
1 The estimated rates are based on program engineering, operating and capital costs only. Additional costs, operating assumptions and policy decisions must be considered further in a comprehensive rate study. For example, other operating assumptions may include development growth rates in the region, alternative financing available, annual cost increases, other assets and liability assumptions. (Also see footnote 2.)2 The estimated rate will increase if estimated costs are too low. Administrative and overhead costs, such as billing, legal, accounting, supplies, education, consulting, insurance, and utilities were estimated by the NJMC at 10% of total program costs. 3 The average impervious square feet of an average Single Family Household (SFH) is calculated by dividing the totalimpervious square feet for the NJDEP land use category “1120 Residential, Single Unit, Medium Density” by the total parcels in that category. This does not include potential single family residences in other land use categories, for simplicity.
1 The estimated rates are based on program engineering, operating and capital costs only. Additional costs, operating assumptions and policy decisions must be considered further in a comprehensive rate study. For example, other operating assumptions may include development growth rates in the region, alternative financing available, annual cost increases, other assets and liability assumptions. (Also see footnote 2.)2 The estimated rate will increase if estimated costs are too low. Administrative and overhead costs, such as billing, legal, accounting, supplies, education, consulting, insurance, and utilities were estimated by the NJMC at 10% of total program costs. 3 The average impervious square feet of an average Single Family Household (SFH) is calculated by dividing the totalimpervious square feet for the NJDEP land use category “1120 Residential, Single Unit, Medium Density” by the total parcels in that category. This does not include potential single family residences in other land use categories, for simplicity.
3 The average impervious square feet of an average Single Family Household (SFH) is calculated by dividing the totalimpervious square feet for the NJDEP land use category “1120 Residential, Single Unit, Medium Density” by the total parcels in that category. This does not include potential single family residences in other land use categories, for simplicity.
The standard billing rate would increase by about $.50 for every additional $100,000 in
program costs, or approximately $1.13 for a single family household. This relationship
is crucial in viewing the estimated rates, because the program costs in this study are
only preliminary estimates. Administration costs, for example, were estimated in
aggregate at 10% of total program costs. These expenses, such as professional services
(e.g. legal, accounting, and consulting), administration and billing costs, supplies,
insurance, utilities, marketing, and contingency reserves, need to be analyzes in more
68 We estimated 25-year average project life, although project life spans can vary from 10 to 70 years.
CONFIDENTIAL
85

JULY, 2007
detailed. In addition, these projected rates could vary significantly depending upon
stakeholder polices and future market and operating assumptions, including the rate of
future development, cost increases, alternative financing sources, interest rates, utility
rate increases and other assets and liabilities (See Appendix II). Rates can also increase
significantly with increases in costs (Figure 11). This illustration emphasizes the
importance of conducting a comprehensive rate study that considers all costs, policies
and future market, and operating assumptions.
Fig. 11. Affect of Stormwater Utility program costs on rates.
User Rate /1,000impervious sq.ft.
User Rate PerAvg. SFH
District User Rate Sensitivity($0.47 Rate Increase/Billing Unit
= $1.13 Rate Increase/SFH = $100,000 Increase In Program Costs)
Additional Program Costs = Additional Revenue Needed$100,000
$1,000,000
$200,000
$300,000
$400,000
$500,000
$600,000
$700,000
$900,000
$800,000$0
$0
$2
$4
$6
$8
$10
$12
$14
$16$18
$20
$22
$24
$26
$0
$5
$10
$15
$20
$25
$30
$35
$40
$45
$50
$55
$60ScenarioTwo
SFH RateRate/1000 sq.ft.
ScenarioOne
SFH RateRate/1000 sq.ft.
To ensure the reasonableness of the District rate estimates, rate data from a study of
over 380 stormwater utilities throughout the United States (Black and Veatch 2001-2002)
was considered. We compared rates only to test the plausibility of the fee estimates in
our analysis. It is also important to note that rates were compared to averages, but the
range of the rates varies significantly across the U.S.
CONFIDENTIAL
86

JULY, 2007
Other stormwater utilities quote user rates in terms of a single family household (SFH).
In the District an “average SFH” (assuming an average impervious cover of 2,433 sq. ft.)
would receive an annual Stormwater Utility bill ranging from $21 to $75, depending
upon the service level (Table 10). In the national study, the average annual SFH rate
was between $41 and $67 (Black & Veatch 2001-2002). These amounts translate into
about $17 to $27 per 1,000 impervious sq. ft., comparable to the rates calculated for the
District.
Table 10. Comparison of U.S. Stormwater Utility rates and estimated District rates.
$ SFU/Year Average Range At 95%
Confidence Interval
$/1000 sq.ft. Impervious/
Year
$/1000 sq.ft. Impervious/
Year
(District Single Family Unit 2,433 impervious sq. ft.)Stormwater Utility Rate Comparison
Study1 of 386 Utilities $/SFU 2 $40.97 - $45.65 $16.84 - $18.76
Study1 of 162 Utilities $/1000 sq.ft. $47.27 - $66.51 $19.43 - $27.33
Represents given amounts =1 Black & Veatch national study, 2001-2002.2 SFU represents single family unit, which is synonymous with equivalent residential unit or ERU.
District SFU Estimates (Low to High) $20.54 - $75.57 $8.44 - $31.06
$ SFU/Year Average Range At 95%
Confidence Interval
$/1000 sq.ft. Impervious/
Year
$/1000 sq.ft. Impervious/
Year
(District Single Family Unit 2,433 impervious sq. ft.)Stormwater Utility Rate Comparison
(District Single Family Unit 2,433 impervious sq. ft.)(District Single Family Unit 2,433 impervious sq. ft.)Stormwater Utility Rate Comparison
Study1 of 386 Utilities $/SFU 2 $40.97 - $45.65 $16.84 - $18.76Study1 of 386 Utilities $/SFU 2 $40.97 - $45.65 $16.84 - $18.76
Study1 of 162 Utilities $/1000 sq.ft. $47.27 - $66.51 $19.43 - $27.33Study1 of 162 Utilities $/1000 sq.ft. $47.27 - $66.51 $19.43 - $27.33
Represents given amounts =1 Black & Veatch national study, 2001-2002.2 SFU represents single family unit, which is synonymous with equivalent residential unit or ERU.
Represents given amounts =1 Black & Veatch national study, 2001-2002.2 SFU represents single family unit, which is synonymous with equivalent residential unit or ERU.
District SFU Estimates (Low to High) $20.54 - $75.57 $8.44 - $31.06
Applying the Methodologies: Table 11 illustrates the two proposed fee structures for
the District: 1) a flat rate for a standard billing unit (“Flat Fee”) and 2) an IDF
(impervious area/gross area) Interval rate times a standard billing unit (“IDF Interval
Rates.”) For illustration purposes, the program costs of Scenario 2 ($4.0 million for
operation and maintenance plus minor capital expenditures) were used to estimate user
rates.
Given program costs of $4.0 million, the estimated “Flat Fee” per the standard billing
unit would be about $18.65. Industrial properties would pay the highest percentage of
CONFIDENTIAL
87

JULY, 2007
CONFIDENTIAL
88
revenues, because they represent 58% of impervious area. The “Flat Fee” approach
results in a one-to-one correlation with the amount of impervious area.
In the second fee methodology, “IDF Interval Rates”, some of the program costs are
shifted to the more intensely developed properties. In this example, the rates between
intervals were increased by 5%, creating a range of rates from $15.27 to $19.49 per
billing unit. Although the interval rates in this methodology vary, the average user rate
equals $18.65 – the same as the “Flat Fee.” Using this methodology, nearly 75% of the
program costs are born by properties with an IDF percentage greater than 60%, with
just over 50% having an IDF percentage greater than 80%. This example is for
illustration purposes only. Rates will change based on stakeholder policy decisions and
other financial and operating assumptions.

FIRST DRAFT APRIL 27, 2007
Table 11. Comparison of estimated District rates using a flat rate versus an IDF Interval rate methodology.
NJMC - District Flat Rate Standard Billing Unit Methodology 4/26/07
Land Use Codes Land Use Label
# of Parcels
Gross Parcel Area (sqft)
Gross Impervious
(sqft)
Weighted Impervious/
Parcel
% of Total Impervious
Area
Est. Fee $/1,000 Sq.
Ft.
Estimated Amount of Fees / Year
% of Total
RevenueEst. Fee /
Unit
Monthly $/1,000 Sq.Ft.
1110 RESIDENTIAL, HIGH DENSITY OR MULTIPLE DENSITY 926 13,973,121 6,194,376 44.3% 2.9% $18.65 $115,537 2.9% $125 $1.551120 RESIDENTIAL, SINGLE UNIT, MEDIUM DENSITY 346 3,821,934 841,932 22.0% 0.4% $18.65 $15,704 0.4% $45 $1.551150 RESIDENTIAL MIXED 5 108,467 18,430 17.0% 0.0% $18.65 $344 0.0% $69 $1.55
1300/1500 INDUSTRIAL/COMMERCIAL COMPLEXES 1,643 230,234,172 125,367,700 54.5% 58.4% $18.65 $2,338,345 58.4% $1,423 $1.551400/1440 TRANSPORTATION/COMMUNICATION/UTILITIES 322 173,808,654 33,481,627 19.3% 15.6% $18.65 $624,496 15.6% $1,939 $1.55
1410 NJ TURNPIKE 1 16,860,738 15,927,510 94.5% 7.4% $18.65 $297,078 7.4% $297,078 $1.551810 STADIUM THEATERS CULTURAL CENTERS 3 30,421,487 15,887,966 52.2% 7.4% $18.65 $296,341 7.4% $98,780 $1.551200 COMMERCIAL/SERVICES 266 38,123,104 15,041,553 39.5% 7.0% $18.65 $280,553 7.0% $1,055 $1.55
7400/7500 ALTERED LANDS/TRANSITIONAL 36 23,612,802 734,929 3.1% 0.3% $18.65 $13,708 0.3% $381 $1.551800 RECREATIONAL LAND 30 9,694,229 698,813 7.2% 0.3% $18.65 $13,034 0.3% $434 $1.55
1600/1700 MIXED URBAN, OTHER URBAN OR BUILT-UP LAND 94 21,974,585 459,870 2.1% 0.2% $18.65 $8,577 0.2% $91 $1.551462/1463 UPLAND RIGHTS-OF-WAY DEVELOPED 30 13,313,193 24,705 0.2% 0.0% $18.65 $461 0.0% $15 $1.55
TOTAL 2 3,702 575,946,486 214,679,411 37.3% 100.0% $18.65 $4,004,178 100.0% $1,082 $1.55
Source: New Jersey Department of Environmental Land Use 2002 $4,004,178 100.0%1 Grand Total excluding wetlands, waterways, forest, major roads (except the NJ Turnpike), bridges and phragmites urban areas.
NJMC - In-District IDF Interval Rate Methodology 4/26/07
Intensity Development Factor Intervals ParcelsGross Parcel Area (sqft)
Gross Impervious
(sqft)
Weighted Impervious/
Parcel
% of Total Impervious
Area
Est. Fee $/1,000 Sq.
Ft.
Estimated Amount of Fees / Year
% of Total
RevenueEst. Fee /
Unit
Monthly $/1,000 Sq.Ft.
< 10% 456 236,938,699 4,993,775 2.1% 2.3% $15.27 $76,274 1.9% $167 $1.27> 10% < 25% 166 43,864,924 7,284,094 16.6% 3.4% $16.04 $116,819 2.9% $704 $1.34> 25% < 40% 525 44,047,858 14,495,605 32.9% 6.8% $16.84 $244,098 6.1% $465 $1.40> 40% < 60% 954 58,350,052 28,950,820 49.6% 13.5% $17.68 $511,892 12.8% $537 $1.47> 60% < 80% 460 66,242,871 46,903,739 70.8% 21.8% $18.57 $870,791 21.7% $1,893 $1.55
> 80% 1,141 126,502,082 112,051,378 88.6% 52.2% $19.49 $2,184,304 54.6% $1,914 $1.62TOTAL 1 3,702 575,946,486 214,679,411 37.3% 100.0% $18.65 $4,004,178 100.0% $1,082 $1.55
Source: New Jersey Department of Environmental Land Use 2002 $4,004,178 100.0%1 Grand Total excluding wetlands, waterways, forest, major roads (except the NJ Turnpike), bridges and phragmites urban areas.
Amount differential between residential categories = 5%
CONFIDENTIAL
89
JULY, 2007
V.V. RECOMMENDATIONS RECOMMENDATIONS
Given the major flooding problems currently facing the municipalities of the
Meadowlands District, and the potential for an increase in the number of flooding
issues in the future, we conclude that it would be beneficial to establish an independent
Stormwater Utility to manage District-wide stormwater flows.
AA.. BBEENNEEFFIITTSS OOFF AA SSTTOORRMMWWAATTEERR UUTTIILLIITTYY IINN TTHHEE DDIISSTTRRIICCTT
A Stormwater Utility would benefit the Meadowlands District by:
1. Improving the region’s economic vitality through reduction of business
interruption due to commercial downtime resulting from avoidable flooding events
2. Dealing more effectively and efficiently with stormwater flows on a District-wide
basis and providing BMP information to municipalities and property owners
3. Providing more frequent maintenance for the District’s existing stormwater
infrastructure to ensure it is in consistent operational condition
4. Establishing the ability to obtain funding required for needed long-term capital
improvements in the District’s stormwater infrastructure
5. Providing a stable and dedicated funding stream to pay for District stormwater
infrastructure improvements, and by independently ranking District-wide
infrastructure priorities
6. Having a single entity with the ability to coordinate with the appropriate
regulatory agencies and permitting authorities, thus improving the District’s ability
to respond to flooding issues
7. Establishing a long-term planning process to address flooding issues, which will
potentially become more complicated if sea levels continue to rise
CONFIDENTIAL
90

JULY, 2007
BB.. IISSSSUUEESS TTOO BBEE AADDDDRREESSSSEEDD IINN EESSTTAABBLLIISSHHIINNGG AA SSTTOORRMMWWAATTEERR UUTTIILLIITTYY
Major questions to be addressed in forming a District Stormwater Utility include:
1. Determining the controlling authority(s) - should the NJMC be the controlling
authority, and if so, what regulatory changes, if any, would be prudent?
2. Formulation of an appropriate fee structure for the variety of District land use
types, including a Credit Program and determination of whether there are any
properties exempted from the utility fee
3. Deciding whether and/or how to integrate portions of District municipalities,
which lie outside of the District boundaries, into the activities and/or fee structure
of a District Stormwater Utility
4. CSOs - Municipal initiatives to separates the existing CSOs should be integrated
with existing stormwater infrastructure to ensure that changes in hydrological flows
post-separation have no negative affects on the District flood problems.
CC.. FFIINNAANNCCIIAALL PPLLAANNNNIINNGG IISSSSUUEESS
This feasibility study was performed to provide preliminary guidance to the NJMC to
engage in stakeholder discussions about organizing a Stormwater Utility for the
Meadowlands District. To implement this feasibility study most effectively the
following recommendations are important:
1. Development of Key Policies: The final acceptable rate methodology will depend
on policies developed through in-depth stakeholder meetings. Critical questions
to be decided include: should any category of properties be excluded from
Stormwater Utility fees, definition of user categories, adoption of a rate formula,
approval of a fee-reduction Credit Program, determination of penalty situations
and fees.
CONFIDENTIAL
91

JULY, 2007
2. Verification of Parcel Information: Before a final fee methodology and rates can
be determined, individual parcel information would need to be fully verified. It
is standard procedure to verify parcel information in the field when
implementing a Stormwater Utility. Information utilized in this study was
provided by the NJMC and the NJDEP based on GIS and partial tax code data.
3. Conduct an In-Depth Rate Study: As noted in this report, the estimated revenue
and resulting rates were simply based on preliminary estimates of service costs.
As part of the implementation process, an in-depth rate study needs to be
conducted to properly assess revenue capacity. This should include: stakeholder
involvement to establish rate and service policies; identification of secondary
funding sources; definition of the service area and verification of property data
(See Appendix 2).
4. Research & Secure Funding Sources: Identifying alternative funding sources will
be important to provide support for needed capital projects and the start-up
costs of a Stormwater Utility in the District. Alternative funding can help
mitigate the cost burden on the District rate payers.
5. Assess Billing Options & Costs: While excluded by the NJMC from the scope of
this Feasibility Study, the costs for administration and billing options of a
stormwater utility need to be evaluated in detail. The NJMC has established
financial systems with the 14 District municipalities for other purposes, and these
existing systems should be considered for billing purposes, as well as other
billing alternatives customary in the industry.
CONFIDENTIAL
92
JULY, 2007
VVII .. BBAACCKKGGRROOUUNNDD,, EENNGGIINNEEEERRIINNGG,, && FFIINNAANNCCIIAALL RREEFFRREENNCCEESS CCIITTEEDD
1. AMEC. Town of Chapel Hill Stormwater Management Program Funding Analysis, Cost of Service and Rate Analysis. Section 5 Rate Study pg. 50.
2. Black and Veatch Corporation, “Stormwater Utility Survey, 2001-2002.” Data complied by AMEC.
3. CASQA. California Stormwater Quality Association, 2003. California Stormwater BMP Handbook. January, 2003.
4. Columbia University 2007. http://www.ccsr.columbia.edu/information/hurricanes
5. Cooper, Matthew J.P, M.D. Beevers, and M. Oppenheimer. Future Sea Level Rise and the New Jersey Coast- Assessing Potential Impacts and Opportunities. Science, Technology and Environmental Policy Program, Woodrow Wilson School of Public and International affairs, Princeton University, November 2005
6. Debo, Thomas N. and Andrew Reese, 2002. Municipal Stormwater Management. CRC Press, November 2002
7. Florida Stormwater Association. “Establishing a Stormwater Utility in Florida. 2003.
8. Institute for Water Resources, a division of the American Public Works Association, “Urban Stormwater Management,” 1991.
9. Lenhart, James H. and R. Harbaugh, 2000. Maintenance of Stormwater Quality Treatment Facilities., http://www.stormwaterinc.com/pdfs/maintenance_facil.pdf, September 13, 2000.
10. Mineart, P. and S. Singh, 1994. Storm Inlet Pilot Study. Alameda County Urban runoff Clean Water Program, Oakland, CA.
11. NAVD88. North American Vertical Data of 1988. USGS.
12. New Jersey Department of Environmental Protection, Recommendations for Implementation of a Stormwater Utility in New Jersey, 2005
13. New Jersey Meadowlands Commission, Hackensack Meadowlands Tide Gates Inspection Report, March 27, 2006
14. New Jersey Meadowlands Commission, Hackensack Meadowlands Floodplain Management Plan, October 24, 2005
CONFIDENTIAL
93

JULY, 2007
CONFIDENTIAL
94
15. New Jersey Meadowlands Commission. A Fishery Resource Inventory of the Lower Hackensack River within the Hackensack Meadowlands District: A Comparative Study 2001-2003 vs. 1987-1988.
16. National Association of Flood and Stormwater management Agencies (NSFM), “Guidance for Municipal Stormwater Funding,” 2006.
17. Pioneer Valley Planning Commission (Massachusetts). “How to Create a Stormwater Utility,” 1999.
18. Psuty, N. P. and Ofiara, D. D.: 2002, coastal hazard Management, Lessons and Future Directions from New Jersey, Rutgers University Press, New Brunswick, NJ.
19. Quinn, John R., Fields of Sun and Grass, An artist’s Journal of the New Jersey Meadowlands. Rutgers University Press, 1997
20. USACE. Hudson-Raritan Estuary Environmental Restoration Feasibilty Study -Newark Bay Hackensack River/Passaic River Study Area Report. U.S. Army Corps of Engineers New York District, June 2004
21. USACE. New Jersey Hurricane Evacuation Study Draft Storm Surge Map U.S. Army Corps of Engineers Philadelphia District, June 2005
22. USACE. Hackensack Meadowlands Project Fact Sheet. U.S. Army Corps of Engineers New York District, November 2005
23. US Fish & Wildlife. Significant Habitats and Habitat Complexes of the New York Bight Watershed. 1997. http://training.fws.gov/library/pubs5/begin.htm.
24. WMA5. 2006. Watershed Management Area 5 Characterization and Assessment Final Report. Bergen County Department of Health Services. Paramus, NJ.
25. References, parcel data, GIS data, and stormwater utility reports and studies utilized for this study are available on the web site www.rerc.rutgers.edu.

VVIIII .. AAPPPPEENNDDIICCEESS
APPENDIX 1. A. FEMA MAPS (Firm Panels 245, 252-254, 256-259, 261, 263-264, 266-268, 307, 331-332)
95

B. HACKENSACK MEADOWLANDS TIDEGATE INSPECTION REPORT (PAGES 6-9, SECTION 3)
96

97

98

99

C. FEMA FLOODPLAIN MANAGEMENT (PAGES 194-196, SECTION 6)
Revisions to Meadowlands Zoning Regulations As detailed in Section 3.2, the NJMC has proposed changes to the District Zoning Regulations, N.J.A.C. 19:4. These changes were prompted by New Jersey’s NFIP Coordinator at the Bureau of Dam Safety and Flood Control, as well as comments from the Plan and Interagency Committees. These proposed changes are awaiting approval via the New Jersey Office of Administrative Law (OAL). 6.1.1. N.J.A.C. 19:4-4.4 A subsection has been proposed that requires the submission of the elevation to which floodproofing is provided in structures that require such measures. Additionally, a subparagraph has been proposed to clarify the requirement for a submittal of a licensed-professional’s certification regarding the floodproofing methods used in nonresidential structures. These changes were proposed to be consistent with FEMA’s model flood plain management regulations. 6.1.2. N.J.A.C. 19:4-8.6 The proposed changes include a revision to allow the use of vegetated channels to convey stormwater runoff. This proposed additional language provides greater flexibility to design professionals and, by permitting surface stormwater collection and conveyance systems, serves to improve the quality of stormwater runoff and to increase the likelihood of proper maintenance. Grass swales and other vegetated channels have a reported capacity to reduce the level of suspended solids in stormwater runoff. The proposed revision more specifically defines what hydrologic and hydraulic studies are necessary to verify the capacity of receiving stormwater collection systems. This proposed revision provides for uniformity in the level of detail required of design professionals to demonstrate that proposed stormwater systems will not increase downstream flooding when using an existing collection system. This revision also allows the design professional the option of not completing a capacity study provided that peak flows do not increase. An important revision mentioned in Section 3.2 is a clarification on the requirement that new development or redevelopment shall maintain existing drainage patterns. Specifically, construction may not block existing drainage systems or overland flow patterns to the detriment of neighboring properties for storms of up to the 25-year event. Page 195 Specific design criteria have also been proposed to more specifically define the expectations of the NJMC regarding the methodologies employed in submitted stormwater hydrologic and hydraulic analyses. These criteria include the following: 1. Language is clarified to specify the source of the rainfall data to be used for the development of rainfall intensities and/or rainfall depths for the 25-year design storm and the NJDEP Water Quality Storm. There is no change to the storms that must be addressed; rather, this addition is meant to assist design professionals in locating the required sources of rainfall design data. 2. The proposed description of the appropriate use of the Rational and Modified Rational Method for peak flow and peak runoff volume determination has been revised to conform with the description of in the guidance manual
100

“Standards for Soil Erosion and Sediment Control” promulgated by the New Jersey State Soil Conservation Committee. Specifically, an antecedent precipitation factor has been incorporated into the runoff coefficient and is also included in Figure 8-2. This multiplier accounts for soil saturation during larger storms, such as the 25-year event. This change will have no impact to impervious lots as the multiplier only impacts pervious cover. 3. The proposed description of allowable methodologies for developing the time of concentration for watersheds has been updated to reflect the maximum sheet flow length of 150 feet dictated by the NJDEP and the federal Natural Resources Conservation Service (NRCS). This proposed revision is minor and merely clarifies the maximum sheet flow length that was established by the NRCS in 1993. The clarification differentiates between a maximum sheet flow length of 150 feet for paved surfaces and 100 feet for vegetated surfaces. 4. Language is proposed regarding pressure flow. Specifically, stormwater pipe is not typically designed to carry stormwater under pressure, as pipe joints may open up. The proposed addition states that stormwater pipe systems may not operate under pressure unless justified by the design professional and approved by the NJMC. 5. Language is added to clarify the hydraulic calculations required when a stormwater outfall is in tidal waters. Specifically, a statement has been added that the backwater condition generated by the mean high water (MHW) in tidally-influenced waters needs to be analyzed. This statement clarifies to the design professional the appropriate tailwater elevation to be analyzed in conjunction with tidal areas that require tide gates.age 196 6.2 Open Space Priorities The NJMC reviewed the location of vacant lands in the District in conjunction with the 25-year floodplain. The data nodes from the 2005 Bergen County Flood Insurance Study, effective September 30, 2005, include only the 10-year, 50-year, 100- year and 100-year tidal surge elevations. As such, a regression was performed on each of the study’s nodes by the NJMC following receipt of the report from FEMA to interpolate, as accurately as possible, the 25-year surge elevation. The data was then converted from NGVD29 to NAVD88. These data points were then modified, with high-resolution digital topographic data and ArcMap GIS software, into a boundary map of the extents of the 25-year flood area. A layer of the vacant lands was projected through the above boundaries to identify Properties of Interest (POI). POIs that were eliminated included sites smaller in size that 0.15 acres, properties owned by the NJMC, and isolated properties. The findings are presented below in Table 6-x. Note that this table represents the initial step in identifying properties beneficial to the goals listed in Section 5.0 and will need to be further refined and updated with this Plan on a regular basis. Preference should be placed on wetland areas and properties bordering established wetlands based upon the demonstrated ability of such features to reduce flooding, provide critical habitat, and improve overall water quality. Note that the NJMC adopted a Master Plan in January 2004 that protects 8,400 undeveloped acres of wetlands within the District.
101

TABLE A.
NJMC - Est. Stormwater Operating & Maintenance Costs 4/26/07
O+M of ExistingAnnual
Staff Salaries No. People Salary Salary Fringe CostsDirector 1 $100,000 $100,000 33% $133,000Supervisory Stormwater Engineer 1 $90,000 $90,000 33% $119,700Stormwater Engineer 1 $65,000 $65,000 33% $86,450Stormwater Engineer 0 $0 $0 33% $0Flood proof expert 0 $0 $0 33% $0Flood proof assistant 0 $0 $0 33% $0GIS Specialist 1 $45,000 $45,000 33% $59,850Maintenance specialist 0 $0 $0 33% $0Maintenance specialist 0 $0 $0 33% $0Equipment operator 9 $38,000 $342,000 33% $454,860Technician 2 $30,000 $60,000 33% $79,800Administrative Assistant 1 $45,000 $45,000 33% $59,850Accounting Manager 1 $60,000 $60,000 33% $79,800Contract administrator 0 $0 $0 33% $0Total 17 $807,000 $1,073,310
Administration / Overhead 10.0% (b) $181,257
Repairs and Maintenance No. of Units Cost/unit Catch basins $15,000 Stormsewer repair $20,000 Tide gates $0 Implement Flood Control $0Total $35,000
Equipment Operating & Maintenance No. of Units Cost/unit Vactor Truck O&M 6 $15,000 $90,000 Lg. Sweeper O&M 10 $15,000 $150,000 Sm. Sweeper O&M 4 $7,500 $30,000 Video Camera Truck O&M 0 $0 $0 Jet Truck O&M 0 $0 $0 Backhoe O&M 0 $0 $0 Dump Truck O&M 0 $0 $0 Pickup Truck O&M 0 $0 $0Total $270,000
VehicleEquipment Capex No. of Units Cost Vactor Trucks 6 $150,000 $900,000 (a)
Large sweepers (regenerative air) 10 $150,000 $1,500,000 Small sweepers 4 $30,000 $120,000 Portable Pumps 4 $2,500 $10,000 Video camera truck 0 $0 $0 Jet truck 0 $0 $0 Backhoe 0 $0 $0 Dump Truck 0 $0 $0 Pickup Truck 0 $0 $0Total $2,530,000Annual Capitalization 10 years $253,000
No. of AcresTotal Annual Cost $1,812,567 10,000AssumptionsSemi-Annual cleanout of catchbasins 5,000 NJMC owns and operates equipmentWeekly street sweeping Annual inspection of tide gates and pumpsDevelopment acres 10,000 Repair of catch basins(a) Assumes 750-1000 catch basins Repair of sewers and ditch cleaningcleaned per year per truck. Replacement/repair of 1+ tide gate or pump per year(b) Estimate from the NJMC April 2007.
102
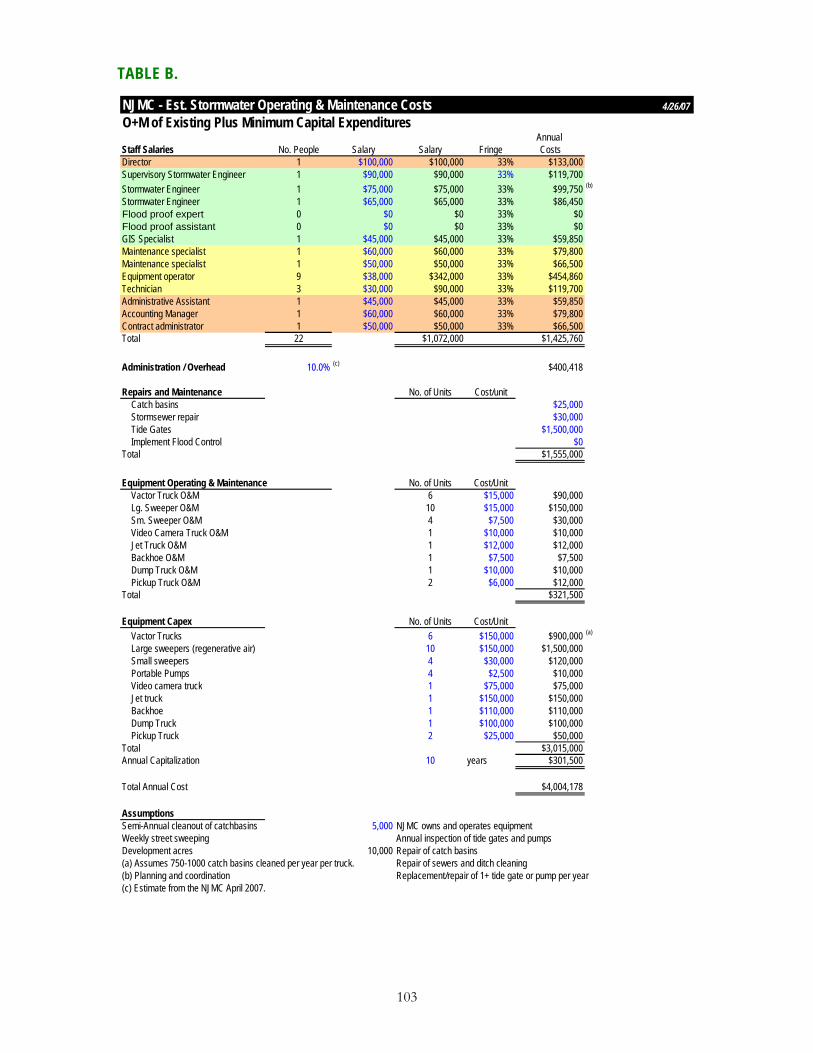
TABLE B.
NJMC - Est. Stormwater Operating & Maintenance Costs 4/26/07O+M of Existing Plus Minimum Capital Expenditures
Annual Staff Salaries No. People Salary Salary Fringe CostsDirector 1 $100,000 $100,000 33% $133,000Supervisory Stormwater Engineer 1 $90,000 $90,000 33% $119,700Stormwater Engineer 1 $75,000 $75,000 33% $99,750 (b)
Stormwater Engineer 1 $65,000 $65,000 33% $86,450Flood proof expert 0 $0 $0 33% $0Flood proof assistant 0 $0 $0 33% $0GIS Specialist 1 $45,000 $45,000 33% $59,850Maintenance specialist 1 $60,000 $60,000 33% $79,800Maintenance specialist 1 $50,000 $50,000 33% $66,500Equipment operator 9 $38,000 $342,000 33% $454,860Technician 3 $30,000 $90,000 33% $119,700Administrative Assistant 1 $45,000 $45,000 33% $59,850Accounting Manager 1 $60,000 $60,000 33% $79,800Contract administrator 1 $50,000 $50,000 33% $66,500Total 22 $1,072,000 $1,425,760
Administration / Overhead 10.0% (c) $400,418
Repairs and Maintenance No. of Units Cost/unit Catch basins $25,000 Stormsewer repair $30,000 Tide Gates $1,500,000 Implement Flood Control $0Total $1,555,000
Equipment Operating & Maintenance No. of Units Cost/Unit Vactor Truck O&M 6 $15,000 $90,000 Lg. Sweeper O&M 10 $15,000 $150,000 Sm. Sweeper O&M 4 $7,500 $30,000 Video Camera Truck O&M 1 $10,000 $10,000 Jet Truck O&M 1 $12,000 $12,000 Backhoe O&M 1 $7,500 $7,500 Dump Truck O&M 1 $10,000 $10,000 Pickup Truck O&M 2 $6,000 $12,000Total $321,500
Equipment Capex No. of Units Cost/Unit Vactor Trucks 6 $150,000 $900,000 (a)
Large sweepers (regenerative air) 10 $150,000 $1,500,000 Small sweepers 4 $30,000 $120,000 Portable Pumps 4 $2,500 $10,000 Video camera truck 1 $75,000 $75,000 Jet truck 1 $150,000 $150,000 Backhoe 1 $110,000 $110,000 Dump Truck 1 $100,000 $100,000 Pickup Truck 2 $25,000 $50,000Total $3,015,000Annual Capitalization 10 years $301,500
No. of Acres Per Acre CostTotal Annual Cost $4,004,178 10,000 $400
AssumptionsSemi-Annual cleanout of catchbasins 5,000 NJMC owns and operates equipmentWeekly street sweeping Annual inspection of tide gates and pumpsDevelopment acres 10,000 Repair of catch basins(a) Assumes 750-1000 catch basins cleaned per year per truck. Repair of sewers and ditch cleaning(b) Planning and coordination Replacement/repair of 1+ tide gate or pump per year(c) Estimate from the NJMC April 2007.
103

TABLE C.
NJMC - Est. Stormwater Operating & Maintenance Costs 4/26/07O+M of Existing Plus Maximum Capital Expenditures
Annual Staff Salaries No. People Salary Salary Fringe CostsDirector 1 $100,000 $100,000 33% $133,000Supervisory Stormwater Engineer 1 $90,000 $90,000 33% $119,700Stormwater Engineer 1 $75,000 $75,000 33% $99,750 (b)
Stormwater Engineer 2 $65,000 $130,000 33% $172,900 (c)
Flood proof expert 1 $75,000 $75,000 33% $99,750Flood proof assistant 1 $50,000 $50,000 33% $66,500GIS Specialist 1 $45,000 $45,000 33% $59,850Maintenance specialist 1 $60,000 $60,000 33% $79,800Maintenance specialist 2 $50,000 $100,000 33% $133,000Equipment operator 9 $38,000 $342,000 33% $454,860Technician 4 $30,000 $120,000 33% $159,600 (c)
Administrative Assistant 1 $45,000 $45,000 33% $59,850Accounting Manager 1 $60,000 $60,000 33% $79,800Contract administrator 1 $50,000 $50,000 33% $66,500Total 27 $1,342,000 $1,784,860
Administration / Overhead 10.0% (d) $666,707
Repairs and Maintenance No. of Units Cost/unit Catch basins $25,000 Stormsewer repair $30,000 Tide Gates $0 Implement Flood Control $3,500,000Total $3,555,000
Equipment Operating & Maintenance No. of Units Cost/Unit Vactor Truck O&M 6 $15,000 $90,000 Lg. Sweeper O&M 10 $15,000 $150,000 Sm. Sweeper O&M 4 $7,500 $30,000 Video Camera Truck O&M 1 $10,000 $10,000 Jet Truck O&M 1 $12,000 $12,000 Backhoe O&M 1 $7,500 $7,500 Dump Truck O&M 2 $10,000 $20,000 Pickup Truck O&M 4 $6,000 $24,000Total $343,500
Equipment Capex No. of Units Cost/Unit Vactor Trucks 6 $150,000 $900,000 (a)
Large sweepers (regenerative air) 10 $150,000 $1,500,000 Small sweepers 4 $30,000 $120,000 Portable Pumps 6 $2,500 $15,000 Video camera truck 1 $75,000 $75,000 Jet truck 1 $150,000 $150,000 Backhoe 1 $110,000 $110,000 Dump Truck 2 $100,000 $200,000 Pickup Truck 4 $25,000 $100,000Total $3,170,000Annual Capitalization 10 years $317,000
No. of Acres er Total Annual Cost $6,667,067 10,000 #AssumptionsSemi-Annual cleanout of catchbasins 5,000 NJMC owns and operates equipmentWeekly street sweeping Annual inspection of tide gates and pumpsDevelopment acres 10,000 Repair of catch basins(a) Assumes 750-1000 catch basins cleaned per year per truck. Repair of sewers and ditch cleaning(b) Planning and coordination Replacement/repair of 1+ tide gate or pump per year(c) Includes a water quality specialist. Implementation of Flood control Plan over 10 years(d) Estimate from the NJMC April 2007.
104

TABLE D.
Relevant Caselaw from Other States
Caveat: this is not an exhaustive review of the decisional law in all 50 states, and of course does not address the arguably more relevant statutory law.
Case State Year Criteria
Distinguishing Tax vs. Fee
Holding
Carson v. City of Fort Lauderdale, 244 So.2d 485 (Fla. App. 1971)
Florida 1971 Benefit to Landowner
In consolidated cases, the court held that (1) assessments for sanitary sewers were imposed on all property in the sanitary sewer district on a square-foot basis was proper and the assessments did not exceeded the benefits to the property and (2) assessments for stormwater facilities were valid because all properties in the assessment district benefited, even those that benefited indirectly because they were on higher ground that had good percolation.
Long Run Baptist Ass’n Inc. v. Louisville and Jefferson County Metro. Sewer Dist, 775 S.W.2d 520 (Ky. App. 1989)
Kentucky 1989 Benefit to Landowner
The court held that stormwater sewer charge was not a tax but was a valid fee for services. Benefits do not have to be precisely quantifiable; any property in a particular watershed can be said to have derived an indirect benefit from the stormwater system if there is an overall improvement in health, comfort, convenience and enhanced property values. Service charges do not have to be uniform.
City of Wooster v. Graines, 556 N.E.2d 1163 (Ohio 1990)
Ohio 1990 Proportionality The court held that stormwater rates may generate surplus funds as long as the excess money is not diverted for other purposes.
105

City of Boca Raton v. State, 595 So.2d 25 (Fla. 1992)
Florida 1992 Benefit to Landowner;
Proportionality
The court found that stormwater fee was not an illegal tax, because cities having home rule authority in Florida are not necessarily limited to statutory procedure for imposing special assessments, but could devise their own systems by local ordinance. With that preliminary issue out of the way, the court upheld the validity of an assessment for the costs of a redevelopment district, measured by the increase in the assessed property value as a result of the project.
Dennehy v. City of Gresham, 12 OTR 194 1992 WL 89901 (Or. Tax 1992)
Oregon 1992 Voluntariness The court found the fee invalid because owners could only avoid the fee by removing all impervious surfaces.
Sarasota County v. Sarasota Church of Christ, Inc., 667 So. 2d 180 (Fla. 1995)
Florida 1995 Voluntariness;
Proportionality;
Benefit to Landowner
The Court found the stormwater fees were not taxes and that all of the specially-assessed properties, including the Church, “burdened” the stormwater system. The court concluded that stormwater utility services provided special benefit to developed properties within service area of stormwater facility, and that assessment was valid because it applied to those that contributed most of the stormwater runoff and not to undeveloped property, and the properties assessed received a benefit from the service. NB: This case blurs the historic distinction between user fees (commensurate with burden) and special assessments (commensurate with benefit).
106

Kentucky River Auth. v. City of Danville, 932 S.W. 2d 374 (Ky. App. 1996).
Kentucky 1996 Benefit to Landowner
The court held that fee assessed by Authority was not unconstitutional tax. It was related to benefit received by city through efforts of Authority to preserve Kentucky River water basin, and benefits do not have to be precisely quantifiable. Any property in a particular watershed can be said to have derived an indirect benefit from the stormwater system if there is an overall improvement in health, comfort, convenience and enhanced property values.
Harris v. Wilson, 693 So.2d 945 (Fla. 1997)
Florida 1997 Benefit to Landowners;
Proportionality
In a challenge involving an assessment for solid waste collection from an unincorporated part of a town, the court rejected claim that it was an invalid tax, and held that assessed properties specially benefited from assessment, and assessment was properly apportioned.
Lake County v. Water Oak Management Corp., 695 So.2d 667 (Fla. 1997)
Florida 1997 Benefit to Landowner
The court upheld a special assessment for fire protection services because the properties assessed received a special benefit through lower insurance premiums and enhanced property values.
Bolt v. City of Lansing, 587 N.W. 2d 264 (Mich. 1998)
Michigan 1998 Benefit to Landowner;
Voluntariness
The court rejected a new stormwater charge, holding that it was an invalid tax because it applied to all owners and not only those who would benefit from the stormwater system. Property owners had no choice whether to use the service and were unable to affect the level of their fee except by building less on their land.
107

Smith Chapel Baptist Church v. City of Durham, 517 S.E. 2d 874 (N.C. 1999)
North Carolina
1999 Proportionality;
Use of Fees
The court rejected a stormwater fee as invalid because the charges were not completely directed towards or used for maintaining, planning or implementing a stormwater facility.
Collier County v. State, 733 So.2d 1012 (Fla. 1999)
Florida 1999 Benefit to Landowner
The court rejected fees for general government services as an invalid tax because the general services were provided to all other citizens and properties and hence there was no "special" assessable benefit. The "interim government services fee" in question was designed to recoup the costs of services to newly-developed property during the period (often more than a year) before property taxes can be collected. The “fee” was clearly designed to substitute for lost taxes and was applied to many municipal services.
City of Gainesville v. State of Florida Department of Transportation, 778 So. 2d 519 (Fla. App. 2001)
Florida 2001 Benefit to Landowner;
Voluntariness
The court rejected a claim by the state that a municipality’s stormwater utility ordinance imposed a “special assessment” from which state properties are exempt. Rather, the voluntary nature of the charges was characteristic of user fees, which are not subject to sovereign immunity.
108

Densmore v. Jefferson County, 813 So. 2d 844 (Ala. 2001)
Alabama 2001 Benefit to Landowner
The court upheld a stormwater fee even for those not receiving a direct benefit from the stormwater system because “the pollution of [public] waters and the beneficial results to be obtained by the elimination of the pollution will be a public benefit to the entire community.” The county's fee to fund storm water management program was not a “tax” designed to raise revenue.
Howard Jarvis Taxpayers Ass'n v. City of Salinas, 121 Cal. Rptr.2d 228 (Cal. App. 2002)
California 2002 Voluntariness The court rejected a stormwater charge that applied to every developed piece of land and was. Not measured by usage. The fee was not a “fee related to sewer and water services,” and thus did not fall into the exception to the voter-approval requirements for new taxes.
City of Gainesville v. State, 863 So.2d 138 (Fla. 2003)
Florida 2003 Voluntariness;
Proportionality
The court upheld the application of a stormwater charge to the State and Department of Transportation because it was a user fee, not a special assessment. The charges were on a monthly basis and depended on usage. The court also found that the fee structure was reasonable, as it was based on the amount of impervious area on each property.
McLeod v. Columbia County, 599 S.E.2d 152 (Ga. 2004)
Georgia 2004 Benefit to Landowner;
Proportionality
The court upheld a stormwater charge. It is not a tax because it applies to residential and non-residential developed property, but not to undeveloped property. The properties charged received a benefit from the services, and the charge was properly apportioned based primarily on impervious surface.
109

110
APPENDIX 2. A. FINANCIAL ASSUMPTIONS NEEDED
List of financial and operating assumptions requiring further analysis to prepare a long-term financial forecast and compatible rate study:
1. Program policies regarding land use class exclusions, credit programs, surcharges, fee methodology, included territories, base rate, etc.
2. Program growth rates, such as the amount of development and impervious area, as well as, inflation and increased regulation
3. Other operating expenses, such as professional services (e.g. legal, accounting, consulting), administrative, billing, insurance, utilities, supplies, education, marketing and bad debt expenses
4. Alternative financing sources available and relative funding costs (i.e. issuance and interest costs)
5. Contingency reserves, mandatory fund balances, and maintenance funds
6. Utility rate increase policies
7. Revenue reductions from Credit Programs