draft shipston-on-stour visitor survey report 2012 visitor survey 2012 3 2.0 summary of results 2.1...
TRANSCRIPT
SHIPSTON-ON-STOUR
VISITOR SURVEY 2012
FINAL REPORT
Produced by:
Stratford-on-Avon District Council
Consultation Unit
December 2012
CONTENTS Page
1.0 Introduction
1.1 Background 1
1.2 Sample/Methodology 1
1.3 Statistical Reliability 2
1.4 Definitions 2
2.0 Summary of Results
2.1 Characteristics of Visit 3
2.2 Attitudes towards Shipston 5
3.0 Characteristics of Visit
3.1 Main Reason for Visiting Shipston 7
3.2 Where Respondents Live 8
3.3 Employment Status 9
3.4 Socio-Economic Groupings 9
3.5 Type of Visitor 10
3.6 Group Size & Composition 11
3.7 Gender 11
3.8 Age 12
3.9 Come from Home Today 12
3.10 Going Home Following Visit 13
3.11 Staying Overnight 13
3.12 Where Respondents Stay Overnight 14
3..13 First or Repeat Visit 14
3.14 Length of Stay 15
3.15 Travelling to Shipston 15
3.16 Main Reasons for Visiting Shipston 16
3.17 Other Reasons for Visiting Shipston 16
3.18 Events/Festivals 17
3.19 Spending 18
4.0 Attitudes Towards Shipston
4.1 The Shops 19
4.2 Places to Eat and Drink 20
4.3 Museums and Other Places to Visit in Town 22
4.4 Ease of Finding Way Around 22
4.5 Cleanliness of the Streets 24
4.6 Public Toilets 24
4.7 Visitor Information 25
4.8 Parking 25
4.9 Atmosphere in Shipston Town 26
4.10 Feeling Safe and Getting Around 26
4.11 Overall Enjoyment 27
4.12 Recommending Shipston to Someone Else 27
4.13 What Visitors Like 29
4.14 What spoilt the visit 30
4.15 Additional Facilities Required in Shipston 30
5.0 Attitudes – Importance versus Satisfaction
5.1 Importance vs Satisfaction 31
APPENDICES
Appendix 1: Other main reason for visiting Shipston
Appendix 2: Other reasons for visiting Shipston
Appendix 3: Name of the event / Festival visited in Shipston
Appendix 4: Why would not recommend Shipston to someone else
Appendix 5: What additional facilities or services would have added to the enjoyment of
your visit to Shipston?
Shipston-on-Stour Visitor Survey 2012 1
1.0 Introduction
1.1 Background
The survey took place during the peak visitor period from the middle of July 2012 until the
end of September 2012. Comparisons with the previous survey in 2007 are included.
The survey took place in order to:-
•••• Provide basic data on the profile, origin, behaviour, use of facilities and opinions of
visitors to Shipston to help improve understanding of tourism within the town.
•••• Ensure that marketing campaigns are properly focused and allow their effectiveness to
be monitored.
•••• Identify the main reasons why visitors come to Shipston and their particular likes and
dislikes.
The findings of the visitor survey research which took place in Shipston are detailed in this
report.
1.2 Sample/Methodology
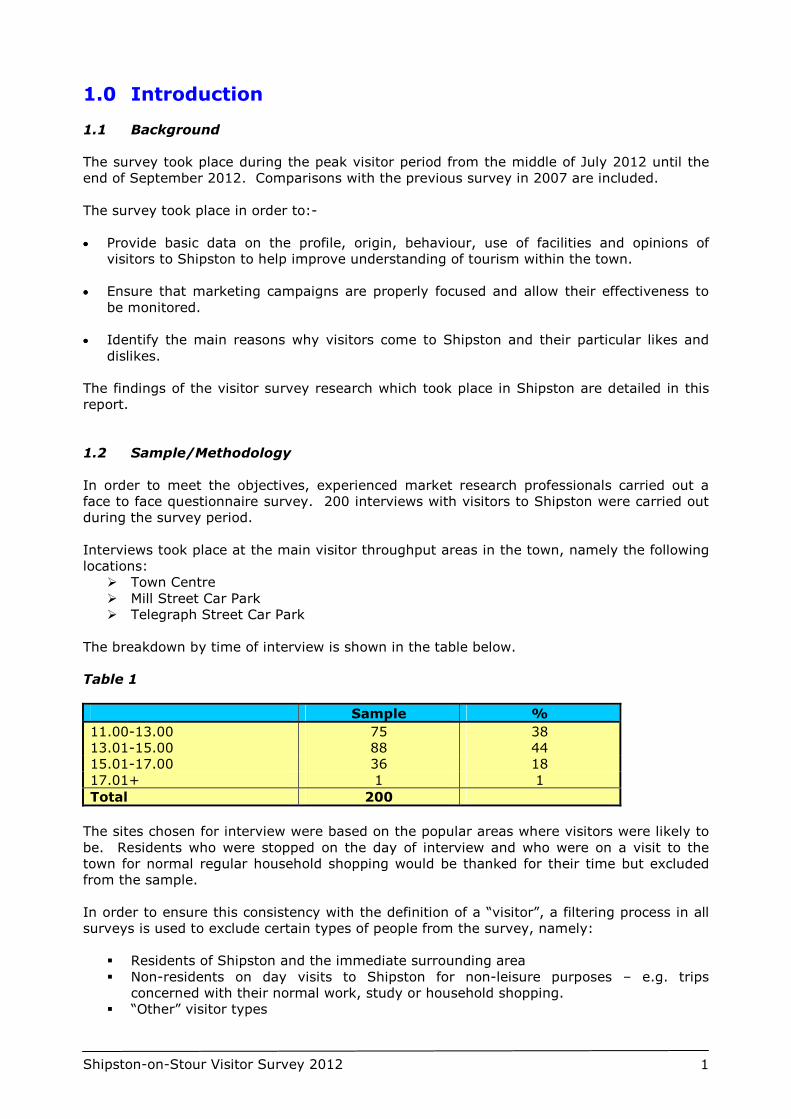
In order to meet the objectives, experienced market research professionals carried out a
face to face questionnaire survey. 200 interviews with visitors to Shipston were carried out
during the survey period.
Interviews took place at the main visitor throughput areas in the town, namely the following
locations:
� Town Centre
� Mill Street Car Park
� Telegraph Street Car Park
The breakdown by time of interview is shown in the table below.
Table 1
Sample %
11.00-13.00 75 38
13.01-15.00 88 44
15.01-17.00 36 18
17.01+ 1 1
Total 200
The sites chosen for interview were based on the popular areas where visitors were likely to
be. Residents who were stopped on the day of interview and who were on a visit to the
town for normal regular household shopping would be thanked for their time but excluded
from the sample.
In order to ensure this consistency with the definition of a “visitor”, a filtering process in all
surveys is used to exclude certain types of people from the survey, namely:
� Residents of Shipston and the immediate surrounding area
� Non-residents on day visits to Shipston for non-leisure purposes – e.g. trips
concerned with their normal work, study or household shopping.
� “Other” visitor types
Shipston-on-Stour Visitor Survey 2012 2
Because satisfaction surveys rely on visitors having used or experienced a particular service
or facility, interviewing was not conducted before 11 am, and only those who were at least
half way through their visit were interviewed.
The survey was conducted on a simple random basis and interviewers asked “the next
person to pass” if they would participate. If the interviewee was a resident of Shipston, the
interview was terminated after question one. Questions were designed to take into account
the fact that visitors could be at the middle or end of their current trip and therefore
respondents were asked questions which involved making predictions for future actions, i.e.
spending later on the trip, using facilities or services later on, etc.
It is acknowledged that on-site visitor surveys are liable to under-count certain sections of
the visitor market, for instance coach parties, business visitors and overseas visitors. In the
case of overseas visitors, under counting may occur where a problem arises in translation, in
the interpretation of questions and in some cases a reluctance to become involved with what
appear to be officials/government.
The term “base” in the tables and charts refer to the number of responses to a particular
question.
1.3 Statistical Reliability
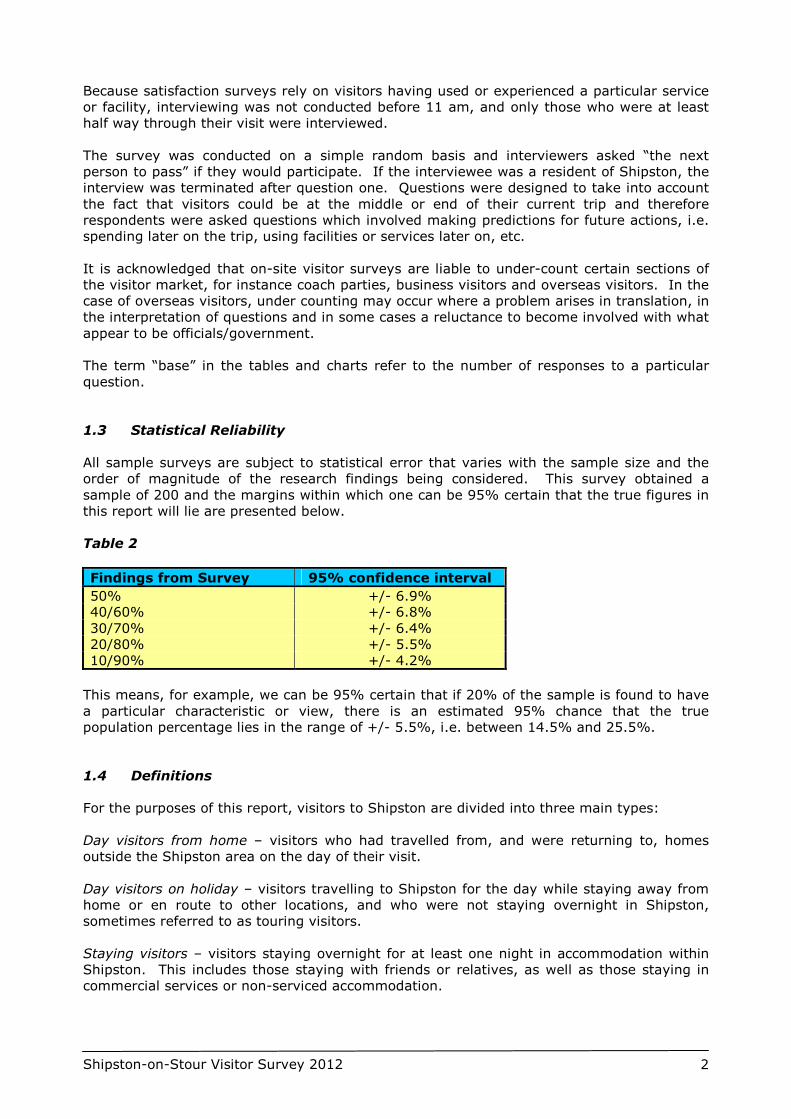
All sample surveys are subject to statistical error that varies with the sample size and the
order of magnitude of the research findings being considered. This survey obtained a
sample of 200 and the margins within which one can be 95% certain that the true figures in
this report will lie are presented below.
Table 2
Findings from Survey 95% confidence interval
50% +/- 6.9% 40/60% +/- 6.8%
30/70% +/- 6.4%
20/80% +/- 5.5%
10/90% +/- 4.2%
This means, for example, we can be 95% certain that if 20% of the sample is found to have
a particular characteristic or view, there is an estimated 95% chance that the true
population percentage lies in the range of +/- 5.5%, i.e. between 14.5% and 25.5%.
1.4 Definitions
For the purposes of this report, visitors to Shipston are divided into three main types:
Day visitors from home – visitors who had travelled from, and were returning to, homes
outside the Shipston area on the day of their visit.
Day visitors on holiday – visitors travelling to Shipston for the day while staying away from
home or en route to other locations, and who were not staying overnight in Shipston,
sometimes referred to as touring visitors.
Staying visitors – visitors staying overnight for at least one night in accommodation within
Shipston. This includes those staying with friends or relatives, as well as those staying in
commercial services or non-serviced accommodation.
Shipston-on-Stour Visitor Survey 2012 3
2.0 Summary of Results
2.1 Characteristics of visit
Main reason for visiting Shipston-on-Stour
� Six out of ten visitors (57%) were on a leisure trip/holiday visit, which represented a
decrease of 11 percentage points from 2007. Almost a quarter (23%) were on a special
shopping trip. Exactly one fifth (20%) were visiting friends and relations, up 5
percentage points from the 15% registered in 2007.
Where respondents live
� 24% of visitors came from Warwickshire (down by 8 percentage points since 32% in
2007), 16% from Oxfordshire (a single percentage point less than 17% in 2007), 8%
from the West Midlands (up a single point from 2007) and 6% from Gloucestershire (2
percentage points down).
Employment status
� Almost half (46%) of visitors stated they were retired; 30% stated they were employed
full-time; 6% part-time; 12% were self-employed; 6% said they were unemployed; and
1% cited full-time student living at home.
Socio-economic groupings
� Just over a third (34%) were of the socio-economic group C1, almost a quarter (24%)
were in C2, just less than a fifth (19%) were in AB, and 23% in DE.
Type of visitor
� 60% were day visitors from home, 6 percentage points less than 2007. 30% were day
visitors on holiday, a rise of 6 points and staying visitors made up 10%.
Group size and composition
� 49% were adult couples – a rise of 12 points on 2007, 20% adults in a group, 22% were
adults on their own and 9% were adults with children (24 points less than 2007).
Age and gender profile
� 7% were in the 0-15 age category with 37% over 65. There was a 43% male / 57%
female split.
Going home following visit or staying overnight
� Over two thirds of those interviewed (67%) confirmed they had come from home today,
as opposed to 34% who had not.
� 64% were returning to home today, compared to 36% who were not.
� Of those not returning home today, (28%) stated they were staying overnight in
Shipston, as opposed to 72% who were not. In 2007, 10% of visitors indicated that they
were staying overnight in Shipston-on-Stour, representing an increase of 18 percentage
points to the current 28%.
� Almost three quarters (71%) of those staying overnight were staying at the home of a
friend / relative, which represented an increase of 9 percentage points from the 62%
Shipston-on-Stour Visitor Survey 2012 4
recorded in 2007. Furthermore, 14% stated they were staying in a hotel (8% did so in
2007) and 10% in a caravan (none in 2007).
First or repeat visit
� 30% of those surveyed said it was their first visit to Shipston-on-Stour. In 2007, 21%
were new visitors, 9 percentage points less than in 2012, and 79% were repeat visitors,
8 percentage points more than in 2012.
� Of those who had visited Shipston-on-Stour before, almost half (47%) had visited more
than five times in the last 12 months, representing a decrease of 11 percentage points
since the 58% recorded in 2007, and 28% had visited two to five times (22% in 2007).
16% however, had not visited Shipston-on-Stour in the last 12 months (14% in 2007),
and 10% had visited once (6% in 2007).
Length of stay
� On average, day visitors spent 2 hours and 2 minutes in Shipston, 23 minutes less than
2007.
Travelling to Shipston-on-Stour and parking
� Most visitors to Shipston-on-Stour (96%) used a car, van, motorcycle or motorhome as
their main form of transport, which was 3 percentage points greater than the 92% in
2007.
� Nine in ten (87%) of those who travelled to Shipston-on-Stour by car, van, motorcycle or
motorhome, found it either very easy or easy to park in the town. This represents a
single percentage point fall from the 88% figure in 2007.
� Almost three quarters of those who came by car, van, motorcycle or motorhome (73%)
did not pay for parking.
Single main reason for visiting the town
� All respondents were asked to state one main reason for visiting the town: over a
quarter (27%) cited general sightseeing / interest, and over a fifth (22%) stated
shopping / looking around the shops. 18% of those surveyed gave the reason of visiting
friends or relatives.
Other reasons for visiting the town
� Respondents were questioned as to what other reasons they were visiting: exactly three
quarters (75%) said shopping / looking around the shops.
� 28% stated somewhere for coffee / tea, over a fifth (21%) mentioned general
sightseeing / interest, and 19% somewhere for lunch.
Events / festivals
� Nine in ten (93%) of those surveyed had not visited an event / festival in Shipston-on-
Stour in the past 12 months, compared to 8% who confirmed they had.
� Of the 8% who confirmed they had attended an event / festival, 71% said it was during
the day, and 29% cited overnight.
Spending
� On average, day visitors spent an average of £16.67 in Shipston.
Shipston-on-Stour Visitor Survey 2012 5
2.2 Attitudes towards Shipston-on-Stour
The shops
� Exactly three quarters (75%) expressed satisfaction with the range of shops (of
interest to visitors), versus 4% who were dissatisfied. This represents a fall of 5
percentage points from 80% satisfaction in 2007. Dissatisfaction remained constant
across both surveys.
� Over four fifths (84%) were satisfied with the quality of goods on sale in the shops:
2 percentage points less than 2007.
� Nine in ten (88%) were very satisfied or satisfied with the quality of service in the
shops: a fall of 3 percentage points from the score in 2007.
Places to eat and drink
� 81% were satisfied with the range of places to eat and drink: 2 percentage points
higher than the 79% satisfaction figure recorded in 2007.
� 90% of visitors expressed satisfaction with the quality of food: 2 percentage points
less than in the previous survey (92%).
� Nine in ten (88%) were satisfied with the quality of service in places to eat and drink:
6 percentage points less than in 2007 (94%).
� Almost four fifths (78%) were very satisfied or satisfied with the value for money in
places to eat and drink: 3 percentage points less than 2007.
Ease of finding way around
� Regarding ease of finding way around, 84% were satisfied with the road signs, as
opposed to 2% who were dissatisfied. Current findings were a single point down on
satisfaction compared to the earlier survey.
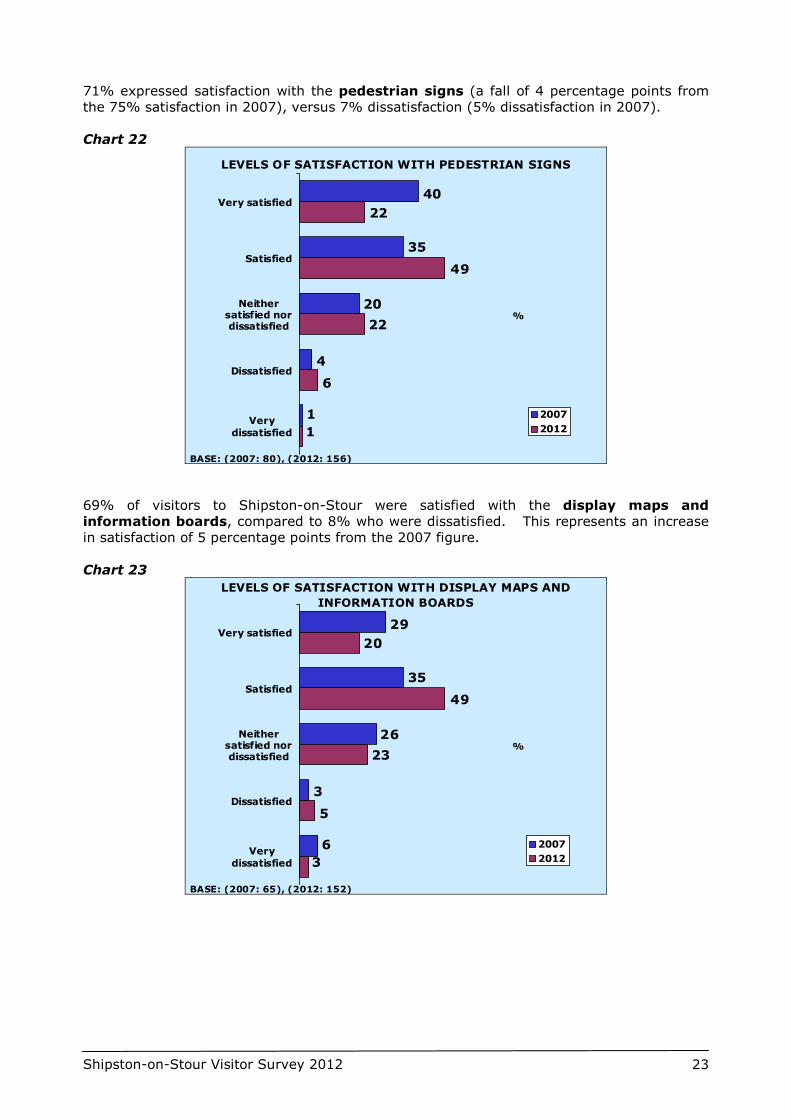
� 71% expressed satisfaction with the pedestrian signs (a fall of 4 percentage points
from the 75% satisfaction in 2007), versus 7% dissatisfaction (5% dissatisfaction in
2007).
� 69% were satisfied with the display maps and information boards, compared to 8%
who were dissatisfied. This represents an increase in satisfaction of 5 percentage points
from the 2007 figure.
Cleanliness of the streets
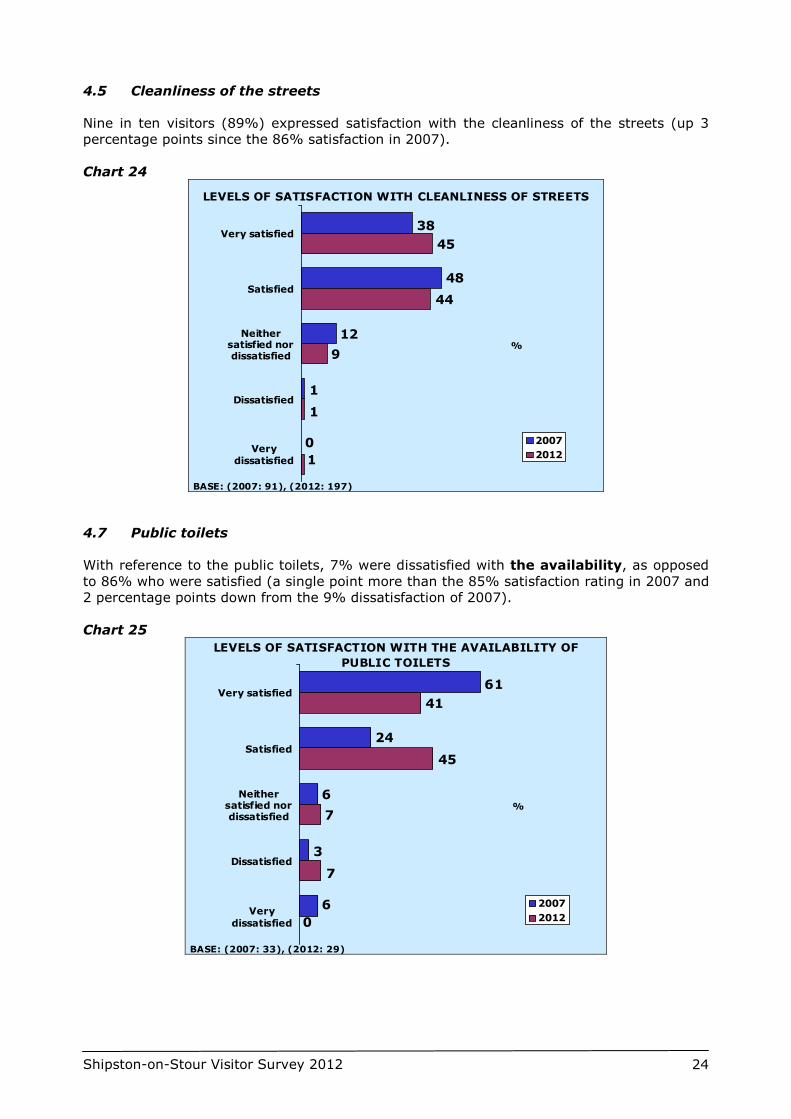
� Nine in ten (89%) expressed satisfaction with the cleanliness of the streets (3
percentage points up on 2007).
Public toilets
� With reference to the public toilets, 7% were dissatisfied with the availability, as
opposed to 86% who were satisfied (a single point more than the 85% satisfaction rating
in 2007 and 2 percentage points down from the 9% dissatisfaction of 2007).
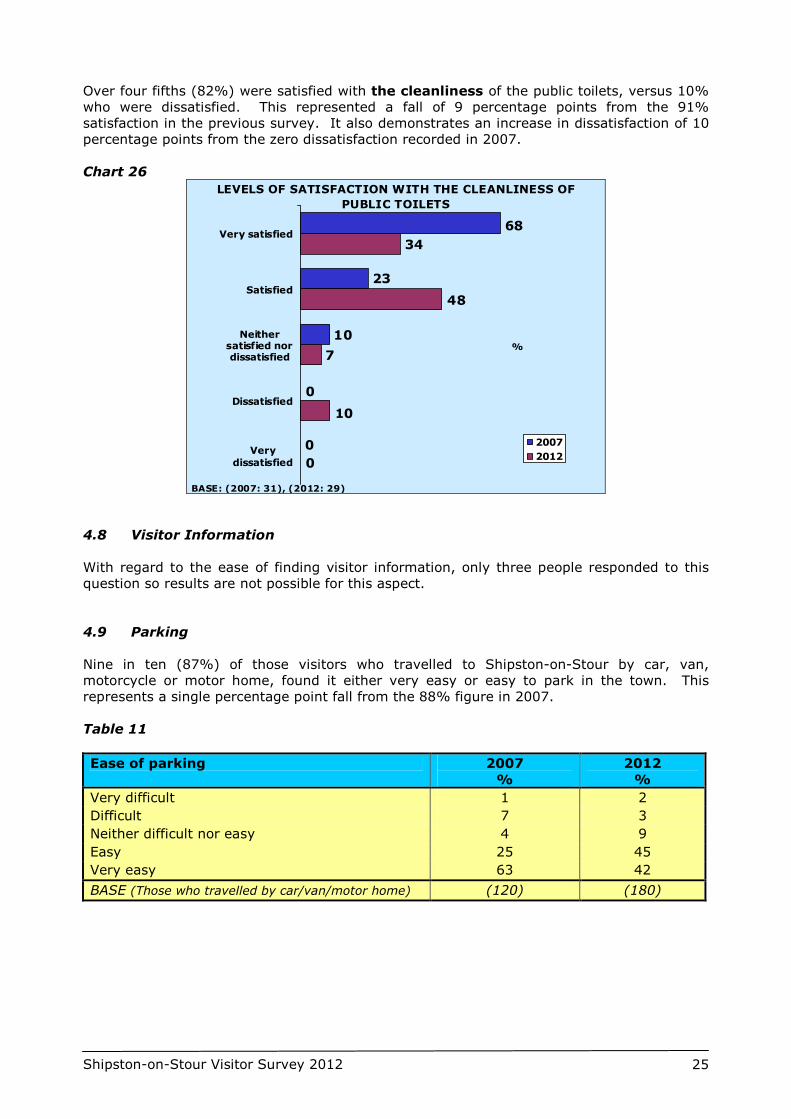
� Over four fifths (82%) were satisfied with the cleanliness of the public toilets, versus
10% who were dissatisfied. This represented a fall of 9 percentage points from the 91%
satisfaction in the previous survey. It also demonstrates an increase in dissatisfaction of
10 percentage points from the zero dissatisfaction recorded in 2007.
Shipston-on-Stour Visitor Survey 2012 6
Atmosphere in Shipston-on-Stour town
� Significantly, 94% of those surveyed expressed satisfaction with the general atmosphere
in Shipston-on-Stour town, down by 2 percentage points since 2007.
Feeling of welcome
� 90% were satisfied with the feeling of welcome in the town with 2% dissatisfaction in
2012.
General appearance
� Across both surveys, 93% were very satisfied or satisfied with the general appearance of
the town, with 2% dissatisfied in 2012, compared to none in 2007.
Feeling safe from crime
� Nearly all (94%) were in agreement with the statement that they felt quite safe from
crime in Shipston-on-Stour town, versus 2% disagreement. Agreement was a single
percentage point less than the 95% recorded in 2007.
Feeling safe from traffic
� Almost three quarters (74%) agreed or agreed strongly that as a pedestrian in Shipston-
on-Stour town they felt quite safe from traffic. 76% felt this way in 2007, representing a
fall of 2 percentage points across the two surveys. In 2012, 7% disagreed versus 8%
disagreement in 2007.
Getting around Shipston-on-Stour by car
� Almost three quarters (72%) agreed that they found it easy to get around Shipston-on-
Stour town by car, as opposed to 6% who disagreed.
Overall enjoyment
� Over four fifths (81%) rated their overall enjoyment as either high or very high, 16%
said average, and 3% stated low. In 2007, 84% rated their overall enjoyment as either
high or very high, representing a decrease of 3 percentage points over the 5 years. In
2012, 3% stated low, compared to none in 2007.
Recommending Shipston-on-Stour to someone else
� 86% of those surveyed confirmed they were either very likely or likely to recommend
Shipston-on-Stour town to someone else, 10% said possibly, and 5% said either unlikely
or very unlikely. This represents a fall of 8 percentage points in those saying they are
very likely or likely to recommend Shipston-on-Stour from the 94% recorded in 2007.
4% said possibly in 2007 and 2% stated unlikely.
Shipston-on-Stour Visitor Survey 2012 7
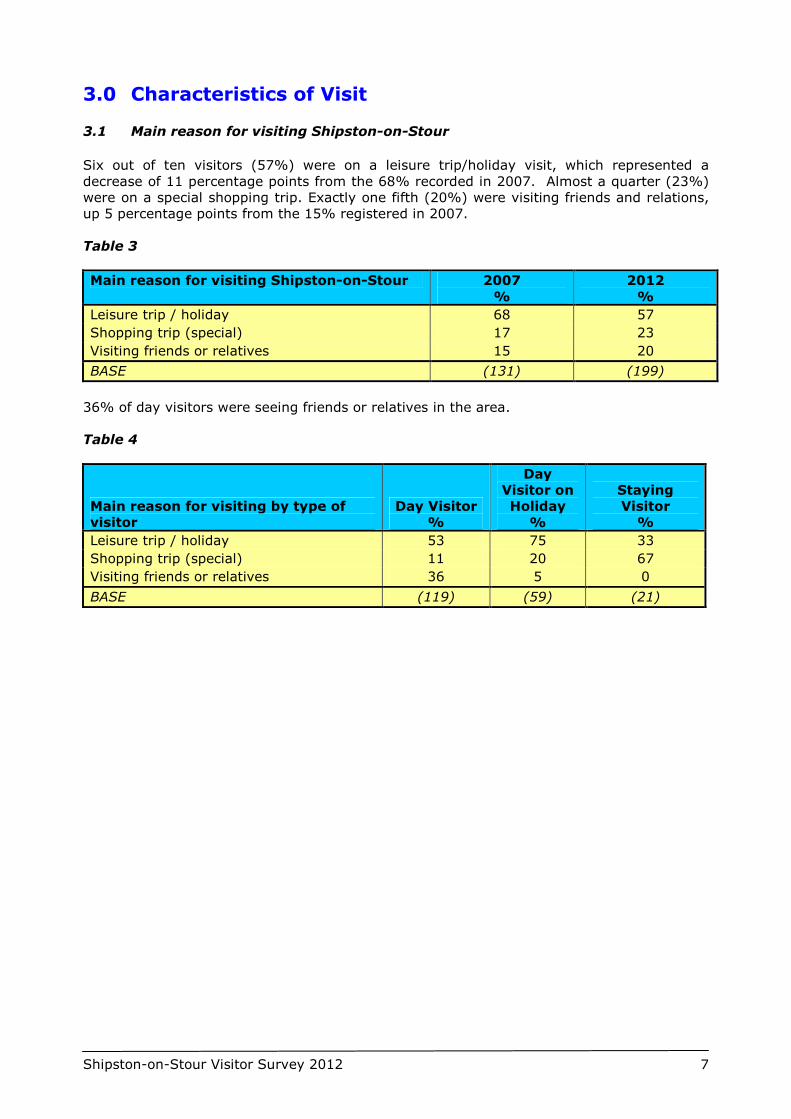
3.0 Characteristics of Visit 3.1 Main reason for visiting Shipston-on-Stour
Six out of ten visitors (57%) were on a leisure trip/holiday visit, which represented a
decrease of 11 percentage points from the 68% recorded in 2007. Almost a quarter (23%)
were on a special shopping trip. Exactly one fifth (20%) were visiting friends and relations,
up 5 percentage points from the 15% registered in 2007.
Table 3
Main reason for visiting Shipston-on-Stour 2007
%
2012
%
Leisure trip / holiday 68 57
Shopping trip (special) 17 23
Visiting friends or relatives 15 20
BASE (131) (199)
36% of day visitors were seeing friends or relatives in the area.
Table 4
Main reason for visiting by type of
visitor
Day Visitor
%
Day
Visitor on
Holiday
%
Staying
Visitor
%
Leisure trip / holiday 53 75 33
Shopping trip (special) 11 20 67
Visiting friends or relatives 36 5 0
BASE (119) (59) (21)
Shipston-on-Stour Visitor Survey 2012 8
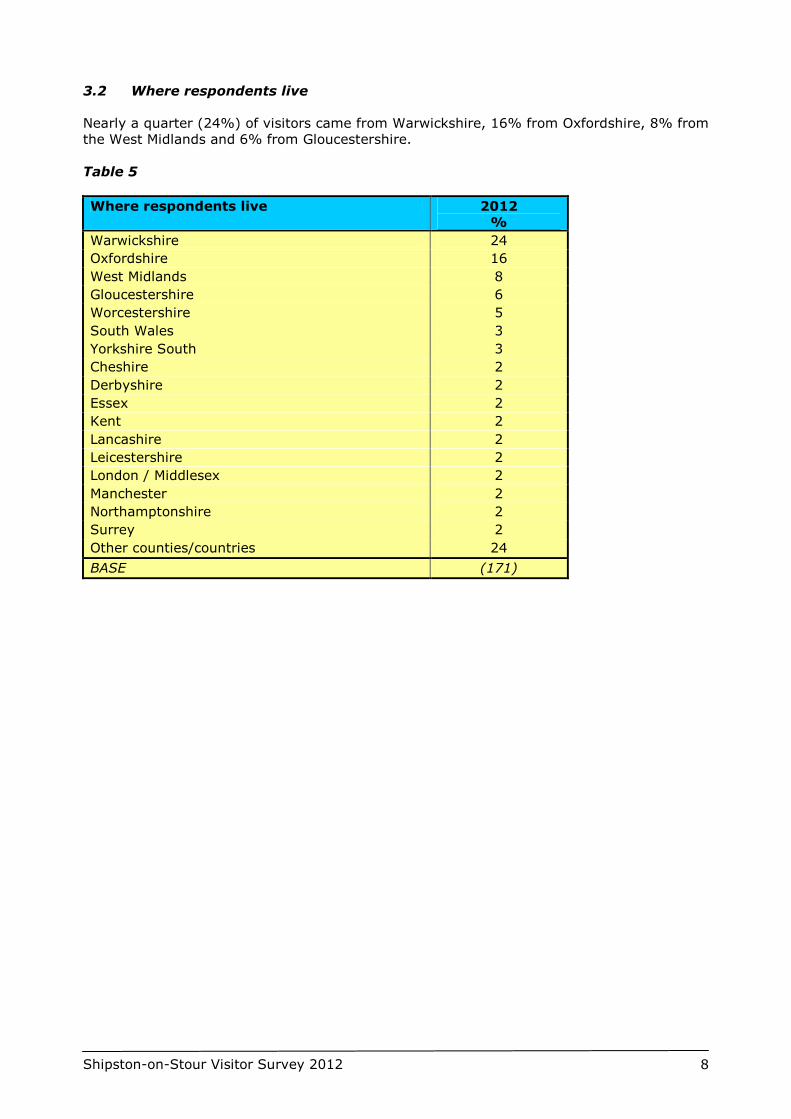
3.2 Where respondents live
Nearly a quarter (24%) of visitors came from Warwickshire, 16% from Oxfordshire, 8% from
the West Midlands and 6% from Gloucestershire.
Table 5
Where respondents live 2012
%
Warwickshire 24
Oxfordshire 16
West Midlands 8
Gloucestershire 6
Worcestershire 5
South Wales 3
Yorkshire South 3
Cheshire 2
Derbyshire 2
Essex 2
Kent 2
Lancashire 2
Leicestershire 2
London / Middlesex 2
Manchester 2
Northamptonshire 2
Surrey 2
Other counties/countries 24
BASE (171)
Shipston-on-Stour Visitor Survey 2012 9
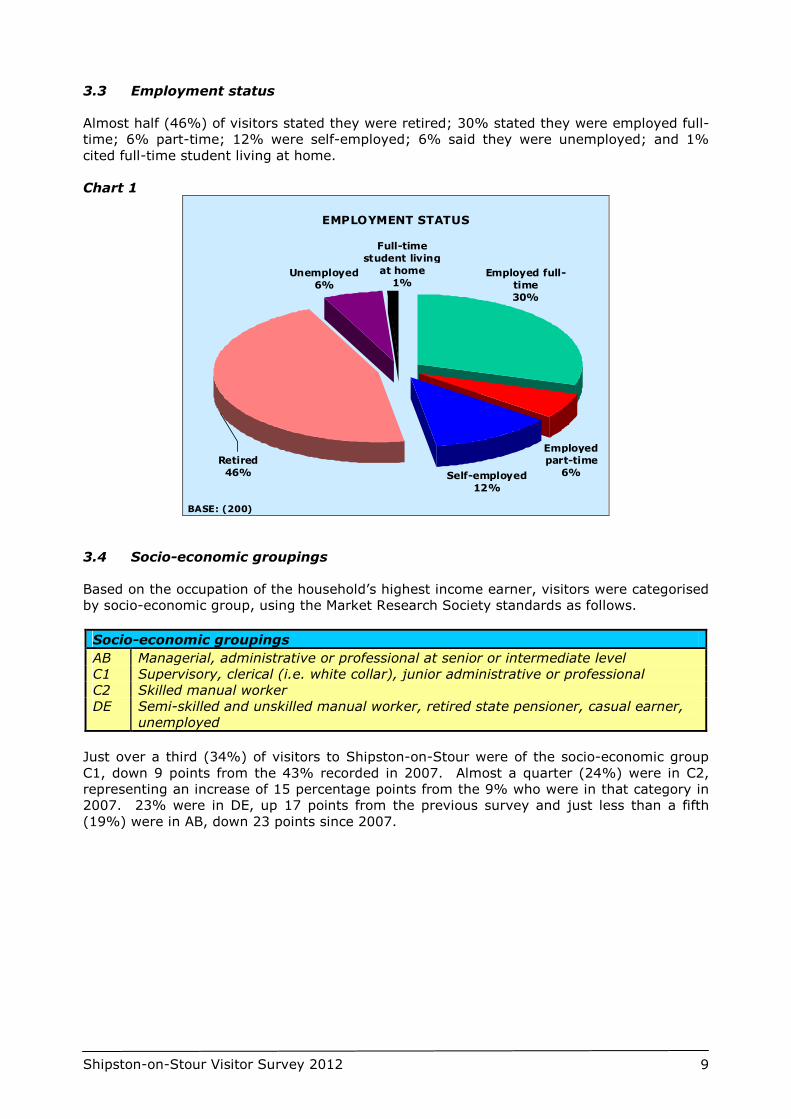
3.3 Employment status
Almost half (46%) of visitors stated they were retired; 30% stated they were employed full-
time; 6% part-time; 12% were self-employed; 6% said they were unemployed; and 1%
cited full-time student living at home.
Chart 1
EMPLOYMENT STATUS
Employed full-
time
30%
Unemployed
6%
Self-employed
12%
Retired
46%
Employed
part-time
6%
Full-time
student living
at home
1%
BASE: (200)
3.4 Socio-economic groupings
Based on the occupation of the household’s highest income earner, visitors were categorised
by socio-economic group, using the Market Research Society standards as follows.
Socio-economic groupings
AB Managerial, administrative or professional at senior or intermediate level
C1 Supervisory, clerical (i.e. white collar), junior administrative or professional
C2 Skilled manual worker
DE Semi-skilled and unskilled manual worker, retired state pensioner, casual earner,
unemployed
Just over a third (34%) of visitors to Shipston-on-Stour were of the socio-economic group
C1, down 9 points from the 43% recorded in 2007. Almost a quarter (24%) were in C2,
representing an increase of 15 percentage points from the 9% who were in that category in
2007. 23% were in DE, up 17 points from the previous survey and just less than a fifth
(19%) were in AB, down 23 points since 2007.
Shipston-on-Stour Visitor Survey 2012 10
Chart 2
SOCIO ECONOMIC GROUPINGS
%
6
9
42
43
23
24
19
34
C1
AB
C2
DE 2007
2012
BASE: (2007: 130), (2012: 183)
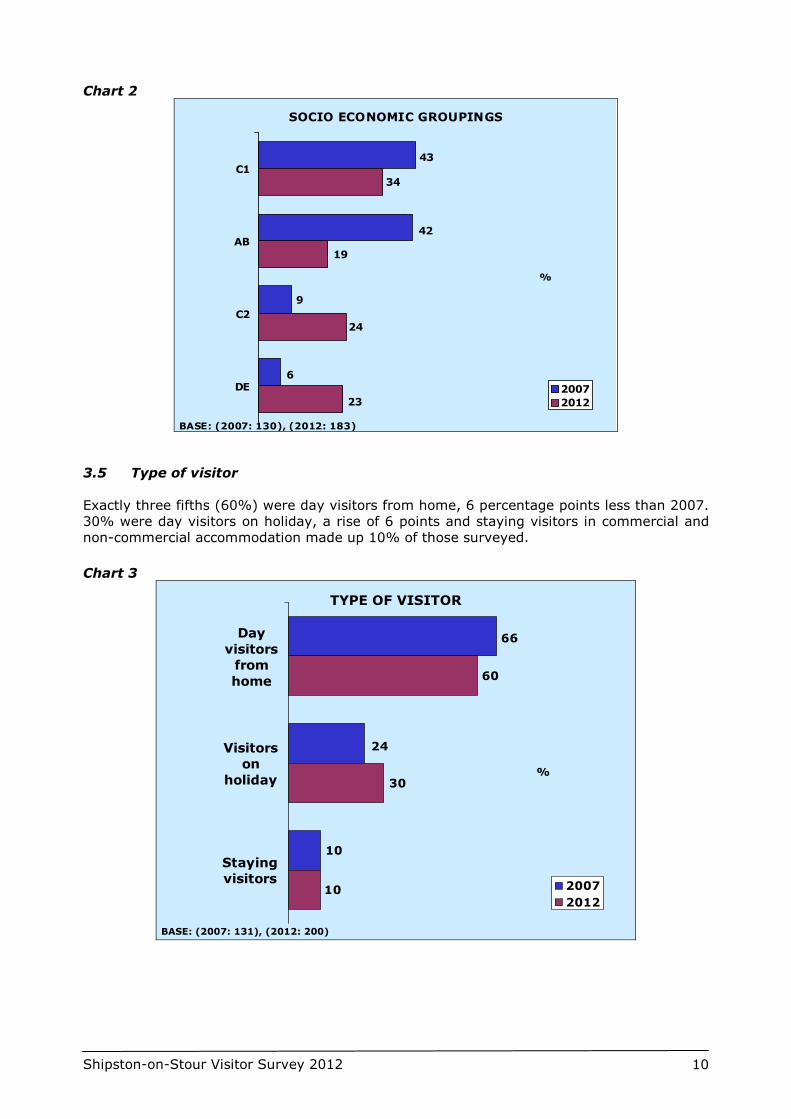
3.5 Type of visitor
Exactly three fifths (60%) were day visitors from home, 6 percentage points less than 2007.
30% were day visitors on holiday, a rise of 6 points and staying visitors in commercial and
non-commercial accommodation made up 10% of those surveyed.
Chart 3
TYPE OF VISITOR
%
10
24
66
10
30
60
Day
visitors
from
home
Visitors
on
holiday
Staying
visitors2007
2012
BASE: (2007: 131), (2012: 200)
Shipston-on-Stour Visitor Survey 2012 11
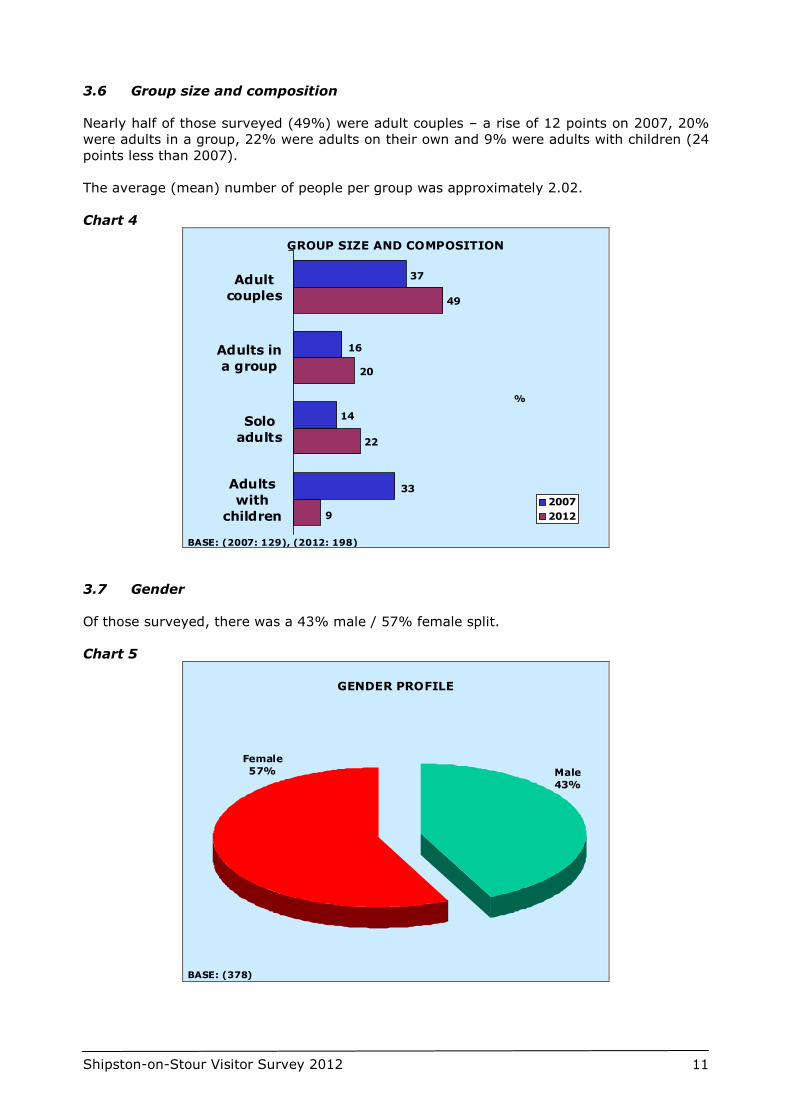
3.6 Group size and composition
Nearly half of those surveyed (49%) were adult couples – a rise of 12 points on 2007, 20%
were adults in a group, 22% were adults on their own and 9% were adults with children (24
points less than 2007).
The average (mean) number of people per group was approximately 2.02.
Chart 4
GROUP SIZE AND COMPOSITION
%
33
14
16
37
9
22
20
49
Adult
couples
Adults in
a group
Solo
adults
Adults
with
children2007
2012
BASE: (2007: 129), (2012: 198)
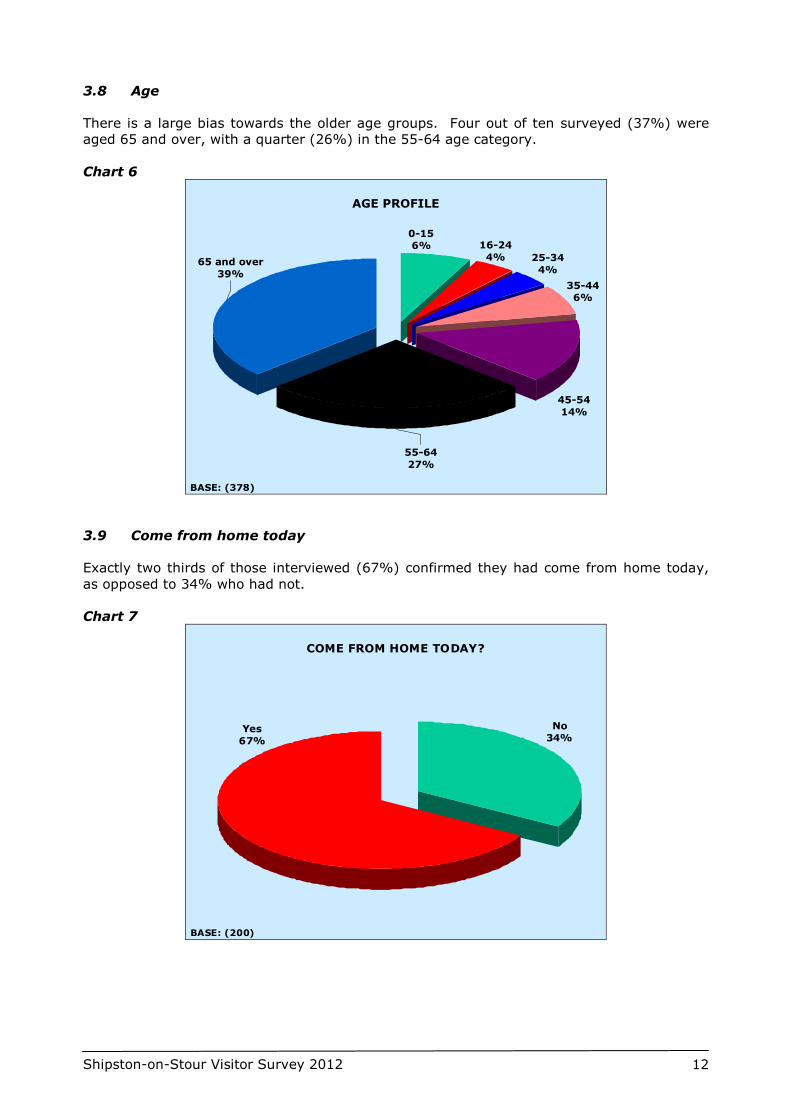
3.7 Gender
Of those surveyed, there was a 43% male / 57% female split.
Chart 5
GENDER PROFILE
Male
43%
Female
57%
BASE: (378)
Shipston-on-Stour Visitor Survey 2012 12
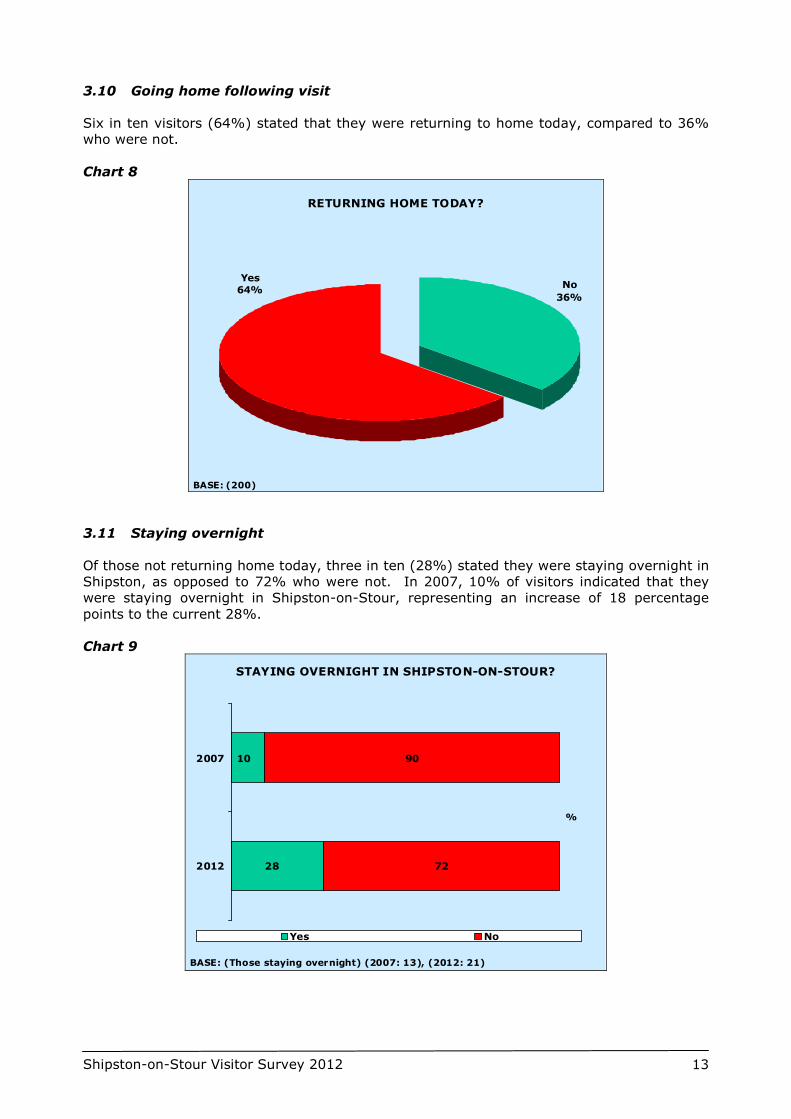
3.8 Age
There is a large bias towards the older age groups. Four out of ten surveyed (37%) were
aged 65 and over, with a quarter (26%) in the 55-64 age category.
Chart 6
AGE PROFILE
0-15
6%
45-54
14%
25-34
4%
35-44
6%
16-24
4%65 and over
39%
55-64
27%
BASE: (378)
3.9 Come from home today
Exactly two thirds of those interviewed (67%) confirmed they had come from home today,
as opposed to 34% who had not.
Chart 7
COME FROM HOME TODAY?
No
34%Yes
67%
BASE: (200)
Shipston-on-Stour Visitor Survey 2012 13
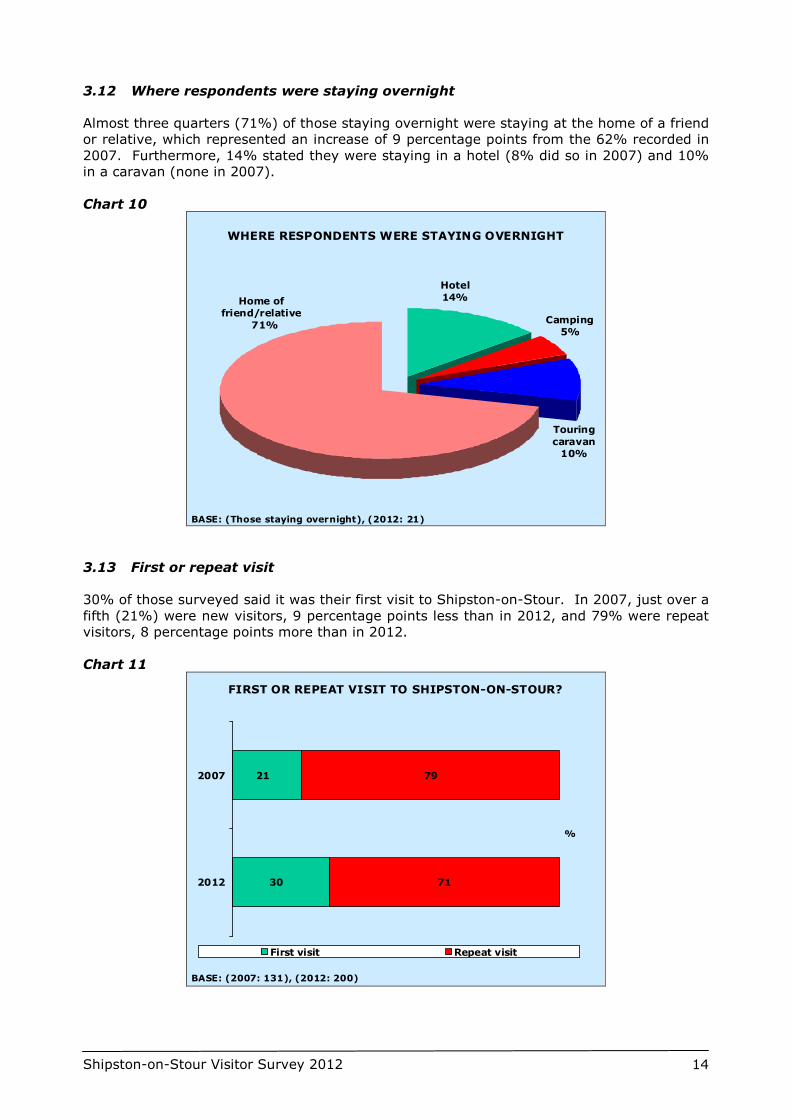
3.10 Going home following visit
Six in ten visitors (64%) stated that they were returning to home today, compared to 36%
who were not.
Chart 8
RETURNING HOME TODAY?
No
36%
Yes
64%
BASE: (200)
3.11 Staying overnight
Of those not returning home today, three in ten (28%) stated they were staying overnight in
Shipston, as opposed to 72% who were not. In 2007, 10% of visitors indicated that they
were staying overnight in Shipston-on-Stour, representing an increase of 18 percentage
points to the current 28%.
Chart 9
STAYING OVERNIGHT IN SHIPSTON-ON-STOUR?
%
72
9010
282012
2007
Yes No
BASE: (Those staying overnight) (2007: 13), (2012: 21)
Shipston-on-Stour Visitor Survey 2012 14
3.12 Where respondents were staying overnight
Almost three quarters (71%) of those staying overnight were staying at the home of a friend
or relative, which represented an increase of 9 percentage points from the 62% recorded in
2007. Furthermore, 14% stated they were staying in a hotel (8% did so in 2007) and 10%
in a caravan (none in 2007).
Chart 10
WHERE RESPONDENTS WERE STAYING OVERNIGHT
Camping
5%
Touring
caravan
10%
Hotel
14%Home of
friend/relative
71%
BASE: (Those staying overnight), (2012: 21)
3.13 First or repeat visit
30% of those surveyed said it was their first visit to Shipston-on-Stour. In 2007, just over a
fifth (21%) were new visitors, 9 percentage points less than in 2012, and 79% were repeat
visitors, 8 percentage points more than in 2012.
Chart 11
FIRST OR REPEAT VISIT TO SHIPSTON-ON-STOUR?
%
71
7921
302012
2007
First visit Repeat visit
BASE: (2007: 131), (2012: 200)
Shipston-on-Stour Visitor Survey 2012 15
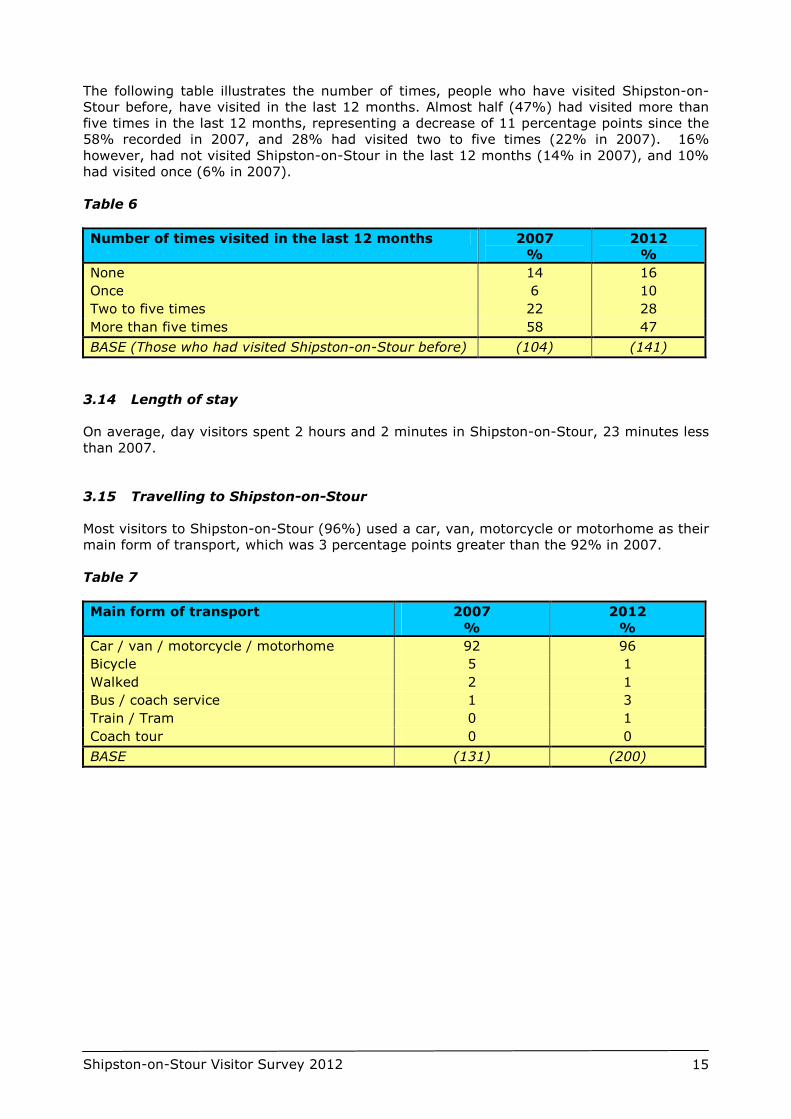
The following table illustrates the number of times, people who have visited Shipston-on-
Stour before, have visited in the last 12 months. Almost half (47%) had visited more than
five times in the last 12 months, representing a decrease of 11 percentage points since the
58% recorded in 2007, and 28% had visited two to five times (22% in 2007). 16%
however, had not visited Shipston-on-Stour in the last 12 months (14% in 2007), and 10%
had visited once (6% in 2007).
Table 6
Number of times visited in the last 12 months 2007
%
2012
%
None 14 16
Once 6 10
Two to five times 22 28
More than five times 58 47
BASE (Those who had visited Shipston-on-Stour before) (104) (141)
3.14 Length of stay
On average, day visitors spent 2 hours and 2 minutes in Shipston-on-Stour, 23 minutes less
than 2007.
3.15 Travelling to Shipston-on-Stour
Most visitors to Shipston-on-Stour (96%) used a car, van, motorcycle or motorhome as their
main form of transport, which was 3 percentage points greater than the 92% in 2007.
Table 7
Main form of transport 2007
%
2012
%
Car / van / motorcycle / motorhome 92 96
Bicycle 5 1
Walked 2 1
Bus / coach service 1 3
Train / Tram 0 1
Coach tour 0 0
BASE (131) (200)
Shipston-on-Stour Visitor Survey 2012 16
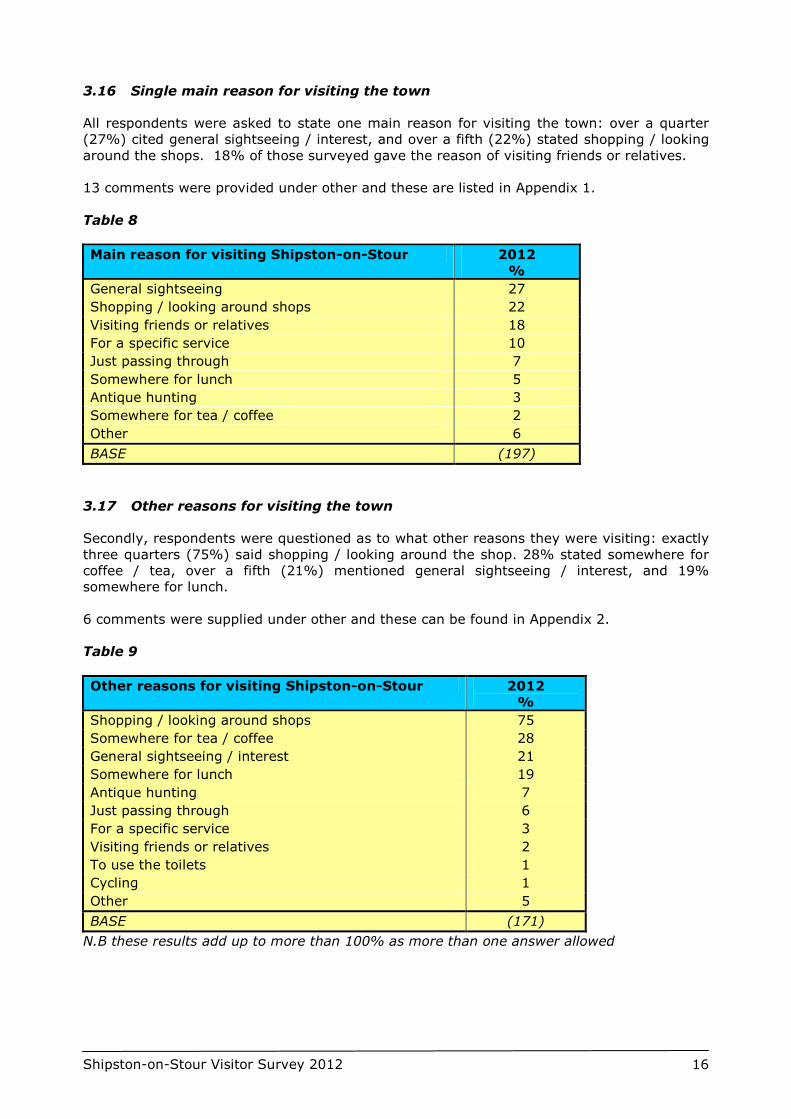
3.16 Single main reason for visiting the town
All respondents were asked to state one main reason for visiting the town: over a quarter
(27%) cited general sightseeing / interest, and over a fifth (22%) stated shopping / looking
around the shops. 18% of those surveyed gave the reason of visiting friends or relatives.
13 comments were provided under other and these are listed in Appendix 1.
Table 8
Main reason for visiting Shipston-on-Stour 2012
%
General sightseeing 27
Shopping / looking around shops 22
Visiting friends or relatives 18
For a specific service 10
Just passing through 7
Somewhere for lunch 5
Antique hunting 3
Somewhere for tea / coffee 2
Other 6
BASE (197)
3.17 Other reasons for visiting the town
Secondly, respondents were questioned as to what other reasons they were visiting: exactly
three quarters (75%) said shopping / looking around the shop. 28% stated somewhere for
coffee / tea, over a fifth (21%) mentioned general sightseeing / interest, and 19%
somewhere for lunch.
6 comments were supplied under other and these can be found in Appendix 2.
Table 9
Other reasons for visiting Shipston-on-Stour 2012
%
Shopping / looking around shops 75
Somewhere for tea / coffee 28
General sightseeing / interest 21
Somewhere for lunch 19
Antique hunting 7
Just passing through 6
For a specific service 3
Visiting friends or relatives 2
To use the toilets 1
Cycling 1
Other 5
BASE (171)
N.B these results add up to more than 100% as more than one answer allowed
Shipston-on-Stour Visitor Survey 2012 17
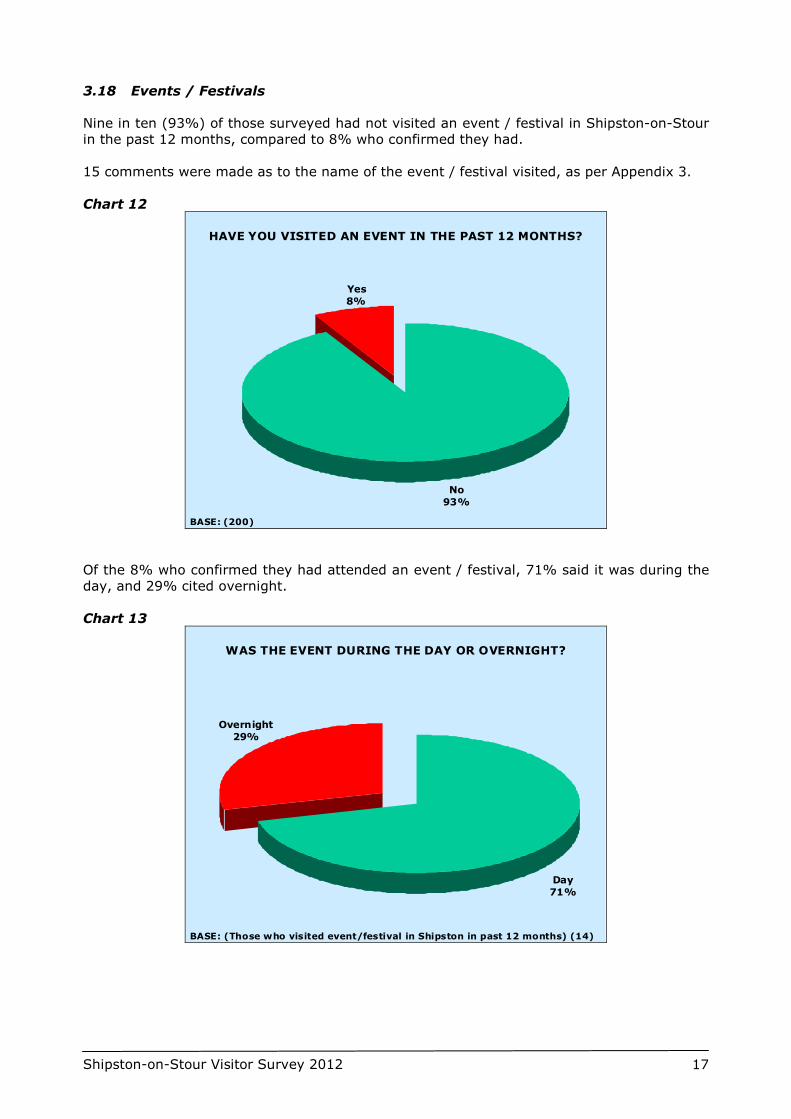
3.18 Events / Festivals
Nine in ten (93%) of those surveyed had not visited an event / festival in Shipston-on-Stour
in the past 12 months, compared to 8% who confirmed they had.
15 comments were made as to the name of the event / festival visited, as per Appendix 3.
Chart 12
HAVE YOU VISITED AN EVENT IN THE PAST 12 MONTHS?
No
93%
Yes
8%
BASE: (200)
Of the 8% who confirmed they had attended an event / festival, 71% said it was during the
day, and 29% cited overnight.
Chart 13
WAS THE EVENT DURING THE DAY OR OVERNIGHT?
Day
71%
Overnight
29%
BASE: (Those who visited event/festival in Shipston in past 12 months) (14)
Shipston-on-Stour Visitor Survey 2012 18
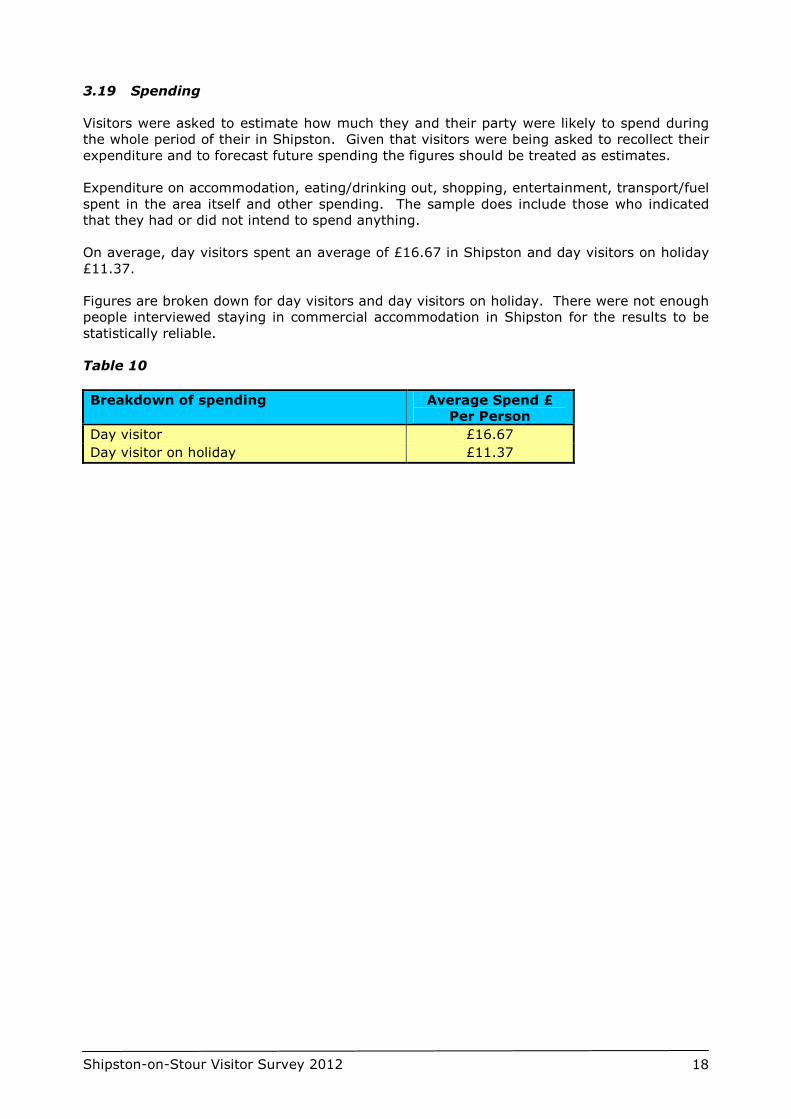
3.19 Spending
Visitors were asked to estimate how much they and their party were likely to spend during
the whole period of their in Shipston. Given that visitors were being asked to recollect their
expenditure and to forecast future spending the figures should be treated as estimates.
Expenditure on accommodation, eating/drinking out, shopping, entertainment, transport/fuel
spent in the area itself and other spending. The sample does include those who indicated
that they had or did not intend to spend anything.
On average, day visitors spent an average of £16.67 in Shipston and day visitors on holiday
£11.37.
Figures are broken down for day visitors and day visitors on holiday. There were not enough
people interviewed staying in commercial accommodation in Shipston for the results to be
statistically reliable.
Table 10
Breakdown of spending Average Spend £
Per Person
Day visitor £16.67
Day visitor on holiday £11.37
Shipston-on-Stour Visitor Survey 2012 19
4.0 Attitudes towards Shipston-on-Stour
4.1 The shops
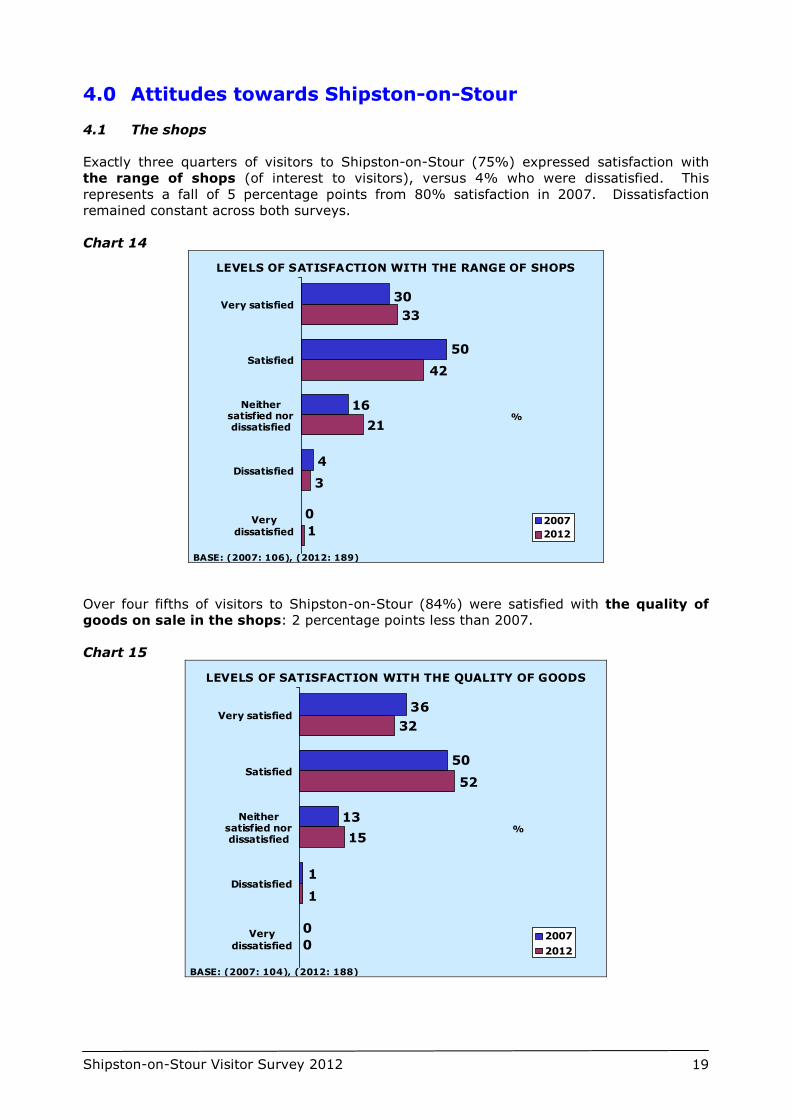
Exactly three quarters of visitors to Shipston-on-Stour (75%) expressed satisfaction with
the range of shops (of interest to visitors), versus 4% who were dissatisfied. This
represents a fall of 5 percentage points from 80% satisfaction in 2007. Dissatisfaction
remained constant across both surveys.
Chart 14
LEVELS OF SATISFACTION WITH THE RANGE OF SHOPS
%
0
4
16
50
30
1
3
21
42
33Very satisfied
Satisfied
Neithersatisfied nordissatisfied
Dissatisfied
Very
dissatisfied2007
2012
BASE: (2007: 106), (2012: 189)
Over four fifths of visitors to Shipston-on-Stour (84%) were satisfied with the quality of
goods on sale in the shops: 2 percentage points less than 2007.
Chart 15
LEVELS OF SATISFACTION WITH THE QUALITY OF GOODS
%
0
1
13
50
36
0
1
15
52
32Very satisfied
Satisfied
Neithersatisfied nordissatisfied
Dissatisfied
Very
dissatisfied2007
2012
BASE: (2007: 104), (2012: 188)
Shipston-on-Stour Visitor Survey 2012 20
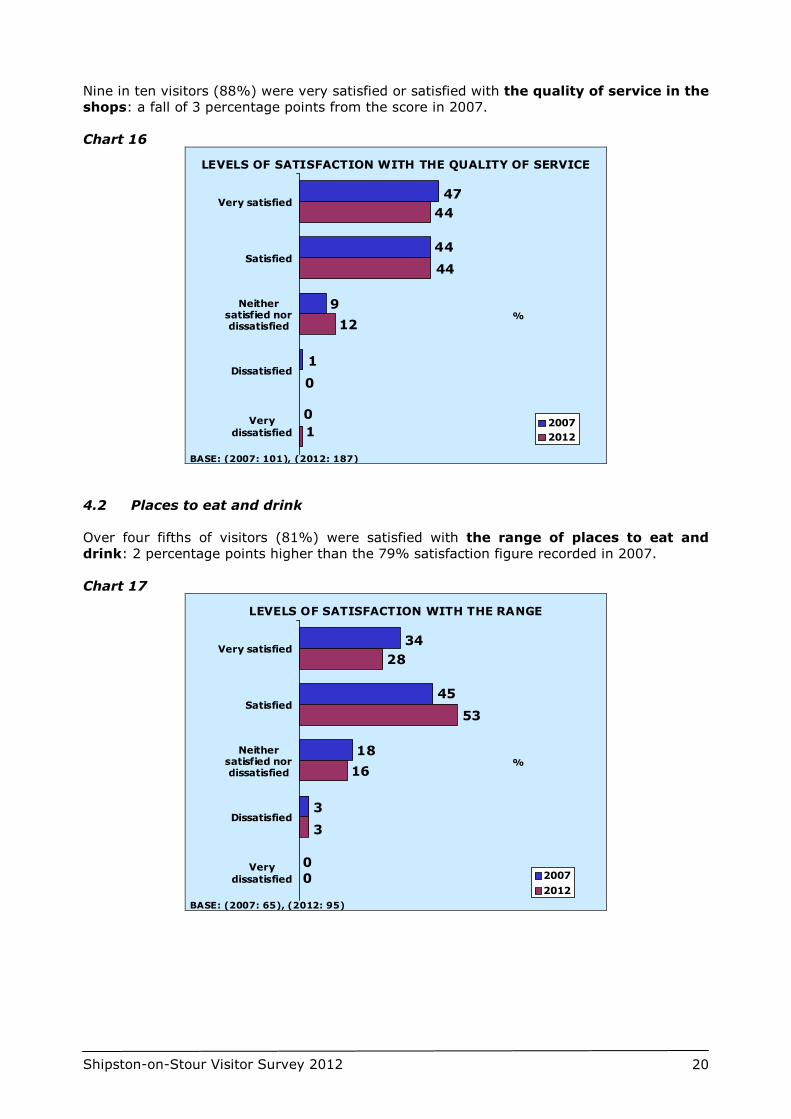
Nine in ten visitors (88%) were very satisfied or satisfied with the quality of service in the
shops: a fall of 3 percentage points from the score in 2007.
Chart 16
LEVELS OF SATISFACTION WITH THE QUALITY OF SERVICE
%
0
1
9
44
47
1
0
12
44
44Very satisfied
Satisfied
Neithersatisfied nordissatisfied
Dissatisfied
Very
dissatisfied2007
2012
BASE: (2007: 101), (2012: 187)
4.2 Places to eat and drink
Over four fifths of visitors (81%) were satisfied with the range of places to eat and
drink: 2 percentage points higher than the 79% satisfaction figure recorded in 2007.
Chart 17
LEVELS OF SATISFACTION WITH THE RANGE
%
0
3
18
45
34
0
3
16
53
28Very satisfied
Satisfied
Neithersatisfied nordissatisfied
Dissatisfied
Very
dissatisfied 2007
2012
BASE: (2007: 65), (2012: 95)
Shipston-on-Stour Visitor Survey 2012 21
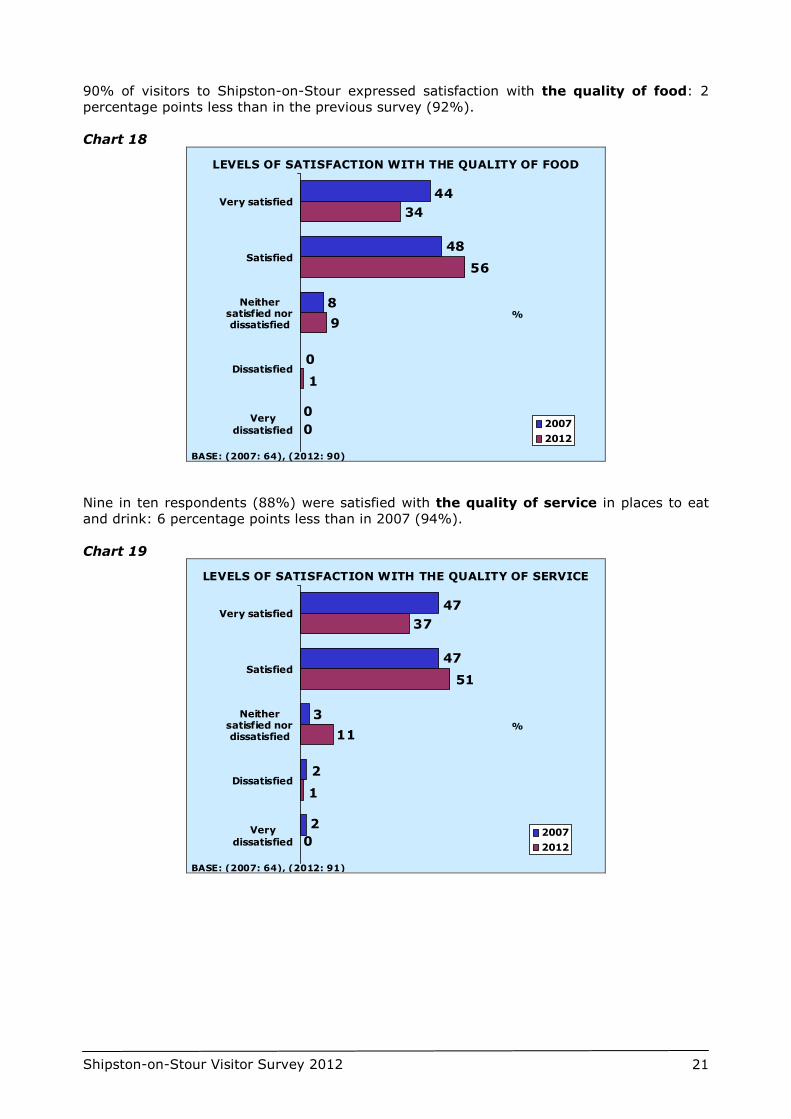
90% of visitors to Shipston-on-Stour expressed satisfaction with the quality of food: 2
percentage points less than in the previous survey (92%).
Chart 18
LEVELS OF SATISFACTION WITH THE QUALITY OF FOOD
%
0
0
8
48
44
0
1
9
56
34Very satisfied
Satisfied
Neithersatisfied nordissatisfied
Dissatisfied
Very
dissatisfied2007
2012
BASE: (2007: 64), (2012: 90)
Nine in ten respondents (88%) were satisfied with the quality of service in places to eat
and drink: 6 percentage points less than in 2007 (94%).
Chart 19
LEVELS OF SATISFACTION WITH THE QUALITY OF SERVICE
%
2
2
3
47
47
0
1
11
51
37Very satisfied
Satisfied
Neithersatisfied nordissatisfied
Dissatisfied
Very
dissatisfied2007
2012
BASE: (2007: 64), (2012: 91)
Shipston-on-Stour Visitor Survey 2012 22
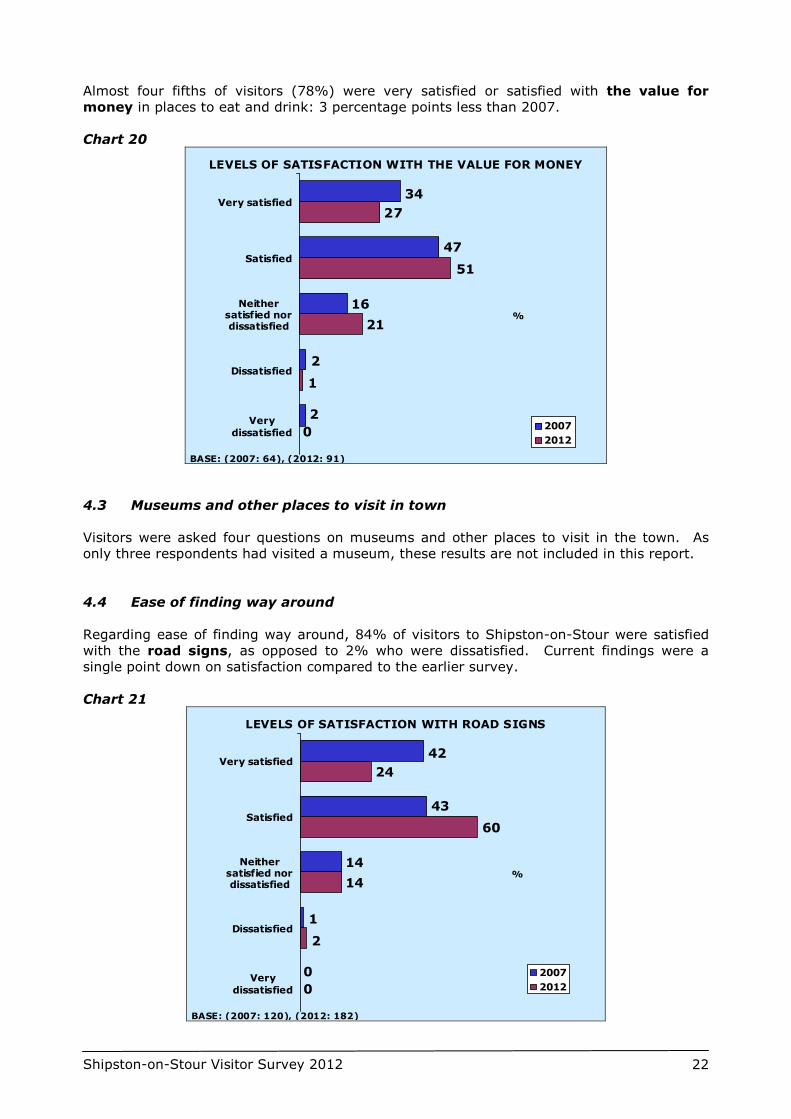
Almost four fifths of visitors (78%) were very satisfied or satisfied with the value for
money in places to eat and drink: 3 percentage points less than 2007.
Chart 20
LEVELS OF SATISFACTION WITH THE VALUE FOR MONEY
%
2
2
16
47
34
0
1
21
51
27Very satisfied
Satisfied
Neithersatisfied nordissatisfied
Dissatisfied
Very
dissatisfied2007
2012
BASE: (2007: 64), (2012: 91)
4.3 Museums and other places to visit in town
Visitors were asked four questions on museums and other places to visit in the town. As
only three respondents had visited a museum, these results are not included in this report.
4.4 Ease of finding way around
Regarding ease of finding way around, 84% of visitors to Shipston-on-Stour were satisfied
with the road signs, as opposed to 2% who were dissatisfied. Current findings were a
single point down on satisfaction compared to the earlier survey.
Chart 21
LEVELS OF SATISFACTION WITH ROAD SIGNS
%
0
1
14
43
42
0
2
14
60
24Very satisfied
Satisfied
Neithersatisfied nordissatisfied
Dissatisfied
Very
dissatisfied
2007
2012
BASE: (2007: 120), (2012: 182)
Shipston-on-Stour Visitor Survey 2012 23
71% expressed satisfaction with the pedestrian signs (a fall of 4 percentage points from
the 75% satisfaction in 2007), versus 7% dissatisfaction (5% dissatisfaction in 2007).
Chart 22
LEVELS OF SATISFACTION WITH PEDESTRIAN SIGNS
%
1
4
20
35
40
1
6
22
49
22Very satisfied
Satisfied
Neithersatisfied nordissatisfied
Dissatisfied
Very
dissatisfied
2007
2012
BASE: (2007: 80), (2012: 156)
69% of visitors to Shipston-on-Stour were satisfied with the display maps and
information boards, compared to 8% who were dissatisfied. This represents an increase
in satisfaction of 5 percentage points from the 2007 figure.
Chart 23
LEVELS OF SATISFACTION WITH DISPLAY MAPS AND
INFORMATION BOARDS
%
6
3
26
35
29
3
5
23
49
20Very satisfied
Satisfied
Neithersatisfied nordissatisfied
Dissatisfied
Very
dissatisfied
2007
2012
BASE: (2007: 65), (2012: 152)
Shipston-on-Stour Visitor Survey 2012 24
4.5 Cleanliness of the streets
Nine in ten visitors (89%) expressed satisfaction with the cleanliness of the streets (up 3
percentage points since the 86% satisfaction in 2007).
Chart 24
LEVELS OF SATISFACTION WITH CLEANLINESS OF STREETS
%
0
1
12
48
38
1
1
9
44
45Very satisfied
Satisfied
Neithersatisfied nordissatisfied
Dissatisfied
Very
dissatisfied
2007
2012
BASE: (2007: 91), (2012: 197)
4.7 Public toilets
With reference to the public toilets, 7% were dissatisfied with the availability, as opposed
to 86% who were satisfied (a single point more than the 85% satisfaction rating in 2007 and
2 percentage points down from the 9% dissatisfaction of 2007).
Chart 25
LEVELS OF SATISFACTION WITH THE AVAILABILITY OF
PUBLIC TOILETS
%
6
3
6
24
61
0
7
7
45
41Very satisfied
Satisfied
Neithersatisfied nordissatisfied
Dissatisfied
Very
dissatisfied
2007
2012
BASE: (2007: 33), (2012: 29)
Shipston-on-Stour Visitor Survey 2012 25
Over four fifths (82%) were satisfied with the cleanliness of the public toilets, versus 10%
who were dissatisfied. This represented a fall of 9 percentage points from the 91%
satisfaction in the previous survey. It also demonstrates an increase in dissatisfaction of 10
percentage points from the zero dissatisfaction recorded in 2007.
Chart 26
LEVELS OF SATISFACTION WITH THE CLEANLINESS OF
PUBLIC TOILETS
%
0
0
10
23
68
0
10
7
48
34Very satisfied
Satisfied
Neithersatisfied nordissatisfied
Dissatisfied
Very
dissatisfied
2007
2012
BASE: (2007: 31), (2012: 29)
4.8 Visitor Information
With regard to the ease of finding visitor information, only three people responded to this
question so results are not possible for this aspect.
4.9 Parking
Nine in ten (87%) of those visitors who travelled to Shipston-on-Stour by car, van,
motorcycle or motor home, found it either very easy or easy to park in the town. This
represents a single percentage point fall from the 88% figure in 2007.
Table 11
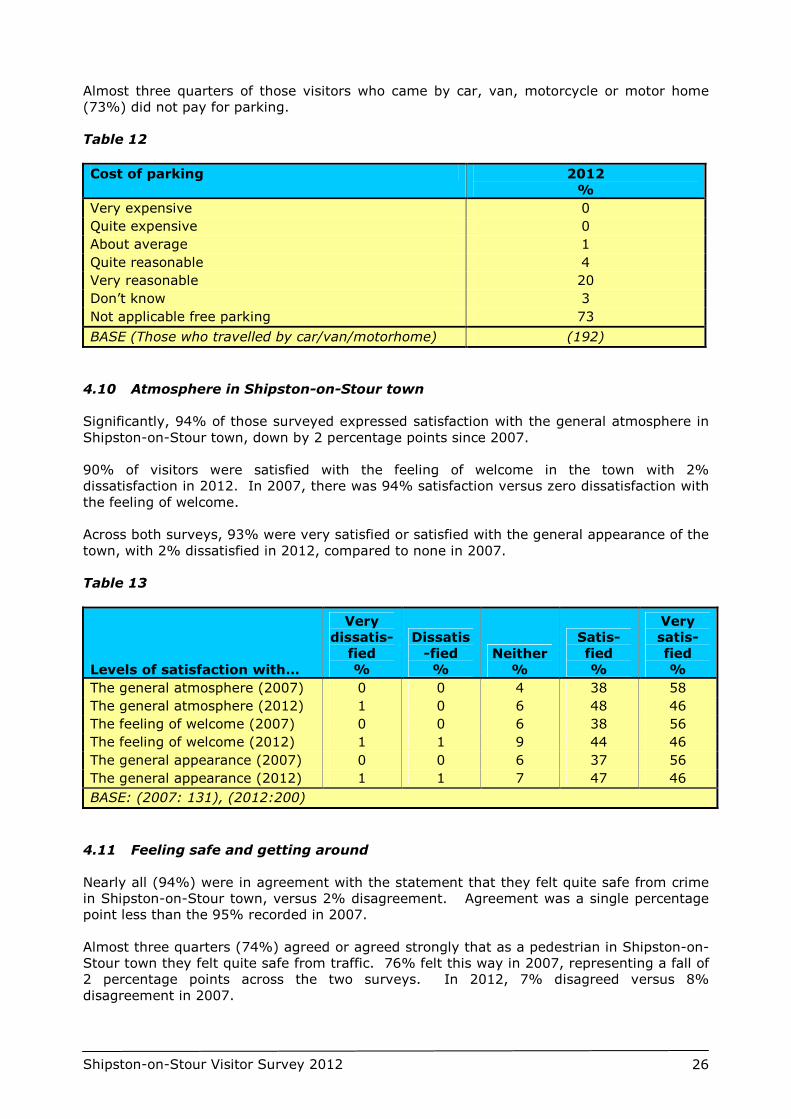
Ease of parking 2007
%
2012
%
Very difficult 1 2
Difficult 7 3
Neither difficult nor easy 4 9
Easy 25 45
Very easy 63 42
BASE (Those who travelled by car/van/motor home) (120) (180)
Shipston-on-Stour Visitor Survey 2012 26
Almost three quarters of those visitors who came by car, van, motorcycle or motor home
(73%) did not pay for parking.
Table 12
Cost of parking 2012
%
Very expensive 0
Quite expensive 0
About average 1
Quite reasonable 4
Very reasonable 20
Don’t know 3
Not applicable free parking 73
BASE (Those who travelled by car/van/motorhome) (192)
4.10 Atmosphere in Shipston-on-Stour town
Significantly, 94% of those surveyed expressed satisfaction with the general atmosphere in
Shipston-on-Stour town, down by 2 percentage points since 2007.
90% of visitors were satisfied with the feeling of welcome in the town with 2%
dissatisfaction in 2012. In 2007, there was 94% satisfaction versus zero dissatisfaction with
the feeling of welcome.
Across both surveys, 93% were very satisfied or satisfied with the general appearance of the
town, with 2% dissatisfied in 2012, compared to none in 2007.
Table 13
Levels of satisfaction with…
Very
dissatis-
fied
%
Dissatis
-fied
% Neither
%
Satis-
fied
%
Very
satis-
fied
%
The general atmosphere (2007) 0 0 4 38 58
The general atmosphere (2012) 1 0 6 48 46
The feeling of welcome (2007) 0 0 6 38 56
The feeling of welcome (2012) 1 1 9 44 46
The general appearance (2007) 0 0 6 37 56
The general appearance (2012) 1 1 7 47 46
BASE: (2007: 131), (2012:200)
4.11 Feeling safe and getting around
Nearly all (94%) were in agreement with the statement that they felt quite safe from crime
in Shipston-on-Stour town, versus 2% disagreement. Agreement was a single percentage
point less than the 95% recorded in 2007.
Almost three quarters (74%) agreed or agreed strongly that as a pedestrian in Shipston-on-
Stour town they felt quite safe from traffic. 76% felt this way in 2007, representing a fall of
2 percentage points across the two surveys. In 2012, 7% disagreed versus 8%
disagreement in 2007.
Shipston-on-Stour Visitor Survey 2012 27
Almost three quarters (72%) agreed that they found it easy to get around Shipston-on-
Stour town by car, as opposed to 6% who disagreed.
Table 14
Levels of agreement with…
Disagree strongly
%
Disagree
% Neither
% Agree
%
Agree strongly
%
I felt quite safe from crime (2007) 0 1 5 50 45
I felt quite safe from crime (2012) 1 1 4 53 41
As a pedestrian, I felt quite safe
from traffic (2007)
2 6 17 49 27
As a pedestrian, I felt quite safe
from traffic (2012)
0 7 19 51 23
I found it easy to get around by
car (2012)
1 5 22 49 23
BASE: (2007:127), (2012:198)
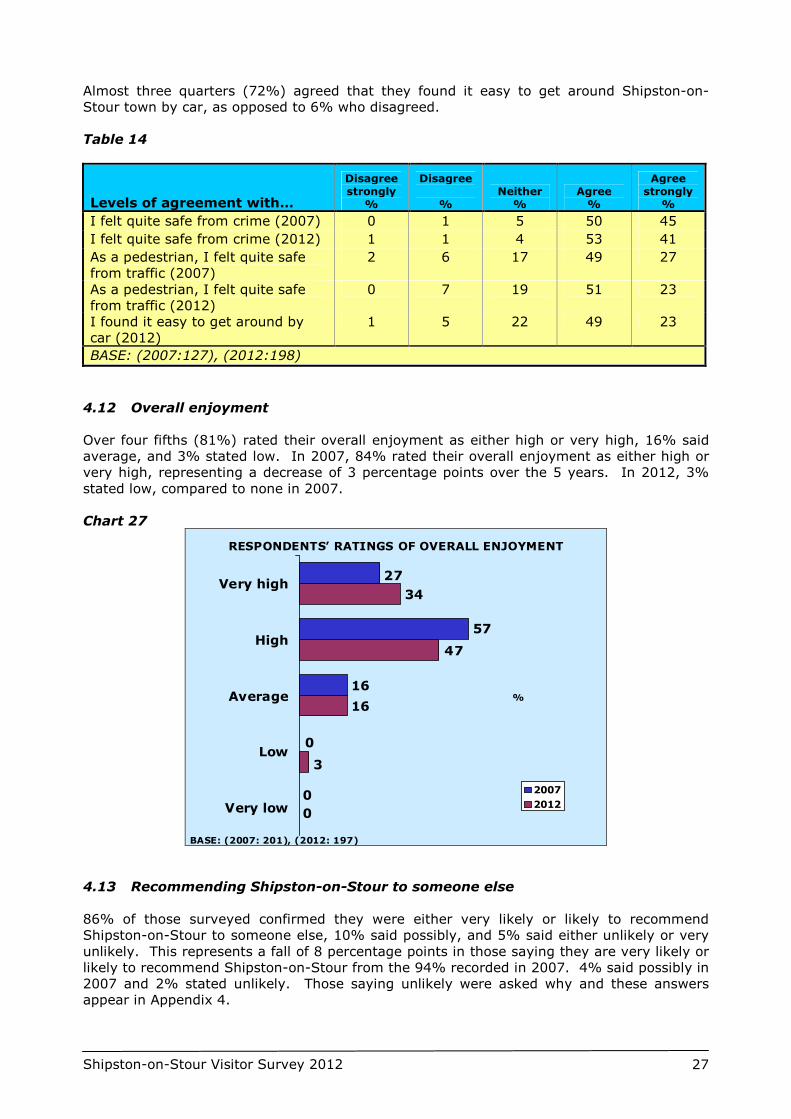
4.12 Overall enjoyment
Over four fifths (81%) rated their overall enjoyment as either high or very high, 16% said
average, and 3% stated low. In 2007, 84% rated their overall enjoyment as either high or
very high, representing a decrease of 3 percentage points over the 5 years. In 2012, 3%
stated low, compared to none in 2007.
Chart 27
RESPONDENTS’ RATINGS OF OVERALL ENJOYMENT
%
0
0
16
57
27
0
3
16
47
34Very high
High
Average
Low
Very low
2007
2012
BASE: (2007: 201), (2012: 197)
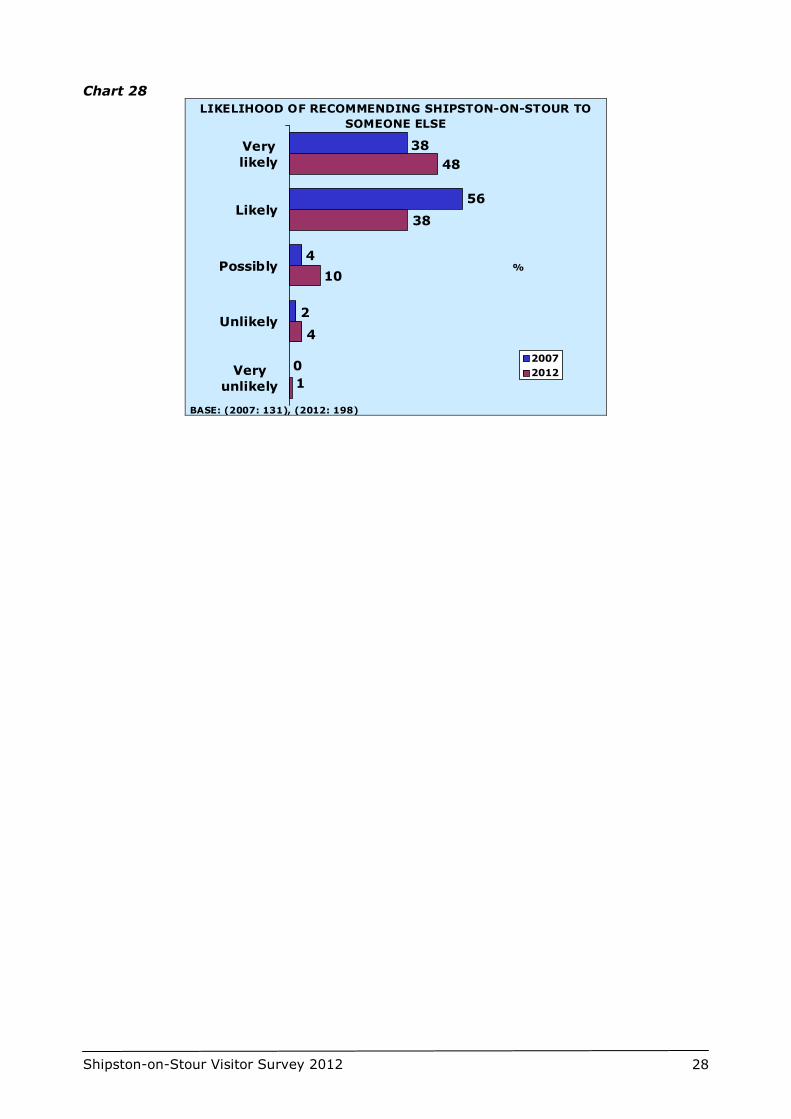
4.13 Recommending Shipston-on-Stour to someone else
86% of those surveyed confirmed they were either very likely or likely to recommend
Shipston-on-Stour to someone else, 10% said possibly, and 5% said either unlikely or very
unlikely. This represents a fall of 8 percentage points in those saying they are very likely or
likely to recommend Shipston-on-Stour from the 94% recorded in 2007. 4% said possibly in
2007 and 2% stated unlikely. Those saying unlikely were asked why and these answers
appear in Appendix 4.
Shipston-on-Stour Visitor Survey 2012 28
Chart 28
LIKELIHOOD OF RECOMMENDING SHIPSTON-ON-STOUR TO
SOMEONE ELSE
%
0
2
4
56
38
1
4
10
38
48
Very
likely
Likely
Possibly
Unlikely
Very
unlikely
2007
2012
BASE: (2007: 131), (2012: 198)
Shipston-on-Stour Visitor Survey 2012 29
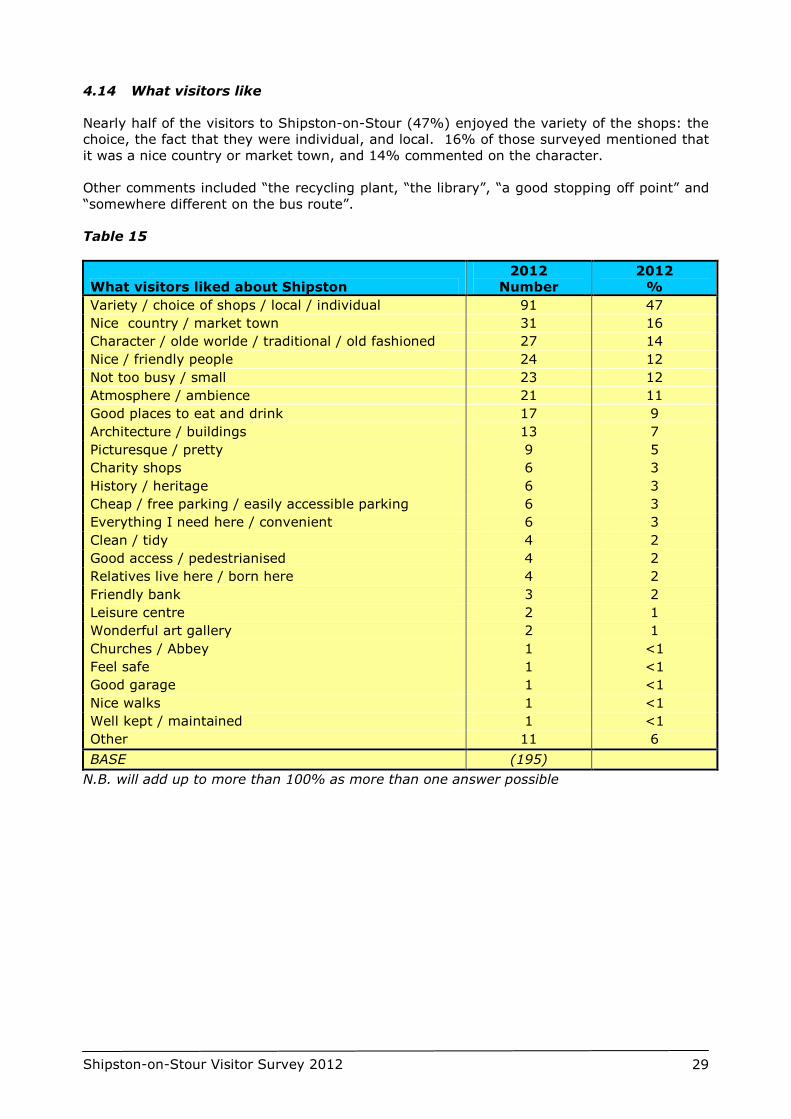
4.14 What visitors like
Nearly half of the visitors to Shipston-on-Stour (47%) enjoyed the variety of the shops: the
choice, the fact that they were individual, and local. 16% of those surveyed mentioned that
it was a nice country or market town, and 14% commented on the character.
Other comments included “the recycling plant, “the library”, “a good stopping off point” and
“somewhere different on the bus route”.
Table 15
What visitors liked about Shipston
2012
Number
2012
%
Variety / choice of shops / local / individual 91 47
Nice country / market town 31 16
Character / olde worlde / traditional / old fashioned 27 14
Nice / friendly people 24 12
Not too busy / small 23 12
Atmosphere / ambience 21 11
Good places to eat and drink 17 9
Architecture / buildings 13 7
Picturesque / pretty 9 5
Charity shops 6 3
History / heritage 6 3
Cheap / free parking / easily accessible parking 6 3
Everything I need here / convenient 6 3
Clean / tidy 4 2
Good access / pedestrianised 4 2
Relatives live here / born here 4 2
Friendly bank 3 2
Leisure centre 2 1
Wonderful art gallery 2 1
Churches / Abbey 1 <1
Feel safe 1 <1
Good garage 1 <1
Nice walks 1 <1
Well kept / maintained 1 <1
Other 11 6
BASE (195)
N.B. will add up to more than 100% as more than one answer possible
Shipston-on-Stour Visitor Survey 2012 30
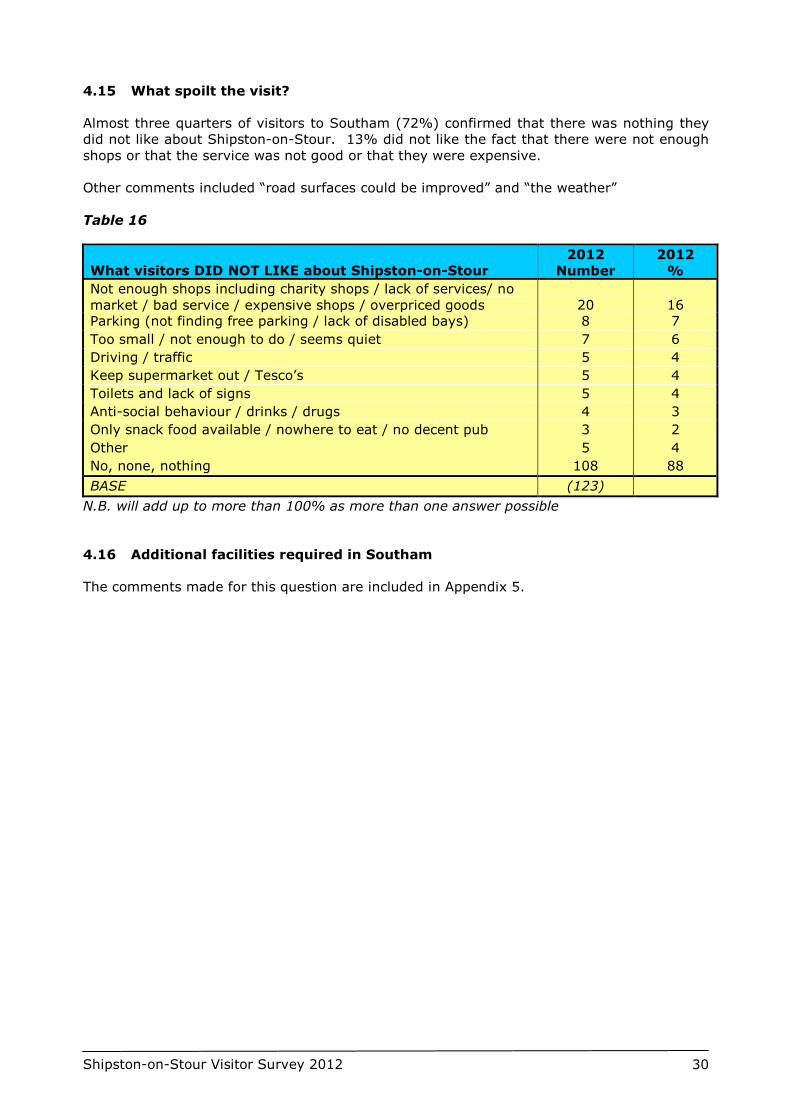
4.15 What spoilt the visit?
Almost three quarters of visitors to Southam (72%) confirmed that there was nothing they
did not like about Shipston-on-Stour. 13% did not like the fact that there were not enough
shops or that the service was not good or that they were expensive.
Other comments included “road surfaces could be improved” and “the weather”
Table 16
What visitors DID NOT LIKE about Shipston-on-Stour
2012
Number
2012
%
Not enough shops including charity shops / lack of services/ no
market / bad service / expensive shops / overpriced goods 20 16
Parking (not finding free parking / lack of disabled bays) 8 7
Too small / not enough to do / seems quiet 7 6
Driving / traffic 5 4
Keep supermarket out / Tesco’s 5 4
Toilets and lack of signs 5 4
Anti-social behaviour / drinks / drugs 4 3
Only snack food available / nowhere to eat / no decent pub 3 2
Other 5 4
No, none, nothing 108 88
BASE (123)
N.B. will add up to more than 100% as more than one answer possible
4.16 Additional facilities required in Southam
The comments made for this question are included in Appendix 5.
Shipston-on-Stour Visitor Survey 2012 31
5.0 Attitudes - Importance versus Satisfaction
5.1 Importance versus Satisfaction
The survey also requested visitors to indicate the importance of each factor to their visit,
alongside their satisfaction with facilities in Shipston. By indentifying those factors
considered to be of greatest importance, the impact on future development can be
maximised. For instance, where both satisfaction and importance are low, these factors
should be lower on a priority list of action. However where satisfaction is low but
importance is high, these factors should be of higher priority.
Furthermore, issues rated as important can be most effectively used in marketing and PR
activity to the town.
The following table details the average scores for all factors addressed in the survey, in
terms of both importance and satisfaction. These results indicate the factors visitors feel are
the most ‘important’ to their visit and those factors were most ‘satisfied’ with.
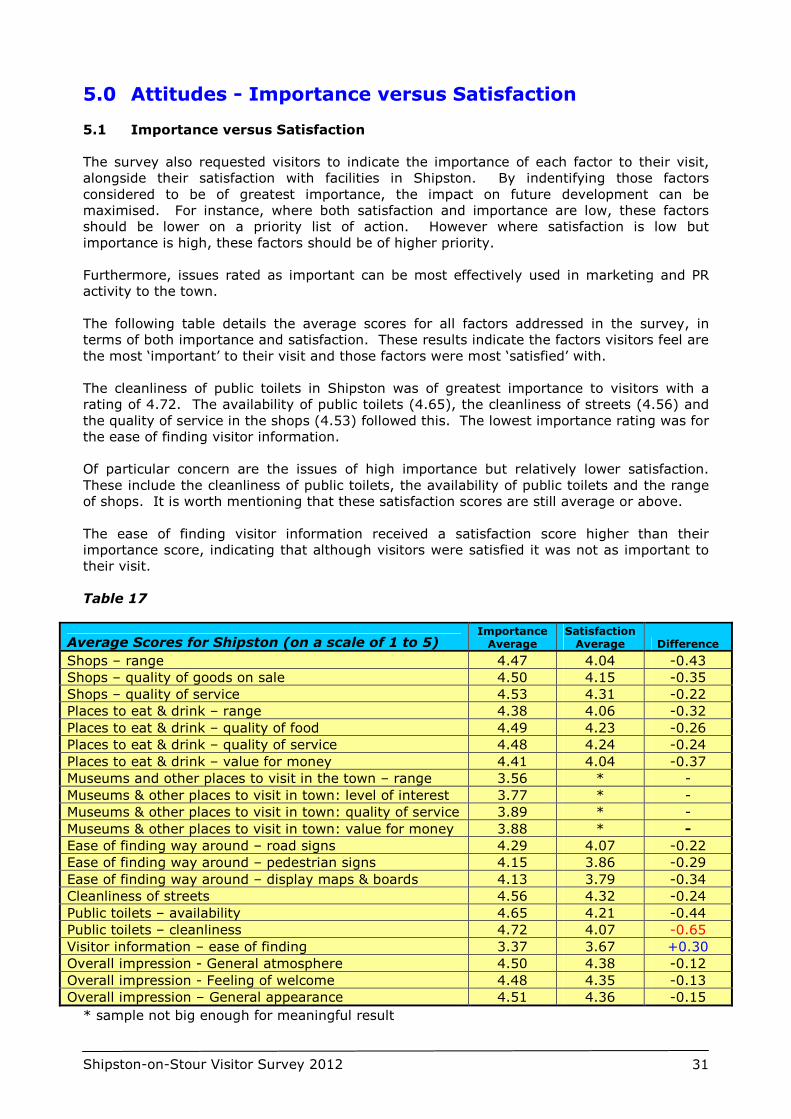
The cleanliness of public toilets in Shipston was of greatest importance to visitors with a
rating of 4.72. The availability of public toilets (4.65), the cleanliness of streets (4.56) and
the quality of service in the shops (4.53) followed this. The lowest importance rating was for
the ease of finding visitor information.
Of particular concern are the issues of high importance but relatively lower satisfaction.
These include the cleanliness of public toilets, the availability of public toilets and the range
of shops. It is worth mentioning that these satisfaction scores are still average or above.
The ease of finding visitor information received a satisfaction score higher than their
importance score, indicating that although visitors were satisfied it was not as important to
their visit.
Table 17
Average Scores for Shipston (on a scale of 1 to 5) Importance
Average Satisfaction
Average Difference
Shops – range 4.47 4.04 -0.43
Shops – quality of goods on sale 4.50 4.15 -0.35
Shops – quality of service 4.53 4.31 -0.22
Places to eat & drink – range 4.38 4.06 -0.32
Places to eat & drink – quality of food 4.49 4.23 -0.26
Places to eat & drink – quality of service 4.48 4.24 -0.24
Places to eat & drink – value for money 4.41 4.04 -0.37
Museums and other places to visit in the town – range 3.56 * -
Museums & other places to visit in town: level of interest 3.77 * -
Museums & other places to visit in town: quality of service 3.89 * -
Museums & other places to visit in town: value for money 3.88 * -
Ease of finding way around – road signs 4.29 4.07 -0.22
Ease of finding way around – pedestrian signs 4.15 3.86 -0.29
Ease of finding way around – display maps & boards 4.13 3.79 -0.34
Cleanliness of streets 4.56 4.32 -0.24
Public toilets – availability 4.65 4.21 -0.44
Public toilets – cleanliness 4.72 4.07 -0.65
Visitor information – ease of finding 3.37 3.67 +0.30
Overall impression - General atmosphere 4.50 4.38 -0.12
Overall impression - Feeling of welcome 4.48 4.35 -0.13
Overall impression – General appearance 4.51 4.36 -0.15
* sample not big enough for meaningful result
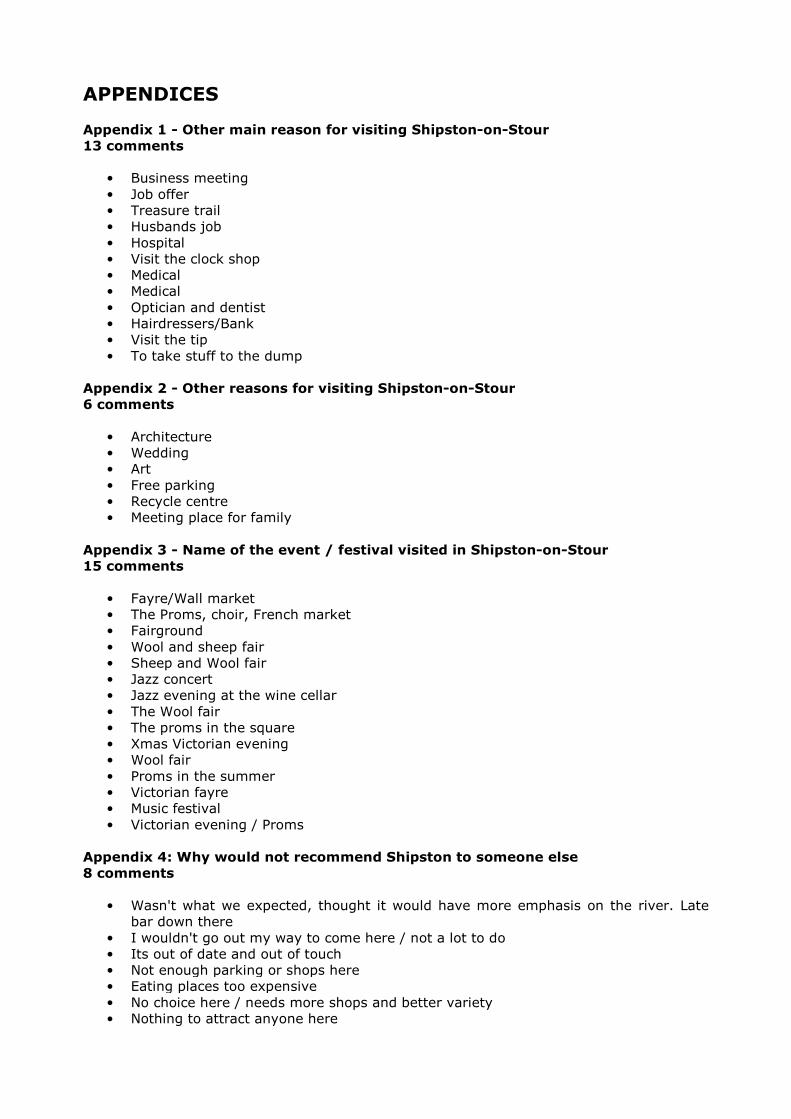
APPENDICES
Appendix 1 - Other main reason for visiting Shipston-on-Stour
13 comments
• Business meeting
• Job offer
• Treasure trail
• Husbands job
• Hospital
• Visit the clock shop
• Medical
• Medical
• Optician and dentist
• Hairdressers/Bank
• Visit the tip
• To take stuff to the dump
Appendix 2 - Other reasons for visiting Shipston-on-Stour
6 comments
• Architecture
• Wedding
• Art
• Free parking
• Recycle centre
• Meeting place for family
Appendix 3 - Name of the event / festival visited in Shipston-on-Stour
15 comments
• Fayre/Wall market
• The Proms, choir, French market
• Fairground
• Wool and sheep fair
• Sheep and Wool fair
• Jazz concert
• Jazz evening at the wine cellar
• The Wool fair
• The proms in the square
• Xmas Victorian evening
• Wool fair
• Proms in the summer
• Victorian fayre
• Music festival
• Victorian evening / Proms
Appendix 4: Why would not recommend Shipston to someone else
8 comments
• Wasn't what we expected, thought it would have more emphasis on the river. Late
bar down there
• I wouldn't go out my way to come here / not a lot to do
• Its out of date and out of touch
• Not enough parking or shops here
• Eating places too expensive
• No choice here / needs more shops and better variety
• Nothing to attract anyone here
• Nothing here / I'm too young for this place
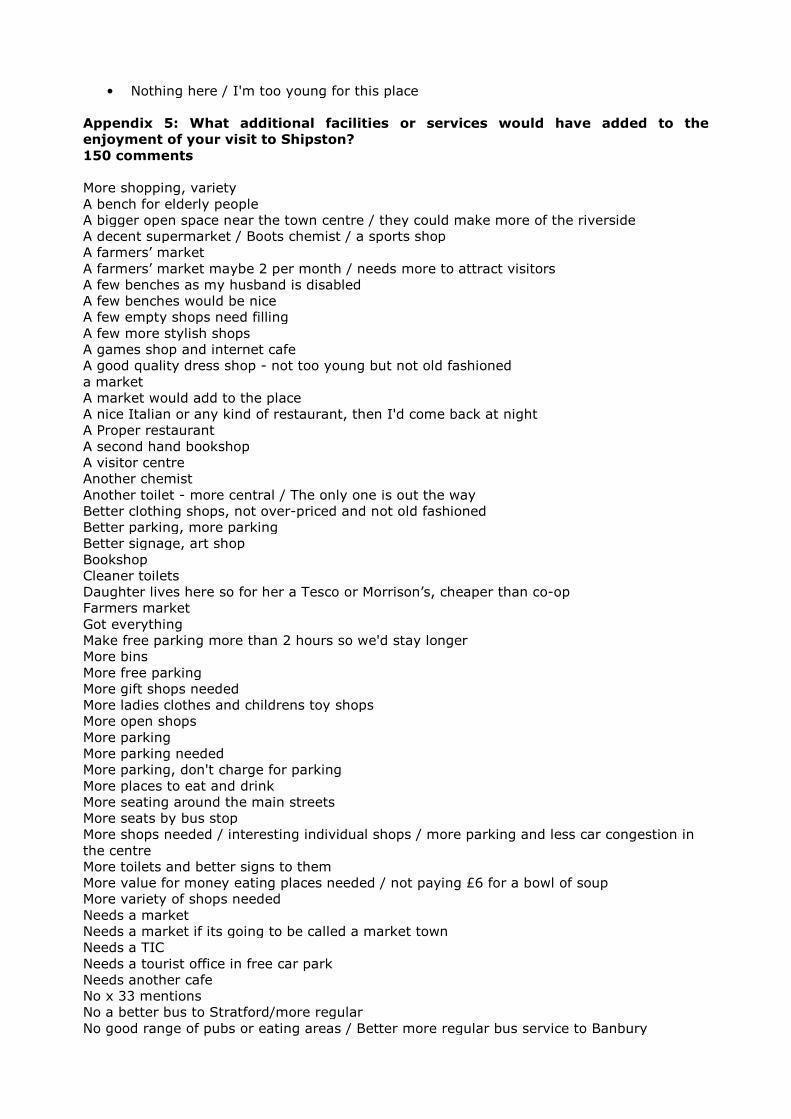
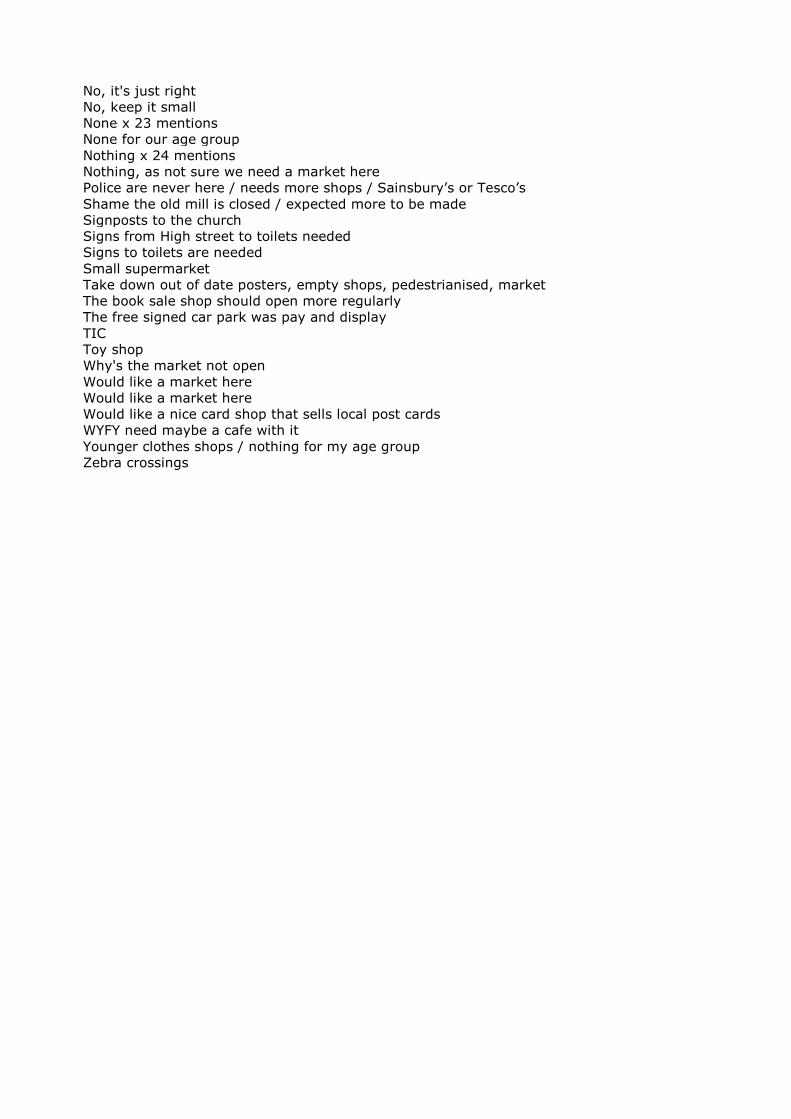
Appendix 5: What additional facilities or services would have added to the
enjoyment of your visit to Shipston?
150 comments
More shopping, variety
A bench for elderly people
A bigger open space near the town centre / they could make more of the riverside
A decent supermarket / Boots chemist / a sports shop
A farmers’ market
A farmers’ market maybe 2 per month / needs more to attract visitors
A few benches as my husband is disabled
A few benches would be nice
A few empty shops need filling
A few more stylish shops
A games shop and internet cafe
A good quality dress shop - not too young but not old fashioned
a market
A market would add to the place
A nice Italian or any kind of restaurant, then I'd come back at night
A Proper restaurant
A second hand bookshop
A visitor centre
Another chemist
Another toilet - more central / The only one is out the way
Better clothing shops, not over-priced and not old fashioned
Better parking, more parking
Better signage, art shop
Bookshop
Cleaner toilets
Daughter lives here so for her a Tesco or Morrison’s, cheaper than co-op
Farmers market
Got everything
Make free parking more than 2 hours so we'd stay longer
More bins
More free parking
More gift shops needed
More ladies clothes and childrens toy shops
More open shops
More parking
More parking needed
More parking, don't charge for parking
More places to eat and drink
More seating around the main streets
More seats by bus stop
More shops needed / interesting individual shops / more parking and less car congestion in
the centre
More toilets and better signs to them
More value for money eating places needed / not paying £6 for a bowl of soup
More variety of shops needed
Needs a market
Needs a market if its going to be called a market town
Needs a TIC
Needs a tourist office in free car park
Needs another cafe
No x 33 mentions
No a better bus to Stratford/more regular
No good range of pubs or eating areas / Better more regular bus service to Banbury
No, it's just right
No, keep it small
None x 23 mentions
None for our age group
Nothing x 24 mentions
Nothing, as not sure we need a market here
Police are never here / needs more shops / Sainsbury’s or Tesco’s
Shame the old mill is closed / expected more to be made
Signposts to the church
Signs from High street to toilets needed
Signs to toilets are needed
Small supermarket
Take down out of date posters, empty shops, pedestrianised, market
The book sale shop should open more regularly
The free signed car park was pay and display
TIC
Toy shop
Why's the market not open
Would like a market here
Would like a market here
Would like a nice card shop that sells local post cards
WYFY need maybe a cafe with it
Younger clothes shops / nothing for my age group
Zebra crossings