draga claudia marin
DESCRIPTION
31 st USAEE/IAEE North American Conference Sheraton Austin, Texas 4-7 November 2012. THE STRATEGIES OF BRICS’ NATIONAL OIL COMPANIES FOR ENERGY SECURITY : JOINT VENTURES BARGAINING AND VERTICAL INTEGRATION. Draga Claudia MARIN. Agenda. - PowerPoint PPT PresentationTRANSCRIPT
THE STRATEGIES OF BRICS’ NATIONAL OIL COMPANIES FOR ENERGY SECURITY : JOINT VENTURES BARGAINING AND VERTICAL
INTEGRATION
Draga Claudia MARIN
31st USAEE/IAEE North American ConferenceSheraton Austin, Texas4-7 November 2012
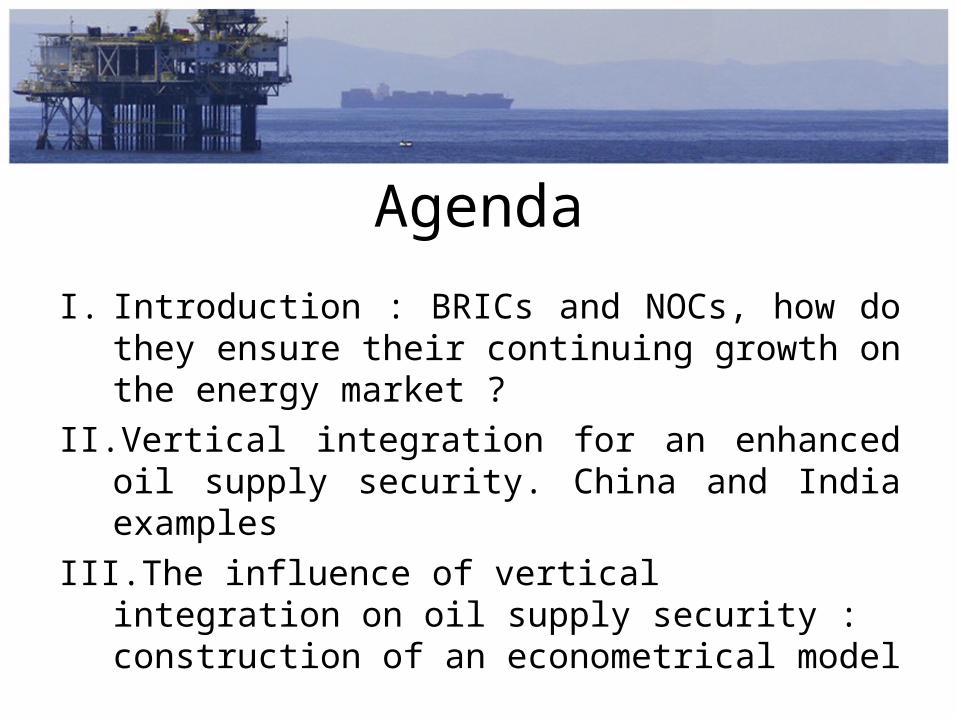
Agenda
I. Introduction : BRICs and NOCs, how do they ensure their continuing growth on the energy market ?
II. Vertical integration for an enhanced oil supply security. China and India examples
III. The influence of vertical integration on oil supply security : construction of an econometrical model
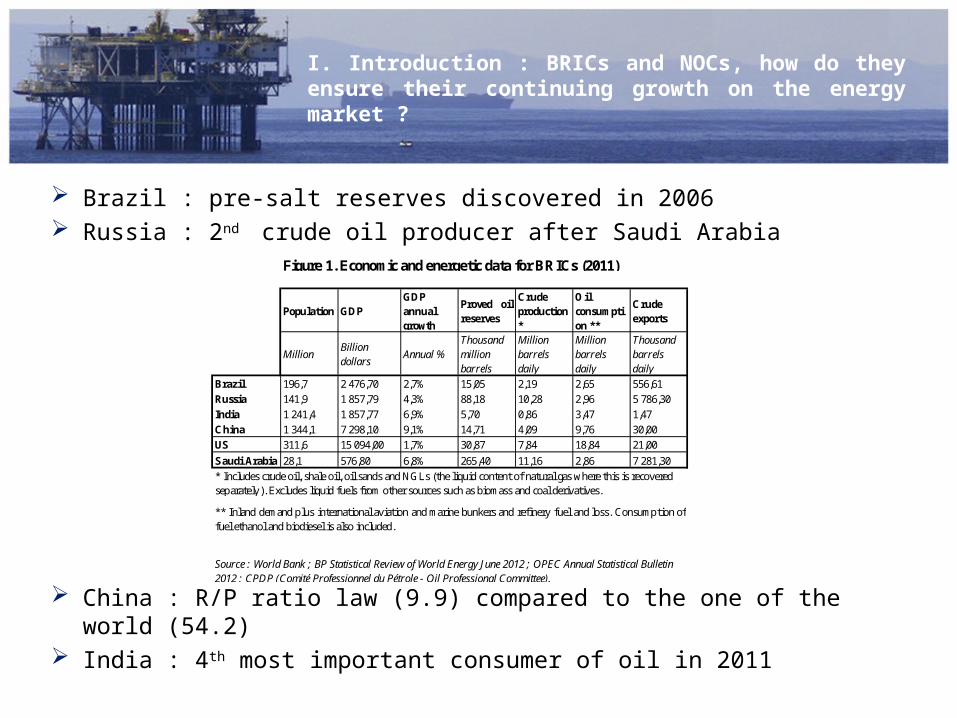
Brazil : pre-salt reserves discovered in 2006 Russia : 2nd crude oil producer after Saudi Arabia
China : R/P ratio law (9.9) compared to the one of the world (54.2)
India : 4th most important consumer of oil in 2011
Population GDPGDP annual growth
Proved oilreserves
Crude production *
Oil consumption **
Crude exports
MillionBillion dollars
Annual %Thousand million barrels
Million barrels daily
Million barrels daily
Thousand barrels daily
Brazil 196,7 2 476,70 2,7% 15,05 2,19 2,65 556,61
Russia 141,9 1 857,79 4,3% 88,18 10,28 2,96 5 786,30
India 1 241,4 1 857,77 6,9% 5,70 0,86 3,47 1,47
China 1 344,1 7 298,10 9,1% 14,71 4,09 9,76 30,00
US 311,6 15 094,00 1,7% 30,87 7,84 18,84 21,00
Saudi Arabia 28,1 576,80 6,8% 265,40 11,16 2,86 7 281,30
Figure 1. Economic and energetic data for BRICs (2011)
* Includes crude oil, shale oil, oil sands and NGLs (the liquid content of natural gas where this is recovered separately). Excludes liquid fuels from other sources such as biomass and coal derivatives.
** Inland demand plus international aviation and marine bunkers and refinery fuel and loss. Consumption offuel ethanol and biodiesel is also included.
Source : World Bank ; BP Statistical Review of World Energy June 2012 ; OPEC Annual Statistical Bulletin 2012 ; CPDP (Comité Professionnel du Pétrole - Oil Professional Committee).
I. Introduction : BRICs and NOCs, how do they ensure their continuing growth on the energy market ?
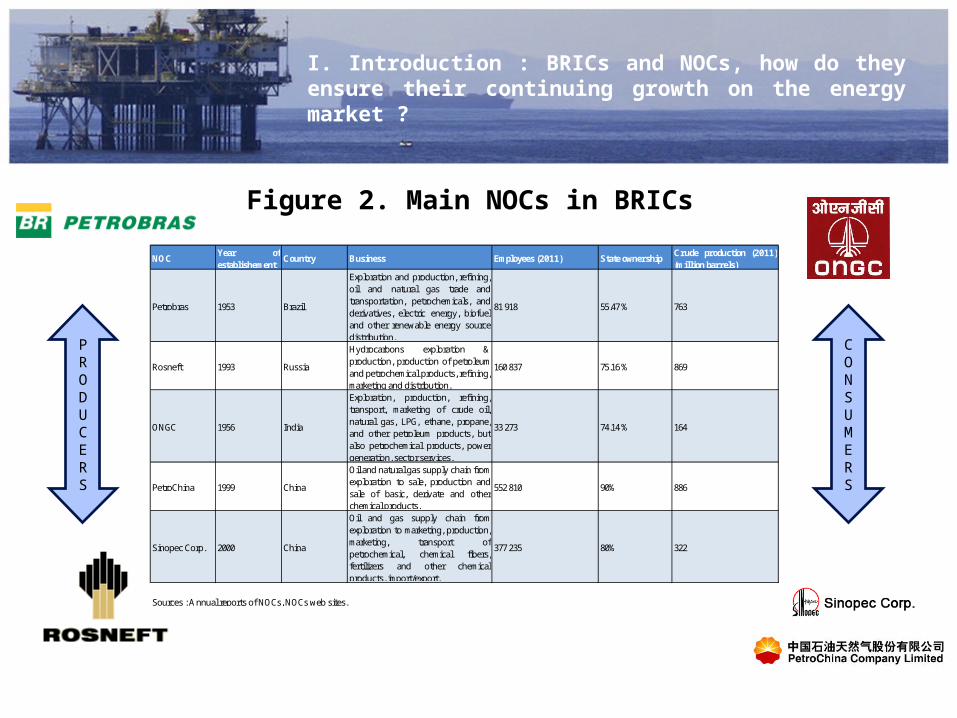
Figure 2. Main NOCs in BRICs
NOCYear ofestablishement
Country Business Employees (2011) State ownershipCrude production (2011)(million barrels)
Petrobras 1953 Brazil
Exploration and production, refining,oil and natural gas trade andtransportation, petrochemicals, andderivatives, electric energy, biofueland other renewable energy sourcedistribution.
81 918 55.47 % 763
Rosneft 1993 Russia
Hydrocarbons exploration &production, production of petroleumand petrochemical products, refining,marketing and distribution.
160 837 75.16 % 869
ONGC 1956 India
Exploration, production, refining,transport, marketing of crude oil,natural gas, LPG, ethane, propane,and other petroleum products, butalso petrochemical products, powergeneration, sector services.
33 273 74.14 % 164
PetroChina 1999 China
Oil and natural gas supply chain from exploration to sale, production andsale of basic, derivate and otherchemical products.
552 810 90% 886
Sinopec Corp. 2000 China
Oil and gas supply chain fromexploration to marketing, production,marketing, transport ofpetrochemical, chemical fibers,fertilizers and other chemicalproducts, import/export.
377 235 80% 322
Sources : Annual reports of NOCs, NOCs web sites.
PRODUCERS
CONSUMERS
I. Introduction : BRICs and NOCs, how do they ensure their continuing growth on the energy market ?
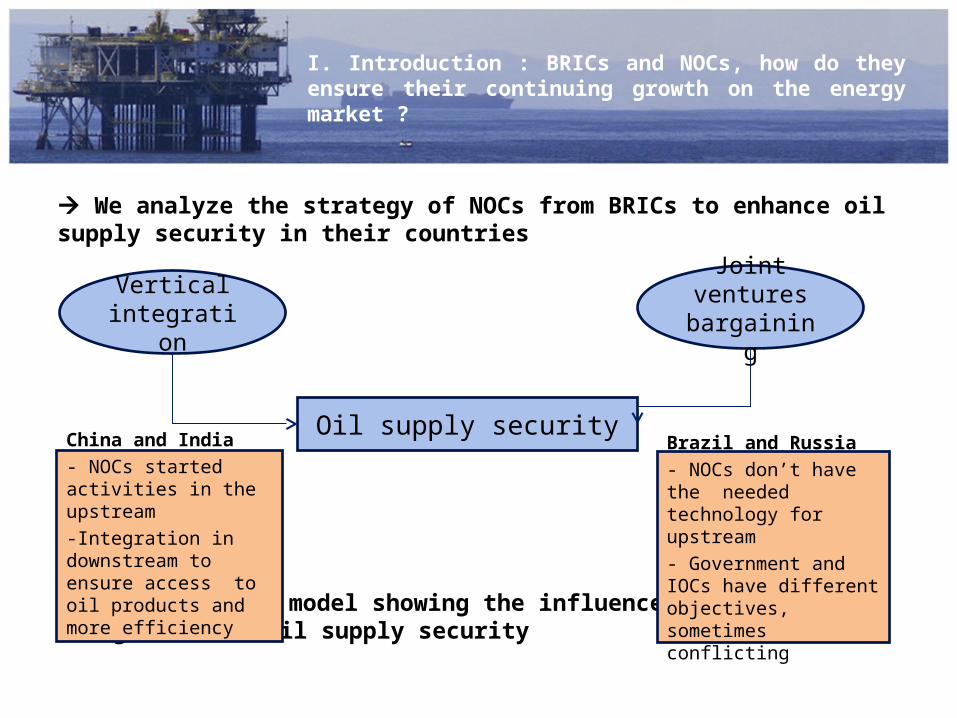
We analyze the strategy of NOCs from BRICs to enhance oil supply security in their countries
Econometrical model showing the influence of vertical integration on oil supply security
Vertical integration
Joint ventures bargaining
Oil supply securityChina and India- NOCs started activities in the upstream-Integration in downstream to ensure access to oil products and more efficiency
Brazil and Russia- NOCs don’t have the needed technology for upstream- Government and IOCs have different objectives, sometimes conflicting
I. Introduction : BRICs and NOCs, how do they ensure their continuing growth on the energy market ?
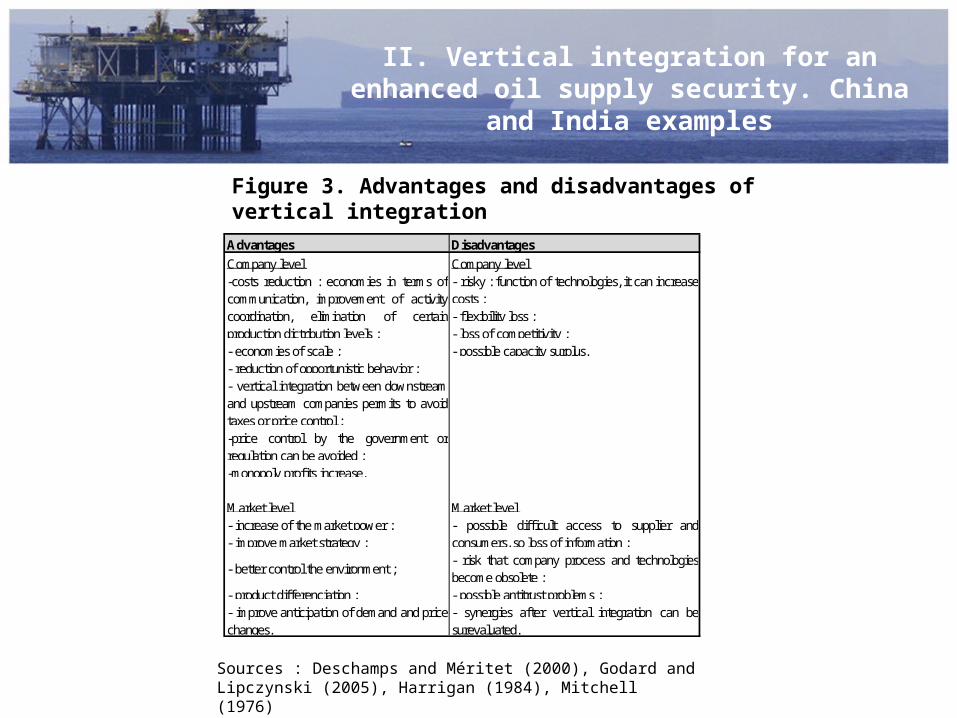
Advantages Disadvantages
Company level Company level- risky : function of technologies, it can increasecosts ;- flexibility loss ;- loss of competitivity ;
- economies of scale ; - possible capacity surplus.- reduction of opportunistic behavior ;
-price control by the government orregulation can be avoided ;-monopoly profits increase.
Market level Market level- increase of the market power ;- improve market strategy ;
- better control the environment ;- risk that company process and technologiesbecome obsolete ;
- product differenciation ; - possible antitrust problems ;
- vertical integration between downstreamand upstream companies permits to avoidtaxes or price control ;
-costs reduction : economies in terms ofcommunication, improvement of activitycoordination, elimination of certainproduction dictribution levels ;
- improve anticipation of demand and pricechanges.
- possible difficult access to supplier andconsumers, so loss of information ;
- synergies after vertical integration can besurevaluated.
Figure 3. Advantages and disadvantages of vertical integration
II. Vertical integration for an enhanced oil supply security. China and India
examples
Sources : Deschamps and Méritet (2000), Godard and Lipczynski (2005), Harrigan (1984), Mitchell (1976)
II. Vertical integration for an enhanced oil supply security. China and India
examples
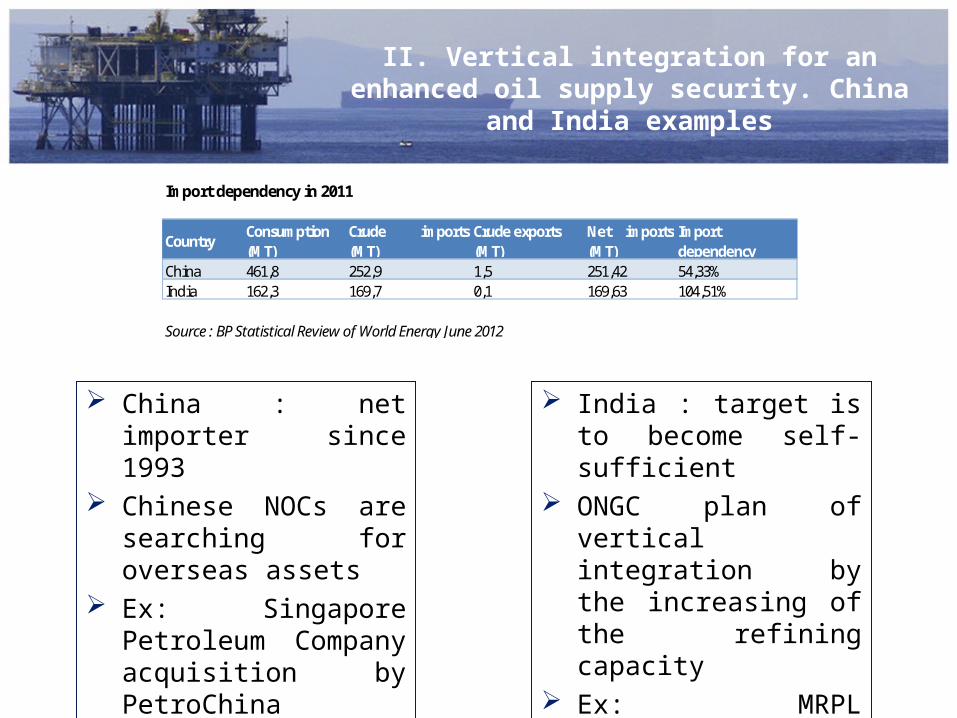
China : net importer since 1993
Chinese NOCs are searching for overseas assets
Ex: Singapore Petroleum Company acquisition by PetroChina
India : target is to become self-sufficient
ONGC plan of vertical integration by the increasing of the refining capacity
Ex: MRPL acquisition by ONGC
Import dependency in 2011
CountryConsumption (MT)
Crude imports(MT)
Crude exports (MT)
Net imports(MT)
Import dependency
China 461,8 252,9 1,5 251,42 54,33%India 162,3 169,7 0,1 169,63 104,51%
Source : BP Statistical Review of World Energy June 2012
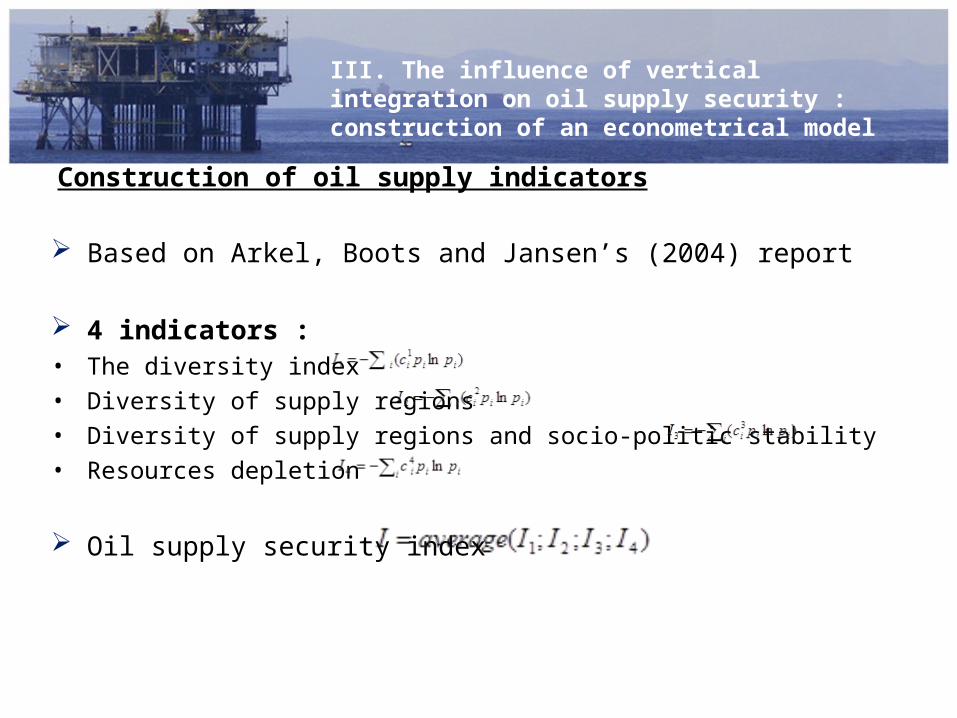
Construction of oil supply indicators
Based on Arkel, Boots and Jansen’s (2004) report
4 indicators :• The diversity index • Diversity of supply regions • Diversity of supply regions and socio-politic stability• Resources depletion
Oil supply security index
III. The influence of vertical integration on oil supply security : construction of an econometrical model
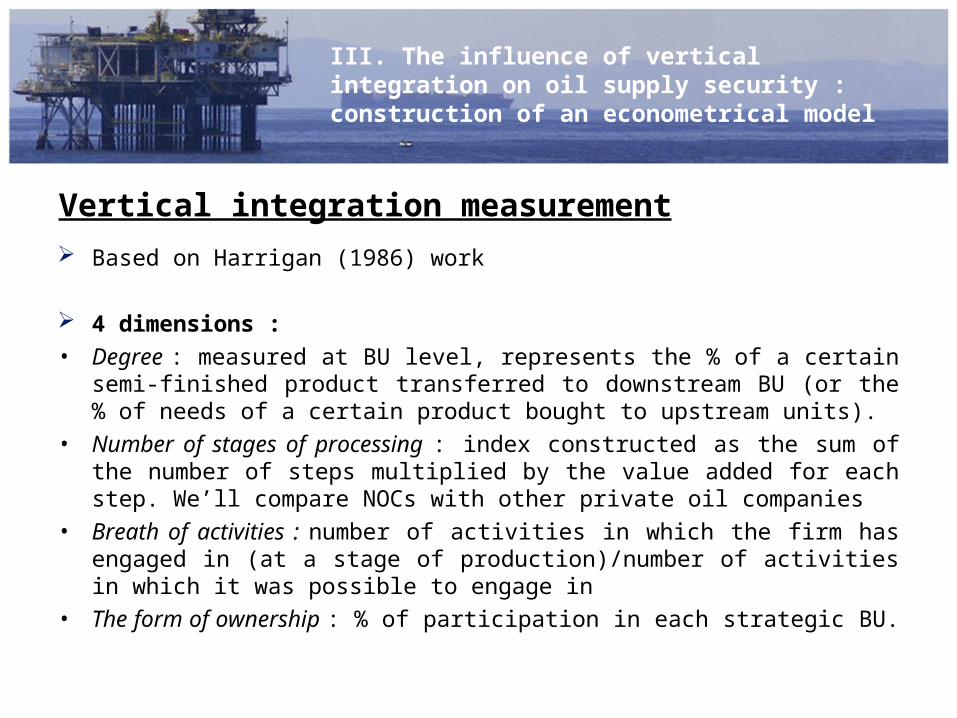
Vertical integration measurement
Based on Harrigan (1986) work
4 dimensions : • Degree : measured at BU level, represents the % of a certain
semi-finished product transferred to downstream BU (or the % of needs of a certain product bought to upstream units).
• Number of stages of processing : index constructed as the sum of the number of steps multiplied by the value added for each step. We’ll compare NOCs with other private oil companies
• Breath of activities : number of activities in which the firm has engaged in (at a stage of production)/number of activities in which it was possible to engage in
• The form of ownership : % of participation in each strategic BU.
III. The influence of vertical integration on oil supply security : construction of an econometrical model
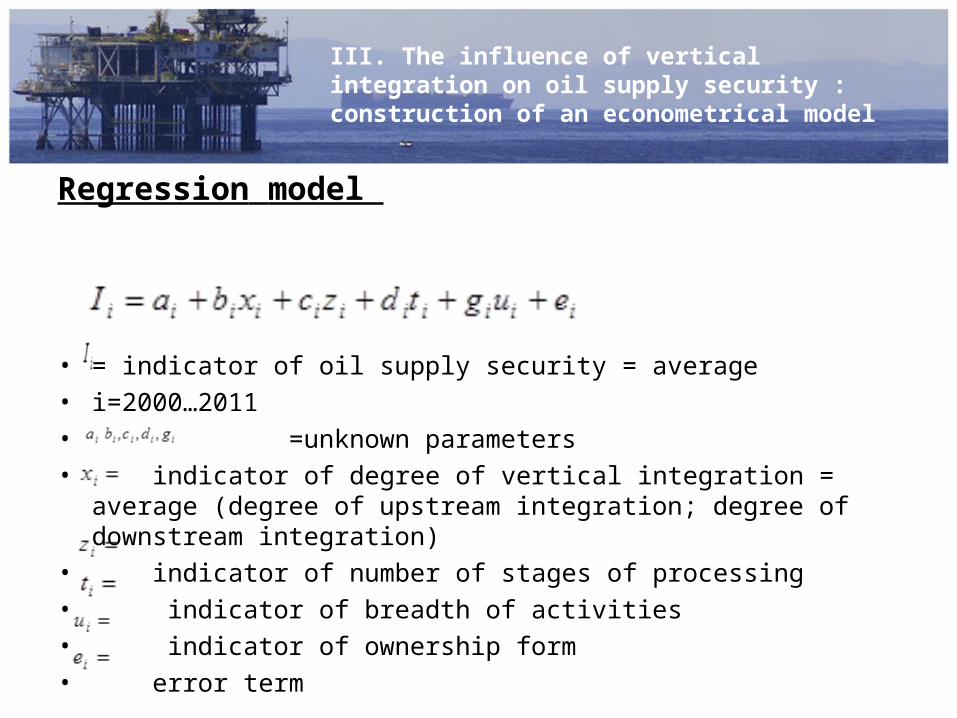
Regression model
• = indicator of oil supply security = average • i=2000…2011• =unknown parameters• indicator of degree of vertical integration = average (degree of
upstream integration; degree of downstream integration)• indicator of number of stages of processing• indicator of breadth of activities• indicator of ownership form• error term
III. The influence of vertical integration on oil supply security : construction of an econometrical model
The model is in a conceptual shape Data missing : For China and India (for the period 2000-2011) :Crude oil production abroad in each countryCrude oil imports from each sourceCrude oil production in some provinces of China For ONGC (for the period 2000-2011) : self-supply from
E&P
III. The influence of vertical integration on oil supply security : construction of an econometrical model
Concluding thoughts