durham e-theses software architecture visualisationetheses.dur.ac.uk/3040/1/3040_1064.pdf · of...
TRANSCRIPT
Durham E-Theses
Software architecture visualisation
Hatch, Andrew
How to cite:
Hatch, Andrew (2004) Software architecture visualisation, Durham theses, Durham University. Available atDurham E-Theses Online: http://etheses.dur.ac.uk/3040/
Use policy
The full-text may be used and/or reproduced, and given to third parties in any format or medium, without prior permission orcharge, for personal research or study, educational, or not-for-pro�t purposes provided that:
• a full bibliographic reference is made to the original source
• a link is made to the metadata record in Durham E-Theses
• the full-text is not changed in any way
The full-text must not be sold in any format or medium without the formal permission of the copyright holders.
Please consult the full Durham E-Theses policy for further details.
Academic Support O�ce, Durham University, University O�ce, Old Elvet, Durham DH1 3HPe-mail: [email protected] Tel: +44 0191 334 6107
http://etheses.dur.ac.uk

Software Architecture Visualisation
Andrew Hatch
Department of Computer Science
University of Durham
1999- 2004
March 2004
PhD Thesis A copyright of this thesis rests with the author. No quotation from it should be published without his prior written consent and information derived from it should be acknowledged.
j 1 JAN 2005

Abstract
Tracing the histmy of software engineering reveals a series of abstractions. In early days, software engineers
would construct software using machine code. As time progressed, software engineers and computer
scientists developed higher levels of absh·action in order to provide tools to assist in building larger software
systems. This has resulted in high-level languages, modelling languages, design patterns, and software
architecture. Software architecture has been recognised as an important tool for designing and building
software. Some research takes the view that the success or failure of a software development project depends
heavily on the quality of the software architecture.
For any software system, there are a number of individuals who have some interest in the architecture. These
stakeholders have differing requirements of the software architecture depending on the role that they take.
Stakeholders include the architects, designers, developers and also the sales, services and support teams and
even the customer for the software. Communication and understanding of the architecture is essential in
ensuring that each stakeholder can play their role during the design, development and deployment of that
software system.
Software visualisation has h·aditionally been focused on aiding the understanding of software systems by
those who perform development and maintenance tasks on that software. In suppmting developers and
maintainers, software visualisation has been largely concerned with representing static and dynamic aspects
of software at the code level. Typically, a software visualisation will represent control flow, classes, objects,
impmt relations and other such low level absh·actions of the software.
This research identifies the fundamental issues concerning software architecture visualisation. It does this by
identifYing the practical use of software architecture in the real world, and considers the application of
software visualisation techniques to the visualisation of software architecture. The aim of this research is to
explore the ways in which software architecture visualisation can assist in the tasks unde1taken by the
differing stakeholders in a software system and its architecture.
A prototype tool, named Arch Vis, has been developed to enable the exploration of some of the fundamental
issues in software architecture visualisation. Arch Vis is a new approach to software architecture visualisation
that is capable of utilising multiple sources and representations of architecture in order to generate multiple
views of software architecture. The mechanism by which views are generated means that they can be more
relevant to a wider collection of stakeholders in that architecture. During evaluation Arch Vis demonstrates
the capability of utilising a number of data sources in order to produce architecture visualisations. Arch Vis'
view model is capable of generating the necessary views for architechire stakeholders and those stakeholders
can navigate through the views and data in order to obtain relevant information. The results of evaluating

Arch Vis using a framework and scenmios demonstrate that the majority of the objectives ofthis research have
been achieved.
ii

Acknowledgements
Since stm1ing this PhD, there have been a number of very significant events, many of which have shaped this
thesis in some way. I believe that those people who have shared some pa11 of my life since October 1999 will
realise how they have helped in my completion of this thesis, and some will need a little encouragement to
realise it. If you are not mentioned below, it is purely a result of my dysfunctional memory!
Lyn, my wife, has been a constant bedrock of love and support- even during the times when we could not be
together, either by my being away from home, or from being hidden behind a desk. I am enormously grateful
and thankful to her for so many things.
My family, both northem and southem, they are largely responsible for who I am. Enonnous thanks to them
for allowing me to find my way and being supportive of the decisions I've made.
For everybody at the University of Durham who I have shared time with - both staff, colleagues and friends,
thank you for a great time of life and teaming -my University years have been amongst the best experiences I
have had. In particular, a debt of thanks to Prof Malcolm Munro, whose supervision has been exactly what I
have needed and who gave me the opportunity to research under his guidance. Thank you also to Jill Munro
for proofreading the text- your contributions were ve1y much appreciated.
I would also like to thank friends who were not with me in Durham, but who have helped keep me on the
straight and narrow in recent times and beyond: Leon, Chris, Angela, Ian, Julie, Koen, Sarah, Pete, Andy,
Tim, Stum1, Ben, Jenny, Andy and Esther. Also in memory of Lee Kuczer.
Finally, thanks go to the Engineering and Physical Sciences Research Council (EPSRC) for funding this
research.
Ill

Copyright
The copyright of this thesis rests with the author. No quotation from this thesis should be published without
prior written consent. Information de1ived from this thesis should also be acknowledged.
Declaration
No part of the mate1ial provided has previously been submitted by the author for a higher degree in the
University of Durham or any other University. All the work presented here is the sole work of the author and
no one else.
This research has been documented, in pm1, within the following publication:
A. S. Hatch, M. P. Smith, C. M. B. Taylor and M. Munro, No Silver
Bullet fhr Software Visualisation Evaluation, Proceedings of the Workshop
on Fundamental Issues of Visualization, Proceedings of The Intemational
Conference on Imaging Science, Systems and Technology (CISST), Las
Vegas, USA, June 2001, pp. 651-657
IV

Contents
Abstract .............................................................................................................................................................. !
Acknowledgements ............................................................................................................................. . lll
Copyright ........................................................................................................................................................ 1v
Declaration ........................................................................................................................................................ .iv
Contents ............................................................................................................................................................. v
List of Figw·es ............................................................................................................................................... xm
List of Tables ............................................................................................................................ . . ........... XVll
Chapter I: Introduction ................................................................................................................................ I
1.1 Introduction .................................................. . ................................................................ 2
1.2 Objectives ........................................................................................................................................... 2
1.3 Criteria for Success ........................................................................................................................... 3
1.4 Thesis Overview ................................................................... . ............ 3
Chapter 2: Software Architecture ................................................................................................................. 5
2.1 Introduction ....................................................................................................................................... 6
2.2 Definition ............................................................................................................................................ 6
2.3 Architecture in Practice ....................................................................................................................... 7
2.3.1 Motivation ................................................................................................................................... 7
2.3.2 Roles and Use .............................................................................................................................. 9
2.4 Software Architecture Styles ............................................................................................................. 13
2.4.1 Examples ................................................................................................................................... 14
v

2.4.2 Heterogeneous Software Architectures .................................................................................... 16
2.5 Representation ................................................................................................................................ 16
2.5.1 Undocumented ......................................................................................................................... 16
2.5.2
2.5.3
2.5.4
2.5.5
Overview Diagrams ................................................................................................................ 17
Documented ............................................................................................................................ 17
ADLs ....................................................................................................................................... 18
UML ....................................................................................................................................... 20
2.5.6 Source Code and Configuration Files ....................................................................................... 21
2.6 Conclusions ...................................................................................................................................... 22
Chapter 3: Software Visualisation ............................................................................................................ 23
3.1
3.2
3.3
3.3.1
Introduction .................................. . . .. 24
Current Uses of Software Visualisation ......................................................................................... 24
Histmy, Trends and Issues ............................................................................................................. 30
Graphs ................................................................................................................................... 30
3.3.2 2D and 3D ................................................................................................................................. 31
3.3.3 Dynamic and Static Software Visualisation .............................................................................. 32
3.3.4 Abstraction ................................................................................................................................ 33
3.4 Fundamental Principles ................................................................................................................... 34
3.5 Conclusions ....................................................................................................................................... 34
Chapter 4: Software Architecture Visualisation .......................................................................................... 36
4.1 Introduction ....................................................................................................................................... 37
4.2 Existing Software Architecture Visualisations .................................................................................. 37
Vl

4.2.1
4.2.2
4.2.3
4.2.4
4.2.5
4.2.6
4.3
Feijs and de Jong ..................................................................................................................... 37
The Searchable Bookshelf... .................................................................................................... 38
SoftArch .......................................................................... . ............................................. 39
SoFi ............................................................................................................................... . .... .42
LePUS ..................................................................... . ····················· ················· .......... 44
Enterprise Architect ................................................................................................................. 46
Views of Architecture ................................................................................................................... .47
4.3.1 4+ 1 View Model... ..................................................................................................................... 48
4.3.2 IEEE 1471-2000 ........................................................................................................................ 49
4.4
4.4.1
4.4.2
4.4.3
4.4.4
4.5
Current Trends Issues and Challenges ............................. . ........................................ 50
Definitions, Views and Models of Architecture ..................................................................... 50
Representation and Mappings .............................................................................. . ........ 50
Roles and Stakeholders .......................................................................................... . . ....... 51
Obtaining Architectural Data ................................ . .. ············································ ............. 51
Conclusions ............................................................................................................. . .............. 53
Chapter 5: The Arch Vis Approach ............................................................................................................ 54
5.1 Introduction .................................................................................... . ................................... 55
5.2 Arch Vis Visualisation System Overview .......................................................................................... 55
5.2.1 Overview of Visualisation Definition ........................................................................................ 56
5.2.2 Overview of Data Extraction ..................................................................................................... 56
5.2.3 Overview ofExecution .............................................................................................................. 57
5.3 Architecture Representation Choice .................................................................................................. 57
Vll
5.3.1 Entities ........................................................ . ···················································· ..... 57
5.3.2 Relationships ............................................................................................................................ 58
5.4 Data Extraction and Storage .............................................................................................................. 59
5.4.1
5.4.2
5.5
5.6
Static Data ......................................... . ............................................................. 60
Transient Data ................................................................................................. . .................. 66
Arch Vis View Model ...................................................................................................................... 70
Render Models and Renderers ........................................................................................................ 72
5.6.1 The Render ModeL ................................................................................................................. 73
5.6.2
5.6.3
5.7
5.8
5.9
5.9.1
Architectural Style .................................................. . ..................................................... 76
Renderers ................................................................................................................................. 77
Transient Data Extraction and Use .................. . ····························· ............................. 77
Arch Vis Architecture ...................................................................................................................... 79
Example Views .............................................................................................................................. 81
Component Views .................................................................................................... . ....... 81
5.9.2 Developer Views ...................................................................................................................... 85
5.9.3 Project Manager Views ............................................................................................................. 87
5.9.4 Technology and Deployment Views ........................................................................................ 89
5.9.5 Sales and Marketing Views ...................................................................................................... 92
5.10 Activities ........................................................................................................................................... 93
5.10.1 Querying .................................................................................................................................... 93
5.10.2 Layout ....................................................................................................................................... 94
5.10.3 Browsing ................................................................................................................................... 95
V111
5.10.4 Searching .................................................................................................................................. 96
5.10.5 Annotation ................................................................................................................................ 96
5.10.6 Consolidating Views .............................................................................................................. 97
5. I 0. 7 Context Sensitive Actions ........................................................................................................ 97
5.11 Conclusions ..................................................................................................................................... 99
Chapter 6: Implementation ....................................................................................................................... I 00
6. I Introduction ..................................................................................................................................... I 0 I
6.2 Architectural Data Capture .............................................................................................................. I 0 I
6.2.1 ArchVisAcmeParser ............................................................................................................... 102
6.2.2
6.2.3
6.2.4
6.2.5
6.2.6
6.2.7
Mode!Builder ........................................................................................................................ 103
ReflectionParser ................................................................................................................... I 03
PropertiesReader .................................................................................................................. I 03
INIFileReader ........................................................................................................................ 103
FileSystemReader. ................................... . ............................................................... 100
ArchVisJDI. ....................................................................................... . ............... 103
6.2.8 ArchLog ................................................................................................................................. 104
6.2.9 HTTPCapture ......................................................................................................................... 104
6.3 Static Data Filter Librmy ................................................................................................................ 104
6.4 Renderers ......................................................................................................................................... 105
6.5 Arch Vis Prototype lmplementation ................................................................................................. I06
6.6 Use of the Prototype Tools .............................................................................................................. I06
6.6.1 Static Data Server .................................................................................................................... l06
IX
6.6.2
6.6.3
6.7
Modeller ................................................................................................................................ 107
Arch Vis Browser ................................................................ . ......................................... tm
Conclusions ................................................................................................................................... I 09
Chapter 7: Evaluation Approach ............................................................................................................. II 0
7.1
7.2
7.2.1
Introduction ......................................................................................... . ................................ Ill
Software Visualisation Evaluation Strategies ....................................................... . ................ Ill
Design Guidelines ................................................................................................................. Ill
7.2.2 Feature-Based Evaluation Frameworks ................................................................................... II2
7.2.3 User and Empirical Studies .................................................................................................... 113
7.2.4 Scenarios and Walkthroughs ............................. . ······················ ..................................... 114
7.3 Chosen Evaluation Approach ........................................................................................................ 115
7.3.1 Evaluation Framework ........ . .................. ······························· .................................. 115
7.3.2 Scenarios ..................................................................................... . ............ 124
7.3.3 Informal Evaluation ...................................................................... . ..................... 124
7.4 Conclusions ........................................................................................ . .............................. 125
Chapter 8: Arch Vis Evaluation ................................................................................................................ 126
8.1 Introduction .............................................................. , ...................................................................... 127
8.2 Application of the Framework to Arch Vis ...................................................................................... 127
Static Representation (SR) ...................................................................................................................... 127
Dynamic Representation (DR) ................................................................................................................ 129
Views (V) ................................................................................................................................................ I30
Navigation and Interaction (NI) .............................................................................................................. 131
X

Task Support (TS) ............................................................................................................................... 132
Implementation(!) ................................................................................................................................ 134
Visualisation (VN) ................................................................................................................................ 135
8.2.1 Summary .............................................................................................................................. 137
8.3 Scenarios ..................................................................................................................... . ·········· 138
8.3.1 Analysis of Architectures of Existing Systems ...................................................................... 138
8.3.2 Analysis of Alternative Architectures ................................................................................... 141
8.3.3 Specification of Single System Architecture ........................................................................... 145
8.3.4 Communication Between Stakeholders .............................................. . ........................... 147
8.3.5 Conformance Checking ......................................................................................................... 149
8.3.6 Operational and Infrastructure Suppmt ............................................................................... 151
8.3.7 Architecture Evaluation ......................................................................................................... 153
8.3.8 System Development ....... . ·································· ........................ 154
8.4 Informal Evaluation .................................................................................... . ························ 156
8.4.1 Static Data Support... ............................................................................................................. 156
8.4.2 Renderers and Render Model Capability ................................................................................ 159
8.4.3 Views ....................................................................................................................................... 159
8.4.4 Implementation ...................................................................................................................... 159
8.5 Conclusions ..................................................................................................................................... 160
Chapter 9: Cone lusions ............................................................................................................................. 161
9.1 Introduction ..................................................................................................................................... 161
9.2 Summary of Research ..................................................................................................................... 161
XI

9.3 Crite1ia for Success ....................................................................................................................... 162
9. 3. l I<hltify 1le cwrentuse of architeduJe viswlisatirn in rm;tice ~ ~ 1le llfiks clifltmll:smkemlders ~fum ........ 162
9. 3 . 2 Address the visualisation issues of rep~esenting software mchitecttne for different stakeholders. . . . . . . . . . . . . . . . . . . . . . . . 16 3
9. 3. 3 Identity a mechanism fm" providing aJChitectural infonnation to an aJChitecttne visualisation ............................ 163
9. 3 . 4 Develop visual representations of softwrue aJChitecttnes that me suited to 1le identified tasks. . . . . . . . . . . . . . . . . . . . . . . . . . . . 16 3
9.3 .5 Develop a proof of concept prototype tool to demonstrate the visualisations ......................... 164
9. 3 . 6 r::mxmrnte trntfte vrud&ttia"f> can 1.x: gtn'2ll1ed aulr:mllicallywith minimal cliiDJpicn to 1le 9Jflware sy.;trn iB:If . . . . . 164
9.3.7
9.4
9.5
9.5.1
9.5.2
9.5.3
9.6
Create a feattue OOsed evaluation framework suitable for software mchitecttne visualisation .................. 164
Comparing Arch Vis ............................. . . ................................................................................. 1M
Future Work ................................................................................................................................. 165
Architecture Representations .. ...... 165
Architectural Views ............................................................................................................... 165
Implementation ...................................................................................................................... 166
Conclusion ..................................................................................................................................... 166
References ....................................................................................................................................................... 167
XII

List of Figures
Figure 2-1 Architecting process ....................................................................................................................... 10
Figure 2-2 SunTM ONE web server architecture ................................................................................ . . ..... 12
Figure 2-3 Enterprise web application architecture .......................................................................................... 13
Figure 2-4 Instance Store API Architecture Overview ................................................................................... 17
Figure 3-1 Call graphs ...................................................................................................................................... 25
Figure 3-2 Data flow in the ShriMP visualisation system .................................... . . ............................ 26
Figure 3-3 JBuilder Integrated Development Environment ............................................................................. 27
Figure 3-4 Systems hotspot view in Geocrawler. ............................................................................................. 28
Figure 3-5 Revision Towers visualisation ......................................................... . . .......................... 28
Figure 3-6 DJVis runtime view ......................................................................................................................... 29
Figure 3-7 Quicksort algorithm animation in SAMBA ................................................................................... 30
Figure 3-8 Call graph in 3D ............................................................................................................................. 31
Figure 3-9 Software World class visualisation ................................................................................................. 32
Figure 4-1 Arch View architecture visualisation ................................................................................................ 3 7
Figure 4-2 Searchable Bookshelf ..................................................................................................................... 39
Figure 4-3 SoftArch's visual language ............................................................................................................. 40
Figure 4-4 SoftArch dynamic view .................................................................................................................. .42
Figure 4-5 System structure extracted from SoFi .............................................................................................. 43
Figure 4-6 System structure redrawn by system designer ................................................................................. 43
Figure 4-7 Extracted architecture ...................................................................................................................... 43
XIII

Figure 4-8 LePUS building blocks ................................................................................................................... 44
Figure 4-9 Additional LePUS symbols ............................................................................................................ 44
Figure 4-10 LePUS diagram ofthe Enterprise JavaBeans framework .............................................................. 45
Figure 4-11 Enterptise Architect... ................................................................................................................. .4 7
Figure 5-1 Arch Vis Visualisation System Overview ....................................................................................... 56
Figure 5-2 Arch Vis data interfaces .................................................................................................................. 60
Figure 5-3 Arch Vis data gateway .................................................................................................................... 61
Figure 5-4 Arch Vis static data server. ............................................................................................................ 61
Figure 5-5 EntityRelationshipStore static UML diagram ........................................... . . ........................... 62
Figure 5-6 Data Extractors in Arch Vis .............................................................................................. . . ... 63
Figure 5-7 Acme ADL language structure ................... . . .................. 64
Figure 5-8 Data flow dia61fam of source code parsing .................................................................................... 64
Figure 5-9 Data flow diagram of parser database extraction ............................................................................ 65
Figure 5-10 Arch Vis modeller .......................................................................................................................... 66
Figure 5-11 Arch Vis transient data intetface ................................................................................................... 66
Figure 5-12 Arch Vis client-setver communication for transient data .............................................................. 67
Figure 5-13 Arch Vis and the Java debugger interface ..................................................................................... 68
Figure 5-14 HTTP network sniffing tool ......................................................................................................... 69
Figure 5-15 Consolidation process ................................................................................................................... 70
Figure 5-16 Arch Vis view model ..................................................................................................................... 71
Figure 5-17 Arch Vis static data filters .............................................................................................................. 71
Figure 5-18 Arch Vis' render model .................................................................................................................. 72
XIV

Figure 5-19 Transient data extraction ............................................................................................................... 78
Figure 5-20 Arch Vis logical architecture .......................................................................................................... 80
Figure 5-21 Online shopping system ................................................................................................................ 81
Figure 5-22 Layered style ......................................................................................................... .. .. ...... 81
Figure 5-23 Onion-skin style ...................................................... .. . ......................................................... 82
Figure 5-24 Detailed view of shopping cat1 system ......................................................................................... 82
Figure 5-25 Component and connector view with ports, roles and packages ................................................... 84
Figure 5-26 UML static model of an architectural component ...................................................................... 85
Figure 5-27 Development assignment to classes and interfaces of a component.. ............................................ 87
Figure 5-28 A physical deployment view ........................................................................................................ 90
Figure 5-29 Framework and Technology View ............................................................................................... 91
Figure 5-30 A technology view ........................................................................................................................ 92
Figure 5-31 Input selection for a view ................................................................................. . .. .................... 94
Figure 5-32 Browsing ............ . . ........................................................................................................ ~
Figure 5-33 Browsing ....................................................................................................................................... 96
Figure 5-34 Context sensitive action ................................................................................................................. 97
Figure 6-1 Static data server activity monitor ................................................................................................. 107
Figure 6-2 Arch Vis modeller .......................................................................................................................... 107
Figure 6-3 Arch Vis browser. .......................................................................................................................... I 08
Figure 6-4 Arch Vis browser's visualisation profiles ....................................................................................... 108
Figure 6-5 Arch Vis rendered view .................................................................................................................. 109
Figure 8-1 Arch Vis view model ...................................................................................................................... 130
XV

Figure 8-2 Package Stmcture view ................................................................................................................ 140
Figure 8-3 Selecting interface usage decoration ............................................................................................ 140
Figure 8-4 Package view ................................................................................................................................ 141
Figure 8-5 The Arch Vis Acme Parser using AcmeLib .................................................................................. 143
Figure 8-6 Saving a component-connector view ........................................................................................... 144
Figure 8-7 Loading a saved architectural view .............................................................................................. 145
Figure 8-8 Implementation XML document .................................................................................................. 146
Figure 8-9 Deployment View ......................................................................................................................... 147
Figure 8-10 As designed package assignment to architectural components ................................................... 150
Figure 8-11 As implemented package assignment to architectural components ............................................. 150
Figure 8-12 Real-time deployment infonnation ............................................................................................. 153
Figure 8-13 Quality shown as rust .................................................. . . ..................................................... 154
Figure 8-14 Developer task assignment ......................................................................................................... 156
XVI

List of Tables
Table 2-1 Summary of ADLs ........................................................................................................................... 19
Table 4-1 Abstractions in SoftArch ................................................................................................................ .40
Table 4-2 Diagrams, entities and relationships in Enterprise Architect ........................................................... 46
Table 5-l Examples of entities used in architectural representations ............................................................... 58
Table 5-2 Examples of relationships used in architectural representations ...................................................... 59
Table 5-3 Render model component-connector elements ................................................................................ 73
Table 5-4 Render model UML elements .......................................................................................................... 74
Table 5-5 Render model physical elements ..................................................................................................... 74
Table 5-6 Graphical components in Arch Vis .................................................................................................. 75
Table 5-7 Graphical elements as a representation of architectural style ........................................................... 76
Table 5-8 Graphical capabilities associated with elements of the render model.. ............................................. 79
Table 5-9 Key of symbols used in component views ...................................................................................... 83
Table 5-10 Pattemfilter configuration for component views ........................................................................... 83
Table 5-11 Renderer configuration for component views ................................................................................. 84
Table 5-12 Pattemfilter configuration for a developer view ............................................................................ 86
Table 5-13 Renderer configuration for developer views ................................................................................... 86
Table 5-14 Static data filter configuration for project manager views .............................................................. 88
Table 5-15 Renderer configuration for a project manager view ....................................................................... 89
Table 5-16 Static data filter configuration for physical deployment views ....................................................... 90
Table 5-17 Renderer configuration for a physical deployment view ................................................................ 91
XVll

Table 5-18 Static data filter configuration for a technology view ..................................................................... 92
Table 5-19 Renderer configuration for a technology view ................................................................................ 93
Table 5-20 Context Sensitive Actions ............................................................................................................... 98
Table 6-1 Implementations of the Entity RelationshipS tore interface ........................................................... l 0 l
Table 6-2 Level of abstraction data extraction tools operate at ...................................................................... I 02
Table 6-3 Implemented static data filters ........................................................................................................ I 04
Table 6-4 Implemented renderers .................................................................................................................... I 05
Table 7-1 Summary of evaluation framework ............................................................................................... II7
Table 8-1 Responses to framework questions ................................................................................................. 127
Table 8-2 Summmy of the results of the framework evaluation .................................................................... I37
Table 8-3 Stakeholder Communication View matrix ................ . . .................................................... I®
Table 8-4 System Development Stakeholder-View Matrix .............. . . ................................................... I55
Table 8-5 Entity equality problem .................................................................................................................. I 57
Table 8-6 Solution to entity equality problem ................................................................................................. I 58
XVlll

Chapter 1: Introduction
1.1 Introduction
This thesis is an investigation of the application of software visualisation principles and practices to software
systems at the architecture level of abstraction.
Software systems are often large, complex and difficult for developers to understand. Software visualisation
aims to assist in the comprehension of these types of software systems. There is a clear need for developers
and maintainers to understand software at the source-code level, and much of software visualisation and
program comprehension research has been focused at this abstraction. Recently, however, it is widely
accepted that software benefits from high-level consideration &·om its design through implementation and
post-implementation analysis. With the uptake of architecture practice, there should also be a conesponding
push to develop the techniques and tools to effectively communicate software architecture to those who have
some interest in that architecture - the stakeholders. As software visualisation has been focused on lower
level aspects of software, there is a need to examine software architecture in order to dete1mine how to change
or tailor software visualisation practice to deal with this higher level of abstraction.
1.2 Objectives
It is useful to consider the architecture of a software system during its design, implementation and
maintenance phases for many reasons. This research deals with the application of visualisation techniques in
order to assist in the understanding of a software system's architecture. By supporting a stakeholder in their
task of understanding a software system's architecture, several benefits should be realised. These benefits
include reducing costs by reducing the time required for gaining an appropriate understanding, and improving
the visibility of the software architecture in order to increase the depth of understanding.
This research investigates the cunent practical application of software architecture during the lifecycle of a
software system. In doing so, several key activities, roles and stakeholders are identified for consideration
when constructing a software architecture visualisation strategy. Also, an investigation will be made into the
cunent use of software architecture visualisation highlighting the issues, challenges and merits facing existing
software architecture visualisations. It is these aspects that will form the basis for developing a new strategy
for visual ising software architectures.
In order for this research to be applicable to real world software systems, the visualisation strategy must be
shown to support information extraction techniques that would be supported in practice. The visualisations
2

identified in this research will be represented in a proof of concept tool that will allow for the evaluation of
both the visualisation strategy itself, and the inf01mation extraction techniques that are required.
Visualisations produced by this research are intended to assist in the understanding of software architectures
by various stakeholders for different activities. Towards the end of this thesis, there is a discussion of some of
the areas of research opened up that can be tackled in the future.
1.3 Criteria for Success
This research aims to investigate the applicability of software architecture visualisation in order to assist in
the understanding of software systems by different stakeholders in that system. The success of the research
will be judged against the following criteria:
a) Identify the cunent use of architechtre visualisation m practice by showing the tasks different
stakeholders petform.
b) Address the visualisation issues of representing software architecture for different stakeholders.
c) Identify a mechanism for providing architectural information to an architecture visualisation.
d) Develop visual representations of software architectures that are suited to the identified tasks.
e) Develop a proof of concept prototype tool to demonstrate the visualisations.
f) Demonstrate that the visualisations can be generated automatically with minimal disruption to the
software system itself.
g) Create a feature based evaluation framework suitable for software architecture visualisation.
An evaluation of this research against these criteria is provided in chapter 9.
1.4 Thesis Overview
Broadly speaking, there are two main areas of research that this thesis is based on. The structure of this thesis
follows the logical progression of bringing these two areas together.
Chapter 2 provides the background to Software Architecture by identifying why software architecture rs
imp011ant, and the role that it takes in present day software engineering. It also describes how architectures
are encoded and how these architecture descriptions are used. Definitions are provided for Software
Architecture that delimits the scope of this research.
3

Chapter 3 distinctly addresses Software Visualisation, examining its history through to its cunent use. This
includes descriptions of a number of existing software visualisations that broadly represent the research area.
Important areas of the psycholO!,'Y of software visualisation are presented in order to help define what
software visualisation is aiming to achieve. By detailing these fundamental areas, a definition is presented
that the remaining thesis can be based on. Major areas of research are outlined in order to position the subject
of software architecture visualisation in the wider context.
Chapter 4 focuses on software architecture visualisation, detailing existing work relating to software
architecture visualisation. Existing architecture visualisation systems are selected for examination, and their
approaches critiqued - specifically, their approach to data extraction and storage, stakeholder suppott and
style and representation choice. This chapter concludes with a summaty of some of the challenges facing
software architecture visualisation.
Chapter 5 introduces the Arch Vis approach to software architecture visualisation. The ArchVis visualisation
attempts to address the issues identified in chapter 4, and describes how this is achieved. Firstly, the Arch Vis
approach to extracting relevant data from software systems is described. Next, the views that Arch Vis
supports are presented, including how these views are constructed. Along with the desctiptions of the views,
tltis chapter describes the types of stakeholders that would make use of those views. Finally, issues regarding
the interaction between views are desctibed.
Chapter 6 outlines the implementation of the Arch Vis tool. Here, the design and build of the tool is presented
along with the choices of technology. This chapter also describes what types of systems Arch Vis is able to
visualise without customisation, and describes how the Arch Vis framework can be extended to increase its
functionality.
Chapter 7 provides an overview of evaluation strategies that can be used to evaluate this research, indicating
their relative metits. The selected evaluation approach is then desctibed in detail, along with a justification
for the approach.
Chapter 8 uses the evaluation approach desctibed in chapter 7 to evaluate Arch Vis. This consists of the
application of a feature-based framework and a set of usage scenarios. Following this, an infonnal discussion
of the issues and merits of Arch Vis concludes the chapter.
Chapter 9 concludes the thesis by summarising the research and identifying its contribution. The criteria for
success, as defined in chapter 1, are compared to the results of the thesis. From this, future research areas are
suggested for both Arch Vis and software architecture visualisation.
4

Chapter 2: Software Architecture
5

2.1 Introduction
This chapter is concemed with defining and exploring important areas of software architecture. Current
architecture definitions are presented and out of these a working definition will be identified that defmes the
scope of software architecture within this thesis.
Both the the01y and practice of software is explored as this provides a basis for showing how using software
visualisation as a development tool can support reasoning about, and developing with software architectme in
the real world. For each software system, there are many stakeholders that use software architecture in
different ways. This chapter attempts to classifY the roles that the stakeholders will take when utilising
aspects of software architecture.
A key pa1t of the use of architecture is architectural style, so a significant part of this chapter identifies key
architectural styles and also how architechJre is seen in different views. Also, this chapter identifies the forms
in which architecture takes, be it on paper, or in running software systems.
2.2 Definition
Definitions are a necessity in providing premises from which to base and formulate theories, arguments and
proofs. Firstly, existing ideas on the definition of software architecture are presented before identifYing the
definition to be used in the remainder of the thesis.
Software engineering practice has produced successively higher abstractions of software with the progression
of time. Beginning with manipulation of physical switches, software has moved from machine language and
assembly language to higher-level programming languages of diffe1ing paradigms. The activities of module
writing in high level languages and the connection of these modules together were soon seen as distinct, and
software design can be seen as a further abstraction. Software architecture sits at the design level, indicating
elements from which the system is built along with descriptions of their interaction, composition and imposed
constraints [Shaw96]. Software architecture can be viewed as the highest level of abstraction that software
engineers work with today.
Two roles that architecture can take are one of prescription - describing how the software system's
architecture should be, and description - describing how a software system's architecture is. Part of the
usefulness of architecture analysis is to measure the discrepancy between the prescribed architecture and the
architecture that describes the software produced.
6

Feijs and de Jong describe software architecture as an art and sctence for the structuring of very large
programs [Feijs98] where architectural decisions strongly influence system attributes such as efficiency and
maintainability [Mmiconi95]. However, some would argue that the discipline is not just limited to 'vety
large' programs as all software systems have an architecture, whether the designers or developers know it or
not [Kazrnan99]. Frequently, architecture is applied to software systems whose size is large enough to
wanant reasoning on a higher level than the module or class level.
In the IEEE 14 71-2000 standard [IEEE 1471 ], architecture is defined as 'the fundamental organization of a
system embodied in its components, their relationships to each other, and to the environmelll, and the
principles guiding ils design and evolution'. This sentiment is perhaps the most pervasive in the architecture
literature. Many writers adopt the view that architecture is concemed with the gross structure of a system,
describing high-level computational elements and their interactions [Monroe96].
Eden [EdenO I] categorises architecture in a different manner by identifying concrete architectures and generic
architectures. Respectively, these refer to architectures that are concerned with a particular instantiation of an
architecture, possibly realised in an implemented system. Being concrete, these specifications consist of
constant symbols that conespond to entities in the architecture. Genetic architecture specifications comprise
of variables rather than constants and are similar to architectural styles in that they distil a set of different
concrete specifications to identify fundamental aspects that describe that set.
Attempting to amalgamate the above views and ideas on software architecture yields the following definition:
'Software architeclltre is a representation of" a sof"tware .1ystem at its highest/eve/ of abstraction, consisting o(
a set offimdamental building blocks for the software system and their interconnection'.
2.3 Architecture in Practice
In order to understand the need for Software Architecture Visualisation, it is important to understand how
architecture is cunently used in practice. Firstly, the motivation of the use of architecture is considered, and
then a generic software life cycle is examined in order to identify the people and tasks that are involved, and
how software architecture plays its role.
2.3.1 Motivation
Software systems have become larger and more complex over time. Architecture becomes more impmtant in
line with this increase in size and complexity [Batman99] as it provides a suitable level of abstraction for
reasoning about the high-level entities and relationships in that system. There are several reasons as to why
some organisations choose to use software architecture as a tool dw·ing the software development processes.
7

From a purely technical stance, software architecture provides the basis for design, as it is the highest level of
abstraction. Decisions that are made at the architecture level are often the first decisions made regarding a
software system, and so have a high impact to all activities that follow. Software architecture provides
supp01t for early stage trade-off decisions that determine what functional and non-functional requirements
will be supported by the software [Barbacci98]. The architecting process produces initial designs that can be
further decomposed by lead software designers.
Communication between stakeholders in a software system IS greatly improved by having documented
software architectures as it provides a common reference point for all activities. It is through the architecture
that conflicting goals and requirements are worked through and resolved. It can fonn the pivot point for
implementing management decisions and project management through resource allocation.
When software systems are released to customers, they enter into the maintenance phase. Each time a change
is made, the software architecture can be checked to ensure that changes made do not violate the software
architecture. Changes that impact the software in an adverse way are said to 'erode' the software architecture
or cause 'drift' [Peny92]. By keeping software architecture as a utility for impact analysis, erosion and drift
can be ameliorated.
Cost and efficiency are of high importance to commercial software production. Here, software architecture
can provide motivation for a number of areas. As identified above, software architecture can improve the
efficiency of the software development process by being a common reference point, a communication vehicle,
and by being an analysis tool for monitoring the impact of changes. On top of this, software architecture can
be a basis for cost estimation through various metrics related to the constmction of the components of the
architecture. Process management can also benefit from software architecture by mapping the software
development process onto the architecture itself. Architecture reuse can prove yet another area for cost
reduction. It is suggested that the role architecture plays in software developing organisations is an important
indicator as to how successful that organisation will be in producing complex systems which meet
requirements in an efficient way [Batrnan99].
8

2.3.2 Roles and Use
The previous sections identify areas in which to describe the role that architecture plays for the various
stakeholders in a software system. The following roles have an interest in software architecture:
o Architect
0 Designer
• Development manager
0 Developer
0 Sales and field support
• System administrator
• End-user
These roles are equivalent to the stakeholder types identified by Clements [Clements96]. This discussion is
imp01tant in order to illustrate how each of the stakeholders in the architecture of a software system might
benefit from visualisation systems.
2.3.2.1 Software Architect
An individual who has the role of software architect will require a different skill set depending on the
environment in which they are operating. ln a commercial software-producing organisation, the architect will
require a great many more skills in business, management and organisational politics [BredemeyerOO]. This
section describes the role of software architect from a technical perspective only.
Principally, the software architect role is associated with the initial creation of architectures. Bredemeyer
[Bredemeyer99] outlines an architecting process shown in Figure 2-1.
9

In it/Commit
Architecture Validation
System Structuring
Deployment
Figure 2-1 Architecting process
Here, the four steps of Architectural Requirements, System Stmcturing, Architecture Validation and
Deployment are important. The !nit/Commit step is not considered here as it relates to manage1ial and
sponsorship issues within an organization. Dming the 'architectural requirements' step, the architect will be
pe1forming the following activities (ab1idged from [Bredemeyer99]):
• Understand the system context ... including technical drivers affecting the architecture.
• IdentifY stakeholder goals and architecture scope.
• Document functional requirements by translating user goals into use cases.
• Document non-functional requirements, associating measurable qualities with use cases.
• Model common/unique usage and infrastmcture requirements across systems.
One of the outputs from these activities are architecture requirements. These requirements, along with
architectural styles and pattems are provided as input into the 'system structuring' step which consists of the
following activities:
• Define the meta-architecture, including the style.
• Define the conceptual architecture: partition the system and allocate responsibilities to components.
• Define the logical architecture: model collaborations, design inte1faces, complete component
specifications.
• Define the execution architecture: map components to processes and threads; determine location on
physical nodes.
• Specify architectural guidelines and standards, and select key technologies.
10
Architecture documents and models that result from this are inputs to the 'architecture validation' step:
• Construct prototypes or 'proof of concept' demonstrators.
• Conduct reviews of the architecture.
• Conduct architectural assessments.
This is then iterated in a number of passes (see original text for details), as illustTated in Figure 2-l. Finally,
the architecture reaches the 'architecture deployment' phase:
• Communicate the architecture.
• Educate and consult with developers as they apply the architecture.
• Review designs with respect to the architecture.
• Identify needs for evolving the architecture.
Many of the principles behind this simple model of top-down software architecting are shared with other
architecting processes such as the Quality Attribute-oriented Software Architecture QASAR design method
[BoschOO]. Bosch notes that bottom-up architectural design is not feasible as working in this fashion would
require dealing with details of the system.
2.3.2.2 Designers and Developers
Designers and developers utilise software architecture in a number of ways. Initially, software architecture
provides a set of constraints on the design of individual components within the system. As noted above,
definitions of the high level components and connectors are created during the architecting process.
Interfaces, constraints, functional requirements and non-functional requirements should fonn pari of the
documented ar·chitecture. It is the responsibility of the designers who are involved in the detailed design of
the individual components to adhere to the prescribed architecture. In reality, the designers will work closely
with the architect in iterating the architecture fmiher if required.
Implementers of software systems are also required to develop the software within the boundaries and
constraints made by the architecture [Ciements96] and its detailed design. During the maintenance phase, any
changes made to the software system should conform to the architecture. It is the responsibility of tester to
ensure that they are able to measure the impact of a change against the architecture in order to ensure that a
change has not eroded the architecture.
11

2.3.2.3 Development Manager
Development teams are often st:mcttrred to reflect the structtrre of the software. Architectural components are
often the basis of development team structure as the intetfaces between architecttrral components are well
defined. Communication structure between development teams can also be based on major software
components [Clements96]. As each component of the system can itself have its own architecttrre, each team ' s
development manager can utilise architecttrral structtrres to allocate work to individual developers. In this
way, project management can be supported by the architecture.
2.3.2.4 Sales, Field support and End Users
Initial impressions of software architecture might lead to the view that software architecttrre is only useful for
the development processes of the organisation. In reality, software architecttrre is of fundamental imp01tance
to the sales department and supp01t operation. During the sales cycle of a pruticular software product, the
architecttrre is often presented to customers as a selling point. At this level, these architectural diagrams wil l
be stylistic and are often designed to be as aesthetically pleasing as possible.
Content Engines )..-nr<t~1ve1 A<tive Servt>r l;w.:t Coldfu~on PHP Pages (~P) Pages (ASP\ CGI Servteh (via ptuo·m) (v1a plug-int SHTML
Restricted NSAPI Engine
Administration Layer \~P Glll or Commar:d RE."mote V•nual Uuster
St1 LmP Adm111 Ccnsoh.• .Adm!mstratton Serwrs Management
Security Layer Proven T~ Re<ord
(S.Wre Code) SKurlty SUndards Authentkallon Access Cc>nttols
Sun'M ONE Web Server 6.0 Architecture
Figure 2-2 SunTM ONE web server architecture
Further down the sales cycle, the customer will often wish to read white papers that describe the software
ru·chitecture in more detail. A customer's technical terun will make recommendations to purchasers based on
architectures described in these white papers.
Owing installation, it is useful for system administrators to be aware of the architecture of a software system
in order to understand the impact that the software will have on the physical deployment environment. After
12

the software has been installed on the client site and is in use, arcrutecture is important for mapping bugs and
issues back to high-leve l components. In doing so, the team responsible for the development of the
component or components in question can be sent the observation repo11. Mapping bugs onto the architecture
can indicate possible impact at the support level before obtaining more specific inf01mation from the
development teams.
In the case of software being sold as sh.tink-wrapped products, the end user will often wish to have no
knowledge of the architecture . However, if the product is a framework , platform or API, then the architecture
will be vel)' important.
Appkit Containwr
~ ~ W eb eo.·.taltw E...I3Containef"
c::Jr2l f-+ ~ r+ r+
''"" n """ 0 Jl::lE ~ ~
~ IJo l
~ ~ g
~ ~ ~ M..il
~ ~ ~
'" jM ~ " -:;;:F ~ H r-P ~ .. Data~Go
fsl Application
OIBnt Container J2SE: J2SE ~~ ~ .. ~
A t~lo-:!:1 Cient -
I ~ ~ ~ ~ n
.J2SE
Figure 2-3 Enterprise web application architecture
Gaining an understanding of how the system works is essential in being able to develop systems onto the
framework , API or platform.
2.4 Software Architecture Styles
Garlan and Shaw [Garlan93] define an architectural style as a term of classification for fami lies of systems
that adhere to a pattern of structural organisation. Petry and Wolf [Pefl)'92] define arcrutectural style as being
less constrained and possibly less complete than a specific architecture, the focus being on certain aspects
wruch characterise a set of arcrutectures . In their view, the boundal)' between architecture and arcrutectural
style is somewhat blurred depending on how they are used. It is architectural style that establi shes the
13

vocabulary of components and connectors that can be used in specific instances of that style and also provides
a set of constraints on how they can be combined [Garlan93]. To illustrate, the 'client-seiver' notion of
architecture might provide a vocabulary of connectors that include 'client' and 'server' components along
with connector vocabulmy such as 'HTTP' and 'RPC'.
Such a style emerges through the consideration of the components and connectors of a set of similar software
systems along with their configuration. Some elements will be common to most systems and configured in
similar ways. Identifying these elements and relationships can biing about a notion of a style for that family
of systems.
Styles are useful for both analysis and design of software [Klein99]. Design is supported through architecture
as the system architect can choose a style by refening to known quality attributes of architecture styles
[Klein99]. It is hoped that, in a similar way to software design patterns, there will be an architecture
handbook to assist architects in choosing a style to suit a software system. This handbook would list
architecture styles along with their known attributes such as performance and security measures. To some
extent, prediction of these attributes is possible for a pmticular implementation of the architectural style
[Klein99]. Garlan considers many benefits of using style in practice, which is not the consideration here.
What is impmtant in this desciiption of style is the applicability of style to visualisation, and on this, Garlan
states that it is usually possible to construct visualisations that m·e style-specific [Garlan95].
Some common architectural styles as identified by Garlan and Shaw [Garlan93] are summa1ised from their
text below. It is by no means a definitive list and in practice, the boundaries of these styles can overlap.
2.4.1 Examples
2.4.1.1 Pipes and Filters
Filters are computational components that take as input a set of data streams and produce a set of output
streams. It is usual for the filter to incrementally read the input streams, apply a transfonnation to it, and
write data to the output streams. In this way, output can be produced before input is completely consumed.
Filters are connected by way of pipes that transfer data from one filter to another. Therefore, in this style,
components are termed 'filters' and connectors are tenned 'pipes'.
Constraints for this style state that filters are completely independent of other filters. Specifically, they must
not share state with other filters and that they must remain unaware of the identity of other filters either
upstream or downstream. Input and output specifications might restrict what data can appear as input and
make guarantees about its output, but they must he unable to identify other filters which are attached to the
ends of those pipes.
14

Variations on the pipe and filter style exist. One such variation is the 'pipeline' that are linear sequences of
filters, commonly found in basic compilers. Another is the batch sequential system where each filter
processes all input as a single entity before being passed on to the output. Batch sequential systems are a
degenerate case of the pipe and filter style and can be considered as distinct style.
Pipe and filter systems are commonly found on UNIX based operating systems where processes (filters) can
be connected via pipes to each other. Compilers are often pipeline systems where phases of the compilation
process are the filters conve1iing source code into machine code, for example.
2.4.1.2 Repositories
Repositmy systems are comprised of two distinct component types. Firstly, there is a central data structure
that represents the cunent state of the system (repository). Secondly, there is a collection of one or more
independent components that access and perfom1 functions on the central data store.
Computation can proceed in two ways. If the input to the system is such that the components modify the
central store in response to the input directly, then the repository can be thought of as a traditional database.
However, if the cunent state of the repositmy is the main trigger for components, then the repositmy can be a
blackboard. To clarify, in the first instance, components access and change the repositmy in response to
input. In the second instance, actions of components are dete1mined by the contents of the central repository.
The blackboard model can be decomposed into three major parts. A knowledge source is where world and
domain knowledge is paiiitioned into separate independent computations. Interaction among knowledge
sources takes place solely through the blackboard. Blackboard data structure is problem solving state data,
organised into an application-dependent hierarchy. Knowledge sources make changes to the blackboard that
lead incrementally to a solution to the problem. Here, the blackboard is the only means by which knowledge
sources interact to yield a solution. Control is where components are driven entirely by the state of
blackboard. Knowledge sources respond opportunistically when changes in the blackboard make them
applicable. Blackboard systems are traditionally used in signal processing such as speech and pattem
recognition.
2.4.1.3 Layered Systems
Layers are organised hierarchically where a layer provides a service to the layer above and is also a client to
the layer below. Constraints are imposed in some variations such that inner layers are hidden from all other
layers except for the layer immediately above it. Fm1her to this, certain functions may be open for export as
necessary. Connectors are defined by the protocols that determine how the component layers will interact.
15

This style supports design based on increasing levels of abstraction reducing a complex problem into a
hierarchy of incremental abstractions. Enhancements are implemented by adding layers onto the top of the
current top layer. A good example domain is the network protocol domain such as the ISO/OSI seven layer
network model.
2.4.1.4 Data Abstraction and Object-Oriented Organisation
In this style, components are 'objects', also known as managers. They are responsible for the management
and integrity of a pmticular resource, for example, a queue. Inter-object communication is achieved through
function and procedure calls.
Two important aspects relating to this style have been identified. They are that (a) objects are responsible for
preserving the integ1ity of its representation and (b) this representation is hidden from other objects.
Object oriented systems have become increasingly commonplace, yielding variations on this basic
architectural style. For example, objects in some systems can be concurrent tasks, through multithreading,
and others, including Java, allow objects to adhere to multiple interfaces.
2.4.2 Heterogeneous Software Architectures
Most systems typically involve some combination of several 'pure' architectural styles. There are, of course,
many different ways in which architectural styles can be combined. One pmticular way is through hierarchy:
components in a system may be organised in one architectural style whereas the internal structure of a sub
component may be represented in a completely different architectural style as required.
A component could also use a mixture of architectural connectors instead of using a single type of connector.
In order to interact with one set of components it may use, for example, a pipe interface. In order to
communicate with a different set of components, it may access a repositmy- a different type of connector.
2.5 Representation
Software architecture is represented in a multitude of ways. This section examines some of the more common
techniques of representing architecture to stakeholders in a system.
2.5.1 Undocumented
It is often stated that all software has an architecture, even if it is not explicitly stated. It is not surp1ising that
the architecture of a software system is often undocumented - pa11icularly for small software systems written
by single developers. Documentation at any level is often neglected at this level of development. A high
16

level description of a software system may exist, but can be labelled in another way, such as 'high level
design '. It is not the focus of this thesis to change this failing, but to enhance architecture documentation
when it is used.
2.5.2 Overview Diagrams
Diagrams are used throughout all software engmeenng disciplines, from 'back of the napkin ' drawings
through to drawings produced by diagramming software. In some instances, the only representation of the
software architecture is through an overview diagram. These types of diagrams are often refened to as ' the
architecture ' but a fonnal architecture description is not given, for various reasons. Overview diagrams are
intended to give stakeholders an impression as to what the fundamental components of the software are.
~----••_••_r_'~_'n-di_.,_._""_'·_•_~_c_ri~~-io-n)-,
ret r ie·;el des en pt ionl
B~cki n:;r St o r e M'f!l QL, OB2, . l
1100\. Ja.V4}
Re.t~.o~JOUe..r I { PaCT, Racer . ) .. IIIII
Figure 2-4 [nstance Store APt Architecture Overview
Figure 2-4 is an example of an architecture overview diagram of the " Instance Store" API [Instance Store].
The quality of these representations varies dramatically. In some cases, the diagrams are clearly presented
with well-defmed meanings for all graphical elements used to construct the diagram. In other cases, it is
unclear as to what the boxes and lines actually mean, and interpretation of the architecture overview can vary
considerably.
2.5.3 Documented
A distinction between documented architectures and overview diagrams is drawn on the boundary of intent.
The intention of overview diagrams is to just provide an impression as to what the high level components are
whereas properly documented architecture formally describes the architecture.
17

The IEEE 14 71 standard [IEEE 14 71] gives six elements that should be included in an architecture description:
• Architecture document identification, version and overview information.
• Identification of stakeholders and concerns.
• Specifications of viewpoints.
• A number of architectural views.
• A record of known inconsistencies.
• A rationale for selection of the architecture.
At its core, this standard uses a selection of architectural views to present the software architecture. These
views can be represented using different languages, methods and models. Along with this, a inter-view
consistency analysis is presented in order to align the views together.
2.5.4 ADLs
Architecture Description Languages (ADLs) focus on the high level structure of software systems rather than
the implementation details of any specific module [Vestal93] and have been developed in response to the
following problems [Garlan97]:
• The practice of architectural design is largely ad hoc, informal and idiosyncratic.
• Architectural designs are often poorly understood by developers.
• Architectural choices are frequently not based on solid engineering principles.
• Architectural designs cannot be analysed for consistency or completeness.
• Architectural constraints are not enforced during system evolution.
• Virtually no tools to help architecture designers.
ADLs are considered to be important for software architecture as they provide a conceptual framework and
allow for a concrete syntax in characterising architectures. The syntax allows for the decomposition and
representation of a software system in terms of its respective high-level components and connectors. Along
1.8

with this decomposition, specifications are made as to how these elements are combined to form a
configuration [ Allen97].
Fundamentally, ADLs represent architecture and are generally concerned with components, connectors,
architectural configuration and interface definitions [Medvidovic97]. However, each ADL has its own
specific concerns. A summary of a selection of ADLs are presented in Table 2-1. The comparison is taken
from Garlan et al [Garland 97] and Medvidovic et al [Medvidovic97].
ADL Specific concerns
Aesop Supports use of architectural styles. Provides capabilities for expressing
properties that permit real-time schedulability analysis.
Meta-H Specific guidance for designers of real-time avionics control software, and is
concerned with real-time shedulability analysis. Suitable for architectures in the
guidance, navigation and control (GN&C) domain.
C2 Architectures of highly distributed, evolvable and dynamic systems. Supports
description of user interface systems using message-based style
LePUS Aimed at specifying object-oriented software architectures. Conformance can be
verified.
Rapide Allows simulation of architectural designs and for analysing the results of those
simulations. Interactions are represented in terms of events.
SADL Provides formal basis for architectural refinement and is concerned with the
expression of stylistic invariants.
UniCon Has a high-level compiler for architectural designs that suppmt a mixture of
heterogeneous component and connector types.
Wright Supports specification and analysis of interactions between architectural
components. Interactions are represented in terms of events.
Table 2-1 Summary of ADLs
As many ADLs arose fi·om the uptake of interest in software architecture, Acme has emerged as both an ADL
and an ADL interchange language. An interchange language is considered necessary as many ADLs were
19

developing associated toolsets, and having a capability of translating between these languages would allow
these tools to be useful to a wider community. Other practical uses of ADLs include code generation and
simulation.
2.5.5 UML
Grady Booch, James Rumbaugh and lvar Jacobson [Booch98] created the Unified Modelling Language
(UML) and released version 0.8 of the language in 1995, and was later adopted by the Object Management
Group (OMG) in 1997. Prior to the f01mation of the UML, each of its creators were independently
developing their own method to Object Oriented software design.
The UML is a language for specifying, visualising, constmcting and documenting at1efacts of software
systems [OMG][AbdurazikOO]. It provides modellers with a visual modelling language that integrates best
practices and is independent of development processes. There are four diagrams used for modelling software
in the UML [OMG]:
• Use case diagram.
• Class diagram.
• Behaviour diagram.
• Implementation diagram.
By modelling software m multiple diagram types, more than one perspective of the software can be
represented.
20

The UML is often used to describe and document software architectures. Researchers in the field of software
architecture differ in their views on whether the UML is a suitable language to represent software
architecture. However, what cannot be avoided is that the UML is often used to represent software systems,
and some of these representations are labelled as software architecture. Abdurazik [AbdurazikOO] notes that
the following UML constructs can be used in the description of software architecture:
• Class
• Classifier
• Package
• Interface
• Component
• Subsystem
• Model
Also, the UML can be used to specifY heterogeneous architecture as subsystems can be used as components.
Some researchers have suggested various mechanisms by which the UML's capability for extensibility can be
exploited in order to provide better facility for modelling architecture [Medvidovic97]. Others research has
sought to bring UML together with other languages to provide a language with direct capabilities for
expressing architectural concems [Robbins97].
2.5.6 Source Code and Configuration Files
Whilst higher levels of representation may afford a much more amenable way of using software architecture,
every software system that is implemented realises a software architecture, whether it be the intended
architecture or not. Source code, configuration files, data sources and all other collateral that form the
software system will represent the software architecture.
One example of how configuration can contain architectural information is that of a web application built
using the Jakarta Struts framework [Struts]. This fi·amework provides a controller component that utilises an
XML configuration file that determines page flow within the web application. Page flow is a useful
representation of architecture both in tenns of both data flow and user flow throughout the application.
21

2. 6 Conclusions
Software architecture is important for software engineering, and its recognition is becoming more widespread
in all aspects of software engineering. This chapter has discussed the various views and definitions on what
architecture is and presented a definition to be used in the remainder of this thesis. Also, this chapter has
looked at the motivation behind using software architecture -that is to detetmine why software architecture is
being used within software development organisations. In light of this, the way in which particular roles in a
software development project were examined with respect to the way those roles might incorporate the use of
software architecture. By examining these roles, it is possible to detetmine how architecture visualisation
may be suited to those roles.
When consideting the use of software architecture in practical software development, the environment in
which the software is to be deployed in plays a significant role in shaping it, by defining boundaries and
interfaces, and enforcing both functional and non-functional constraints. Other factors that influence
architecture include technological and political issues. For 'green field' development, where environmental
constraints are few, software architecture can be designed with relative freedom. Even for highly constrained
environments where a component must fit into an existing architecture, the new component itself may warrant
reasoning at an architecture level of design.
As architectural style constitutes a significant part of software architecture research, this chapter has described
a selection of the more prolific architecture styles, and how software systems can be composed of many
different architectures using many different styles. Styles are important in the context of this thesis as they
strong associations with graphical representation.
Finally, the chapter discussed a number of ways in which software architecture is represented. Architecture
representation will be key to visualisation, as a visualisation system will require some means by which it can
obtain architectural infmmation of a software system. Architecture description languages are one form of
representation of a software system's architecture. The intention of ADLs is clear, but the practical uptake in
modem day software development is limited. The value of architecture description languages for architecture
visualisation is obvious - they can be parsed easily in order to derive visual representations. One principle
reason why ADLs in the traditional sense have not been used for practical software development may be due
to the uptake of UML as an architectural design aid. Whilst opinion in the research community is divided on
the use ofUML to describe architectures, it has become a de facto standard that cannot be ignored.
22

Chapter 3: Software Visualisation
23

3.1 Introduction
Presenting infonnation visually is highly beneficial to the perceiver, and this benefit has become widely
accepted. Software visualisation attempts to retrieve and present information about a software system to a
user in a visual fmmat. By doing so, the user is often able to understand the infmmation presented in a
shorter period of time, or to a greater depth. Time is important in the production of software, so the benefits
afforded by software visualisation are obvious: it can help reduce costs through saving time, improve the
understanding of the software system by developers and other team members, reduce inconect knowledge
about a software system and ensure a common view of the software.
Visualisation, the process, can refer to the activity that people undertake when building an internal picture
about real world or abstract entities. A visualisation is a graphical or pictorial representation of real world or
abstract entities. Visualisations can range from box and line drawings on paper through to graphs through to
interactive 3D environments. Visualisation can also refer to the process of determining the mappings between
abstract or real world objects and their graphical representation. This process also includes decisions on
metaphors, environment and interactivity.
The term software visualisation in this document describes the process of mapping entities in the software
domain to graphical representations. Motivation for visualising software, as stated earlier, is to reduce the
cost of software development. Software visualisation can support the software development process by
helping stakeholders to understand the software at va1ious levels and at different points of the software
lifecycle.
3.2 Current Uses of Software Visualisation
Dming the lifecycle of a software system there are many occasions where designers, developers or
maintainers will need to learn or re-leam some aspects of the software's structure. It may be that they wish to
learn some of the higher-level structures, or wish to understand the operation at a line-by-line basis. Software
visualisation is intended to assist in the understanding of the software.
A key motivator in the development of the software visualisation field is the issue of software maintenance.
Some have identified as much as 90 percent of the time required performing a maintenance activity can be
attributed to the maintainer attempting to understand the software [Standish84]. By reducing the time
required to understand software, costs can be reduced as efficiency is improved.
24

Several taxonomies exist that classify software visualisation system. Myers' classification [Myers90) is
useful as it identifies broad areas of software, and two temporal frames. It involves the following categories:
• Static code visualisation
• Dynamic code visualisation
• Static data visualisation
• Dynamic data visualisation
• Static algorithm visualisation
• Dynamic algorithm visualisation.
Static aspects of software are those that are features of software in a non-running state, whereas dynamic
aspects are those of the software dming its execution. The code, data and algmithm categories are generally
representative of software visualisation systems at the time, but do not include all levels of software
abstraction.
Call graphs are usually static code visualisation systems. The Code Viz visualisation [Code Viz] generates call
graphs.
Figure 3-1 Call graphs
Figure 3-1 shows two call graphs. The leftmost call graph is of the alloc _j)ages() fum:tion in the Linux kemel.
The tightmost image is an image produced by the Visualisation of Compiler Graphs (VCG) system
25
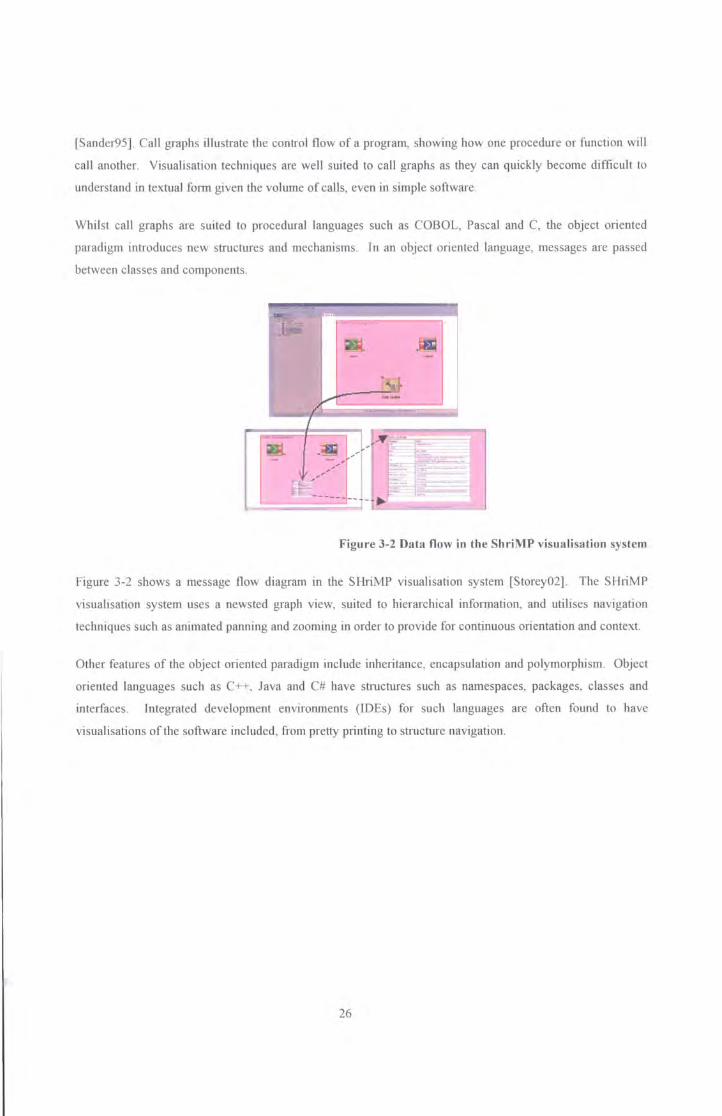
[Sander95). Call graphs illustrate the control flow of a program, showing how one procedme or function will
call another. Visualisation techniques are well suited to call graphs as they can quickly become difficult to
understand in textual fonn given the volume of calls, even in simple software.
Whilst call graphs are suited to procedural languages such as COBOL, Pascal and C, the object oriented
paradigm introduces new structures and mechanisms. In an object otiented language, messages are passed
between classes and components.
Figure 3-2 Data flow in the ShriMP visualisation system
Figure 3-2 shows a message flow diagram in the SHriMP visualisation system [Storey02). The SHtiMP
visualisation system uses a newsted graph view, suited to hierarchical information, and utilises navigation
techniques such as animated panning and zooming in order to provide for continuous orientation and context.
Other features of the object oriented paradigm include inheritance, encapsulation and polymorphism. Object
oriented languages such as C++, Java and C# have structures such as namespaces, packages, classes and
intetfaces. Integrated development environments (IDEs) for such languages are often found to have
visualisations of the software included, from pretty printing to stmctme navigation.
26
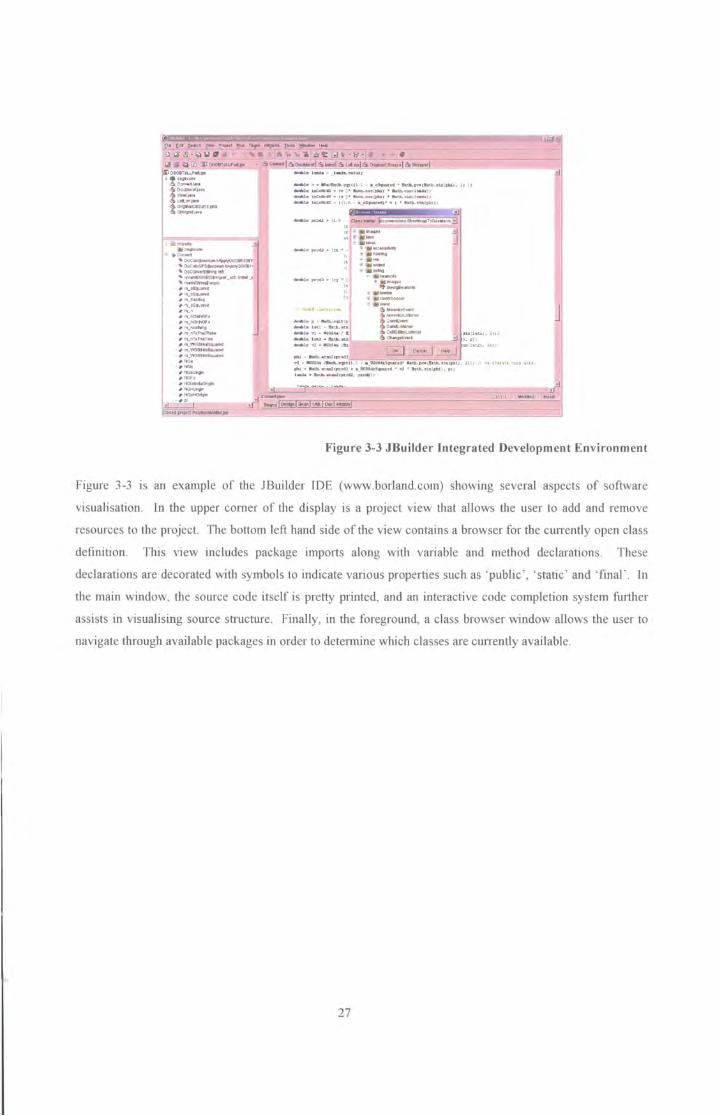
[) ~\'i · oHICII .;J ~ ftl Jl 06G&T~
.:JilrrctMs ·-: •eor-. .., ()QC ......... ~nn
' DoC~~~· , ,._....... .. '~-QI ...., _,
, __ # 11\.af~ # ~ll'S--.afH , ,._E.utlot # "'l.I9,JJOIH ..... , # tn_NOIHOf".l # I'II, J«lU..Qft .... -; m_nTeJM-n.r.. # 11\..nfdMt .. # m_WGSII~
;m_wotll l~
;m_WOS!I~
' ""' ··-......
... le • • .......,do.P.(I:[U. J- •-"~~ • .. ~.,....l .. U:l.•LDII'bJ.l , 11 ) ;
.-a LIIC-C( • I" 1' .. UI.cn (dU.I ' a.th.c_U_ J;
-~-~ - 4• 1' ........ -~) . ~ .... .... ,, ... la ~ • t (l.G • •.d411U .. I' • 1 • Kado. ll• (pll.i) :
,. ( , ... ... ~ . ... ~ --~ ....
~pooa: · ( Ao' · .. .. ~
:~ :t :-o
,. " "
_,., . -..z.._,lt{p ..... I •LK.l • bdl..au.
··~---., "·-· ~=-... _ ··. .,_ ~a .. .--.. t==..
...-.t~t •l · ~ / a &CtE~tf ,u (h:.lJ.l ll:
=: ~~;.:;:'----"a,_,.._=~=-"'---"""""" '· "}' ~ ·~~
:1
:-::.~:;;u:-;-., -:-. =-._.,...,;;;;;;;;:,....=,To•·"""'.._:-;:,";;;"'="'·c;;,a-;;;,:.;,,c;',,. All:
Jill • ~r..!(~ • a_&SHe..~H • rt • b ... . . u. (plrli ], '''
u
:=- ~--'- -l-· #~ · l c-.1 ... ~ -------il ~r.--~r.~~~~.~~~~~~-~~~~~-----------------------~~~~~~=-1 PG'Wi~ttittt Pe~~-
Figure 3-3 JBu ilder Integrated Development Environment
Figure 3-3 is an example of the JBuilder IDE (www.borland.com) showing several aspects of software
visualisation. In the upper comer of the display is a project view that allows the user to add and remove
resow·ces to the project. The bottom left hand side of the view contains a browser for the currently open class
definition. This view includes package imports along with variable and method declarations . These
declarations are decorated with symbols to indicate vaiious properties such as ' public ', ' static ' and ' fmal' . In
the main window, the source code itself is pretty printed, and an interactive code completion system further
assists in visualising source structure. Finally, in the foreground, a class browser window allows the user to
navigate through available packages in order to determine which classes are currently avai lable.
27
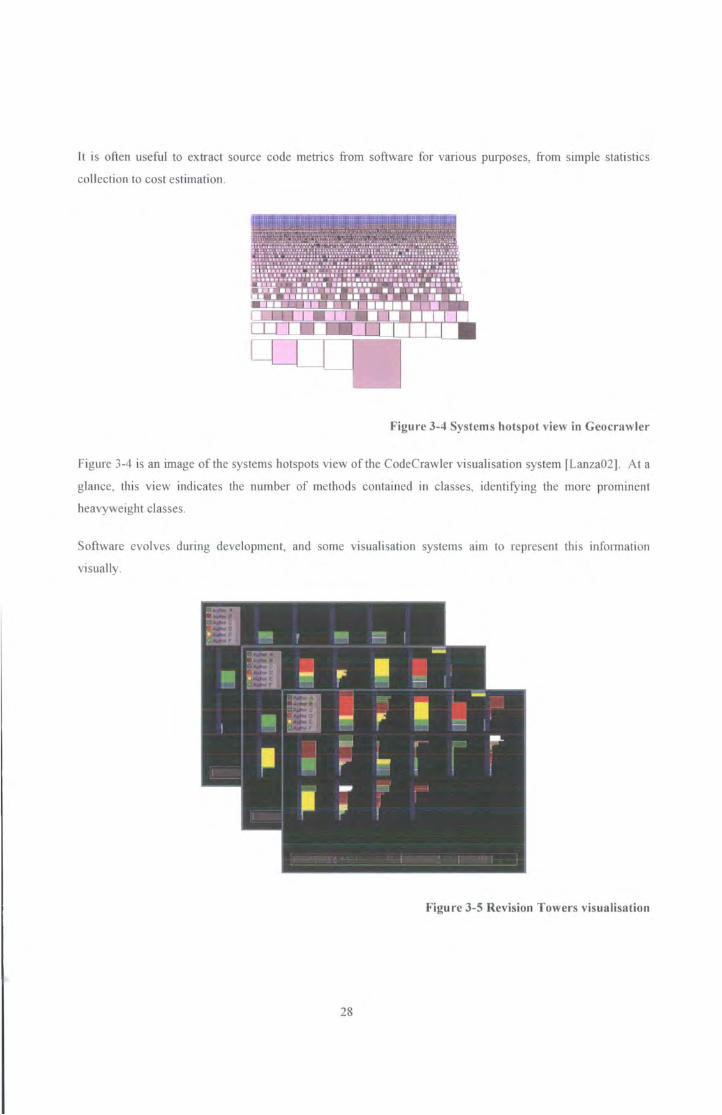
It is often useful to extract source code metrics from software for various purposes, from simple statistics
collection to cost estimation.
Figure 3-4 Systems hotspot view in Geocrawler
Figure 3-4 is an image of the systems hotspots view of the CodeCrawler visualisation system [Lanza02]. At a
glance, this view indicates the number of methods contained in classes, identifying the more prominent
heavyweight classes.
Software evolves during development, and some visualisation systems aun to represent this information
visually.
Figure 3-5 Revision Towers visualisation
28

Figure 3-5 is an image from the Revision Towers [Taylor02] visualisation, a system that indicates the
evolution of a software project through parsing CVS log files. lnfonnation contained in CVS logs are useful,
and this visualisation aims to present animations on how project files change over versions and who changed
the file . This is useful in gaining an overview of activity in a project.
Dynamic aspects of software visualisation require the analysis of software at runtime. Runtime information is
extracted in a variety of ways, from instmmentation of source code through to vittual machine data gathering.
Figure 3-6 DJVis runtime view
The DJVis visualisation system [Smith02] represents Java software executing at runtime. Figw·e 3-6 is an
image taken from DJVis' mntime view, showing a thread group hierarchy. Other views in this visualisation
show call stacks, changing variables and static information such as class hierarchies.
29

Another aspect of running systems is algorithm visualisation.
Quicks01t Animation Wrth the quacksort algorrthm, a povot value tS used to compare
each element m the array as each tndex. 1 and J, traverse toward each other When 1 encounle.-. a nwnber larger than the
povot. ~ stops, and wben J encounlen a number less than the p1vot. the values at poSitions i and J are swapped In the
chagram, l iS in blue and j IS in red As quiCksort gets caDed boxes are drawn around the sub arrays to show recurSion.
The cWTent ptvot value 1S shown m red and aD preVtous ptvots are highhghted in blue
6 9 10 7
Figure 3-7 Quicksort algorithm animation in SAMBA
SAMBA (Graphics, Visualization and Usability Center at Georgia Institute of Technolgoy) is an animation
system that developers can use to create visualisations of algorithms. Figure 3-7 shows a frame from an
animation of the quicks01t algorithm. These algorithm animation visualisations are often used in the teaching
of algorithms [Kehoe99].
3.3 History, Trends and Issues
In order to set the context for this research, the following sections describe four areas of software visualisation
in order to outline the direction in which software visualisation has taken.
3.3.1 Graphs
Much of the work in early visualisation is based on the use of graphs: node and arc diagrams used to represent
software concepts and constructs . Graph drawing algorithms concem themselves with taking a graph data
stmcture as input and giving a drawing of that graph [DiBattista88) as its output. Graph readability, or
aesthetics, plays an imp01tant role in order to produce drawings that can quickly convey the meaning of the
graph. These aesthetics are expressed as optimisation goals for the algorithm, such as minimising the number
of crossing lines. A key area of this research has been into graph layout algorithms.
30

3.3.2 20 and 3D
Some researchers in software visualisation have considered applying 3D technology to the problem of
visualisation. In particular, they have commented on the trend for 30 visualisations to be simply modified
versions of 20 visualisations and as a result have not exploited the full capability of three-dimensional
representation. 30 representations of call graphs have been produced in order to exploit the depth of space
that three dimensions offers.
Figure 3-8 Call graph in 3D
Fig me 3-8 is a call graph generated in 3D using a force directed placement layout algorithm [Young97).
One ctiticism levelled at the conversion between 2D and 3D is the reliance on node and arc graphs. Smith
[Smith03] and Knight [KnightOO] demonstrate strategies by which 30 representation can move away from
node-arc representation to provide alternative ways of showing relationships between entities.
31

Figure 3-9 Software World class visualisation
Figure 3-9 is an image taken from Software World [KnightOO], showing a visualisation of a Java class,
represented as a district with heights of buildings showing relative method size.
3.3.3 Dynamic and Static Software Visualisation
Software can be thought of in broadly two forms - the software as described statically, and the software as a
running system. These two forms have been investigated for use in software visualisation. Software, in its
static form, comprises of source code and other material. Software visualisation has often taken to the parsing
of source code in order to build abstract representations of the software for diagrammatic presentation. On
the other hand, software visualisation has also looked at capturing infmmation from running software systems
in order to present this information diagrammatically. Several approaches have been made in the capture of
runtime information, some invasive, some non-invasive. Invasive methods involve actually changing the
code of the software in order that reporting procedures be called - relaying captured information to a
monitoring component. This monitoring component could simply be a log that records the information for
later processing. However, other implementations have the monitoring component be a graphical display that
updates the display with real-time information relating to the running system. Non-invasive methods do not
modify the sow·ce of the software to be examined. This is typically utilised when the software is tunning on a
vutual machine, such as the Java ViJtual Machine (JVM). Instrumentation deployed in the JVM can report
information back to the monitoring component.
32

3.3.4 Abstraction
The histmy of computer science and software engineering has included a repeated succession in the level of
abstraction that software design is engaged at. Shaw (Shaw96] describes this sequence by examining a
selected histmy of computer science.
Initially in the 1950s software was written entirely in machine language. It was quickly realised that memory
layout and update of references could be automated; so symbolic names were used for operation codes and
memory locations. Symbolic assemblers were the result, followed up with macro processors that allowed a
single symbol to represent a commonly used sequence of instructions. Software visualisation has typically
ignored this level of abstraction, perhaps because this is the lowest level at which software is written, and it is
not common practice to write software at this level. When assembly language is used, it is primarily for
performance reasons. Games designers work in higher-level languages such as C and intersperse assembly
language where required.
Some elements of software were realised to be useful across many different software systems, and they could
be automatically created from a mathematical-style language. What resulted were early high-level languages.
The way in which data was represented and manipulated became of primary importance, leading to the notion
of abstract data types. Object oriented languages were to follow procedural high-level languages, focussing
on providing well-defined interfaces to software modules. The field of software visualisation has placed a
high degree of attention on high-level languages. Static analysis and representation of software written in
high-level languages has dominated much of the research.
Module Interconnection Languages (MILs) arrived after the realisation that describing modules and
describing how they are glued together are separate concerns and best served by different notations. Software
Visualisation has not yet investigated visualisation of MILs.
Architecture has been alluded to at various points in histmy, but is only recently become an area for serious
interest. Software visualisation has only begun to examine software at this high level of abstraction.
33

3.4 Fundamental Principles
This section outlines the fundamental principles that are thought to govern software visualisation today. It is
widely recognised that the key area of study is cognitive psychology. A broad definition of cognitive
psychology is that it is the study of those mental processes and activities that are used in perceiving,
remembering and thinking. Card, Mackinlay and Shneide1man [Card99] suggest six ways in which
visualisations can be used to enhance these cognitive processes:
• Visualisations can increase external memmy and processing resources available to a user.
• Visualisations can reduce the need to search for information as the information is placed within
reach.
• Visualisations can enhance the user's ability to detect patterns in data or events.
• Visualisations can facilitate the drawing of some inferences through direct perception of the
infonnation rather than through more complex cognitive processing.
• Visualisations can facilitate the monitoring of change in large numbers of events.
• Visualisations can encode information in a medium that is suitable for manipulation.
Sometimes visualisations are of real world entities, but they can also be about representing entities and
relationships that do not have any direct physicality [Hewett99]. The challenge of the visualisation designer
is to produce a visualisation that maps in a relatively natural way to the cognitive structures of the end user
[Hewett99].
3.5 Conclusions
Software visualisation has its roots in program comprehension, and has used visual and cognitive psychology
ill order to make software more accessible to those who need to understand it. Software visualisation work
has been primarily concerned with one level of abstraction - that of the high-level languages used to
implement software. There are other levels of abstraction that software visualisation has not considered
adequately, and software architecture is one of those.
A criticism levelled at software visualisation is that they are not extensively used dming the development of
software in induslly today. However, recent Integrated Development Environments (IDEs) are beginning to
incorporate visual representations of various aspects of software. These visualisations range from simple tree-
34

structured class hierarchies to UML diagrams to more innovative visualisations such as page flow. Cognitive
psychology has demonstrated the value of imagery in cognitive processes, and scientific visualisation is
widely accepted as a means for representing large amounts of data in an understandable fonn. However,
some visualisation presented in research is explorative of the field rather than concentrating on the practical
impact of the work. This type of research is essential for developing the field and should have the ultimate
goal of moving towards practical instances.
35

Chapter 4: Software Architecture Visualisation
36

4.1 Introduction
This chapter describes the current state of research in software architecture visualisation. A number of
existing software architecture visualisations are identified and reviewed. Also, two models to architectural
views are examined. From these analyses, the trends, issues and challenges that face software architecture
visualisation are identified.
4.2 Existing Software Architecture Visualisations
4.2.1 Feijs and de Jong
Feijs and de Jong ' s approach to understanding is to suggest walking through the architectme rather than
snuggling to understand large amowlts of abstract code [Feijs98]. By following the architecture analysis
activities of extraction, visualisation and calculation, Feijs and de Jong have produced an architecture
visualisation that presents the use relations in software systems.
Firstly, use relations such as import or call tree are extracted from software source code using extraction tools .
These relations are stored in a set of files that are read by the TEDDY browser. This browser also reads
layout information files and allows the selection of shapes and the manual configuration of layout. Finally, a
set of tools are used to operate over the set of relations to petform, for example, the Hasse operator or a lifting
operation [Feijs88].
Once the TEDDY browser has been used to prepare layouts in each plane, a VRML generator called
Arch View creates a 3D representation of the software using the 2D layouts and layer position.
Figure 4-1 Arch View architecture visualisation
37

Figure 4-1 shows the 3D representation generated from import relations of a software system. Once this 3D
representation has been created in VRML, users can 'walk around' the representation using VRML viewing
software. Feijs et a!. illustrate how viewing these relations can lead to the discove1y of architectural design
flaws. They argue that even informal reasoning about software architecture reproduced pictorially in 3D can
result in the discovery of properties affecting relations among multiple modules, and suggest that system
designers should view the architecture in this way during the construction of the architecture.
Feijs and de Jong represent a single view of software architecture -that of the use relation between modules.
As such, the visualisation can only ever meet the needs of a limited number of stakeholders. This single view
is rendered in three dimensions and allows for the user to move the camera to see this view from different
locations in 3D space. As noted in chapter 3, some researchers take the stance that 3D can provide many
benefits over 2D, however this visualisation retains a node and arc basis. Interaction in this visualisation is
limited to moving the camera in 3D space, it does not allow the user to search or que1y the data directly. This
visualisation only considers a single aspect of static data on the software system, it does not consider data
associated with the runtime of the software, and also does not support dynamically changing architectures.
4.2.2 The Searchable Bookshelf
When developers or maintainers undertake a software comprehension, they can approach the task in two
ways: browsing or searching. During a browsing activity, the developers or maintainers will be formulating
their understanding of the software by following concepts, whilst searching is essential for fact finding and
hypothesis testing.
Sim et a! state that software architecture visualisation tools have tended to support the browsing of software,
but often do not support searching [Sim99] and have produced the Searchable Bookshelf architecture
visualisation to address this issue.
38
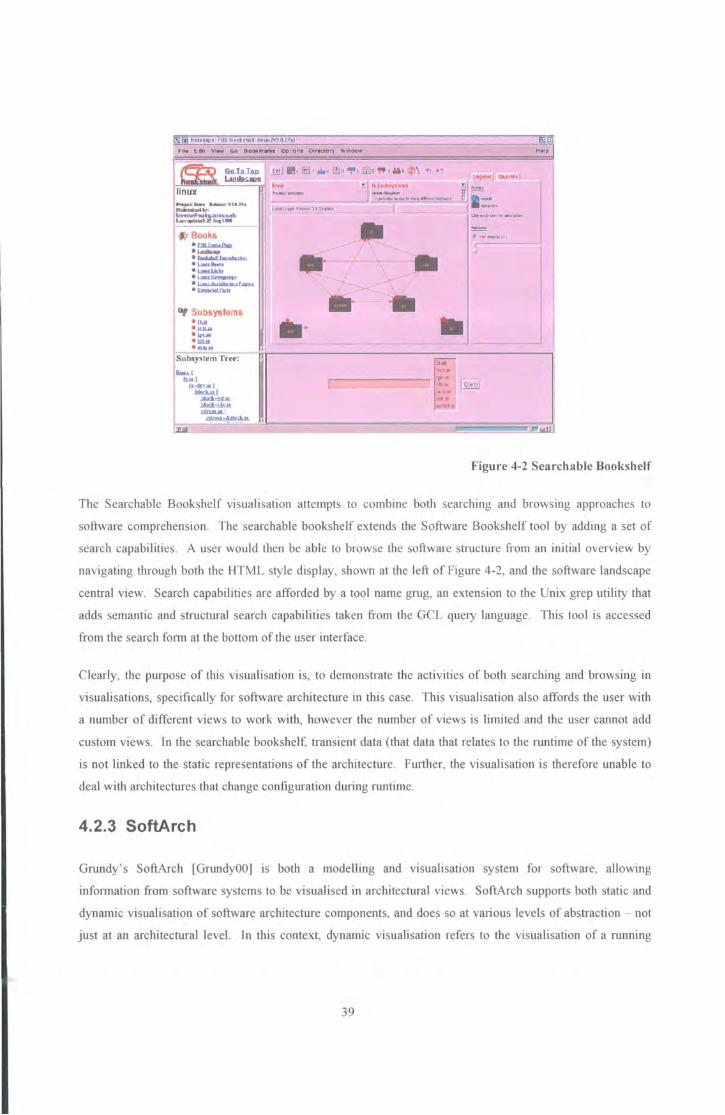
11 Fll• Edll VIN Go BoOkm.-b Options Dlr~ory Window H .. p
«> Books ·~ ·-• D ....... f!l ........ \b, • L31Ua..b • "-....r.M
·~ .. e t •• a .. w.•rW-,P•"D ·-., Subayatema
"""' O icll.K . .,.. OJ&a O l!lJUII
Su!Hy•t•m Treo:
U....l , ... , J~:
ill<lw.l ~
~· -... P!r!ll ~1~'f'a. H
·kU.~NI
,..,. . .. ~~ ..... ~~·1~ .. • • .. ..
r--------: P" lc I !':~ r~
!H:i£
"'"''
Figure 4-2 Searchable Bookshelf
The Searchable Bookshelf visualisation attempts to combine both searchjng and browsing approaches to
software comprehension. The searchable bookshelf extends the Software Bookshelf tool by adding a set of
search capabilities. A user would then be able to browse the software structure from an initial overview by
navigating through both the 1-ITML style display, shown at the left of Figure 4-2, and the software landscape
central view. Search capabilities are afforded by a tool name grug, an extension to the Unix grep utility that
adds semantic and structural search capabilities taken from the GCL query language. Tills tool is accessed
from the search form at the bottom of the user interface.
Clearly, the purpose of tills visualisation is, to demonstrate the activities of both searchjng and browsing in
visualisations, specifically for software arcilltecture in tills case. This visualisation also affords the user with
a number of different views to work with, however the number of views is limited and the user cannot add
custom views. In the searchable bookshelf, transient data (that data that relates to the runtime of the system)
is not linked to the static representations of the architecture. Further, the visualisation is therefore unable to
deal with arcrutectures that change configuration dwi.ng mnrime.
4.2.3 SoftArch
Gmndy' s SoftArch [GrundyOO) is both a modelling and visualisation system for software, allowing
information from software systems to be visualised in arcilltectural views. SoftArch supports both static and
dynarruc visualisation of software arcilltecture components, and does so at various levels of abstraction - not
just at an arcilltectural level. In tills context, dynarruc visualisation refers to the visualisation of a running
39

system and SoftArch's implementation of dynamic visualisation is that of annotating and animating static
visual forms.
SoftArch defines a meta-model of available architecture component types from which software systems can
be modeled. The main abstractions of this model are shown in Table 4-1 along with example elements of
those types.
Component Type Examples
Architecture components Server, machine, store
Associations Local area network, wide area network, connection
Annotations SQL commands
Table 4-1 Abstractions in SoftArch
Each of these elements may have typed properties associated with it. An example of Soft:Arch' s basic
notational elements in the architecture modeling visual language is shown in Figure 4-3.
Figure 4-3 SoftArch's visual language
40

The visual language has the following graphical element mappings (Figure 4-3):
• Oval = architecture component types
• Hmizontal bars = inter-component association types
• Labelled vertical anows = association and component annotation types
• Dashed anowed lines between types = indicate refinement
• Solid anowed lines= association relationships
Developers can then specifY multiple architecture views allowing the system to be visualised from a number
of perspectives, revealing different aspects of the system from high level abstractions to detailed views.
SoftArch will then export a completed architecture model into the JComposer CASE tool [Grundy98].
Developers can then implement the system, creating Java classes in accordance with the components
produced in JComposer. When the system is mn, JComposer components are created and will communicate
between themselves both locally and remotely. The JVisualise dynamic visualisation tool can then inspect the
mnning system, retrieving component information and listening to inter-component communication. During
this inspection and monitoring process, JVisualise sends events to SoftArch so that it can show components
being created, and calls between components (Figure 4-4).
41

~ ~ ~ ~ ~~ ... ~·-----------------------
I lrohl & d.a. d.U .tpp ~· ptot•c:.-1
... ~
/'OL I - ~L " -~ ~ ~ ~ ~~------------------
sUnSMWtrpret.coel •PP etproto<:ol
Sll3pe Miiii!ifM3 r Oet>ug Propagabon
Figure 4-4 SoftArch dynamic view
In this way, a system's behaviour can be visualised using copies of static visualisation views at varying levels
of abstraction, to show both the highly detailed or high-abstracted running system information.
SoftArch is a visualisation system that is both practical and informative. By integrating into a development
environment, SoftArch addresses a key criticism of other visualisations in that it provides a mechanism by
which it can be used by developers dwing software development. Architectural representations are very
much lower level, so other aspects of architecture such as project management, architecture comparison and
architecture evaluation are not directly supported in SoftArch.
4.2.4 SoFi
Source File (SoFi) is a tool that performs source code analysis in order to extract structure. Cam1ichael et al.
[Carmichael95] demonstrate the use of the Software Landscape visualisation on structures extracted by SoFi
in order to compare intended architectw·e with implemented architecture.
SoFi 's approach to clustering of source files into a structure is based on source ftle naming schemes. An
example of a system 's st:mctw·e as extracted by SoFi is shown in Figw·e 4-5. The system here is a 300kloc
piece of software organised into approximately 200 source files.
42

Figure 4-5 System structure extracted from SoFi
After using the system' s designer' s expert knowledge the structure could then be further clustered and re
drawn.
Figure 4-6 System structure redrawn by system designer
Figure 4-7 Extracted architecture
Figure 4-6 shows the major subsystems of the software as intended in the design of the system. Figure 4-7
shows the extracted architecture. This demonstrates the applicability of architecture visualisation for
43

identifYing breaches of architecture design. Cru.michael et al. [Catmichael95] go on to identifY a set of
reasons why the two ru.·chitectures ru.·e different.
SoFi relies heavily on the intervention by an architect. This restricts the applicability of this visualisation to
scenarios that require automated generation of the visualisation. SoFi is another example of an architecture
that is focused on lower-level areas of architecture and does not cater for transient data.
4.2.5 LePUS
LePUS is a fonnallanguage dedicated to the specification of object-miented design and ru.·chitecture [EdenO 1]
[Eden02]. LePUS diagrams are intended to be used in the specification of architectures and design patterns,
and in the documentation of frameworks and programs.
Variables Cons rants
B I ac:m I
e e g !:i
Unary R&talion w R. Bmary Relation
Total relatiOn (thin line) Predicates
Isomorphic rolabon (thicl< hne)
Figure 4-8 LePUS building blocks
Figure 4-8 shows the ' building blocks ' of a LePUS diagram - the elements that are considered to be
ubiquitous in evety object-oriented program.
~ Reference to (onelmany( Creation ·-·-··-···-··-·•
-----1 .. ~ Invocation Production ~--····-··· ·······•
0>------t .. ~ Forwarding
Automaticaly Generated
Inheritance --t>--Interface W
Figure 4-9 Additional LePUS symbols
Figure 4-9 shows additional symbols used in LePUS diagrams.
44

The architectmal structme of a software system, according to the LePUS language, consists of ground entities
and relations. Ground entities has a type, either class or method. Properties of ground entities as well as
conelations between them are represented as relations. "C is a class" is a unary relation and "D inherits from
8 " is a binary relation. LePUS diagrams consist of:
• Tenns (variables and constants)
• Relations
• Predicates
• Operators
These elements are illustrated in the example below.
Figure 4-10 LePUS diagram of the Enterprise JavaBeans framework
Figme 4-10 is a LePUS diagram of the Enterp1ise JavaBeans application framework . This diagram, an
architectural specification, contains only a fraction of the volume ofthe application framework detail.
As a visual language, LePUS is not concemed with the extraction of architectmal information from systems,
but is simply a means by which an architect can encode software architectme for communication to other
stakeholders in that architectme. This will allow for some activities such as construction, evaluation and
comparison, but is not suited to core visualisation activities such as searching and query building.
45

4.2.6 Enterprise Architect
Enterprise Architect (EA) is a UML CASE tool that allows software architects, designers and analysts to
design software from several viewpoints [EA]. Much of the software lifecycle is catered for, from
requirements capture, to UML modelling to testing and project management.
EA utilises a graphical user interface that sits above an entity-relationship style repository. The primary
mechanism for modelling software systems in EA is to use diagrams. Several diagram types are supported,
some of which are listed in the table below. Entities are then dragged onto the diagram area, causing a new
entity to be created. These entities (some of which are listed in the table below) can be edited using the
graphical user interface. Links can be formed between diagram entities by means of relationships, some of
which are listed in Table 4-2. These links cause relationships to be fmmed between entities in the underlying
model.
Diagrams Entities Relationships
Analysis Diagran1 Associate
Use case Package Aggregate
Class Class Inhe1it
State Interface Association
Activity Object Dependency
Collaboration Actor Realise
Sequence Database Table Trace
Component Boundary Nesting
Deployment Use Case Association
Custom Requirement Object Flow
Table 4-2 Diagrams, entities and relationships in Enterprise Architect
46
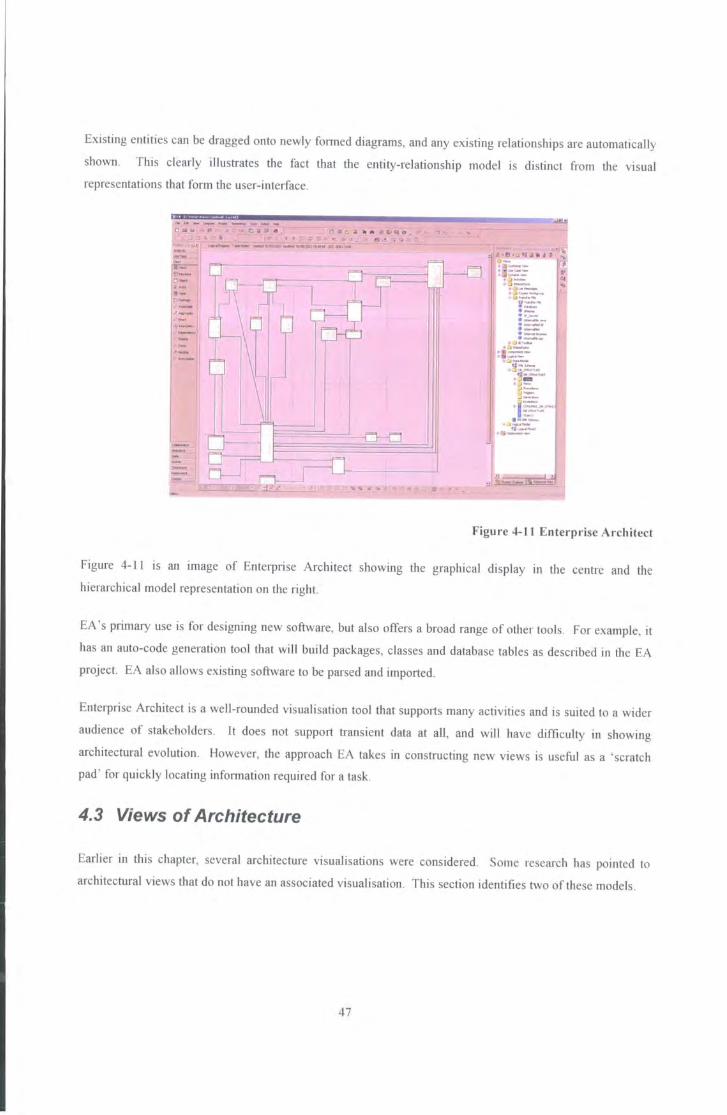
Existing entities can be dragged onto newly formed diagrams, and any existing relationships are automatically
shown. This clearly illustrates the fact that the entity-relationship model is distinct from the visual
representations that form the user-interface.
~. .. \>o<•O.. .. ·--- ---.~.Ka uonu
,. __ ,_
--
. -. .-.:---.,_ . -.... __ ··--18·-~ ¥=."' ····--· ·~ ··-·--····-·= --~ --.::..
-:I~ . -'I:. · •=--~ ---. ., .. _
. a-..~._.
•!!il--
Figure 4-11 Enterprise Architect
Figure 4-11 is an image of Enterprise Architect showing the graphical display in the cenh·e and the
hierarchical model representation on the 1ight.
EA's primary use is for designing new software, but also offers a broad range of other tools . For example, it
has an auto-code generation tool that will build packages, classes and database tables as desc1ibed in the EA
project. EA also allows existing software to be parsed and imported.
Enterprise Architect is a well-rounded visual isation tool that supp011s many activities and is suited to a wider
audience of stakeholders. It does not support transient data at all, and will have difficulty in showing
architectural evolution. However, the approach EA takes in constructing new views is useful as a 'scratch
pad ' for quickly locating information required for a task.
4.3 Views of Architecture
Earlier in this chapter, several architecture visualisations were considered. Some research has pointed to
architectural views that do not have an associated visualisation. This section identifies two of these models .
47

4.3.1 4+1 View Model
Ad-hoc, poorly defined, and over-ambitious diagrams are the motivation for Kruchten's 4+ 1 view model of
software architecture [Kruchten95]. When many aspects of architechrre are combined into a single diagram,
it can become unclear as to what graphical components are attempting to represent. Kruchten describes
model composed of five views, or perspectives. They are the logical, process, physical and development
views along with selected use cases or scenarios. Each view is described in tenns of its elements, fonn and
rationale/constraints, a decomposition identified by Peny and Wolf [Peny92]. Each view can have its own
architectural style and has its own notation.
The 'Logical Architecture' or 'logical view' is an object-oriented decomposition that closely maps to the
functional requirements of the system. Simplified class diagrams and class templates are used to represent
this view. The style for the logical view is an object-oriented style with one guideline to keep a single object
model across the entire system.
The 'Process Architecture' or 'process decomposition' addresses issues such as concunency and distribution,
showing where independently executing units, called processes, are to be deployed across hardware, networks
and other platforms. Individual processes can be manipulated at an architectural level with operations such as
start-up, reconfigure, shutdown and so on. This level of description takes into account non-functional
requirements such as perf01mance, availability and fault-tolerance. Several architectural styles fit this
pa1ticular view, including client-server, pipes and filters, and so on.
The 'Development Architechtre' or 'subsystem decomposition' describes the division of the software into
units named 'subsystems' such as namespaces, packages, modules, libraries, classes and so on. Each of these
units can be assigned to a group of developers as each subsystem is given a well defined interface through
which the subsystem can communicate with other layers. The development architecture view is represented
by module and subsystem diagrams that illustrate import and export relations. This particular view is largely
internal in its relevance. It helps in project management, task assignment and so on, allowing for cost
evaluation and planning, monitoring, reuse and analysis of portability and secmity. As mentioned previously,
the recommended style for this view is the layered style as upper layers only depend on subsystems that are in
the same layer or layers below it allowing for simple release strategies by layer.
The 'Physical Architecture' shows the mapping of software to hardware. Identified elements such as
networks, processes, tasks and objects are all to be assigned processing nodes. During the life-cycle of the
software system, it is possible that many hardware configurations will be used, in development, testing and
deployment, so the elements should require the minimum of change for each configuration.
48

Finally, scenarios bind the four vtews together in instances of more general use cases. Scenarios are
redundant, hence the '+ 1'.
4.3.2 IEEE 1471-2000
The purpose of IEEE standard 14 71-2000 (IEEE Recommended Practice for Architectural Description of
Software-Intensive Systems) is to facilitate the expression and communication of architecture of software
intensive systems [IEEE 14 71].
According to the IEEE 1471-2000 standard, every system has an architecture that can be documented by an
architectural desctiption. In this model, the architecture is a conceptual entity whereas architectural
descriptions are concrete entities that exist in order to describe the conceptual architecture. Architectural
desc1iptions are comprised of architectural views, each of which addresses one or more concerns of the
system's stakeholders. Each stakeholder, therefore, has a set of concerns - interests that they have with
respect to the system's development and operation.
Viewpoints exist to define the conventions by which a vtew is depicted. It detennines the languages,
notations and models that are used to describe that view. A view is an expression of the system's architecture
with respect to a pa1ticular viewpoint.
The standard requires that an architectural description identify the stakeholders and concerns of the software.
As a minimum, this should include:
• Users
• Acquirers
• Developers
• ~aintainers
A set of viewpoints are defined, each of which address the concerns of particular stakeholders. A number of
architectural views are then defined, each including:
• An identifier for the view (e.g. functional view, operational view)
• Representation of the system (constmcted with the languages and models defined in the associated
viewpoint)
• Configuration information.
49

Each view may contain more than one architectural model. Additionally, the architectural description
includes the rationale for the architectural concepts selected.
4.4 Current Trends Issues and Challenges
A large number of existing software visualisations are aimed at developers and maintainers of software
systems. Whilst this may represent a significant propmtion of the stakeholders in a software system, there are
other areas of the software life-cycle that can be addressed by software visualisation, and therefore apply to a
larger number of stakeholders. Software architects and designers are often less involved in the detail of
software such as method variables, message passing and class properties. Instead, they are more involved
with components, connectors, APis and deployment objects such as machines, clusters and networks. By
focussing on high levels of detail, existing visualisations often exclude software architecture as a view of
software in its own right. Several architecture visualisations have attempted to address the issues posed. This
section describes the trends and issues associated with cunent architecture visualisations and identifies the
challenges raised.
4.4.1 Definitions, Views and Models of Architecture
Several definitions of architecture exist. This may be a reflection on the fact that there are a large number of
views on what software architectures are, what they are used for, who uses them, and what they are comptised
of. It is clear from the research background that some research has clearly drawn a line around what entities
comprise software architecture. For example, ADLs clearly define these entities as they are formal language
with defined structure and semantics. In other cases, class structure is refened to as the architecture of a
software system, without any formal architectural named entities such as 'component' or 'connector'.
Similarly, views of architecture can be fmmally defined in some research, but in other cases it is very much
left to the designer to formulate what views exist within the architecture.
It is beyond the scope of this thesis to detetmine which of these extremes are COITect, but it is irnpmtant to
recognise that there are extremes when considering the design of an architecture visualisation.
4.4.2 Representation and Mappings
Related to the issue of models and views, there is a wide variety of what graphical components can be used to
describe an architecture. The increasing use of UML in modem software engineering is evident in cunent
software architecture visualisations. However, this is not common across all architecture visualisations, and
therefore there are directly conflicting mappings.
50

It is impossible to reconcile these mappings, so the design of an architecture visualisation should cater for
these differences in representation.
4.4.3 Roles and Stakeholders
Many of the software architecture visualisations that have been considered in this chapter say very little of
stakeholders in a software system other than architects and developers. It is obvious that the focus of the
software architecture visualisations is ve1y much towards these two roles.
4.4.4 Obtaining Architectural Data
4.4.4.1 Static Capture
Static processing is perhaps the most often used strategy for recovermg the infotmation needed for
visualisation. Typically for detailed visualisations, a language parser is coupled to a data store and operates
over the source repository for the target system. The parser is built or configured such that the data store is
populated with entities that are deemed important for the visualisation. This data store is then used by the
visualisation system to constmct visual elements for display and navigation.
The data store of an architecture visualisation may contain large amounts of highly detailed information
regarding the target system - it is the responsibility of the visualisation to present only that information that is
required. For example, some views of architecture do not require method and variable level information.
4.4.4.2 Dynamic Capture
Static representations of software are often very different to the dynamic runtime reality of that software.
Dynamic capture attempts to retrieve infonnation regarding a mnning software system.
Augmentation of software is an invasive procedure that allows the addition of code to the source of a software
system that will cause logging events, or update a visualisation display. Augmentation can be a manual
process, where a developer or system expert adds the required code to the approptiate places. Augmentation
can also be an automatic process where a precompiler tool insetts appropriate code into the source before
compilation occurs. This code performs the appropriate function according to the visualisation, such as
updating a repository, sending events to another system or updating a display. Another method for
augmentation can be found used with the Java language, where classloaders are used to load classes into a
running virtual machine. Custom classloaders can be used to automatically augment software without the
need for recompiling the source code. The Java Virtual Machine also offers a debugging interface that allows
external software to access all runtime information generated by the virtual machine.
51

4.4.4.3 Online and Offline
The visualisation process can occur in one of two temporal frames: online or offline. When a visualisation is
canied out online, the visualisation is running alongside the system being visualised, and the display is
updated as soon as possible after the event that caused it is triggered. If a visualisation is offline, the nigger
events cause updates to a store such as a log file or database. After the system execution has completed, or
the process terminated, the store can then be used by the visualisation in order to render the necessary views.
Both approaches offer relative me1its and disadvantages. For online visualisation, the events can be viewed in
real-time. This lends itself to situations where responses to such information are required in a live
environment. For example, identifying a component that has failed in real-time is useful for contingency
procedures to be executed. Online visualisation is necessmy for situations where the choice of view depends
on the cunent state of the system. For example, the user may only choose a pmticular view of component X
if component Y has failed. Conversely, online approaches have theiJ problems. Firstly, given the large
volumes of visualisation information that can be provided by a system can overwhelm the rendering
capability of the visualisation system, causing it to lag behind the data.
Offline visualisation can help with the problem of data volume. If the visualisation system cannot cope with
the data volume, filters can be deployed to reduce the data flow into the visualisation system.
4.4.4.4 Storage
A typical visualisation system will comprise of the following data-sets:
• System data retrieved from static processing and description capture
• System data retrieved from dynamic processing
• Representations and mappings for the visualisation.
• Intemal representation of the visualisation
• Extemal representation of the visualisation
The choice of storage system for each of these areas will depend on the structural support and performance of
that system. Typical choices include:
• Relational Database
• Flat-file (for example, a log file)
• XML Document
• Object/data-st1ucture persistence
• Objects/data-structures in memmy
52

Relational databases are well understood and provide for query languages, analysis tools and a variety of
connectivity methods. Performance can be achieved with careful structuring of the data store, and by
adjusting database management system parameters (DBMS) parameters. Flat-files are typically used where
data processing requirement are to be kept to a minimum. Usually the only operation canied out on a log file
during data capture is to append a line to the file. The log file can then be used with the visualisation system
by replaying events back to the visualisation system, or more typically the log file is parsed and processed,
and the resulting information stored in a database for access by a visualisation system.
A recent trend for software in general is to make use of the XML language. XML is often used for storing
structured information, and here lends itself to many areas where validation and querying is required. For
example, XML is useful for storing mappings, representations and metaphors. One ofthe advantages ofXML
over databases for structured information is that the XML data is human readable. Another is that XML
documents can conform to and therefore be validated against XML schemas.
Whilst a visualisation system is mnning, visual objects, system objects, configuration information and data
structures are all held in memory. This is the fastest store for visualisation information in comparison to the
other methods described here. Visualisation system can use object serialisation to persist the state of the
visualisation to a long-tenn store to be utilised at a later time. In this way, visualisation state can be saved,
replicated and reverted to.
4.5 Conclusions
By examining a selection of existing software architecture visualisation systems, a number of trends, issues
and challenges that face this area of research have been identified. Firstly, the definition and scope of what
software architecture actually is does vruy considerably from one organisation to another, and from one
software system to another. The representation of such software architecture also varies, and is dependent on
many factors including organisational policy, and individual preference. There are a number of roles and
stakeholders in a software system, but existing software architecture visualisations often fail to address all of
those stakeholders. Finally, this chapter considered the process of obtaining architectural information, and
identified the types of data that are relevant to software architecture.
53

Chapter 5: The Arch Vis Approach
54

5. 1 Introduction
This chapter describes the Arch Vis approach to software architecture visualisation. It examines the nature of
the Arch Vis visualisation concept, its aims, and presents the mechanisms by which it achieves those aims. A
standard set of tenninology is outlined to provide consistency in desc1ibing Arch Vis, which is followed by a
description of the elements used to describe software architecture. Then, an overview of the Arch Vis
approach is given in order to provide context for the rest of the chapter. Next, the mechanisms for the
extraction of architectural data are examined. Following this, the system for creating a visualisation of the
data is presented when render models and renderers are considered. This then provides a basis for looking at
the Arch Vis view model, looking at how views are defined and constructed. A number of views are
developed and illustrated: component views, developer views, project manager views, technology and
deployment views, and sales and marketing views. From here, the topic of interaction is discussed by looking
at context sensitive actions and describing the activities that Arch Vis supports.
5.2 ArchVis Visualisation System Overview
Arch Vis is an approach to software architecture visualisation that is seated in cunent software visualisation
techniques. The approach addresses key concems identified in previous chapters:
• Arch Vis supports multiple representations of software architecture - it is not limited to
source code representations.
• Arch Vis supports multiple stakeholders of software architecture - it suppmis stakeholders
other than developers and maintainers.
• Arch Vis supports both static data and transient data.
• ArchVis utilises a flexible data model allow for the capture of a wide spectrum of
architecture.
• Arch Vis utilises a flexible render pipeline for defining any number of different views.
• ArchVis utilises a flexible render model that allows for the creation of many graphical
components for use in rendering a view.
In order to visualise the architecture of a software system, a number of actions need to be performed in the
following order Visualisation Definition, Data Extraction and Visualisation (Figure 5-l ).
55

Visualisation Definition
Data Extraction Visualisation
Figure 5-1 Arch Vis Visualisation System Overview
The first two are peifotmed before the visualisation occurs, and the last item is the running of the visualisation
itself. Each is discussed in more detail below.
5.2.1 Overview of Visualisation Definition
Arch Vis is controlled by configuration, called the visualisation profile, and this configuration determines the
behaviour of Arch Vis during visualisation. The two main aspects of the visualisation profile reflect the two
types of data: static and transient. Static data conforms to the data model described later in this chapter, and
transient data is comprised of events.
For static data, a number of views are defined. These views determine what elements of the available data are
useful, and how that data is to be retrieved. The view specifies how data is to be filtered in order to produce a
data set that is suitable for rendering. Finally, the view defines how a render model is constructed from the
filtered data by using a renderer.
For transient data, the visualisation profile determines how events are mapped into actions on the render
model. These actions will change elements in the render model in an appropriate manner.
This thesis describes five sets of views (component views, developer views, project manager views,
technology and deployment views, and sales and marketing views) but an essential capability in this
visualisation is that views can be added and removed both before the visualisation begins, and during the
visualisation process.
5.2.2 Overview of Data Extraction
Data extraction here refers to the extraction of static data, and the extraction of transient data. Static data is
data that is generated before the visualisation process, and transient data is data that is generated dming the
visualisation process and concerns the execution of the software architecture being visualised. Typically,
static data is recorded in some long-term store such as a database or file store, and transient data is received as
a sequence of events. Transient data pertains to the visualisation at the time of execution and its lifetime does
not extend beyond a particular execution of the system.
A number of extraction methods are defined by which architectural data is retrieved and passed to the
visualisation.
56

5.2.3 Overview of Execution
Execution of the visualisation means taking the visualisation profile and the static data and creating the
defined views. It also encompasses all elements of interactivity and the use of transient data.
As the visualisation begins execution, it will create the relevant views. These views define how data is to be
filtered before being passed to the renderer that has been set for that view. Once the render model has been
constmcted and displayed, transient data events can cause changes to elements in that model. Also, the user
can interact with the visualisation in a number of ways.
5.3 Architecture Representation Choice
Programming languages are stmctured entities; they are well-defined constructs that can be parsed easily.
Software architecture, however, is interpreted in many different ways with its constituent entities and
relationships selected from different domains. For example, in the enterprise software domain, platforms and
machines may represent architecture whereas in the compiler domain, architecture may be represented by data
structures and their relationships. Some software systems have their architecture explicitly recorded, whereas
others do not. Within Arch Vis, the choice of a data model that gives greatest flexibility ameliorates many of
these problems.
In simple terms, software architecture in Arch Vis is represented as a set of entities and a set of relationships
between those entities. Both entities and relationships also have properties. This ER model has historically
proven useful for describing and modelling aspects of software architecture [Soni95].
5.3.1 Entities
Entities comprise of three elements:
• Name
• Type
• Properties
One entity is considered to be equal to another entity if both the names of both entities are equal, and the
types of both entities are equal. The third element, the entity's properties, is a convenience for associating a
set of key-value pairs with an entity. Prope11ies are typically used when the property may not have further
entities associated with it. For example, an entity 'rectangle' that has a relationship to another entity 'red'
may be more suited to having 'red' as a property rather than an explicit entity and relationship.
57

Table 5-l gtves a number of examples of the types of entities that are commonly used in architectural
representations.
Categories
Computation Connector Physical Platform OS
Module Protocol Server Web Server Log
~ ·-~::: ·-~::: Class Transpott Machine App Server File
~ ~
~ Bean Interconnect Net Device DB Server File-system
~ ~
EJB Location Framework Kernel
Package
Table S-1 Examples of entities used in architectural representations
The collection of entities associated with an architecture depends on the domain of the software, amongst
other aspects. An enterptise software system will have very different entities compared to, for example, a
compiler's architecture.
5.3.2 Relationships
Relationships consist of the following elements:
• Name
• Type
• Source
• Destination
• Direction
• Propetties
58

Here, the source and destination elements are references to entities. The direction indicates whether the
relationship is forwards, backwards or bi-directional. For two relationships to be equal, the names, types,
sources and destinations have to be identical.
Table 5-2 lists examples of the types of relationships that are commonly used in architectural representations.
Categories
Computation Connector Physical Platform OS Generic
tl Contains Protocol Deployed on Interfaces to W1itten to Is a .... -~ ~ Has type Connects over Situated at Built on Read from Uses
~
~ Imp01ts Stored on ~
~
Table 5-2 Examples of relationships used in architectural representations
The categ01ies used in Table 5-2 are for ease of description rather than being a prescriptive taxonomy.
Relationship names, types and properties also depend on the domain of the software and also the data source.
Relationships found in static UML diagrams will differ to relationships found in sequence diagrams, for
example.
5.4 Data Extraction and Storage
Architectures are represented in a great number of different ways. In order to be successful in a real-world
application, the Arch Vis approach has to be able to support a potentially large number of sources of data, and
also support large volumes of data. It is possible to recover architectural information from data at lower
levels of abstraction, and so the Arch Vis approach should be capable of exploiting this fact.
In the visualisation process, the first step is to obtain the data from various locations by various means. From
a temporal perspective, data input into Arch Vis is either static data or transient data. Arch Vis has two
interfaces: one for static data and the other for transient data (Figure 5-2)
59

usas
Data read
An:hVi5 Vlsuallsatlon System
uses
Events sent
I Event
Source
Figure 5-2 Arch Vis data interfaces
The basic function of components that implement the static data inte1face and the transient data interface is to
map real world entities to (entity, type) tuples, that is f: W ~ E where W is the set of real world entities
and E is the set of all (entity, type) tuples. These components also extract the relationships and properties
that are associated with these real world objects.
5.4.1 Static Data
Static data is placed into a reposit01y that Arch Vis can then use. The data model for Arch Vis is an entity
relationship (ER) model along with properties associated with both entities and relationships. Arch Vis
provides an inte1face by which different storage mechanisms can be implemented, allowing for two distinct
advantages.
Firstly, Arch Vis can directly use existing data sources as part of its data set in an online fashion, without an
explicit extraction and store process. A component can simply act as a gateway between Arch Vis and the
data source by translating the source data structures into a set of entities and relationships 'on the fly' (see
Figure 5-3). In this approach, the design of the component will dete1mine the resulting ER data set.
60

ArchVi1> VIsualisation S~stem
I uses
l Static Data I ntelflloe
Translator
t Data read
EJ Figure 5-3 Arch Vis data gateway
Secondly, Arch Vis can take advantage of different storage technologies available. This is impmtant as the
number of entities and relationships can become large, petformance may increasingly be an issue. For
example, an implementation that uses a flat file structure can be replaced with a database implementation, or
even an implementation that uses RAM only.
Fundamentally, the ER model also provides a very simple model that many different extractors can operate
with .
status:
Figure 5-4 Arch Vis static data server
61

In order to allow for a wide aiTay of input sources to be used, the mechanism used for extracting and
retrieving data utilises a client-server architecture. The server (Figure 5-4) is responsible for listening for
connections from clients and receiving data sent by those clients. A simple rolling graph indicates an
impression of the activity of the server in terms of numbers of entities and relationships and prope1ties added.
Once received, the data is stored using the selected ER Store, which can be one of a number of
implementations (Figure 5-5).
SeJVer
1
1
I •i nterface • I EntityRelationshipStore
I I f ~ ~
I I EntilyRelationshipStoreMySOL EntityRelalionshipSioreMemory EnlityRelationshipSioreSerialisalion
Figure 5-5 EntityRelationshipStore static UML diagram
Utilising a conunon client with a well-defined interface, many different extractors can interface to the server.
Figure 5-6 shows how this is achieved. Each extractor is linked to an implementation of the 'Client'
interface. This client exposes a simple inte1face for adding entities, relationships and prope1ties, and it
handles all communication with the server.
62
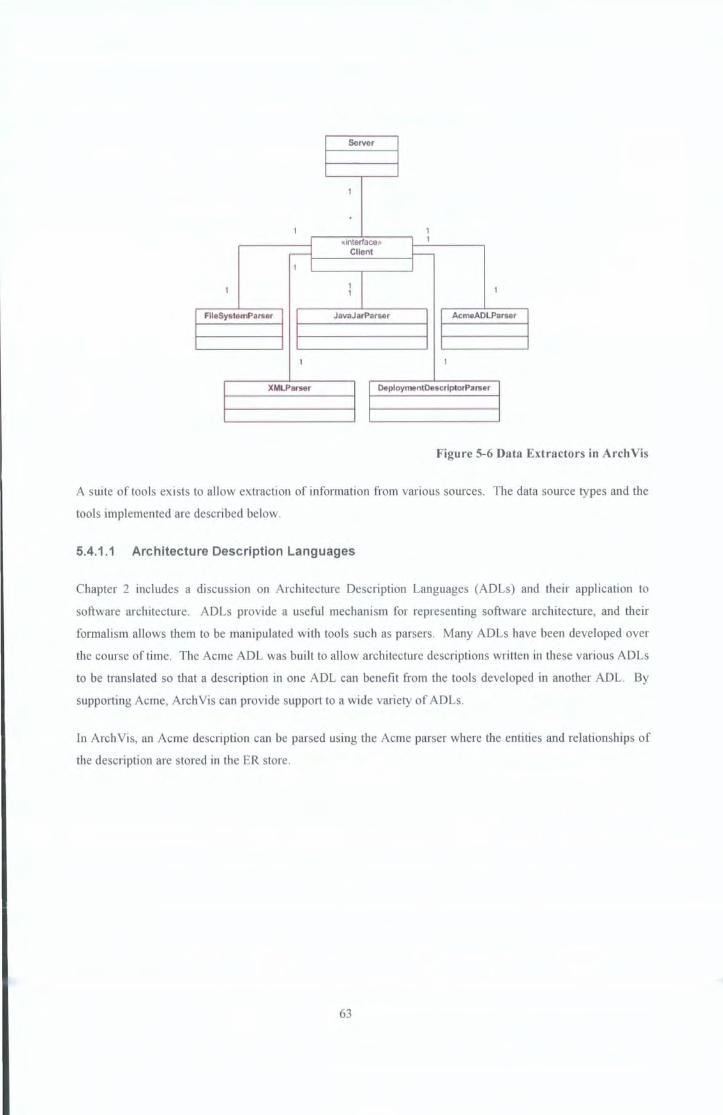
Server
1
I 1
«inlerfaceo 1
--l Client ~ 1 I I
1 1 1 1
FllaSysll>ITIParser JavaJarParsar Acm<~ADLPa,.,..,r
1 1
XMLParser DeploymentDescriptorParser
Figure S-6 Data Extractors in Arch Vis
A suite of tools exists to allow extraction of infonnation from various somces. The data source types and the
tools implemented are desc1ibed below.
5.4.1.1 Architecture Description Languages
Chapter 2 includes a discussion on Architecture Description Languages (ADLs) and their application to
software architectme. ADLs provide a useful mechanism for representing software architecture, and their
formalism allows them to be manipulated with tools such as parsers . Many ADLs have been developed over
the course of time. The Acme ADL was built to allow architecture descriptions WJitten in these vmious ADLs
to be translated so that a desc1iption in one ADL can benefit from the tools developed in another ADL. By
suppmting Acme, Arch Vis can provide support to a wide variety of ADLs.
In Arch Vis, an Acme description can be parsed using the Acme parser where the entities and relationships of
the desc1iption are stored in the ER store.
63

System
·~ • 1 1 1 . . Component Connector Attachment
~ ~ ~ 1 1 1 . . .
Port Rolo Port-Role Binding
Figure 5-7 Acme ADL language structure
Figure 5-7 shows the main pmts of the structure of the Acme ADL. The Arch Vis Acme parser produces
entities and relationships that follow this model.
5.4.1.2 Source Code
Perhaps the most well understood methods of extracting information about software systems come from
traditional program comprehension and software visualisation resem·ch. Here, the source code for a software
system is used as the input to the visualisation. In Arch Vis, a source code parser can be used to parse a set of
source files in order to populate the ER store. Arch Vis and the source code parser are very loosely coupled,
so the source code parser can be implemented in a number of ways. An obvious solution is for a custom
parser to process the source files directly and populate the ER store accordingly. Figure 5-8 is a data-flow
diagram of such a strategy.
Source files
Sialic structure
a-'"!:.:=:~~"~~' """'"'"---jL_s_ta_u_·c_s_to_r_e_
Figure 5-8 Data flow diagram of source code parsing
64

In another solution, an existing parser may have already created a database of infmmation for which a
separate tool can use that existing database as its input in order to populate the ER store. This is illustrated in
the data flow diagram in Figure 5-9.
Parser Database
Static Structur9
~ Entities & Rtela~ons -~ Erltltles & Relations ~ overnewo'" ~ Static Store
Figure 5-9 Data flow diagram of parser database extraction
5.4.1.3 Configurations
Another increasingly impmtant source of persistent data is the configuration file. Two common examples of
configuration files are key-value configuration files and extensible mark-up language (XML) documents. For
the purposes of this thesis, key-value configuration files refer to properties files, initialisation files and system
registry information. Arch Vis makes use of a configuration file reader and XML document parser that can
extract infmmation from configuration files and place them in the ER store. XML use for defining the control
structure of a software system is prevalent in enterptise environments such as in deployments of J2EE (Java 2
Enterprise Edition) applications. In patticular, those applications that utilise the Struts framework where
XML configurations define the flow of pages and also of intetmediate actions.
5.4.1.4 Documents
Another type of infmmation source is the document. Documents are widely used to describe many aspects of
software systems in a multitude of ways. It is these documents that are invaluable to many stakeholders in a
software system dming all phases of the software lifecycle. Ideally, Arch Vis would support the automatic
parsing of natural language documents. Instead a tool can be used to help a stakeholder add information to
the ER store. This tool is implemented such that any entity, relationship or property can be added to the store,
and can therefore be used to capture document-based data.
65

" ER '1odeller ,,•
.... ~~--- · r Relationship I Save Model I
J2EE Server.platform
Figure 5-10 Arch Vis modeller
Figure 5-l 0 shows an ER model based on inf01mation found in docwnentation of a software system. Once
the model is has been successfully recorded, it is added to the ER store.
5.4.2 Transient Data
Arch Vis retrieves transient data by acting as a server to a number of clients. Clients are able to initiate
connections to the Arch Vis service and begin to send event information (Figure 5-l I).
I Ewnt
S.X.ce
Atd>Vos VIsualisation S:.-stem
I
E11e11tssen1
I Ev1111t
Source
66
E11e11ts sent
I Event
Source
Figure 5-11 Arch Vis transient data interface

Event infonnation comprises of a set of key-values. This event information is then utilised within Arch Vis in
order to perfonn the following actions:
• Create a new entity or relationship
• Delete an existing entity or relationship.
• Change the properties of an entity or relationship.
An important aspect to mention here is that these operations are not perfmmed over the original data in the
ER store; they are operations over a temporaty ER store used to generate views. This issue will become clear
when views are discussed later in the chapter.
To facilitate re-running of a scenatio, events can also be stored in a log to allow for playback.
5.4.2.1 Runtime Information
Some areas of program comprehension have used data gathered from a software system at tuntime. The
sttucture of software at runtime is very different to the static representation of that software in source code.
There are two broad methods of extracting this infonnation. The first is 'instrumentation' which involves
changing the software itself to include statements that will record infmmation about the tunning system. This
is a directly intrusive approach. Some variants of this approach allow for pre-processing of source files in
order to make the process less complex, but the resulting software is still modified. ArchVis supports this
method of collection through the Arch Vis Instrumentation intetface (Figure 5-12).
java. net java. not
ArchEvontCiiont ArchEvontSGrvor
se11dE11er1t('ln e\19r11, In type, In data) processE11ent(ln event, In type, in data)
Figure 5-12 Arch Vis client-server communication for transient data
67

The second method of extracting runtime information is applicable only to software that executes on a
platform or virtual machine that suppot1s that software. Perhaps most obvious is the debugging interface of
the Java Virtual Machine (JVM). Using the debugging APis, developers can build software that connects to
the JVM in order to retrieve relevant information regarding rw1time events [Smith02]. An advantage of some
JVM implementations is that the debugger tool can be run remotely to the JVM, so the processor that drives
the tool that uses the debugging infmmation can exist on an entirely separate machine.
Figure 5-13 Arch Vis and the Java debugger interface
Figure 5-13 shows how Arch Vis can interface to the Java debugger interface.
Software architecture may also change during a program' s execution. In some literature, this is refened to as
' dynamic architecture ' . The ArchVis approach has limited support in that changes to the intermediate data
store can cause the render model to change significantly. This largely depends on the implementation of the
renderer.
5.4.2.2 Log Files
A common tool used in a runnmg system is a log file. These log files are produced to help a system
administrator or developer to detetmine a sequence of events . Log files contain vruying levels of data from
infotmation-only entries to ctitical etTors . One problem with log files is that they are often completely
proprietaty to the system that produces it, and they will often share no resemblance to any other log file.
However, pru·sing log files is possible using a custom log file parser. One implementation of the Log File
Parser allows the replay of event infmmation that has been stored in a file .
5.4.2.3 Network Traffic
Another source of data of a running system is the network. For web based applications it is often useful to be
able to monitor HTTP traffic. Figure 5-14 shows the Arch Vis HTTP network sniffing tool in operation.
68

Figure 5-14 HTTP network sniffing tool
This can be configured in a variety of ways in order to capture different types of information, including:
• Source address
• Destination address
• URL
• Method (GET/POST)
Another common network protocol used in enterptise software systems is the Simple Network Management
Protocol (SNMP). Arch Vis can retrieve SNMP infonnation from a variety of devices on the network
including routers, switches and computers.
5.4.2.4 Consolidation
It is the responsibility of the individual who is building the visualisation to ensure that the different data
extraction tools produce data that will be coherent once consolidated. Each tool that produces entity
relationship data for the visualisation can be said to have a vocabulary. If W is the set of all real world objects
(within the domain of the data source), and E is the set of all (narne,type) tuples, then the vocabulary mapping
function v relates real world objects to (narne,type) entities v: W---+ E. Both static data providers
implementing the Static Data Interface and transient data providers implementing the Transient Data Interface
are components that perform function v.
69

Static Data Source A
Static Data Source B
Data ER Data > ~san assodaled
1 ~vocabulary VA
Has an assodated vocabulary v.
Figure 5-15 Consolidation process
A vocabulaty, associated with a static data provider, is a subset of entities: V c E . A renaming function r
will translate an entity e E E to another entity e' E E . The intention of a renamer component, which
implements a renaming function, is to map entities of one static data provider to another static data provider
such that their vocabularies match. That is to say for all real world objects, w, a renamer function r should
translate a vocabulary function v such that the resulting entities are the same as using another vocabulary
function on the same real world object: r( v( w)) = v' ( w).
5.5 Arch Vis View Model
So far, the data extraction process has been discussed. Once all the static data is available in an ER store, it is
ready to be visualised. The Arch Vis view model describes how this data is used to provide views on the
architecture.
In a similar manner to IEEE 1471, ArchVis allows the definition of a multitude of architectural vtews.
Frequently, research into software architecture identifies the need for more than one view of the software
architecture. A model for how views are used in Arch Vis is required, and is called a 'view model'. The view
model utilised by Arch Vis allows the definition of a vocabulary, model and graphical representation of
architectures. Figure 5-16 is a class diagram of the view model. It shows that a visualisation profile has
70

exactly one ER store, but defmes a number of views. Each of these views can have a number of data filters
associated with it, and exactly one renderer.
VlsuallsatlonProflle EventMapper
1 1
I 1 1
1 .
ERStore VIew
lnputSelector -name -defin ilion
1 1
~ 1 L
1 . 1
DataFIItor Ronderor
Figure 5-16 Arch Vis view model
A visualisation profile consists of a number of views, and an entity relation store. The ER store is common
across all views as each view is a representation of that underlying data. Each view has its own set of data
filters and a render component. Data filters are defined to be an ordered list of filter components that take an
entity-relation store as input, and output an ER store. In this way, the filters can be concatenated to achieve
vatious functions. Also, each view has an associated definition in accordance with IEEE 1471 [IEEE 14 71].
This definition will typically be a textual definition, or link to a document that contains the defmition. Other
aspects of the view model shown in Figure 5-16 are described elsewhere in the thesis .
.___E_R_s_t_o_re __ -'"" O.o~ Filtered Daia (AJ
$ Filtare!l Data (B)
@'"'"""' o.o (C)-I.__R_e_n_d_er_e_r---'
Figure 5-17 Arch Vis static data filters
71

Figure 5-17 illustrates a view that consists of three filters. Data is rettieved from the ER store defined for the
visualisation profile, and is passed to the first filter in the list. This filter then outputs an entity-relation store
which is received by the next filter, 8, and then again through to C. Finally, the entity-relation store that is
output from C is passed directly to the renderer. For example, Filter A may remove entities of a certain type,
Filter 8 may consolidate some related entities, and Filter C may factor some relationships into properties of
entities.
A renderer takes an entity-relation store as input, and generates a render model. This render model is of a
different structure to an entity-relation store, and is suitable for drawing.
RendeJModeiManager
l+drawModel()
I .
I •intBrface• I Drawable
l+tifa>N(} I
f if I
OmwiibleNode Line
~ ~ SimpleBox Labelledlcon StraighiLine
Figure 5-18 Arch Vis' render model
The render model, shown in Figure 5-18, is controlled by a render model manager. It is the responsibility of
the render component to take an entity-relation store and construct an appropriate render model. A key
capability of this model is that it will suppmt any number of filter configurations and renderers.
This approach to views means that any number of views can be created, cateting for different view models
found in research, such as the 4+ I view model desctibed in chapter 2.
5.6 Render Models and Renderers
As shown earlier in this chapter, a view utilises a renderer in order to generate a visual representation of
architecture. This renderer creates a render model, which is comp1ised of a set of graphical components along
with a mechanism for organising those components.
72
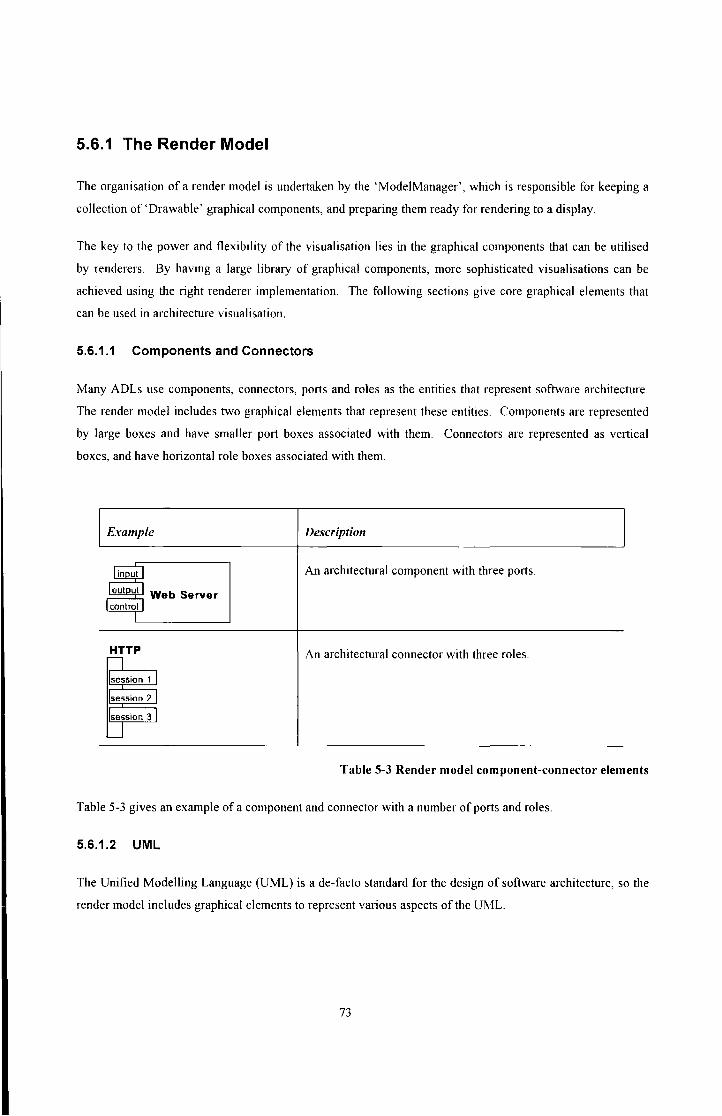
5.6.1 The Render Model
The organisation of a render model is undertaken by the 'ModeiManager', which is responsible for keeping a
collection of 'Drawable' graphical components, and preparing them ready for rendering to a display.
The key to the power and flexibility of the visualisation lies in the graphical components that can be utilised
by renderers. By having a large library of graphical components, more sophisticated visualisations can be
achieved using the right renderer implementation. The following sections give core graphical elements that
can be used in architecture visualisation.
5.6.1.1 Components and Connectors
Many ADLs use components, connectors, ports and roles as the entities that represent software architecture.
The render model includes two graphical elements that represent these entities. Components are represented
by large boxes and have smaller port boxes associated with them. Connectors are represented as vertical
boxes, and have horizontal role boxes associated with them.
I E:'l:ample
HTTP I session 1 I session 21 session 3 I _j
Description
An architectural component with three ports.
An architectural connector with three roles.
Table 5-3 Render model component-connector elements
Table 5-3 gives an example of a component and connector with a number of ports and roles.
5.6.1.2 UML
The Unified Modelling Language (UML) is a de-facto standard for the design of software architecture, so the
render model includes graphical elements to represent vatious aspects of the UML.
73

Example Description
II A UML package, indicating a collection of classes and webservices.http I
interfaces.
HTTPConnectlonHandler A UML Class showing attributes and methods. -count : int -Size: mt
+seiSod<et() void +geiSod<el() : Socket -regJsterProoessor( ) : VOid
<<interface>> A UML lnte1face showing methods. Eve ntProcessor
+processEvant{) : int
Table 5-4 Render model UML elements
Table 5-4 gives an example of a package, class and interface. The class shows detail of the attributes and
methods of the class, and the interface shows the methods associated with it.
5.6.1.3 Physical Elements
In the modelling of a software system, especially one that is distiibuted, the physical location of various
components, and the configuration of the network between them are important.
Example
Web Server
Cl ient Mobi le Client
Gigabit Swi td1
Description
A computer deployed in a server-room environment that
executes some software components of the architecture.
Client computers and devices that are users of the software
system whose architecture is being represented.
Network devices that describe the topo logy of the network
of computers in the software architecture.
Table 5-5 Render model physical elements
Table 5-5 shows a set of commonly used graphical elements that represent various physical hardware.
74

5.6.1.4 Utility
This section describes other graphical elements that are fundamental to displaying software architecture, but
do not fit any of the categories identified above.
Example
Name:Type
L
Description
Simple geometric shapes: rectangle, ellipse and triangle,
wruch can be labelled.
Abstract representations by using 3D-effect images such as
spheres, which can be labelled.
A collection of related entities, where the relationships
between them are layered. Tills graprucal component
removes the need to show the inter-entity relationships as
lines, but instead uses visual proxirruty. This example is
showing the OSI network model.
Simple straight lines with labels, and angled Lines. Both
may have aiTowheads at each end of the line.
Lines that have an association wi.th the real world in the
domain of pipes and filters .
Table 5-6 Graphical components in Arch Vis
Table 5-6 lists some of the more commonly used graphical elements, including lines. As shown, fwth.er
advantages can be made when graphical components are composite, such that one graphical component is
composed of more graprucal components (see OSI network model). Composition can happen with any
graphical element, although the visual appeal of the resulting composite graprucal element may vary
depending on what elements are chosen.
Note that more graprucal components can be added to the render model library, if the appropriate renderer is
able to utilise them.
75

5.6.2 Architectural Style
Arch Vis conveys architectural style in the selection and composition of graphical elements. It is the
responsibility of renderers to present architectural style in the approp1iate manner by utilising graphical
elements that conform to the style in use. Possible graphical elements for architectural styles given in section
2.4.1 are shown below (Table 5-7). Note that these are images rendered from 3D models, and their use in
Arch Vis is as a 2D image.
Style Example Graphical Elements
Pipes and filters
Repositories
Layered . - ~- ,:·'. ~~:·..:: -.-.'..
Data Unit
N_.,
T-Session
Presentabon
Application
Object oriented HTTPConnectionHandler
-count: in I -size : inl <<Interface>> • setSod<et() : void EventProcessor I,---, •getSod<el{) : Sod<& I
JJwebservices.http _ -registerProoossor () : VOid +pmcossEvunt{) : m t
Table 5-7 Graphical elements as a representation of architectural style
76
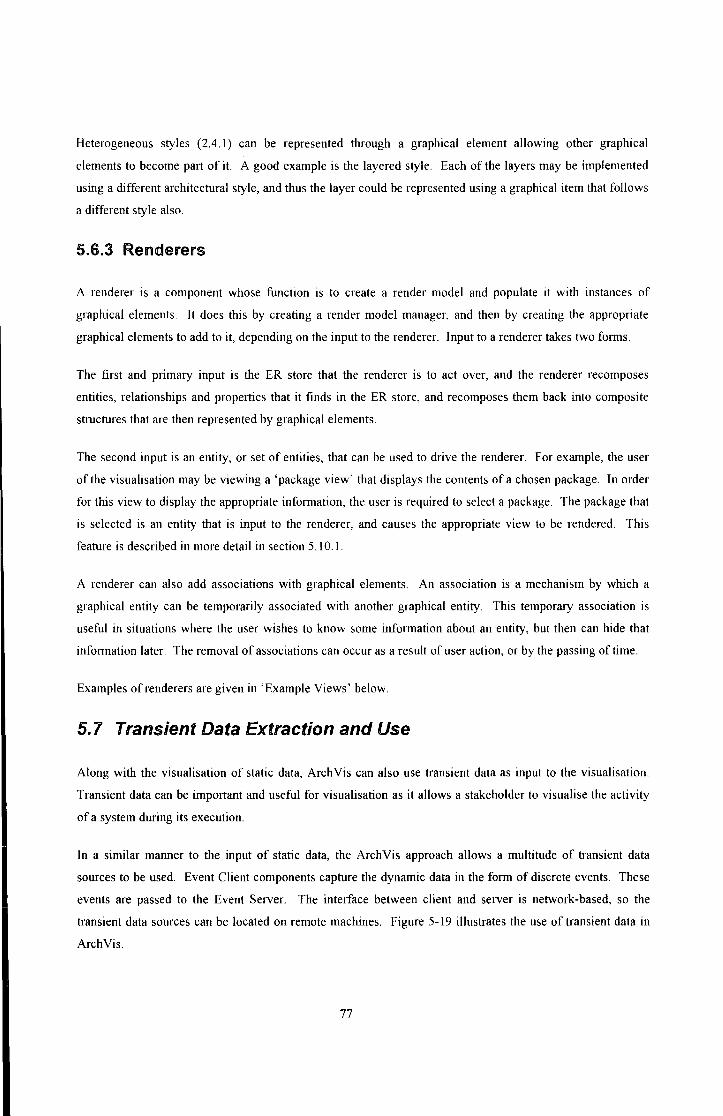
Heterogeneous styles (2.4.1) can be represented through a graphical element allowing other graphical
elements to become pa11 of it. A good example is the layered style. Each of the layers may be implemented
using a different architectural style, and thus the layer could be represented using a graphical item that follows
a different style also.
5.6.3 Renderers
A renderer is a component whose function is to create a render model and populate it with instances of
graphical elements. It does this by creating a render model manager, and then by creating the appropriate
graphical elements to add to it, depending on the input to the renderer. Input to a renderer takes two forms.
The first and p1imary input is the ER store that the renderer is to act over, and the renderer recomposes
entities, relationships and properties that it finds in the ER store, and recomposes them back into composite
structures that are then represented by graphical elements.
The second input is an entity, or set of entities, that can be used to d1ive the renderer. For example, the user
of the visualisation may be viewing a 'package view' that displays the contents of a chosen package. In order
for this view to display the appropriate inf01mation, the user is required to select a package. The package that
is selected is an entity that is input to the renderer, and causes the appropriate view to be rendered. This
feature is described in more detail in section 5.1 0.1.
A renderer can also add associations with graphical elements. An association is a mechanism by which a
graphical entity can be temporarily associated with another graphical entity. This temporary association is
useful in situations where the user wishes to know some information about an entity, but then can hide that
inf01mation later. The removal of associations can occur as a result of user action, or by the passing of time.
Examples of renderers are given in 'Example Views' below.
5. 7 Transient Data Extraction and Use
Along with the visualisation of static data, Arch Vis can also use transient data as input to the visualisation.
Transient data can be irnp011ant and useful for visualisation as it allows a stakeholder to visualise the activity
of a system during its execution.
In a similar manner to the input of static data, the Arch Vis approach allows a multitude of transient data
sources to be used. Event Client components capture the dynamic data in the form of discrete events. These
events are passed to the Event Server. The interface between client and server is network-based, so the
transient data sources can be located on remote machines. Figure 5-19 illustrates the use of transient data in
Arch Vis.
77

Event .......,
E...-. -
r---------------------------------------------
-~ ~ ... l.P'IDI~
I ~--~r~
I I
~~-------------------- -------------------------
-I ,--------------------------------------------- ~ I I I
I I
... _ I I
--------1'---.( I I I I
~--------------------------------------------J
Figure 5-19 Transient data extraction
Each event that the Event Server receives is passed to the Event Processor from where the event is passed on
to each view defined in the visualisation. The visualisation profile defines a number of event mappings that
are supplied to an Event Mapper. When events anive at a view, the view can then request the appropriate
mapping from the Event Mapper, matching on the event type and the entity or relationship type.
Event Mapping components detennine how an element of the RenderModel should be modified in order to
visually represent the event that occuned. For example, an EventMapping object may describe that a failme
event associated with an entity of type 'machine ' should cause the relevant Render Model element to be drawn
with a failure warning icon.
In order to achieve this flexible approach to how to represent transient data events, elements in the
RenderModel must have a set of associated capabilities. These capabilities indicate how the element can be
changed over a petiod of time. Table 5-8 identifies such capabilities.
78

Capabili(v Effects
Label Allows an element to have a label. This label is a string and is positioned
over the top of the underlying element.
Transparency Allows an element to have its transparency set fl-om 0 percent to 100
percent. It also allows for effects over time such as fading out or fading
In.
Flag Allows an image to be overlayed in some position over the element. The
image can be displayed for a fixed period of time if the flag is temporary.
Rotate Allows the element to be rotated around its centre. This rotation can be
to a fixed angle, or the element can be set to spin at a particular speed.
Spinning can be limited to a fixed period of time.
Resize Allows an element to be resized.
Brightness Allows an element to have its btightness multiplied by a fixed amount.
Border Allows an element to have a border set around its edges. The border
width and colour are parameters to this capability.
Table 5-8 Graphical capabilities associated with elements of the render model
Graphical elements will have diffeting capabilities, so a particular visualisation should ensure that
implementations of the EventMapping interface result in the correct requests to graphical elements in the
RenderModel.
5.8 ArchVis Architecture
Arch Vis, like all software has an architecture, and tltis has been described in this chapter. This section
presents an overview of the logical view of the architecture. In this view, the focus is on the major
components in the software and how they are connected to each other.
79
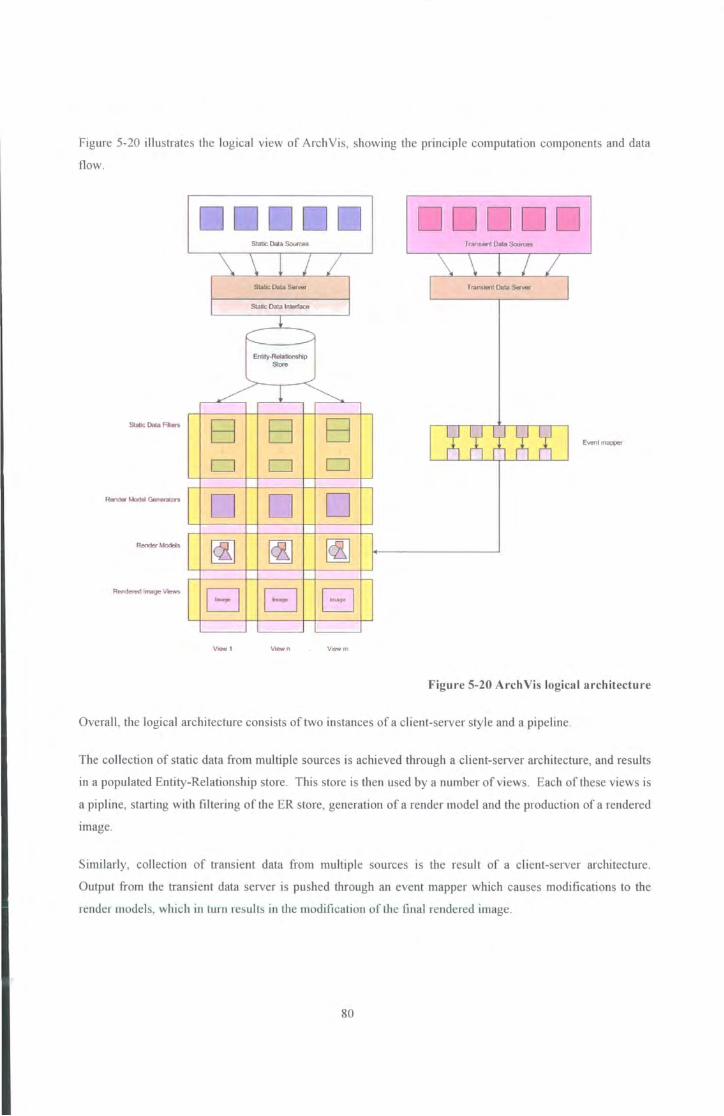
Figure 5-20 illustrates the logical view of ArchYis, showing the principle computation components and data
flow.
DDDDD Trans.ert Oa&a Sources
B B B Ewnt~
D D D
D D D ~ ~ ~
El El EJ V- 1 VteW n Viewm
Figure 5-20 Arch Vis logical architecture
Overall, the logical architecture consists of two instances of a client-server style and a pipeline.
The col lection of static data from multiple sources is achieved through a client-server architecture, and results
in a populated Entity-Relationship store . This store is then used by a number of views. Each of these views is
a pipline, starting with filtering of the ER store, generation of a render model and the production of a rendered
image.
Similarly, collection of transient data from multiple sources is the result of a client-server architecture.
Output from the transient data server is pushed through an event mapper which causes modifications to the
render models, which in turn results in the modification of the final rendered image.
80

5.9 Example Views
The following sections desctibe a set of typical views that may be found in an architectural description .
5.9.1 Component Views
Component vtews provide high-level vtews of the software system. From this high level vtew, the
stakeholder has a broad perspective of the major components and connectors that the system is comprised of
The stakeholders who would use component views would not expect visual complexity to be increased by
using complex graphical representations, so these views would remain simple and clean - using boxes, lines
and other geometric shapes rather than icons and photographic imagery.
Unlike language-level views of a system, component views treat Components and Connectors as fust class
entities. Systems, components, connectors, ports, roles and attachments are the entities that are frequently
used in architectural description languages. The data repository that is used to fonn this view must contain
these entities and other entities that are relevant for this class of view. If an architecture description language
has been used to build the data reposit01y, then the reposit01y would contain these entities. If not, data filters
must be used to f01mulate these entities as required.
Component views are concemed with the high level logical entities . Figure 5-21 shows an online shopping
system being comprised of four fw1ctional components. In this example, the components are represented as
simple boxes with Lines.
Product Browser
Figure 5-21 Online shopping system
These four components are Linked together, indicating a logical relationship. This relationship can be
presented in a nwnber of ways, and architectural style plays an important role here . Figure 5-22 shows the
san1e four components in the same system, but using a ' layered style'.
Product Browser
Shopping Cart
Checkout System
Notifiers
Figure 5-22 Layered style
81
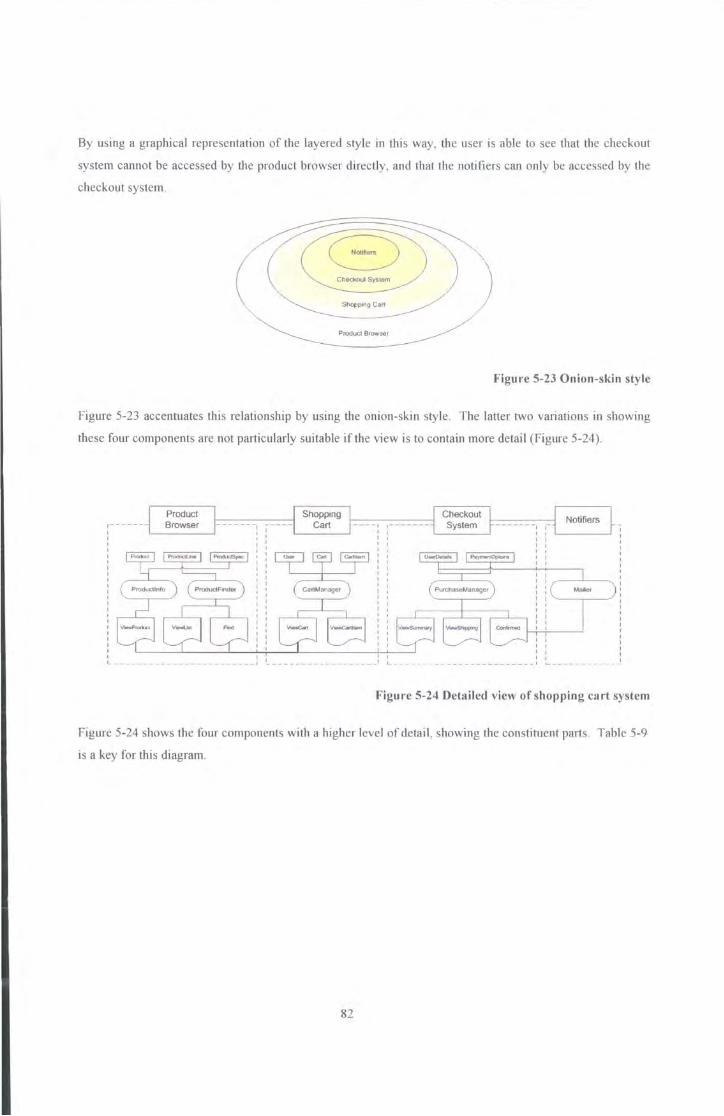
By using a graphical representation of the layered style in this way, the user is able to see that the checkout
system cannot be accessed by the product browser di_rectly, and that the notifiers can only be accessed by the
checkout system.
Product Browser
Figure 5-23 Onion-skin style
Figure 5-23 accentuates this relationship by using the onion-skin style. The latter two variations in showing
these four components are not particularly suitable if the view is to contain more detail (Figw·e 5-24 ).
~ - - - --- - -- - - --1 I I I I I I I I I I I I I I I I I I I I I I I L------------------------1
Figure 5-24 Detailed view of shopping cart system
Figure 5-24 shows the four components with a higher level of detail , showing the constituent parts. Table 5-9
is a key for this diagram.
82

Graphical Element Meaning
~ Product
I Component
Browser
I Product I Entity Bean
( Producllnlo ) Bean
Q JSP
~--------
Component Boundary I I I I I I I I I I ..__- __ __ _ I
Uses relation
Table 5-9 Key of symbols used in component views
In order to generate component views, the ' Pattemfilter' data filter is configured as shown in Table 5-10.
Rule Object Match on Value
Include Entity Entity type Component
Include Entity Entity type Entity Bean
Include Entity Entity type Bean
Include Entity Entity type JSP
Include Relation * *
Table 5-10 PatternFilter configuration for component views
83
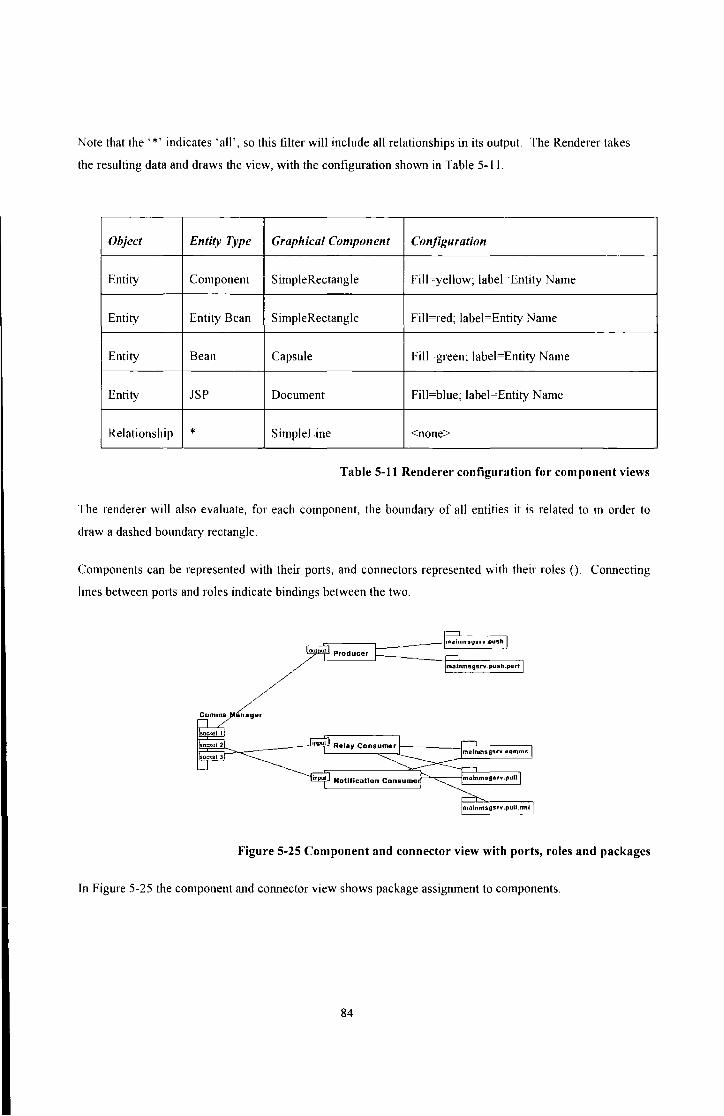
Note that the'*' indicates 'all', so this filter will include all relationships in its output. The Renderer takes
the resulting data and draws the view, with the configuration shown in Table 5-11.
Object Enti(v Type Graphical Component Configuration
Entity Component SimpleRectangle Fill=yellow; label= Entity Name
Entity Entity Bean SimpleRectangle Fill=red; label=Entity Name
Entity Bean Capsule Fill=green; label=Entity Name
Entity JSP Document Fill=blue; label=Entity Name
Relationship * SimpleLine <none>
Table 5-11 Renderer configuration for component views
The renderer will also evaluate, for each component, the boundary of all entities it is related to in order to
draw a dashed boundary rectangle.
Components can be represented with their ports, and connectors represented with their roles (). Connecting
lines between ports and roles indicate bindings between the two.
Comms
Figure 5-25 Component and connector view with ports, roles and packages
In Figure 5-25 the component and connector view shows package assignment to components.
84

5.9.2 Developer Views
The aim of developer view is to provide developers with all the infonnation regarding the software system in
a way that allows them to effectively develop and maintain that software. In many organisations, the UML is
becoming the de facto standard for representing software systems in documentation that developers use.
In developer views, UML static representations can be related back to architectural components. This allows
developers to gain an understanding as to their responsibility within the architecture of the system. Knowing
the impact that a change to a particular method in context of the architecture can be beneficial.
Product Browser
---------------- PurchaseManager -------- - - -- -- -- --- - -
com...company.pd'Chasemanaget
Figure 5-26 UML static model of an architectural component
Figure 5-26 shows a part of a UML static model of an architectural component, showing one bean only. It
indicates that if a change were made to the interfaces or classes within that component, then the architectural
impact can be seen to affect adjacent components directly.
85
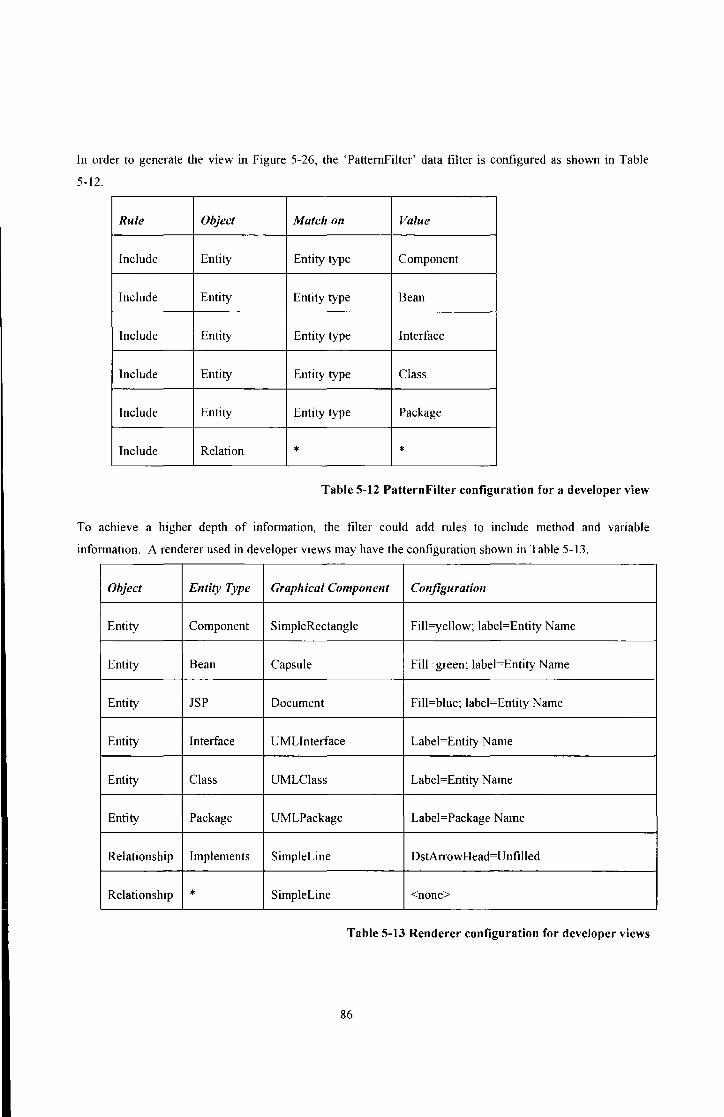
In order to generate the view in Figure 5-26, the 'PatternFilter' data filter is configured as shown in Table
5-12.
Rule Object Match on Value
Include Entity Entity type Component
Include Entity Entity type Bean
Include Entity Entity type Interface
Include Entity Entity type Class
Include Entity Entity type Package
Include Relation * *
Table 5-12 PatternFilter configuration for a developer view
To achieve a higher depth of infmmation, the filter could add rules to include method and variable
information. A renderer used in developer views may have the configuration shown in Table 5-13.
Object Entity Type Graphical Component Configuration
Entity Component SimpleRectangle Fill=yellow; label= Entity Name
Entity Bean Capsule Fill=green; label=Entity Name
Entity JSP Document Fill=blue; label=Entity Name
Entity Interface UMLinterface Label=Entity Name
Entity Class UMLClass Label=Entity Name
Entity Package UMLPackage Label= Package Name
Relationship Implements SimpleLine DstArrowHead=Unfilled
Relationship * SimpleLine <none>
Table 5-13 Renderer configuration for developer views
86
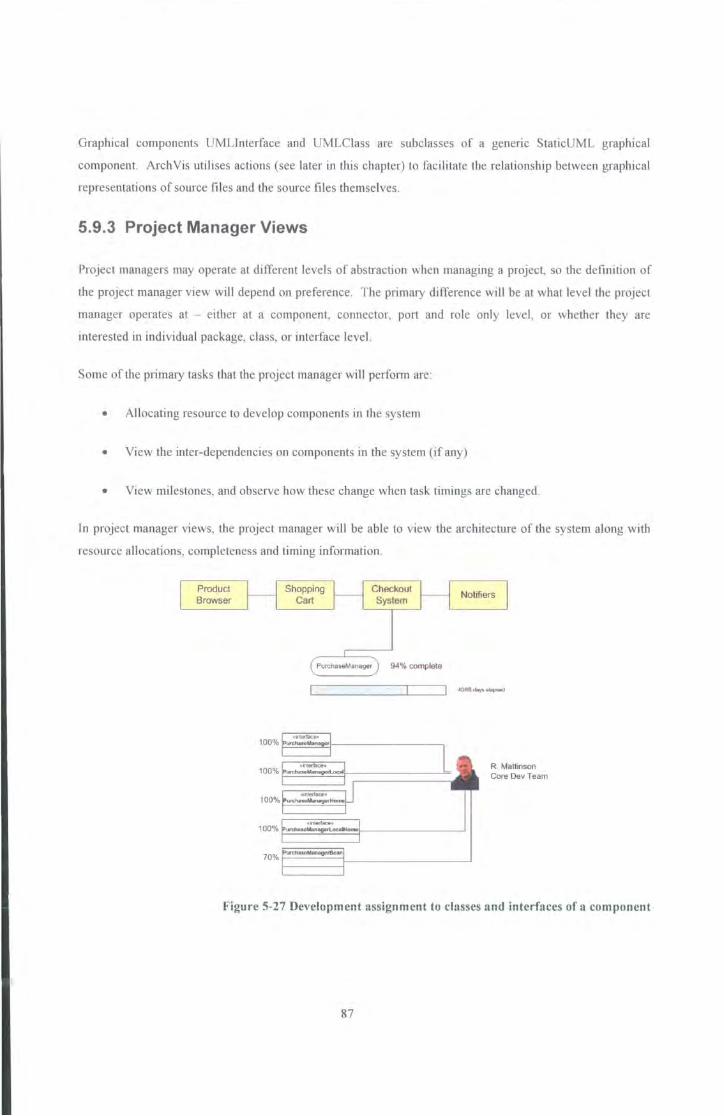
Graphical components UMLintetface and UMLClass are subclasses of a generic StaticUML graphical
component. Arch Vis utilises actions (see later in this chapter) to facilitate the relationship between graphical
representations of source fi les and the sow·ce files themselves.
5.9.3 Project Manager Views
Project managers may operate at different levels of abstraction when managing a project, so the definition of
the project manager view will depend on preference. The primary difference will be at what level the project
manager operates at - either at a component, connector, p01t and role onJy level , or whether they are
interested in individual package, class, or interface level.
Some of the primary tasks that the project manager will perform are:
• Allocating resource to develop components in the system
• View the inter-dependencies on components in the system (if any)
• View milestones, and observe how these change when task timings are changed.
In project manager views, the project manager will be able to view the architecture of the system along with
resource allocations, completeness and timing information.
PurchaseManager 94% complete
R. Maltinson Core Dev Team
Figure 5-27 Development assignment to classes and interfaces of a component
87

Figure 5-27 depicts a project manager view, showing a bean within an architectural component along with
respective completion statistics and closeness to deadline for individual classes, inte1faces, and the bean
component itself.
Rule Object Match on Value
Include Entity Entity type Component
Include Entity Entity type Bean
Include Entity Entity type Interface
Include Entity Entity type Class
Include Entity Entity type Person
Include Relation * *
Table 5-14 Static data filter configuration for project manager views
Table 5-14 shows the rules that the static data filter is configured with in order to make the correct data
available for these views.
88

Object Entity Type Graphical Component Configuration
Entity Component Simple Rectangle Fill=yellow; label= Entity Name
Entity Bean CapsulePM Fill=green; label=Entity Name;
Tag=Entity.property.complete;
Bat=Entity.propetty.stmt +
Entity.propetty.end +Today
Entity Interface UMLinterfacePM Label=Entity Name;
Tag=Entity.property.complete
Entity Class UMLClassPM Label=Entity Name;
Tag=Entity.property.complete
Entity Person LabelledPhoto Photo=namedphoto; Label= Entity Name +
Entity. property. Team
Relationship * SimpleLine <none>
Table 5-15 Renderer configuration for a project manager view
Table 5-15 shows the configuration for the renderer. This utilises graphical elements that have specific
capability for project management (note the use of PM in their name). These elements can take property
values as input in order to generate the appropriate graphical output. In this case, this is percentage complete.
5.9.4 Technology and Deployment Views
The aim of technology and deployment views is to indicate the types of technologies that are used to construct
the system. Stakeholders in this view would include:
• System administrators
• Purchasing department
• Customers
• Network engineers
89

The intention of these views is to indicate how components of the archjtecture are deployed - what operating
systems, virtual machines and software platf01ms are intended for the component or connector. In enterprise
environments, thjs may also extend to the type of network or network fabric, storage system, storage capacity
and physical location.
Client Web
Server Application
t--------1 Server t--------1 Database
10.0.0.":Network 192.168.0.' :Network
Figure 5-28 A physical deployment view
Figure 5-28 is a physical deployment view generated from a static data configuration that is given in Table
5-16.
Rule Object Match on Value
Include Entity Entity type Platform
Include Entity Entity type Macrune
Include Entity Entity type Network
Include Relation * *
Table 5-16 Static data filter configuration for physical deployment views
Tills view considers platforms, machines (computers) and networks to be of primary concern.
90

Object Entity Type Graphical Component Conjigu ration
Entity Platfmm SimpleRectangle Fill=white; label= Entity Name
Entity Machine Labelledlcon Label= Entity Name;
lcon=Entity.property.processorarch
Entity Network Labelledlcon Labei=Entity.property.iprange +Entity Type;
Icon=Entity.property.manufacturer
Relationship * SimpleLine <none>
Table 5-17 Renderer configuration for a physical deployment view
Table 5-17 shows the renderer is configured for a physical deployment view.
Another important aspect of the architecture is the technology used to develop the system. Most of today's
software is built on top of application frameworks, application programming interfaces (APis), platforms and
technologies.
Entity
I Beans
Stateless JSPs Session
Beans
Struts Message
Framework Driven Beans
Figure 5-29 Framework and Technology View
91

Figure 5-29 shows an example of a framework and technology view on the software's architecture - showing
generic interactions between them.
5.9.5 Sales and Marketing Views
Software architecture is often a fundamental aspect of the pre-sales process, with acquirers often wanting to
see how a system will integrate with existing systems and infrastructure. As the sales process is closely
related to the marketing function of a software-producing organisation, diagrams and images used as part of
the sales process are often of very high quality.
Whilst some customers will wish to see much higher levels of detail, this section deals with sales views
intended to give a high graphical quality without a large amount of detail. Other views can be used to present
higher levels of detail to customers.
Machine: Desktop PC Machine: Intel Machine:PowerPC Machine: Intel
Figure 5-30 A technology view
Figure 5-30 illustrates a typical web application structure, showing the interconnections between the major
architectural components along with technology choices. Logos are used here to illustrate the technology
used as brand often plays an impot1ant role in the qualification part of the sales process. This view is a
variation on a view presented in technology and deployment above.
Rule Object Match on Value
Include Entity Entity type Platfmm
Include Entity Entity type Machine
Include Relation * *
Table 5-18 Static data filter configuration for a technology view
92

Table 5-18 shows the data filter configuration required to build this view.
Object Entity Type Graphical Component Configuration
Entity Platform Labelled! con Labei=Entity Name;
Icon=Entity.property.vendor
Entity Machine Labelled! con Label=Entity Name;
I con= Entity. prope1ty. processorarch
Relationship * SimpleLine <none>
Table 5-19 Renderer configuration for a technology view
Table 5-19 shows how the renderer is configured for this view.
5.10Activities
In order to facilitate comprehension of software architecture, a number of activities are supported. Here,
some of the more fundamental activities are desc1ibed.
5.10.1 Querying
Arch Vis que1y support is provided by two mechanisms. The first is by setting the input to a view, a feature
mentioned briefly in section 5.6.3. This mechanism relies on an input selection component that is associated
with a view (Figure 5-31).
93
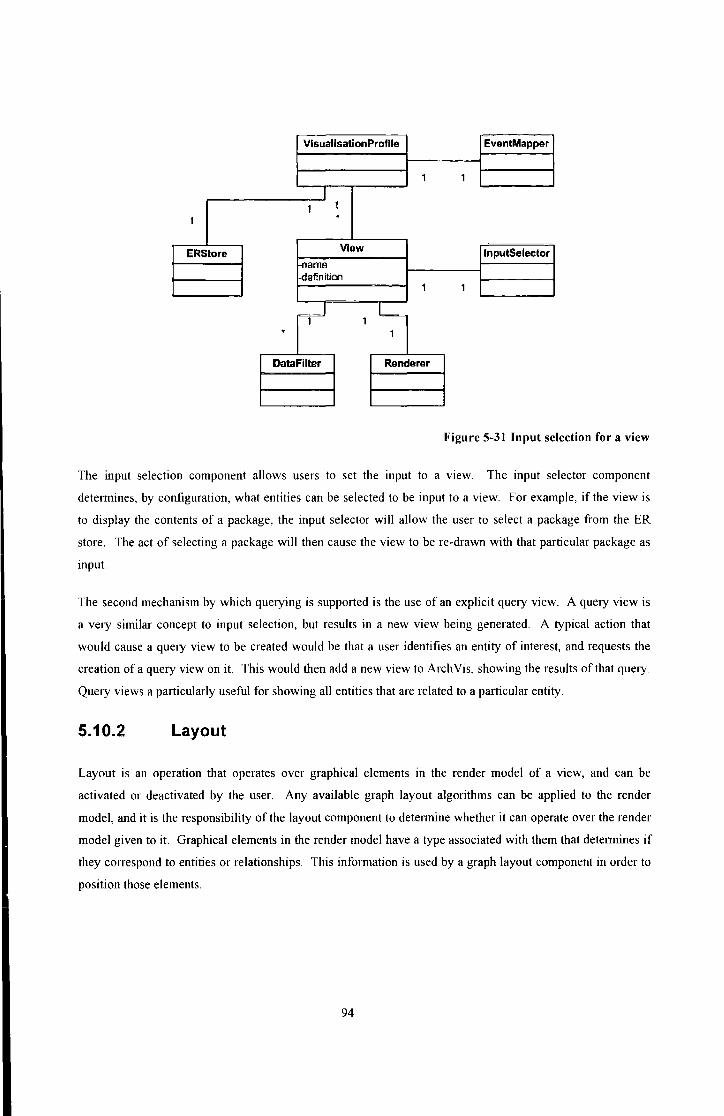
VlsuallsatlonProflla EvantMappar
1 1
I 1 1
1 .
ERStore View lnputSelector f-name !-definition
1 1
~ 1 . 1
DataFIItar Randoror
Figure 5-31 Input selection for a view
The input selection component allows users to set the input to a view. The input selector component
determines, by configuration, what entities can be selected to be input to a view. For example, if the view is
to display the contents of a package, the input selector will allow the user to select a package from the ER
store. The act of selecting a package will then cause the view to be re-drawn with that particular package as
input.
The second mechanism by which que1ying is supp01ted is the use of an explicit que1y view. A query view is
a very similar concept to input selection, but results in a new view being generated. A typical action that
would cause a query view to be created would be that a user identifies an entity of interest, and requests the
creation of a query view on it. This would then add a new view to Arch Vis, showing the results ofthat query.
Query views a patticularly useful for showing all entities that are related to a particular entity.
5.10.2 Layout
Layout is an operation that operates over graphical elements in the render model of a view, and can be
activated or deactivated by the user. Any available graph layout algorithms can be applied to the render
model, and it is the responsibility of the layout component to determine whether it can operate over the render
model given to it. Graphical elements in the render model have a type associated with them that determines if
they correspond to entities or relationships. This information is used by a graph layout component in order to
position those elements.
94

5.10.3 Browsing
Most of the activities that a user will petfotm whilst using the Arch Vis visualisation can be labelled as
browsing. As described earlier, browsing is the assimilation of understanding that is achieved by following
concepts . In the Arch Vis visualisation, a user can browse from one entity to another via relationships that
link them. Visually, this is achieved by the Graphical Components that make up the rendered model , and that
are displayed in the view. For example, an entity linked to another entity by a straight line indicates visually
that the two are linked. Visual browsing is this act of following the relationships that are presented visually.
Figure 5-32 Browsing
Figure 5-32 shows how a user can browse objects in the visualisation by their visual association. A is related
to D, is related to F, is related to G. This relationship is represented very clearly, and the user can ' browse ' to
G by following the visual chain from A.
A second method of browsing is to see a list of all relationships associated with an entity. By enwnerating
this List of relationships, the user can see what entities are linked at the other ends of those relationships .
Another form of enwneration is the list of properties that are associated with the entity or relationship .
Browsing via enwneration is a particularly important activity to support, as defmed views may not present all
the entities related to a particular entity that is the current focus .
95

Figure 5-33 Browsing
Figure 5-33 illustrates this clearly in that entity 1 may not be visible in the current view, but is related to A via
relationship 10.
When an entity is selected as the focus, the Arch Vis visualisation system pe1mits a number of useful browsing
aids. All relationships that contain the currently selected entity can be calculated and presented for the user to
examine. These relationships can be resnicted to only those that appear in the current view, but can also
include all relationships - even from other views.
5.10.4 Searching
Searching is complementary to browsing, and is considered very important by some visualisation researchers
[Sim99]. The search capabilities offered by the Arch Vis visualisation are extensive. Simple searches can be
performed that are based on regular expressions on entity name, entity types, relationship names and
relationship types. As ArchVis uses the entity-relationship model, more complex searches can also be
performed by matching entities and relationships on their properties.
5.10.5 Annotation
Annotating a view IS important when recording hypothesis about understanding. ArchVis separates
annotations from the underlying data model. This is important, as the data model should remain independent
of any visualisations that utilise it in order to allow multiple visualisations of the same data. Therefore,
annotations are stored separately, but are related to the original data source by pointers. When the
visualisation is resumed, annotations are retrieved from a separate data store. When entities, relationships and
properties are selected, the appropriate annotation can be displayed and made available for editing.
96
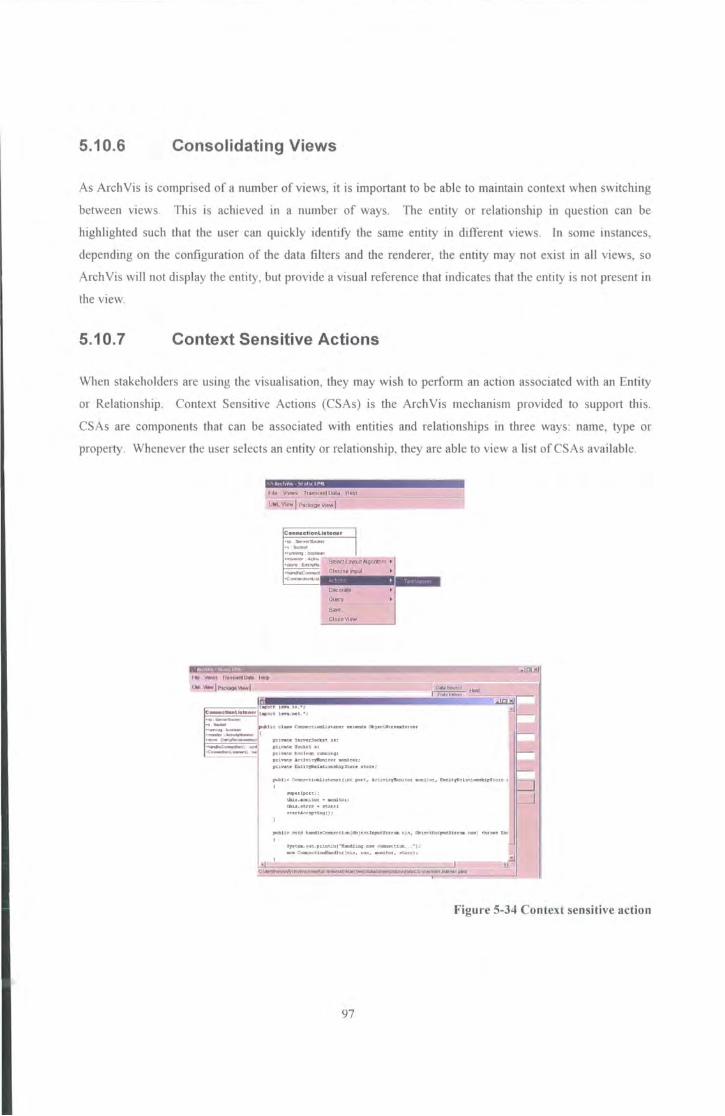
5.10.6 Consolidating Views
As Arch Vis is comprised of a number of views, it is important to be able to maintain context when switching
between views. This is achieved in a number of ways. The entity or relationship in question can be
highlighted such that the user can quickly identify the same entity in different views. In some instances,
depending on the configuration of the data filters and the renderer, the entity may not exist in all views, so
Arch Vis will not display the entity, but provide a visual reference that indicates that the entity is not present in
the view.
5.10.7 Context Sensitive Actions
When stakeholders are using the visualisation, they may wish to perform an action associated with an Entity
or Relationship. Context Sensitive Actions (CSAs) is the Arch Vis mechanism provided to support this.
CSAs are components that can be associated with entities and relationships in three ways: name, type or
property. Whenever the user selects an entity or relationship, they are able to view a bst of CSAs available.
F 'le Views Trinslenl Dal:a Help
UIIILYiew I PackigeVI€'¥1'1
ConneclionUslener
~- I =·~ ::---:-· .._.. EMJ'IfU Sele~:l LayoU!Aigortt.m •
~ Chooselnpul
OM orale
' OLE~ l ::e~~
1~u. J .... lo . •; _..,..u ... - .. ,....[ t 1-a ... t . • : -~----,-......-. (
·-~ -·~·-
pu.,.U SI~I:Sod'.tt. J:s :
pu - t.<l lo.:k~t • :
pd•u: boolt~ t-uu;. l pu-~ kttn~ut MIZllUt:
pu.,.u bne!'llalauoc.5hlp5~cn:e Jt.on :
pWohc ~U.-J.Is~t (U!to po rt., kt.lYlqfigloitor -lt.ot, !aUr.yRdeu-.3bipJ t.ou: t
' thls. aOIII.l.tu t • .mi t.o t : mu .suu:~: • su.re1
Jllllb i U \OOhl )lfnli~U~~r~IObl t~tsut• ou , m.tecDNr.,.-du:t • ~l tlu'~ D:t
' ~t.n,fNt, pd..II.UQ('"Im!U l..l!ll;' lml' ~t:t.-. •.. -J: _. c-ectt~u(oi.:o, - • .-!tor, toU>ttl;
~======~~==~==-=~~~-~
Figure 5-34 Context sensitive action
97
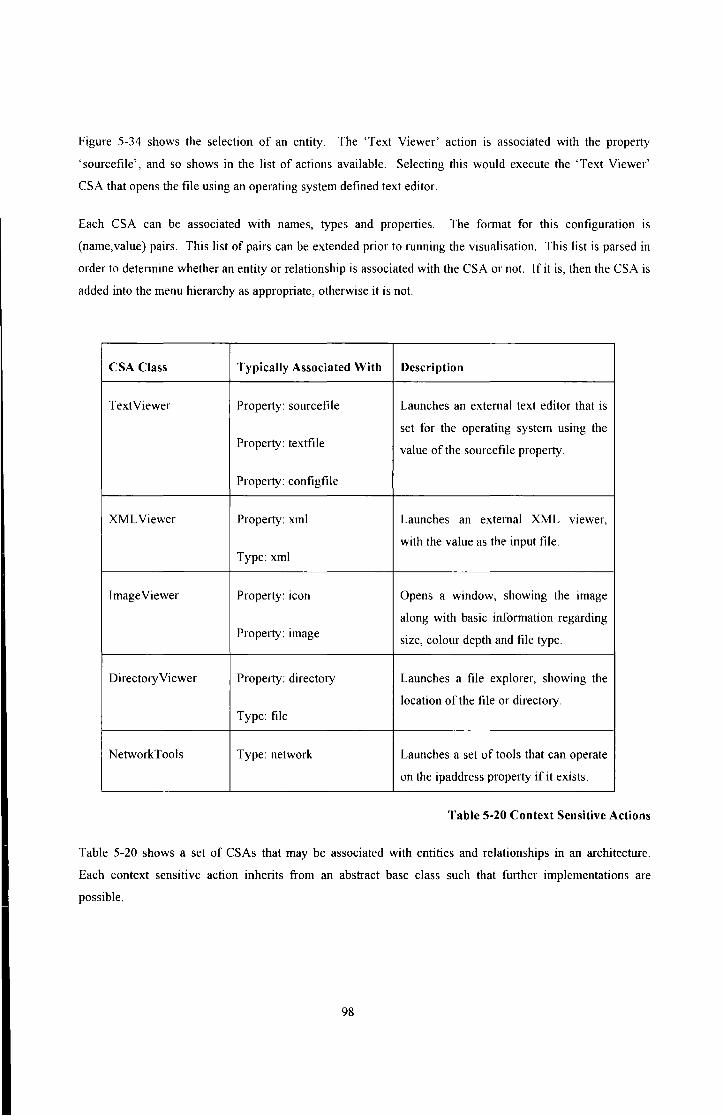
Figure 5-34 shows the selection of an entity. The 'Text Viewer' action is associated with the property
'sourcefile', and so shows in the list of actions available. Selecting this would execute the 'Text Viewer'
CSA that opens the file using an operating system defined text editor.
Each CSA can be associated with names, types and prope1ties. The f01mat for this configuration is
(name, value) pairs. This list of pairs can be extended prior to running the visualisation. This list is parsed in
order to determine whether an entity or relationship is associated with the CSA or not. If it is, then the CSA is
added into the menu hierarchy as appropriate, othe1wise it is not.
CSA Class Typically Associated With Description
Text Viewer Prope1ty: sourcefile Launches an external text editor that is
set for the operating system using the Property: textfile value of the sourcefile property.
Prope1ty: configfile
XMLViewer Property: xml Launches an external XML viewer,
with the value as the input file. Type: xml
Image Viewer Property: icon Opens a window, showing the image
along with basic information regarding Property: image size, colour depth and file type.
Directory Viewer Property: directory Launches a file explorer, showing the
location of the file or direct01y. Type: file
NetworkTools Type: network Launches a set of tools that can operate
on the ipaddress property if it exists.
Table 5-20 Context Sensitive Actions
Table 5-20 shows a set of CSAs that may be associated with entities and relationships in an architecture.
Each context sensitive action inherits from an abstract base class such that fiuther implementations are
possible.
98

5.11 Conclusions
Arch Vis' approach to software architecture visualisation can be delineated into phases. The first phase is the
extraction of appropriate architectural inf01mation. At the beginning of this chapter, the data model was
identified and an approach to data extraction was described. The next phase concerns the filte1ing of data
ready for a renderer. The final phase is for the renderer to produce a render model based on the filtered data
and for that render model to be drawn. This chapter also describes the Arch Vis view model, indicating the
way in which multiple views are defined in a visualisation profile that then determines the behaviour of the
visualisation as a whole. Finally, this chapter describes the operation of Arch Vis at runtime, indicating how a
stakeholder may use the system; how the user can perform essential activities and actions; and how runtime
inf01mation can be represented in the views.
99

Chapter 6: Implementation
100

6.1 Introduction
This chapter deals with the construction of a set of prototype tools that implement the Arch Vis visualisation
system.
6.2 Architectural Data Capture
Several tools were implemented in order to obtain data that relates to software architecture. These tools were
selected to cover those data sources that are commonly used to encode architectural infonnation as well as
providing an impression as the flexibility of the data model. As described earlier, the data model is
represented by the EntityRelationshipStore inte1face, of which three implementations were created. Table 6-1
identifies the purpose of each of the implementations of the Entity RelationshipS tore inte1face.
Class Purpose
EntityRelationshipStoreMySQL Provides a persistent store of architectural
information.
EntityRelationshipStoreMemory Provides a high perfmmance non-persistent store
of architectural information. Primarily used as
output to the application of data filters.
EntityRelationshipStoreManager Provides a wrapper to a persistent store, acting as a
cache and improving pe1f01mance.
Table 6-1 Implementations of the EntityRelationshipStore interface
Many techniques already exist to recover architectural infmmation from data found at lower level of
abstraction. Table 6-2 below shows the level of abstraction that the implemented data capture tools operate
at.
101

Class Abstraction Static/Transient
Arch VisAcmeParser Architecture Description Static
ModelBuilder Design Static
ReflectionParser Implementation Language Static
Properties Reader Software Configuration Static
INIFileReader Software Configuration Static
FileSystemReader Filesystem Static
ArchLog Instrumentation Transient
HTTPCapture Network Transient
ArchVisJDI Class/Method!V a1iable (VM) Transient
Table 6-2 Level of abstraction data extraction tools operate at
All of the static capture tools communicate in a client-se1ver mode of operation, where the server is connected
to an implementation of the EntityRelationshipStore, typically the EntityRelationshipStoreMySQL class.
When the Arch Vis system is to be used in an environment where it is to receive transient data, the Arch Vis
visualisation system opens a server ready for external tool connections.
6.2.1 ArchVisAcmeParser
Architectures described in the Acme language are parsed using the ArchVisAcmeParser tool. It utilises the
AcmeLib, a Java libra1y for the Acme language developed by the ABLE Group at Carnegie Mellon
University (http://www.cs.cmu.edu/~acme). Its operation involves reading an Acme specification, parsing it,
and then traversing the object model and retrieving entities and relationships between Systems, Components,
Connectors, Ports, Roles and Attachments.
102

6.2.2 ModeiBuilder
When a modeller of an architecture wishes to add entities, relationships and their properties to the ER store,
and no other tool will allow them to add them automatically, then they may use the ModeiBuilder. This tool
allows the user to graphically define entities, relationships and properties, and then commit them to the ER
store. This tool was developed in Java using the Swing libraries for the graphical user interface.
6.2.3 ReflectionParser
If source files are not available, then the ReflectionParser tool can be used. This allows classes to be loaded
into the Java vittual machine and inspected using Java's standard reflection package. This package allows the
recovery of information about a class's modifiers, fields, methods, constructors and super-class. It also allows
an interface's constants and method declarations to be recovered, amongst other information.
6.2.4 PropertiesReader
Properties files are frequently used in Java applications for the storage of configuration information, and other
useful runtime vatiables. Propetties files are human-readable ASCII documents that can be read using Java's
Properties class. The PropertiesReader class simply adds key-value pairs to the ER store, relative to the
property file location.
6.2.5 INIFileReader
The IN! file is a Microsoft Windows configuration file that is used in many Windows based applications, and
consists of categorised key-value pairs. The operation of this tool is to parse these files in much the same way
as the PropertiesReader utility, but also retains the categories used.
6.2.6 FileSystemReader
When information regarding the location of files is required, the FileSystemReader can be configured to
locate files that conform to a specific filter. For example, the absolute path of all files that end in .java can be
added to the ER store and then be associated with entities that are derived from it.
6.2.7 ArchVisJDI
Arch VisJDI provides the capability of analysing any Java program during its execution. It is able to do this
by utilising the JDI packages provided as part of the Java language (com.sun.jdi). The tool can be configured
103

to monitor for class loading, method ently and exit, and also for variable changes. When these events occur,
they are passed over the network to the Arch Vis visualisation system for processing.
6.2.8 Archlog
Arch VisJDI represents a relatively non-invasive approach to recovenng runtime information. ArchLog,
however, uses an 'instrumentation' approach to recovering information from software. This requires the
addition of static calls to the sendEvent() method of the ArchLog class. The benefit of this approach is that
arbitrmy events can be sent at any stage of the program's execution. For example, when several objects that
represent a component have been constructed, a 'component constlucted' event can be sent. This overcomes
Arch VisJDI's limitation of sending only predefined types of events.
6.2.9 HTTPCapture
When the visualisation requires information regarding hits on a website, the HTTPCapture tool can be used.
This tool utilises a Jpcap java library developed by Keita Fujii (http://netresearch.ics.uci.edu/kfujii/jpcap/doc/)
that allows Java access to a packet capture native library. The tool will listen on the network for HTTP
requests, and can filter and send these back to Arch Vis for processing in the visualisation.
6.3 Static Data Filter Library
Static data filters, as described earlier, are components that take EntityRelationshipStore objects as their input,
petform some processing, and then output a new EntityRelationsihpStore object. The output is then either
used as input to another static data filter, or used as input to a renderer. Filters are defmed by the classes that
extend the StaticStoreFilter class. Those implemented are listed in Table 6-3.
Class Description
CopyFilter Directly cop1es all entities, relationships and properties from the
source to the destination.
PattemFilter Excludes or includes entities and relationships depending on input
rules. The ruleset defines the global directive to either include as
default or exclude as default. The remaining rules are exceptions to
the global rule.
Table 6-3 Implemented static data filters
104

A discussion on the limitations of these filters is desc1ibed in a later section.
6.4 Renderers
Renderers take an EntityRelationshipStore as its input, and generates a model suitable for rendering, as
managed by the RenderModeiManager class. Table 6-4 lists those renderers that have been implemented.
Class View Category Description
Acme Renderer Component and Generates components and connectors
Connector with connecting lines for attachment
bindings.
PackageRenderer Developer Generates the contents of a package using
UML style graphical elements.
UMLRenderer Developer Generates packages, classes and
interfaces with variables and methods as
required.
TaskAssignmentRenderer Project Manager Generates a VIeW of the assignment of
people to UML entities with progress
statistics.
Simplefilter Generic Generates an icon for each entity, and
draws lines for all relationships.
IconAssigner Sales and Marketing, Generates a suitable icon for each entity,
Technology and depending on rules giVen in its
Deployment configuration. It generates lines for all
relationships.
Table 6-4 Implemented renderers
Two layout algorithms were implemented: a random layout, and a force-directed layout algorithm. No
emphasis was placed on layout alg01ithms.
105

6.5 Arch Vis Prototype Implementation
The prototype tool was written in Java, utilising features of the Java Standard Developers Kit version 1.4.
Arch Vis is entirely wTitten in Java and is comprised of eight implementation areas:
• Entity-relationship and properties storage system.
• Client-server system for static data extraction.
• Client-server system for transient data events.
• Visualisation profile and view creation.
• Static data extractors
• Static data filters
• Renderers
• Suppmting UI framework.
Much of the basic user interface was implemented using the Java Swing libra1ies, but the visualisations were
created using graphics primitives such as Bufferedlmage and Graphics2D on JPanel objects.
6.6 Use of the Prototype Tools
There are several tools associated with this visualisation system. This section briefly desc1ibes how to use
each of the tools.
6.6.1 Static Data Server
The static data server is very simple to operate, it simply takes as arguments the location and authentication
infmmation for the mysql database to be populated, for example:
java net. and.rewhatch .archvis. qui. staticserver. StaticDataServer jdbc :mysql: / /localhost: 3306/archvis root mysql
This launches the server with an activity monitor graph. (Figure 6-1 ).
l06

"' "' At chVts Store Set ver ' ....
Status:
Figure 6-1 Static data server activity monitor
The graph gives an impression as to the frequency by which objects are being added to the store.
6.6.2 Modeller
The Modeller is a utility that will allow a user to add a set of entities and relationships to a database. It has
two modes of operation: add entity or add relationship. Clicking in the canvas will allow the creation of the
entity or relationship - single click to add an entity, or click and drag between two entities to create a
relationship.
Name
~trutsFrameworl< Type
ll&chnolgo~
~~
Figure 6-2 Arch Vis modeller
Figure 6-2 shows an entity being created. Once the model is complete, the 'Save Model' will add the entities
and relationships to data source that was selected on the command line.
6.6.3 ArchVis Browser
The Arch Vis Browser is the tool that actually generates the visualisation views, and displays the resulting
rendered displays to the user. Its operation is simple.
107

Dataoase
Figure 6-3 Arch Vis browser
Firstly, select File->Open (Figure 6-3)
------ ---
.d.gj2!] F1le Help
Data Source Host
OataFihers (icalhoat Renderer _______J
Selecton Port
~306 Database
~rtlwts ~ User
fOOi
-r:El Password
fTIYiql Select
I Connect
~~ Oasconnect I
Figure 6-4 Arch Vis browser's visualisation profiles
And then choose from the list of visualisation profiles defmed (Figure 6-4). These visualisation profiles are
configured in via text files located in the 'Profiles ' directory of the Arch Vis Browser directory.
108

Figure 6-5 Arch Vis rendered view
Thjs will then create the view windows, and the visualisation is ready for the data to be input. Clicking on the
'Connect' button within the Data Source tab wilt load the data and pass it through the filters in each view.
The views can be selected using the tabs on the upper pmtion of the display . The resulting rendered view is
shown in the centre (Figure 6-5).
6. 7 Conclusions
This chapter has presented some of the implementation detail of the components that comp1ise the Arch Vis
software arcrutecture visualisation system. Tills chapter also describes some of the llinitations of the
implementation. Finally, the chapter has illustrated how some of the prototype tools can be used.
109

Chapter 7: Evaluation Approach
110

7. 1 Introduction
In order to successfully evaluate this thesis, an approach to evaluation is required. As this research is strongly
related to software visualisation, this chapter describes some of the strategies that are used in software
visualisation. Following tllis, the chosen evaluation strategy is given. The evaluation strategy chosen in this
chapter is then applied in chapter 8.
7.2 Software Visualisation Evaluation Strategies
There are several strategies adopted when evaluating software visualisations. This section identifies five
strategies, giving an overview of how they can be used [HatchO I].
7.2.1 Design Guidelines
When a visualisation approach is evaluated, a set of design guidelines may sometimes be produced. These
guidelines indicate important issues that the visualisation has uncovered. Guidelines are typically informal
statements about aspects of a field of visualisation that are intended to assist further research. Formal feature
based evaluation frameworks also have a tendency to be used as design guidelines.
These informal statements promote reasoning about aspects of the visualisation in order to quickly detennine
their value in a new visualisation system. For example, guidelines can identifY the relative merit of cognitive
issues that the visualisation raises, navigation support, performance requirements and so on. This early stage
evaluation that guidelines support helps to filter out the development of bad ideas early on in their inception
and can therefore lead to more efficient development of visualisation ideas.
A mis-use of design guidelines is to use them as an evaluation framework in the analysis of a visualisation.
The primary use of design guidelines is to help in early stage evaluation, not for complete evaluation of the
fully developed visualisation. Application of guidelines as an evaluation framework may lead to self
measurement in that the system is being designed against the evaluation, rather than the original requirements.
Guidelines are often open-ended and are designed to be applicable in a broad sense, and evaluating against
them can lead to problems. Consider Shneiderman's relate proper1y [Shneiderman98] that states that the
visualisation should be able to "view relationships among items". This statement can be taken in a very broad
sense and applied to any number of visualisation functions. Further, by taking guidelines out of context and
applying them in areas to which they are unsuited an evaluation can also be enoneous. Whilst there is not a
lll
problem in demonstrating that a visualisation adheres to good guidelines, it should not be presented as an
evaluation, especially in the cases where the guidelines are generic and open to differing interpretations.
Identifying areas in which guidelines are used as e.valuations can help in identifying where there is a lack of
evaluation frameworks. It is important that the research community develops new guidelines to address this
deficiency, especially where new branches of software visualisation are emerging. Guidelines do exist for
information visualisation as a whole, but it is useful to have specific task-related guidelines.
7.2.2 Feature-Based Evaluation Frameworks
Feature-based evaluations frameworks are popular evaluation strategies. Perhaps a key driver for their
success is the ease by which they can be applied. Feature-based frameworks often take on the f01m of
multiple-choice questions which can be answered comparatively quickly. The application of an evaluation
framework imposes no prerequisites on infrastmcture or target system [Kitchenham96] and allow for
evaluation of a system at multiple levels of detail. Frameworks therefore facilitate an evaluation capability
with low overhead and investment.
Despite the simplicity of applying a feature-based framework, there are problems inherent in this style of
evaluation. Here, the style of question used is of critical importance. Framework questions that result in
simple 'yes' or 'no' answers may be too open ended. For example, Storey et al. [Storey99] suggests that a
visualisation should 'indicate maintainer's current focus'. It is easy to argue that the current focus could
always be the object at the centre of the screen, despite this not being the original intention of the question.
Further, a question to be answered on a sliding scale may then become too subjective. This can introduce
subtle problem in some aspects of evaluation. What may happen is that the answer to the question can depend
very much on the experience that the user has had with similar visualisations. For example, the answer to a
question asking whether a three-dimensional visualisation was easy to navigate would depend greatly on the
previous experience that the user had working within such environments. Finally, some questions are simply
too vague to be answered accurately. An illustration of this is where Wiss and Carr [Wiss98] asked users
whether a visualisation was simply 'good' and 'easy to use' where the required response was on a defined
sliding scale.
Current frameworks also fail to consider 'negative features' - unwanted features within the visualisation that
have a detrimental effect overall, such as those considered by Globus and Uselton [Globus95]. Gestalt effects
are significant, and can distort the mental view that the user has of the visualised data. Similar distortions may
arise through the use of animation, colour, size and many other features. Failure to consider such features
when evaluating using a framework can lead some visualisations to be considered acceptable, when they are
fundamentally flawed in practice. Other important features currently not covered by most frameworks include
issues of scalability and accuracy. Many current frameworks do not consider aspects highlighted by Tufte
112

[Tufte92], such as complexity, density and beauty. If these properties are important to the visualisation then
other methods of evaluation such as guidelines or user study should be used.
7.2.3 User and Empirical Studies
Empirical studies are often sought after by researchers in the software engineering community in order to
provide hard evidence to support hypotheses. The strength of empirical studies is the resulting statistical
analysis of data collected during the study. There are instances of the successful application of empi1ical
studies to infmmation visualisation, but there are comparatively few good attempts at their use for evaluation
of software visualisation. Where empirical studies have strength is in situations where time-based
measurements are important. Statements such as 'the use of the visualisation enables the task to be completed
in one third of the time taken to complete the task without the visualisation'. Statements like these lend
themselves to statistical analysis rather than statements that describe properties of a visualisation such as 'it
allows the user to maintain focus and context'.
User studies can be caiTied out independently or as pa1t of an empirical study. By using questionnaires and
user observations, user studies record individual and collective user-experience, as applied by Storey et al.
[Storey99] for example. These kinds of studies are useful in contrast to empirical studies with users as they
highlight individual issues that might be overlooked when combining results of a number of users.
Nevertheless care must be taken in generalising individual user-experience.
User studies and empirical studies reduce the bias of self-evaluation at the expense of overheads such as user
training. Lack of training for pruticipants in the evaluation can produce results that are confounded. Other
influences cause confounding in results of which user experience is significant. Differences in the knowledge
of a domain, familiarity with the task at hand, and environmental knowledge have significant effects on
experimental results. Users often bring bias to visualisations, especially when they are based on 3D interfaces
where the ability to leam, openness to new interfaces and spatial awareness can all make some impact on
results. Common sources of eiTor lie with the type and scale of tasks being set, and also subject selection
problems. For example, students are frequently used in studies rather than experienced programmers for the
SV domain. A critical mistake is to then generalise the results of the study beyond the experimental
conditions. Applying results from student-based studies to professional programmers and applying results
from academic environment-based studies to industrial organisations is not an appropriate step. In order to
counteract the problems highlighted here and conduct a successful study, considerable investment in time and
organisation is required. This can make such studies unattractive for some situations, particularly small or
short-term projects.
A pre-requisite of the application of user studies and empirical studies is a partial or full implementation of
the visualisation system- evaluation of a concept is difficult for these evaluation strategies.
113

7 .2.4 Scenarios and Walkthroughs
Scenarios and walkthroughs provide a showcase for the demonstration of features of a visualisation and are
becoming a useful tool in evaluation [Chi98] [KnightOO] [Smith02]. A walkthrough takes the reader through
a particular aspect of the visualisation, and leaves the evaluation of the system to the reader. By doing this, it
evaluation is conducted in terms of the reader's own experiences and requirements. Results of this reader
centric type of evaluation cannot be generalised. For this reason other methods of evaluation are presented.
For example, work by Knight [KnightOO] shows how information on determining the impact of a change to
the type of a class variable can be found in the Software World visualisation, alongside a feature-based
evaluation framework.
As with any evaluation strategy, scenarios and walkthroughs have their relative merits along with problems.
They do offer a more concrete example of how a visualisation system is used for a particular task and does so
in a more natural way than describing a visualisation in terms of its mappings, metaphors and representations.
They often include many screenshots as evidence, giving the reader an overview of the visualisation's user
interface, technology and visual quality. As noted previously, results of this evaluation technique are
applicable only to the individual readers. This individual evaluation cannot be propagated back to the wider
research community.
Scemuios and walkthrough's visual presentation is primarily a stmyboard of images that can provide the user
with a visual impression of the system, but it is still very difficult for the reader to gain a feel for issues such
as navigation. This is especially true in 3D visualisations. Scenarios and walkthroughs can illustrate aspects
of the visualisation in more detail than frameworks, however, the features demonstrated will often only show
the visualisation in a positive light, highlighting well supported tasks with favourable data and conditions.
Scenarios and walkthroughs should not be the primmy focus of an evaluation, due to the large possibility of
bias by the researcher, and the limited subset of the visualisation demonstrated. However, they are relatively
easy to produce and can offer a way to check the visualisation, from the initial idea to the fmal visualisation,
against support for required tasks.
Future effort could be invested in increasing the use of specific tasks by basing task selection on research into
information requirements for specific activities, such as those on program comprehension by Mayrhauser and
Vans [Mayrhauser98]. These requirements can then be verified more appropiiately than by using a
framework, as scenmios and walkthroughs show the process by which the information can be found, which
can be just as important as showing that it is actually present.
114
7.3 Chosen Evaluation Approach
Earlier in the chapter, four evaluation strategies were described. Design guidelines are not intended for post
development evaluation, but for use during the visualisation design process. User and empirical studies are
difficult to perfonn with limited time and resource and are more suited to numerical measurement of various
aspects of a visualisation. For these reasons, an empirical approach has not been taken here.
Therefore, the evaluation of this thesis will be divided into three approaches. Firstly, there will be a feature
based evaluation framework that extends existing evaluation frameworks that are more applicable to lower
level software visualisation. Secondly, there are to be a set of scenarios that are applicable to the domain.
Lastly, there is an infmmal discussion of the benefits and disadvantages of the Arch Vis visualisation.
7.3.1 Evaluation Framework
7 .3.1.1 Justification for the Evaluation Framework
As software architecture visualisation is in its infancy, specific reference to it in existing software
visualisation literature is scarce. Evaluation of visualisations from the viewpoint of program comprehension
cannot suffice for higher-level representations of software where the task to be supported is radically
different. For these reasons, this chapter has several goals.
Reading literature that introduces new visualisations for software, frequently the choice is either for empirical
evaluation involving participants, or the invention of a new framework against which the visualisation is
evaluated. A new framework is required when considering the evaluation of visualisations that explicitly
address software at an architectural level. As identified previously, most software visualisation has occurred
at a lower level and as an obvious result the evaluation frameworks available reflect this. Many of the major
frameworks that have been used to evaluate software visualisations were not directly applicable to software
architecture visualisation as they address different problems. They do, however, capture several aspects of
visualisation that are directly applicable to software architecture visualisation.
Whilst the framework described here is new, it is not without a strong basis, as software architechrre
visualisation evaluation is rooted in disciplines with a history of evaluation frameworks, some of which draw
on earlier work on related work in software visualisation, psychology, aesthetics and usability. Where
applicable, the framework identifies previous work that has contributed to the respective component of the
framework.
By breaking down an evaluation framework into the structure proposed below gives benefits and
disadvantages. A modular structure allows individual concerns to be addressed in comparative isolation, and
115

so the application of the framework need not be perfonned in its entirety. Guidelines are presented which
direct the use of the framework and oversee the selection of framework components. A downside to this
stmcture is that such a rigid division causes areas to be strictly divided when they might otherwise not be. As
far as possible, these are identified in the description of the evaluation components themselves.
Some instances of evaluation in software visualisation literature make no attempt to evaluate the
implementation of a visualisation, but focus on the visualisation itself On the smface, it appears that this
approach results in the ability to reason about a visualisation without binding that visualisation to a particular
implementation which might not fully support all the concepts, ideas and features identified in the
visualisation concept. Clearly this has some benefit, but here the framework also considers implementation.
One reason for this is that some prope1ties of a visualisation can be better reasoned about in tenns of its
implementation. Secondly, the line that divides a visualisation from its implementation often becomes bluny,
even in evaluations that attempt to keep the division distinct.
7.3.1.2 Description of the Evaluation Framework
The proposed framework is divided into seven sections: static representation, dynamic representation, data
space navigation, interaction, task support, implementation and visualisation. In this way, the framework
segments distinct concerns.
l 16

Refere,ce . Framew()rk Feature
Static Representation (SR)
SRI Multiple software architectures
SR2 Types of software architecture
SR3 Recovery of software architecture information
SR4 Accommodate large volumes of information
Dynamic Representation (DR)
DRI Support dynamic data
DR2 Associate events with architectural elements
DR3 Non invasive approaches
DR4 Live collection
DRS Replay data
Views (V}
VI Multiple views
V2 Representation of viewpoint definition
Navigation and Interaction (NI)
Nil Browsing
N12 Searching
Nl3 Query building
NI4 Inter-view navigation
NIS View navigation
Task Support (TS)
TSI Represent anomalies
TS2 Comprehension
TS3 Annotation
TS4 Communication
TSS Show evolution
TS6 Construction
TS7 Planning and execution
TS8 Evaluation
TS9 Comparison
TSIO Show rationale
lmp/ementation (I)
II Automatic generation
12 Platform dependence
13 Multiple users
Visualisation (VN)
VNI High fidelity and completeness
VN2 Dynamically changing architecture
Table 7-1 Summary of evaluation framework
117

Table 7-1 presents a summary of the evaluation framework. Each section of the framework is presented
below, showing the questions that they are composed of along with further information regarding the
semantics of the question.
Static Representation (SR)
SRI: Does the visualisation support a multitude of software architectures?
It is possible that a visualisation system will be restricted to a small number of possible architectures. For
example, the architecture visualisation may be designed explicitly for a particular subclass or domain of
software architectures. It is important to recognise that a visualisation need not support a multitude of
software architectures if that is not the intention of the visualisation. This question merely qualifies the intent.
This question relates directly to P1ice eta! [Price93] and the discussion on 'generality'.
SR2: Does the visualisation support the appropriate types of static software architecture data sources?
In some cases, the software architecture is clearly defined, and a single data source exists from which the
visualisation can take its input. The visualisation should be capable of accessing the data source.
Sometimes architectural data often does not reside in a single location. Instead, architectural infmmation can
be extracted from a multitude of sources. An architecture visualisation would benefit from the ability to
suppmt the recovery of data from a number of disparate sources. More importantly, if multiple data sources
can be used, then there should be a mechanism for ensuring that this disparate data can be consolidated into a
meaningful model for the visualisation.
SR3: Does the visualisation support the recovery of architectural information from sources that are not
directly architectural?
In some cases, architectural infmmation is not available directly, but is recovered from sources that are non
architectural. For example, file-systems may not be directly architecturally related, but they can contain
important information that relates to architecture. Even more so, packages, classes, methods and variables
can all contribute to a view of the software architecture, and so a visualisation system may be able to support
these data types.
SR4: Can the visualisation accommodate large amounts of architectural data?
Depending on the size and level of detail of a software system, there is a potential for large volumes of
architectural data. If architectural data is to be retrieved from non-architectural data (see later), there is a
potential for the data repository to contain large amounts of data from lower levels of abstraction.
Architectural information is sometimes recovered from method and variable information. If this is the
118

strategy employed by the visualisation, then the visualisation should be able to deal with large volumes of
infotmation. Price eta/ [Ptice93] discusses this in their section on 'scalability'. Visualisation systems should
be able to cope with large volumes of data and have the appropriate mechanisms to be able to present this in a
suitable manner.
Dynamic Representation (DR)
DRJ: Does the visualisation support an appropriate set of dynamic data sources?
The realisation of software architecture is at runtime, and runtime information can indicate a number of
aspects of the software architecture. Visualisations may support the collection of runtime infonnation from
dynamic data sources in order to relay runtime infonnation. Typically, for smaller software systems, this
runtime inf01mation will only be available from one source, but for larger distributed software systems, the
visualisation may need the capability of recovering data from a number of different sources. These data
sources may not reside on the same machine as the visualisation system, so the ability to use remote dynamic
data sources is useful. Some sources may produce data of one type, where another source produces different
data. In this case, the visualisation should provide a mechanism by which this data is made coherent.
DR2: Does the visualisation support association of dynamic events with elements of the software
architecture during the execution of the software?
When dynamic events occur, the visualisation should be able to display these events appropriately, and within
the context of the architecture. The visualisation must therefore be able to associate incoming events with
architectural entities.
DR3: Does the visualisation support relatively non-invasive approaches to retrieving dynamic data
sources?
Any method of recovering dynamic information from a software system will affect that software system in
some way. This thesis has identified a number of mechanisms for recovering this data. At one extreme, there
is the directly invasive approach of adding lines to the software source code. At the other extreme is by
retrieving information from the vittual machine. The visualisation system should support a suitable approach
to recovery of dynamic architecture data in the least-invasive way as Price eta/ [Price93] state that disruptive
behaviour is not desirable.
DR4: Does the visualisation allow the live collection of dynamic data?
By visualising the dynamic data as it is generated, there may be an ability to affect the software being
visualised in order to see the generated data live. This is a popular method ofvisualising dynamic data.
119

DRS: Does the visualisation allow the collection of dynamic data for replay at a later time?
Sometimes called 'post mortem style' visualisation [Price93], this approach has the benefit of knowing the
period of time over which the visualisation occurs. This is useful to a visualisation in that it can render a
display for a particular instance in time whilst knowing what will occur next.
Views (V)
Vl: Does the visualisation allow for multiple views of the software architecture?
Research in software architecture indicates a general consensus that software architecture is represented in a
number of ways. These are called views of the architecture. Kruchten [Kruchten95] identifies four specific
views of software architecture, whereas the IEEE 14 71 [IEEE 14 71] standard allows for the definition of an
arbitrary number of views. A visualisation may support the creation of a number of views of the software
architecture, and may wish to allow simultaneous access to these views.
V2: Does the visualisation display a representation of the viewpoint definition?
In the IEEE 1471 standard [IEEEI47l], architectural views have viewpoints associated with them. A
viewpoint defines a number of impm1ant aspects about that view including the stakeholders and concerns that
are addressed by that viewpoint, along with the language, modelling techniques and analytical methods used
in constructing the view based on that viewpoint. A visualisation may choose to make this infmmation
available to the user in order to assist in their understanding of the view they are using.
Navigation and Interaction (NI)
Nll: Can users browse through the visualisation by following concepts?
An impmtant part of the comprehension process if the formulation of relationships between concepts. Having
the ability to follow these relationships is fundamental. Storey et a/ [Storey99] indicate that a software
visualisation system should provide directional navigation, and desc1ibe this as supporting the traversing of
software structure in hierarchical abstractions and by allowing the user to follow links in the software. The
visualisation should support the user being able to follow concepts in order to gain an understanding of the
software architecture.
N/2: Can users search for arbitrary information relating to tlte architecture?
Another mechanism in the comprehension process is the arbitrary location of information. Searching is the
data-space navigation process that allows the user to locate information with respect to a set of crite1ia.
Storey et al label this as arbitrary navigation - being able to move to a location that is not necessarily
120

reachable by direct links. Sim eta/ [Sim99] identifies the need for searching architectures for information, so
the visualisation should support this searching for arbitrmy information.
N/3: Can the user build queries in order to locate information they need?
Query building is a hybrid combination of browsing and searching. It allows a user to find a set of
information, and then continually expand on a search in a particular direction by repeated searching from a
related result. Visualisations may also support this style of data-space navigation.
N/4: Can users navigate between views easily?
Architecture is often comprised of a number of views. Moving between views is essential in order to
understand an architecture from different viewpoints. Context should also be maintained when switching
between views so as to reduce disorientation.
N/5: Can users navigate through a view in an appropriate manner?
Along with data-space navigation, the movement within a view is also important. Shneiderman's mantra for
visualisation is overview first, zoom and filter, and then show details on demand [Shneiderman98]. A
visualisation system should support this strategy for visualising infmmation. Also, the visualisation should
allow the user to move around so as to focus on and see the information they are looking for. Typical
navigational support would be pan and zoom. Whilst allowing the user to navigate, the visualisation should
provide orientation clues in order to reduce disorientation [Storey99].
Task Support (TS)
TSJ: Does the visualisation support tire representation of anomalies?
This question relates to whether the visualisation be used to identifY areas in which the architecture has been
broken or misused. The visualisation should be able to cope with data anomalies that are unexpected and may
cause unwanted behaviour. Also, the visualisation may wish to repmt these anomalies to the user if they can
be detected.
TS2: Does tire visualisation support tire comprehension of the software architecture in tire appropriate
manner?
Comprehension strategies are task dependent. For example, top-down comprehension might be associated
with a design change task, whereas a bottom-up comprehension task is associated with gaining an
understanding of unfamiliar components before making a change. Architecture visualisations may suppmt
121

either of these two strategies, or a combination of the two, depending on the tasks for which the visualisation
is intended.
TS3: Can users annotate the visualisation?
The ability to tag graphical elements in a visualisation is important for various activities. Adding notes to a
graphical element is called 'annotation'. Annotation can allow users to tag entities with information during
the formulation of a hypothesis.
TS4: Does the visualisation support the communication of the architecture to the appropriate
stakeholders?
Software systems have a number of associated stakeholders [IEEE1471]. Visualisations can suppmt any
number of these stakeholders. In order to facilitate the communication of the architecture to a stakeholder, the
visualisation must represent the architecture in a suitable manner. Stakeholders may require very different
views from other stakeholders.
TS5: Does the visualisation show the evolution of the software architecture?
Software architecture can evolve over time. Subsystems may be redesigned; components replaced, new
components added, new connectors added and so on. An architecture visualisation may provide a facility to
show the evolution. This suppmt may be basic, showing architectural snapshots, or the support may be more
advanced by illustration using animation.
TS6: Does the visualisation support the construction of software architecture?
Visualisations may offer the capability for the users to create, edit and delete objects in the visualisation.
When the visual editing is supported, the visualisation can be called a 'visual editor'. In order to be able to
fully support the constmction of software architecture, the visualisation must be able to allow the user to
create objects in the domain of the supported viewpoint. Of course, the visualisation should also then support
the editing and deleting of those objects.
TS7: Can the visualisation support planning and then e..wcuting the development of a software system?
Architectural desc1iptions can be used for the planning, managing and execution of software development
[IEEE 14 71]. In order for the visualisation to support this task, it should provide mdirnentary functionality of
a project management tool -or have the ability to commtmicate with an existing project management tool.
122

TS8: Does the visualisation support evaluation of the architecture?
Software architecture evaluation allows the architects and designers to detennine the quality of the software
architecture and to predict the quality of the software that conforms to the architecture description
[IEEE1471). To supp011 this, a visualisation should have some mechanism by which quality descriptions can
be associated with components of the software being visualised.
TS9: Does the visualisation support the comparison of software architectures?
A typical use of software visualisation is in the compa1ison of as-implemented with as-designed architecture.
The visualisation should be able to support the display of these two architectures and allow users to make
meaningful comparisons between them. Software built from a software product line is a typical scena1io
where comparison of architectures is particularly useful.
TS10: Does the visualisation allow for rationale to be shown?
Rationale for the selection of architecture, and the selection of the individual architectures of the components
of that architecture, are included in architectural descriptions. Rationale can also be associated with each
viewpoint of an architecture. By showing rationale for elements of the architecture, and the architecture as a
whole, a visualisation will allow a user to have an insight into the decision making process. This detail will
be useful for some tasks.
Implementation (I)
11: Can the visualisation be generated automatically?
Some visualisations are demonstrable theoretically, but are pragmatically infeasible. Visualisations, in order
to find use, need to be able to be generated automatically.
12: Can the visualisation be run on appropriate platforms?
Price et al [Price93) include a 'generality' section in their taxonomy. Here, they identify several issues
regarding the platform on which a visualisation can execute on, and the types of software that it will be able to
operate over. A visualisation should be able to execute on a platform suitable for the types of software it is
intended to visualise. For example, a visualisation that is implemented for a particular platform is unsuitable
for visualising programs written for another platfmm.
123
13: Does the visualisation support multiple users?
As there are many stakeholder roles in a software system, there may also be a one-to-one mapping of role to
physical users. Therefore the visualisation may support multiple users. It may support multiple users
concunently, or asynchronously.
Visualisation (VN)
VNJ: Does the visualisation achieve high fidelity and completeness?
Eisenstadt et a! [Eisenstadt90] ask the question as to whether the visualisation uses visual metaphors that
represent true and complete behaviour. For software architecture visualisation, the visualisation must present
the architecture accurately, and represent all of that architecture if the visualisation purports to do so.
VN2: Does the visualisation support the representation of dynamical(~' changing software architecture?
During its execution, software may change its configuration in such a way that its architecture has changed.
Software that changes its architecture in such a way is labelled as software that has a dynamic architecture. If
the visualisation is able to support architectural views of the software at runtime, then it may be capable of
showing the dynamic aspects of the architecture. In order to do so, the visualisation may either support
snapshot views of the progression, or animate the changes.
7 .3.2 Scenarios
A set of scenarios is identified that represents a broad range of activities in which software architecture
desCiiptions are used. For each scenario, tasks are identified that stakeholders will be undertaking, along with
a description of the information that they would require in order to successfully complete the task. Then, the
capability of the Arch Vis visualisation to assist in those tasks is described.
These scenarios are intended to show both the strengths and weaknesses of the Arch Vis visualisation, and will
provide a benchmark for other Architecture Visualisations. These scenarios will be chosen from existing
literature, and from architecture in practice today.
7 .3.3 Informal Evaluation
In order to give fmther detail on the design and implementation of the visualisation, there will be an informal
evaluation. This informal evaluation will highlight some of the features of the visualisation that are not well
represented in the chosen scenarios. Jt will also identify some of the issues that are associated with the
visualisation.
124

7.4 Conclusions
Software visualisation evaluation is a relatively small area of visualisation research, and the first half of this
chapter has presented some of the current approaches to software visualisation evaluation. The latter half of
the chapter identifies the fact that there is very little published research that deals with the specifics of
software architecture visualisation evaluation, and proposes one method by which software architecture
visualisations might be evaluated. This method is divided into three elements. The first is a feature-based
framework; the second is evaluation by scenarios; and the third is an informal discussion.
125

126
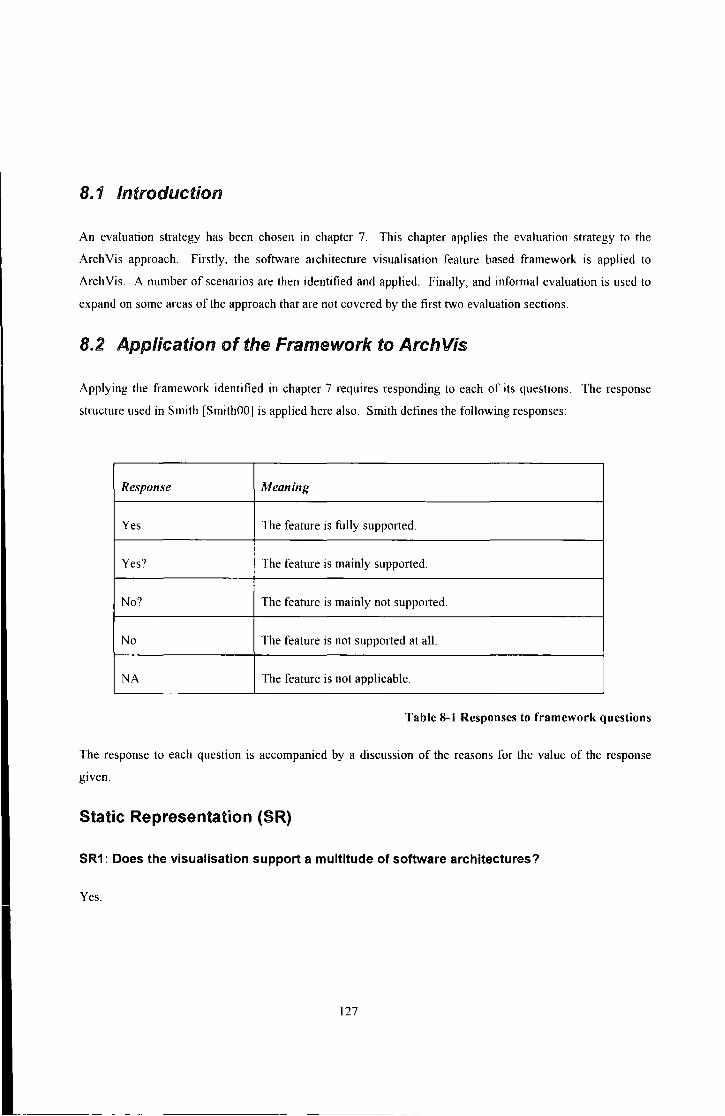
8.1 Introduction
An evaluation strategy has been chosen in chapter 7. This chapter applies the evaluation strategy to the
Arch Vis approach. Firstly, the software architecture visualisation feature based framework is applied to
Arch Vis. A number of scenarios are then identified and applied. Finally, and inf01mal evaluation is used to
expand on some areas of the approach that are not covered by the first two evaluation sections.
8.2 Application of the Framework to Arch Vis
Applying the framework identified in chapter 7 requires responding to each of its questions. The response
structure used in Smith [SmithOO] is applied here also. Smith defines the following responses:
Response Meaning
Yes The feature is fully supported.
Yes? The feature is mainly supported.
No? The feature is mainly not supp01ted.
No The feature is not supported at all.
NA The feature is not applicable.
Table 8-1 Responses to framework questions
The response to each question is accompanied by a discussion of the reasons for the value of the response
g1ven.
Static Representation (SR)
SR1: Does the visualisation support a multitude of software architectures?
Yes.
127

Evidence for the suppmt of a multitude of software architectures can be seen in several areas of the design of
Arch Vis. Firstly, the data model is an entity-relationship (ER) model along with properties. ER models are
flexible, and allows for the modeling of a very broad range of software architectures. Secondly, Arch Vis is
capable of extracting architecture information from a multitude of sources. A number of static and transient
data extraction tools exist that pass infmmation to the Arch Vis visualisation. Finally, the Arch Vis render
model is extensible, allowing for new graphical primitives to be added. Components that create render
models can also be added in order to provide support for a number of different architectures.
SR2: Does the visualisation support the appropriate types of static software architecture
data sources?
Yes.
As an ER model is used within Arch Vis, a large number of software architecture data sources can be
supported. Arch Vis utilises a single data repository that is populated by a number of extraction tools. These
extraction tools operate in a client-server mode allowing for the data sources to be remote from the data
repositmy and visualisation.
SR3: Does the visualisation support the recovery of architectural information from sources
that are not directly architectural?
Yes.
Arch Vis uses a number of data extraction tools, and provides a number of these tools as default. Arch Vis can
also be extended to use new tools. Examples of ArchVis' extraction tools that extract data from non
architectural sources include its packet sniffer, and file-system extraction utility. Arch Vis can then display
non-architectural information alongside architectural infmmation as required. For example, the location of
source code files can be shown for an architectural component.
SR4: Can the visualisation accommodate large amounts of architectural data?
Yes
Each view in Arch Vis uses a set of data filters to pass data over to the render model. These filters can
perform various transfom1ations on the data, including removal and aggregation. By using these data filters,
each view can have only relevant infmmation presented to it, avoiding the need to process inelevant
infmmation.
Navigational capability of pan and zoom also means that each view can accommodate large volumes of
information.
128

Dynamic Representation (DR)
DR1: Does the visualisation support an appropriate set of dynamic data sources?
Yes?
Dynamic data is retrieved by ArchVis in the form of Events. These events are represented by a 4-tuple:
(event, entity name, entity type, user data). Arch Vis is able to map an event of a particular entity type to an
action within Arch Vis. Support in ArchVis is limited to operations over the render model. This means that
events can cause elements of the render model to change, but it does not support the addition, removal and
alteration of elements.
DR2: Does the visualisation support association of dynamic events with elements of the
software architecture during the execution of the software?
Yes.
As noted above, dynamic events are mapped onto actions that operate over the render model. This is an
association between the events and the software architecture.
DR3: Does the visualisation support relatively non-invasive approaches to retrieving
dynamic data sources?
Yes.
Arch Vis supp01ts both invasive and non-invasive approaches to retrieving data from dynamic sources. The
primmy non-invasive approach utilises the Java debugger interface. This allows retrieval of information from
the virtual machine of software that is executing on it.
The JDI interface is suitable only for systems implemented in the Java language, however, ArchVis can be
extended to utilise other technologies for different languages and platforms. This can be achieved if the
dynainic data can be encoded in the 4-tuple of (event, entity name, entity type, user data).
DR4: Does the visualisation allow the live collection of dynamic data?
Yes.
When the Arch Vis visualisation begins execution, it creates the ArchEventServer data server that awaits for
the connection of clients. Clients can connect to this server, and events sent are pushed through to each view
currently open in Arch Vis.
129
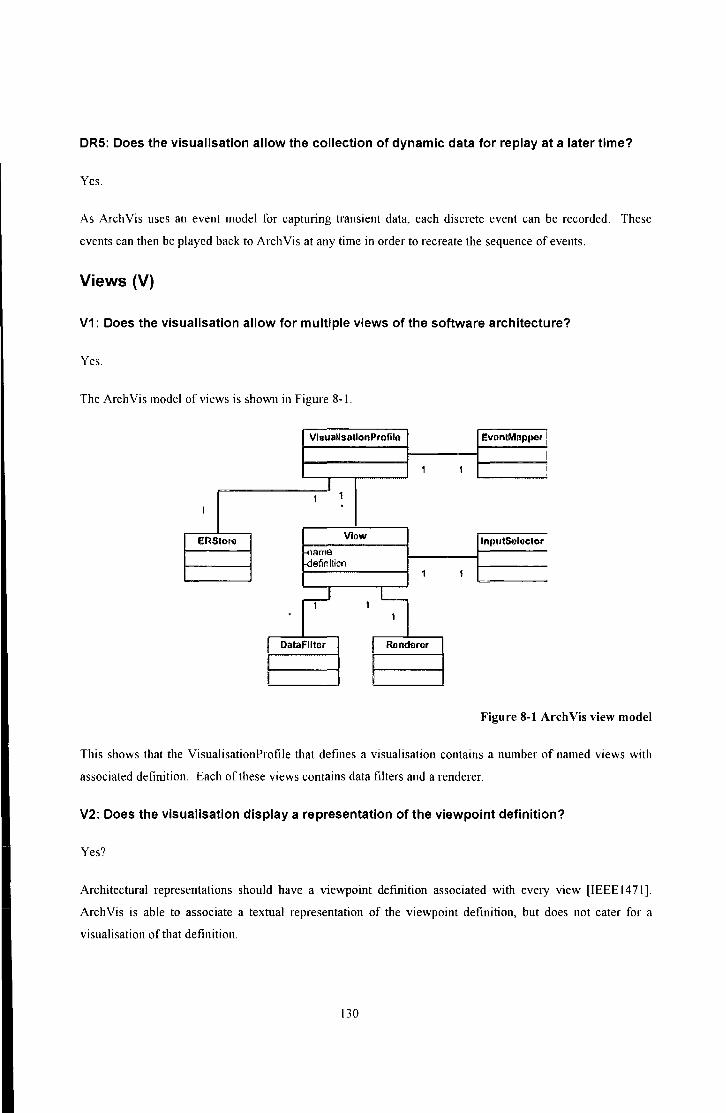
DRS: Does the visualisation allow the collection of dynamic data for replay at a later time?
Yes.
As Arch Vis uses an event model for captming transient data, each discrete event can be recorded. These
events can then be played back to Arch Vis at any time in order to recreate the sequence of events.
Views (V)
V1: Does the visualisation allow for multiple views of the software architecture?
Yes.
The Arch Vis model of views is shown in Figure 8-1.
VlsuallsatlonProfllo EvnniMIJpf>l'r I
I 1 1 I
1 1 1
1
ERStore Vi ow lnputSelcctor ' -m~me
-denn lt1Cf1 1 l
-~ 1 ~ DataFIItor Rondaror
Figure 8-1 Arch Vis view model
This shows that the VisualisationProfile that defines a visualisation contains a number of named views with
associated definition. Each of these views contains data filters and a renderer.
V2: Does the visualisation display a representation of the viewpoint definition?
Yes?
Architectural representations should have a viewpoint definition associated with every view [IEEE 14 71].
Arch Vis is able to associate a textual representation of the viewpoint definition, but does not cater for a
visualisation of that definition.
130
Navigation and Interaction (NI)
Nl1: Can users browse through the visualisation by following concepts?
Yes.
Browsing in Arch Vis is achieved through the relationships that link elements of the architecture. Browsing is
achieved both by the relationships visually represented within a view and also by following relationships into
other views that contain the same element.
Nl2: Can users search for arbitrary information relating to the architecture?
Yes.
Entities can be searched by both name and type, and can be restricted to any number of the open views.
Searching also extends to extemal text-based sources such as source code, configuration files and logs.
Nl3: Can the user build queries in order to locate information they need?
Yes.
Queries are supported in two ways within Arch Vis. Every view in Arch Vis, along with the filtered data, can
have a set of inputs. This set of inputs can dtive the resulting view rendered. The second manner in which
queries can be built is that each graphical element in the render model can be selected to create a quety view
from. Quety views then operate in the same manner as an ordinary view, except that the input ER store is
affected by which graphical element was chosen.
Nl4: Can users navigate between views easily?
Yes?
Arch Vis presents all defined views to the user, allowing them to switch between them with ease. However,
Arch Vis may not always be able to retain cuiTent focus when switching between views. 'CuiTent focus' is the
element in the view that the user is cuiTently interested in, and may be represented by a highlight, or other
graphical distinguisher. When the user switches to another view, the cUITent focus may not exist in that view,
so focus is lost.
Nl5: Can users navigate through a view in an appropriate manner?
Yes.
131
Navigation within a view consists of panning across the display, zooming in to view detail and zooming out to
show more elements. It also consists of selection, examination and graph layout. Arch Vis suppm1s all of
these navigational mechanisms at the render-model level.
Task Support (TS)
TS1: Does the visualisation support the representation of anomalies?
No?
Arch Vis is not able to automatically identifY anomalies in the architecture. Arch Vis has no 'intelligence' or
engine by which elements in the architecture can be identified as anomalies. However, Arch Vis will
faithfully represent any entity or relationship in accordance with the renderer.
TS2: Does the visualisation support the comprehension of the software architecture in the
appropriate manner?
Yes.
Support of this is largely attributed to Arch Vis' support of multiple views. These views are intended to
satisfY the comprehension requirements of pat1icular stakeholders. The design of individual views will
determine what comprehension approach is most suited to the data it shows - either bottom-up, top-down or
both. Arch Vis supports top-down comprehension of the architecture through high-level views such as
component and technology views. Bottom-up comprehension is suppm1ed through developer views. Users
can switch between views, so Arch Vis can simultaneously suppm1 both approaches.
TS3: Can users annotate the visualisation?
Yes?
Arch Vis suppm1s the addition of notes to graphical elements in the visualisation, but it does not support the
addition of these notes to the underlying data source.
TS4: Does the visualisation support the communication of the architecture to the
appropriate stakeholders?
Yes.
Arch Vis facilitates the usc of multiple views. By supporting multiple views, the visualisation is able to cater
for the informational requirements of different stakeholders in the system.
132

TS5: Does the visualisation show the evolution of the software architecture?
No.
In order to show the evolution of software architecture, a visualisation must be able to at least be able to show
snapshots of that architecture at points in time. Arch Vis is capable of representing the architecture of a
system at a particular point in time, but would have to treat an architecture at a different point in time as a
completely different architecture. As Arch Vis is not able to show the architecture of more than one system
simultaneously, it is not capable of directly showing the evolution of a software architecture.
TS6: Does the visualisation support the construction of software architecture?
No?
As Arch Vis has the clearly distinct phases of a visualisation pipeline of data extraction, data filtering and
rendering, the implementation of this pipeline is important when considering construction suppmt. It is fair to
say that the data model suppmts the constmction of software architecture in that the ER store does not
preclude an editor from contiibuting data to this store. However, this kind of process is divorced from the
main visualisation process.
Conside1ing this in terms of a model view conn·oller architecture, Arch Vis is implemented in a uni-directional
manner. When the visualisation is constructed, data flows sn·ictly from the model to the view. Any conti·ol
over the data cannot be updated in the view in sufficient time as to make the process worthwhile.
TS7: Can the visualisation support planning and then executing the development of a
software system?
Yes?
ArchVis provides direct suppmt for planning in its Project Management VIew, and for development in
developer views. Arch Vis only provides support for visualising aspects of planning and execution, but does
not support some of the basic functions that would be found in other CASE tools, naturally. In order to
provide greater suppmt planning and execution, Arch Vis would have to have a mechanism by which the
visualisation can be integrated with such CASE tools. It currently does not have this integration mechanism.
TS8: Does the visualisation support evaluation of the architecture?
Yes?
133

In order to be able to support the evaluation of software architecture the visualisation should have some
means by which quality descriptions can be associated with components of the software being visualised.
Arch Vis can support this due to the entity-relationship data model, and the flexibility of the renderer
framework. Typically these quality descriptions will be textual, and basic visualisation would be to represent
these as text. More advanced representation can be achieved where the quality is described in a more formal
manner such as clearly defined categories with scores.
The use of associations in the render model means that graphical elements can be tagged with other graphical
elements. These elements can be drawn from the same library, and so can be as flexible and detailed as the
librmy supports.
TS9: Does the visualisation support the comparison of software architectures?
No.
As noted earlier, Arch Vis does not support the visualisation of more than one software architecture at any one
time. This is a key pre-requisite for supp01ting comparison.
TS10: Does the visualisation allow for rationale to be shown?
Yes?
Arch Vis supports the display of rationale information, but does not require this infonnation to be included in
the visualisation. The support for visualisation of rationale is limited to displaying the text of notes or
diagrams that describe the rationale behind an element of the architecture.
Implementation (I)
11: Can the visualisation be generated automatically?
Yes
Arch Vis is capable of visualising the architecture of a variety of software systems automatically, and can do
so without any additional extension of its capabilities. However, one of the key features of Arch Vis is its
extensibility. As softwm·e architecture is encoded in many sources, and can be represented in many different
ways, Arch Vis has been designed to explicitly allow customisation and extension.
Data extraction of Acme, Java source code and file systems, amongst other sources, means that Arch Vis can
generate visualisations of software architectures of software systems written in Java, or described in an Acme
compatible ADL.
134

12: Can the visualisation be run on appropriate platforms?
Yes.
Implemented in Java, ArchVis can run on any hardware/operating system platform that has the appropriate
Java Virtual Machine (JVM) and display capability. The proliferation of JVMs to date means that there are
few platforms that do not support a JVM.
Further, the visualisation is broken down into components that can execute on different platforms. Data
extractors of both static and transient data can reside on remote machines to the visualisation system.
13: Does the visualisation support multiple users?
Yes?
Views and viewpoints relate directly to different stakeholders. Arch Vis supports a theoretically infinite
number of views that is limited only by the practicality of implementation. This support is limited in that only
one physical user can access the Arch Vis visualisation tool at any one time.
One simple means by which Arch Vis can support multiple simultaneous users is by implementing a vatiation
of the data access intetface EntityRelationshipStore such that the store can be located remotely, and accessed
by more than one Arch Vis implementation. This would mean that multiple instances of Arch Vis can operate
over the same data-set. This is possible as the repositoty is effectively read-only after the data extractors have
populated it.
Visualisation (VN)
VN1: Does the visualisation achieve high fidelity and completeness?
Yes?
Arch Vis has the capability of representing true and complete behaviour, but is not required to. It is the design
of the static filters and renderer that determine whether the visualisation will be high-fidelity and complete.
Also, there is no mechanism by which the stakeholder can be informed if the view is intended to be complete.
VN2: Does the visualisation support the representation of dynamically changing software
architecture?
No?
135

Support for dynamism in Arch Vis is encapsulated in its utilisation of transient data events. In its
implementation, Arch Vis maps events to changes in the render model, not the underlying data store. This
means that if components, connectors and other such architectural elements are added, changed, removed or
reconfigured, these can only be represented by changing the render model. Support for dynamically changing
architecture will therefore be limited to very simple changes and does not currently include the addition of
new graphical elements.
136

8.2.1 Summary
Table 8-2 summarises the results of the application of the framework .
Table 8-2 Summary of the results of the framework evaluation
137

Coloming the results in Table 8-2 gives a visual impression as to which areas of ArchVis score well, and
which areas do not. Data representation is strong in Arch Vis, with both static and dynamic representation
showing highly positive results. Arch Vis also scores well in views, navigation and interaction. It is in the
category of task support that Arch Vis shows weakness in four of the ten features. This, and the results in the
visualisation category show the Arch Vis is weakest in the area of representing evolution and change. Whilst
Arch Vis strongly supports wide and varied data sources as the infonnational input to Arch Vis, the
configuration of data filters and the view model means that showing fundamental changes to an architecture
presents a challenge.
A point of note is that no responses were 'NA'. The reason for this is that the framework suppmts the
evaluation of software architecture visualisation, and does so in such a way as to maximise the scope by
which visualisations can be evaluated. For example, 30 architecture visualisations can be evaluated against
the framework in much the same way as 20 architecture visualisations.
8.3 Scenarios
Arch Vis is evaluated against a number of scenarios. Each scenario is desc1ibed along with how Arch Vis
suppmts the task involved in the scenario.
8.3.1 Analysis of Architectures of Existing Systems
Scenario
Sometimes, system development takes place without an architectural description. The implemented system
will have an architecture, but will not have an architectural description associated with it [TEEEI471]. As
every implemented system has an architecture, whether known or not, an architectural representation can be
recovered. Once recovered, this architectural representation can be used in the development of a new system
based on the old one, or for maintenance or evolution of the existing system.
In this scenario, an architect has a piece of open-source software that is very poorly documented. This
software is a stand-alone application but contains a set of functionality that they wish to incorporate into a
larger piece of software. In order to detennine feasibility the architect wants to analyse its architecture and
therefore make a decision regarding its suitability.
138

Application
The first phase of the visualisation process is to extract information about the software system. As this
software is written in Java, the Arch Vis JavaParser can be used to extract the following static information:
• Packages
• Classes
• Methods
• Class Variables
• Method call and usage
• Import relations
The Arch Vis JavaParser tool will then copy over relevant information to the ER store. This process can
involve a further step of filtering, but the architect in this case copies all infotmation available.
In order to preserve directory structure information, the architect uses Arch Vis' directory parser in order to
relate files on the file system to file entries related to the java source files. During this process, a number of
other filename entries are also added to the ER store- a set of propetties files and a number of images.
The architect then uses the Arch Vis PropertiesParser to add the properties file into the ER store. In order to
determine which parts of the software use the various propetties and image files, the architect uses a text
scanner that relates the java source file with the filename of the properties files and image files.
Now the architect has the relevant information, they can define a number of views that they wish to have on
the architecture. For this, they edit a visualisation profile configuration file and a number of associated
configurations. The views that the architect decides on are:
• Package View
• UML View
• Import relations
• Call Graph
139
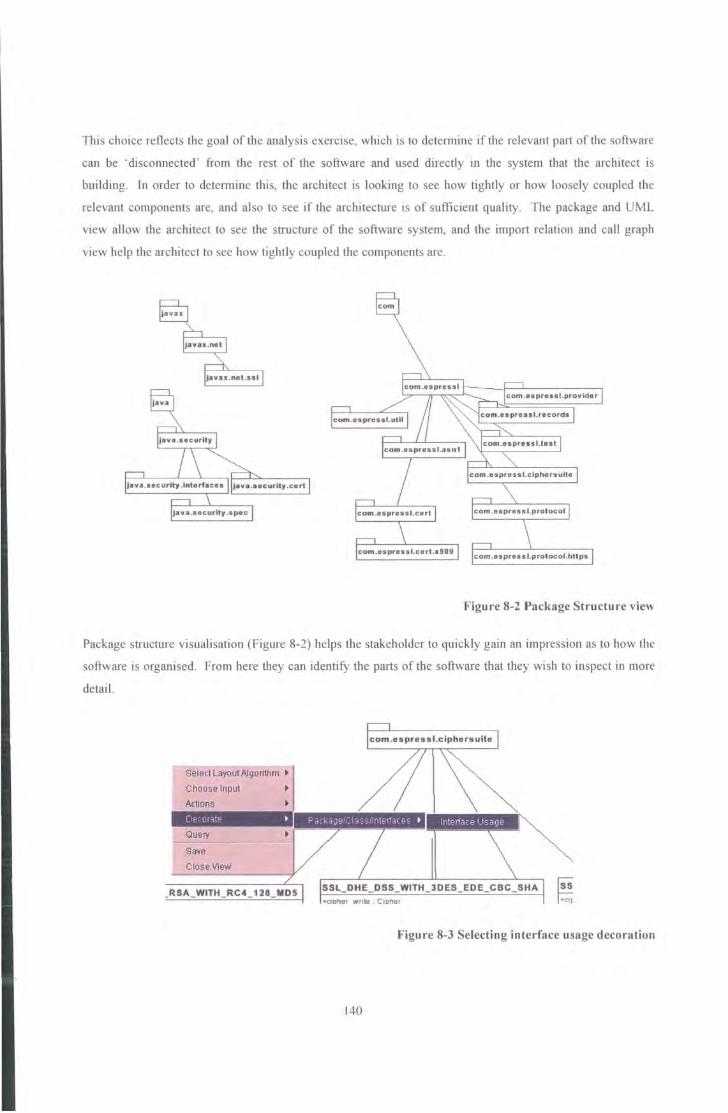
This choice reflects the goal of the analysis exercise, which is to detennine if the relevant part of the software
can be ' disconnected' from the rest of the software and used directly in the system that the architect is
building. In order to detennine this, the architect is looking to see how tightly or how loosely coupled the
relevant components are, and also to see if the architecture is of sufficient quality. The package and UML
view allow the architect to see the structure of the software system, and the import relation and call graph
view help the architect to see how tightly coupled the components are.
Figure 8-2 Package Structure view
Package structure visualisation (Figure 8-2) helps the stakeholder to quickly gain an impression as to how the
software is organised. From here they can identify the parts of the software that they wish to inspect in more
detail.
Select Layout Algorithm •
Choose Input
140
Figure 8-3 Selecting interface usage decoration

The stakeholder can then use the Package View in order to see the contents of a pa~ticular package.
Decorations can be added to the view by selecting the appropriate option. In this case, the stakeholder may
wish to see how tightly coupled a class is by measuring the number of non class variables used as class
variables, and as parameters to methods (Figure 8-3 ).
SSL RSA_WITH_RC4 128_MD5 ->-tip her_ wri Ia : Cipher •cipher read Cipher
+-SSL_RSA_WJ• H_RC4_12B_MD51) null +-enginelsSupported() : tmolean +oengiMinitialize(J: void +engineGeiMAC!.ength() in! •engineGeiKeylenglhl) in! +anyineGeUVlength() . ml
+-engineEnayptl) by1a(] 1'eng•neDecrypi(J byteij
Jcom.espressl.ciphersuHe J
SSL DHE DSS WITH 3DES_EDE CBC SHA •apher _ wnta : Ci:pher
... dphar_read: Cipher
•SSL_DHE_OSS_WITH_JOES_EOE_CBC_SHA(l: nun •enginalsSupportedl): boo!ean •anginglnitia!iz9{ 1 : ...Wd +engineGetMACLengthl) : int
1
/ -.engine. GetKeylertgthO : inl •engineGeiiVlengthl) : int •tmg•neEn!7ypl() : bytet] -tgnginel>ecr}pt{ I : byteO
83%
SSL_RSA_EXPORT _ WITH_R C4_ 40_MD5
.-aipher_wrile: Cipher
.-cipher read : Cipher
+SSL_RSA_EXPORT_WITH_RC4_ 40_,i05(1: null 1\ •aogmelsS~pportedl) . boulean I \ '"""OQlnelnitielize() :¥Old
-o-engmeGetMAClgngthl) . inl '"BngirH!GetKeylength() :in I <-engmeGeiiVLengthf) :in! .;..gogineEnaypll) bytetl .;.engineOecr)'PI{): bytg0
\ 78%
SSL_RSA WITH RC4 128 SHA SSL_DHE RSA_WITH_3DES EDE CBC SHA SSL_NULL_ WITH_NULL_N U LL
+-opher_wuiY: Cipher
.. opher read: Cipher
-SSL_RSA_WITH_RC-4 12fi_SHA/I: null .. oenyinelsSupported() : boolean
+-eng•nelntli:llize(): 'I'Oid •engtneGetMACLength!) •nl >i:!ngtneGetKe}'Lengthl) : in! ;.ang•neGe!IVLenglhl) : in! ..-engineEnayptl) byte(] +-engme0e!7ypl{) : byte(]
58%
·apher_wule: c,phor
.,.cipher read : Cipher
;-SSL_DHE_RSA_YIITH_30ES_EOE_CBC_SHA0 ·null •engmelsSupportedl) : boofea..n .. limginelnitiahze() : 'fO.id
4:!ngmaGeiMAClanyth() ml
.. sngineGetK""yt.ength' J : int ·engineGeiiVlanglhl): znt .:.enginoEncrypt() bytgf]
•engineD&aypl(.1: byte[]
72%
... SSL_NUll_WITH_NUll_NUll(): null
.,.,sE.xportabhtO : boOlean
.;.getName() Slung
.:.enginelsSupported() : boolean -enginelnitia..liz!i!l) vo1d .;.!i;mgineGeU,.4AClenglh() : in\ •engineGeiKeylenglh{) : 1nt
-engineGetiVlenglh{) : int +emgineEncrypl{) : byteU -engineDecrypt{) : by1eO •enoylll( I : SSLC1phette:a:t
89%
Figure 8-4 Package view
The resulting view (Figure 8-4), along with the other views describe previously, can allow the architect to
determine from the software's structure whether the software is suitable for further investigation.
8.3.2 Analysis of Alternative Architectures
Scenario
When building a new software system, an architect may consider the architecture of previous systems in a
similar domain. There are several advantages to be gained by looking at existing architectures. Firstly, they
provide a useful reference for constmction of new architectures, and Utey may also have an associated set of
metrics concerned with the implementation of software systems that use that architecture.
141
The primary task associated with this scenario is the systematic comparison of software architectures against a
set of crite1ia. An architect will look at a number of architectures, and pe1fmm a compmison against a
number of criteria. For example, they may look at the selection and configuration of the major components,
and focus on the pe1formance metrics of each. If customisability is a key criterion for the architecture, then
the architect will consider the architectures against this non-functional requirement.
In order to successfully make compmisons of different architectures, the architect will need to gain a level of
understanding of those architectures. That level of understanding can vary from a high-level component
view, down to a low-level understanding of the architectures of individual components with some
implementation-specific information.
One mechanism by which an architect can make high-level compmisons between architectures is to show a
visualisation of those architectures side-by-side. The architect should be able to view similar sets of
infmmation regarding common elements of those architectures, if that information is available. If required,
detailed information should be available regarding the architectures of individual components of the
architecture, along with implementation infonnation should that be required by the architect.
For this scenario, an architect has three systems to compare before deciding on which architecture to use
when building a new system. The first system has a well-documented architecture that includes a description
of that architecture in the Acme architecture description language. The second system is well documented,
but is in hard copy and not in a fmmat that is directly parseable. The third system does not have an
architectural description at all, but the source code is available.
Application
In order to compare these architectures, the architect wishes to have views of those architectures directly
available side-by-side. Arch Vis does not have direct support for multiple systems in one instance of Arch Vis,
but it does have the capability of persistently storing a render model. This means that once a view of a system
has been created and rendered, the render model can be saved to disk and loaded at a later stage. Data stored
includes position infmmation, so once an appropriate layout has been achieved, the view can be stored with
positional information intact. Also, when a view is loaded, layout algorithms can again be applied to the
v1ew. The disadvantage for ArchVis is that whilst views from different systems can be loaded from a
persistent store, there may be a danger that the view becomes mentally associated with the cunent system.
Arch Vis does not cunently have a mechanism by which to adequately distinguish views from other systems.
In order to compare the architectures, the architect decides that a comparison across a component-connector
view is appropriate, and so begins a process of obtaining such a view from each system.
142
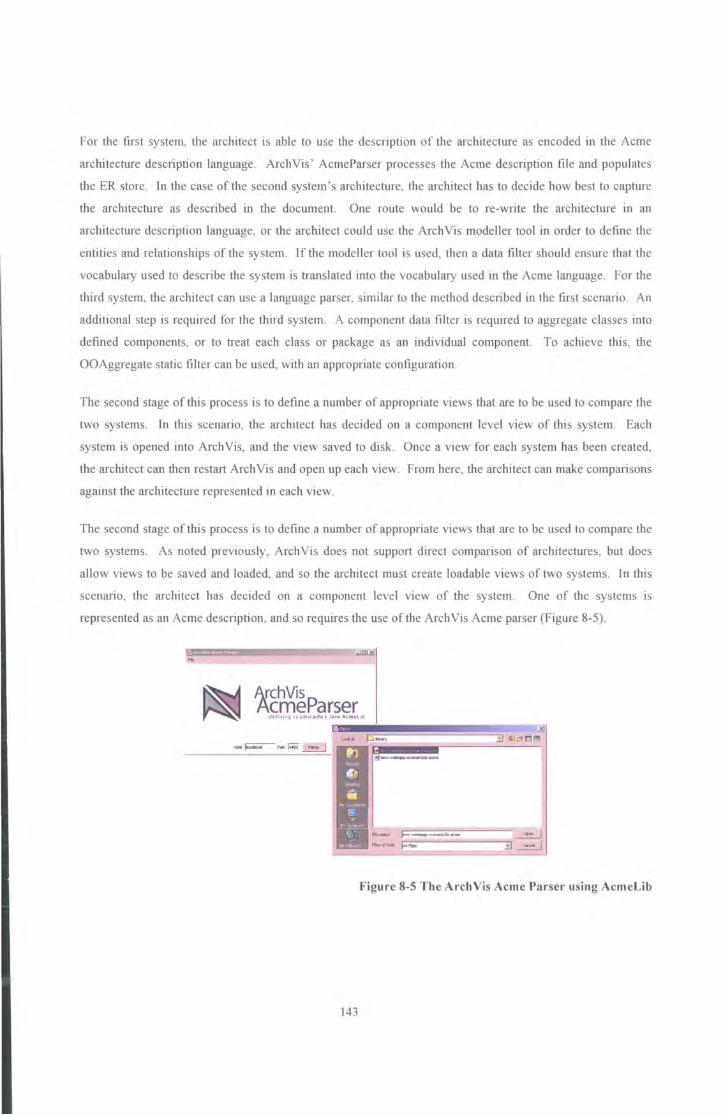
For the first system, the architect is able to use the description of the architecture as encoded in the Acme
architecture description language. Arch Vis' AcmeParser processes the Acme description file and populates
the ER store . In the case of the second system's architecture, the architect has to decide how best to capture
the architecture as described in the document. One route would be to re-Wiite the architectme in an
architecture description language, or the architect could use the Arch Vis modeller tool in order to define the
entities and relationships of the system. If the modeller tool is used, then a data filter should ens me that the
vocabula1y used to describe the system is translated into the vocabulary used in the Acme language. For the
third system, the architect can use a language parser, similar to the method described in the first scenario. An
additional step is required for the third system. A component data filter is required to aggregate classes into
defined components, or to treat each class or package as an individual component. To achieve this, the
OOAggregate static filter can be used, with an appropriate configuration .
The second stage of this process is to define a number of appropriate views that are to be used to compare the
two systems. In this scenario, the architect has decided on a component level view of this system. Each
system is opened into Arch Vis, and the view saved to disk. Once a view for each system has been created,
the architect can then restart Arch Vis and open up each view. From here, the architect can make compruisons
against the ru·chitecture represented in each view.
The second stage of this process is to defme a number of approp1iate views that ru·e to be used to compare the
two systems. As noted previously, Arch Vis does not support direct comparison of ru·chitectures, but does
allow views to be saved and loaded, and so the architect must create loadable views of two systems. In this
scenru·io, the architect has decided on a component level view of the system. One of the systems JS
represented as an Acme description, and so requires the use of the Arch Vis Acme pru·ser (Figure 8-5).
Arch Vis Acme Parser
Ul1h11ng u.unu.edu' J••• Ac111tl1b
Figure 8-5 The Arch Vis Acme Parser using AcmeLib
143

This allows the ER store to be populated with the entities and relationships that are found within the Acme
desctiption. The stakeholder can then use a Component Connector view in order to view this infmmation.
Once a satisfactmy layout is achieved, the view can be saved (Figure 8-6).
File Views Transient Data Help
Component Connector VIew}
Data successfully loaded
I=Js .... cMaws
Data Source
Data Filters
Renderer
Selection
...... --- --
' '
F1la name fYW't-a
FIIBS Of!YJ'B jAI1 Files r ."J
Host
ocalhost
Port
p306
Database:
lscsnarto2a
User
ot
Password
,£ancel J
Figure 8-6 Saving a component-connector view
For the second system, the architect will use source code parsers and aggregation techniques in order to
produce a component cotmector view of the second system. A similar process is used to create a view of the
third system. Once these views are defined and saved, they can be loaded side-by-side (Figw·e 8-7).
144
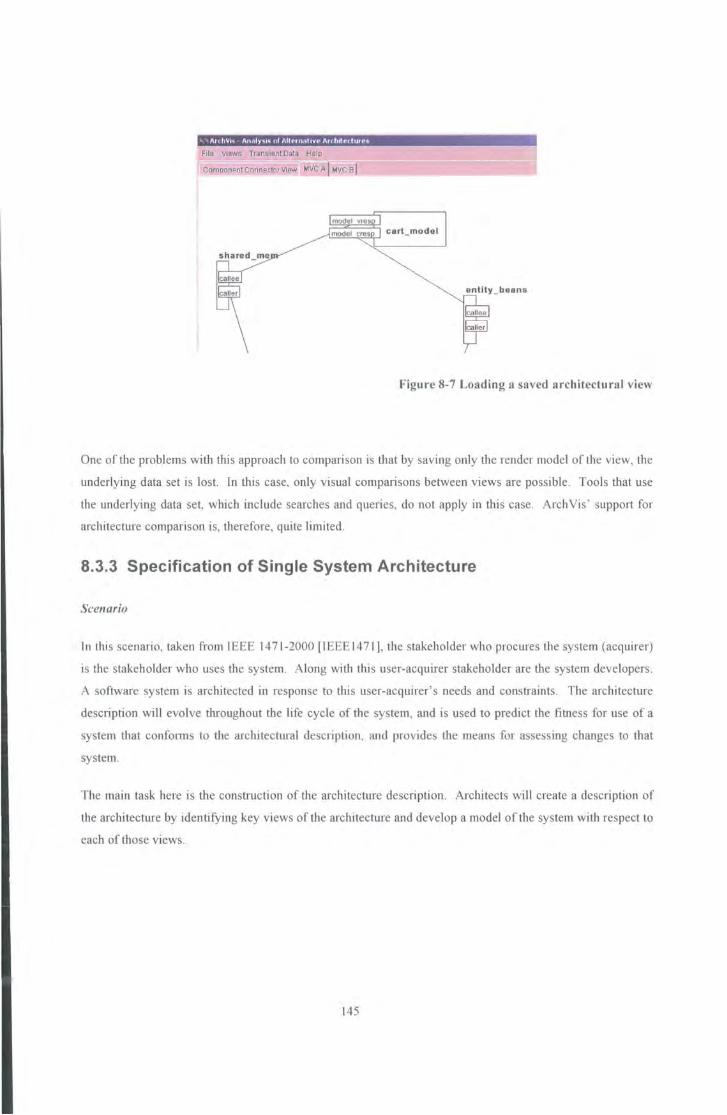
""'- ' AtrhYI<> - An<tly'il'i nr Altf'tndtiVP. Atchttectures
File VIews Transient Data Help
Component Connector VIew MVC A] h4VC 8~~~~~~~~~~~~~~
Figure 8-7 Loading a saved architectural view
One of the problems with this approach to comparison is that by saving only the render model of the view, the
underlying data set is lost. In this case, 011ly visual comparisons between views are possible. Tools that use
the tmderlying data set, which include searches and queries, do not apply in this case. Arch Vis ' supp01t for
architecture comparison is, therefore, quite limited.
8.3.3 Specification of Single System Architecture
Scenario
In this scenario, taken from IEEE 14 71-2000 [IEEE 1471], the stakeholder who procures the system (acquirer)
is the stakeholder who uses the system. Along with this user-acquirer stakeholder are the system developers .
A software system is architected in response to this user-acquirer's needs and constraints. The architecture
description will evolve throughout the life cycle of the system, and is used to predict the fitness for use of a
system that conforms to the architectw-al description, and provides the means for assessing changes to that
system.
The main task here is the construction of the architecture description. Architects will create a description of
the architecture by identifying key views of the architectme and develop a model of the system with respect to
each of those views.
145
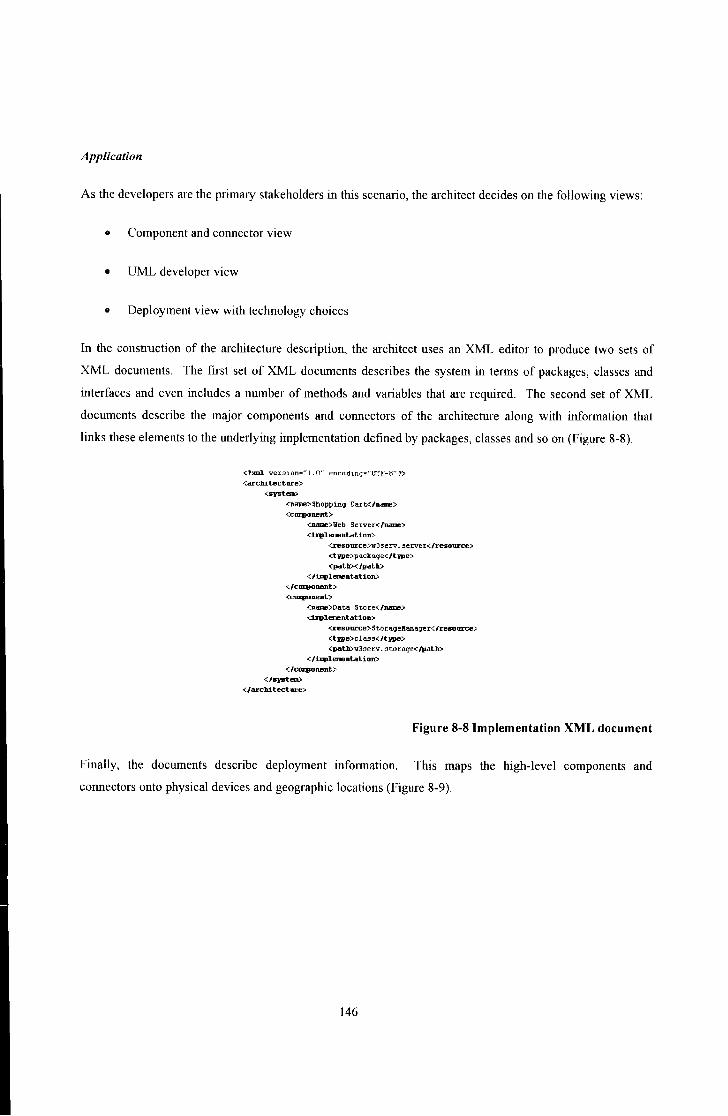
Application
As the developers are the primruy stakeholders in this scenario, the architect decides on the following views:
• Component and connector view
• UML developer view
• Deployment view with technology choices
In the construction of the architecture description, the architect uses an XML editor to produce two sets of
XML documents. The first set of XML documents describes the system in terms of packages, classes and
interfaces and even includes a number of methods and variables that ru·e required. The second set of XML
documents describe the major components and connectors of the architecture along with information that
links these elements to the underlying implementation defined by packages, classes and so on (Figure 8-8).
<?xml vet:slon,."l. 0" encodmq•"UTF-8" ?> <architecture>
<system>
<name>Shopping Cart</Dillnf!> <cOJli.)Onent>
<Dame>Tleb 3etver:</na:me:>
<iif1111em:!nt.at.ton>
<resource>w3 serv. set:ver</resource> <tue>packaqe</t:rpe> <pat II>< /path:>
</i.JI:plementatioiD </cOEpOnent> <cmipJnent>
<»..ame>Da:ta St.ore</name> <illplementation>
<resoUI'ce>Sto:t:aqeHanaqer</resource> ct:rpe>class</tme> <patb>T.J3ser:v. stor:aqe</path>
</i..qtlementation> </ccmponent.>
</system> </architecture>
Figure 8-8 Implementation XML document
Finally, the documents describe deployment information. This maps the high-level components and
connectors onto physical devices and geographic locations (Figure 8-9).
146
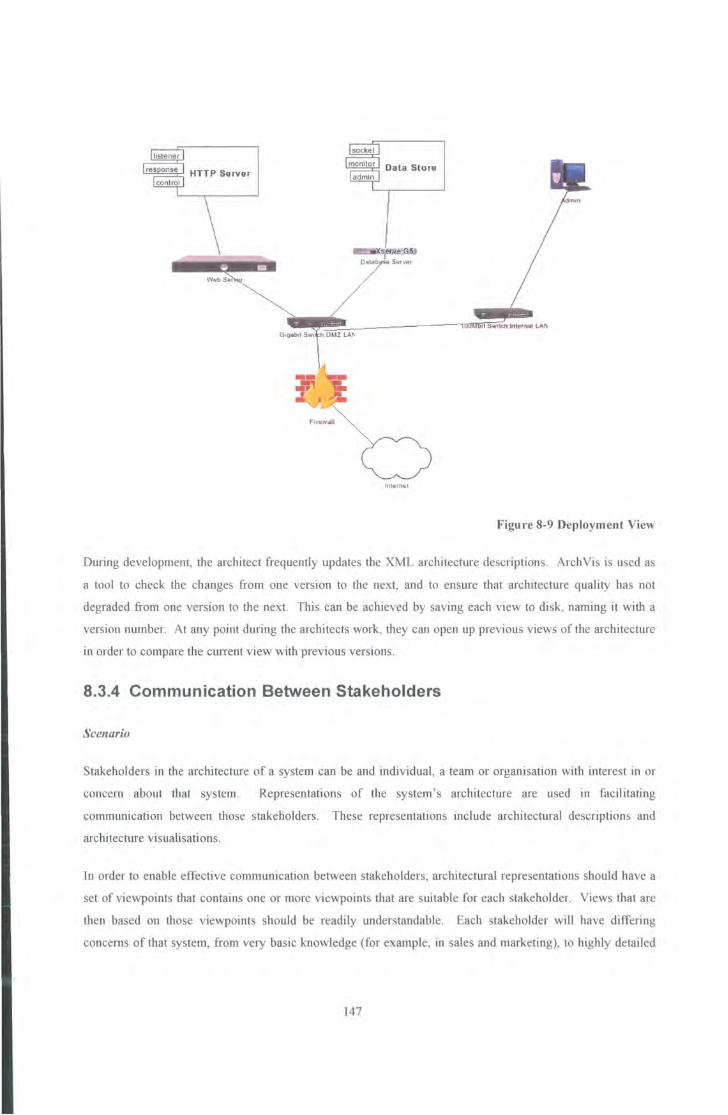
Stiirwr
lnltiimel
Figure 8-9 Deployment View
During development, the architect frequently updates the XML architecture desc1iptions . ArchVis is used as
a tool to check the changes from one version to the next, and to ensure that architecture quality has not
degraded from one version to the next. This can be achieved by saving each view to disk, naming it with a
version number. At any point during the architects work, they can open up previous views of the architecture
in order to compare the current view with previous versions.
8.3.4 Communication Between Stakeholders
Scenario
Stakeholders in the architectw·e of a system can be and individual , a team or organisation with interest in or
concem about that system. Representations of tl1e system's architecture are used in facilitating
communication between those stakeholders. These representations include architectural descriptions and
architecture visualisations.
In order to enable effective communication between stakeholders, architectural representations should have a
set of viewpoints that contains one or more viewpoints that are suitable for each stakeholder. Views that are
then based on those viewpoints should be readily understandable. Each stakeholder will have differing
concems of iliat system, from very basic knowledge (for example, in sales and marketing), to highly detailed
147

in-depth knowledge (for example, that required by developers). Finally, these architectural representations
should provide for inter-view cohesion such that stakeholders have a common reference with which they can
communicate with each other. One typical situation where this becomes obvious is when the language used
to describe the system is different when the organisation communicates internally from when it communicates
externally.
In this scenario, a company has an enterprise-class software product that they are selling to other companies.
This product has been built as a J2EE compliant application, using EJB and JSP technology. As such, the
application can be deployed in a number of ways, and this has helped the product to gain market advantage.
This organisation intends to sell this application as a full product, but also extol the product's capability to be
customised to suit the individual needs of the client. The company has a number of stakeholders in the
architecture:
• The architect
• Developers
• Sales and Marketing
• Suppmt
• Professional Services
The visualisation should cater for these stakeholders.
Application
ArchVis can support any number of views. The following matrix (Table 8-3) identifies the views to be used
in Arch Vis against the stakeholders that might use those views.
148

Views
Product Component Static Physical Technology
Component and UML Deployment
Connector
Architect ./ ./ ./ ./ ./
"' Developers ./ ./ r.. X X X Q.l
"0 0 -= Q.l
Sales & Marketing ./ X X ./ ./ ...:.= ~ -rJ1 SupJlort ./ X X ./ X
Professional Services ./ ./ ./ ./ ./
Table 8-3 Stakeholder Communication View matrix
Arch Vis is then configured for each of the five views identified. By using Arch Vis, the stakeholders have a
single reference point for the architecture, and this reference will allow each stakeholder to gain an
appreciation of other stakeholders' views.
8.3.5 Conformance Checking
Scenario
Once a system has been implemented, the as-implemented architecture of the system is checked against the
as-designed architecture of that system to determine if the implementation is faithful. For this conformance
checking to be feasible, an automatic or semi-automatic process is required by which the as-implemented
architecture can be extracted. Once extracted, this extracted architecture is represented in some way such that
comparison can be made to the representation of the as-designed architecture. Once these representations can
be compared, checks are made between them to see if the implementation is true to the design. If there are
discrepancies, then these can be further investigated.
Application
In this scenario, a company prescribed a software system's architecture in the Acme architecture description
language, and began development. Development of this software is in the Java language, and so is comprised
149

of packages, classes and inte1faces. Each package that IS developed has an associated mapping with an
architectural component (Figure 8-1 0).
Comms
Figure 8-10 As designed package assignment to architectural components
This mapping is captured in an XML document that simply records this relationship. At major milestones in
the project, they wish to check that the as-developed architectw·e matches the as-prescribed architecture.
When a conf01mance check is required, the somce of the software is parsed, ready to be used by Arch Vis.
The XML component-mapping document is also parsed. Finally, a ' component implementation' view is
defined that shows this graphically (Figure 8-11 ).
Comms
Figure 8-11 As implemented package assignment to architectural components
150

The architect is able to compare the two views together, and can see that in this example the package
mainmsgsrv.pull.nni is inconectly being used in the Producer component. From this infmmation, the
architect is able to detennine why the architecture has not confmmed to the specification.
8.3.6 Operational and Infrastructure Support
Scenario
At some point dming the life cycle of a system, it will be deployed. Depending on the scale of the system,
this may occur during development, but is more typically deployed onto a testing platform during testing
phases. Eventually, the system will be released and deployed in its target environment.
Operational, infrastructure and suppm1 stakeholders use architectural representations to ensure that the
appropriate operational infrastructure is in place. Infonnation that they require include:
• Computing hardware platfmms
• Operating systems
• Software platfonns
• Network infrastructure
• Telecommunications
• Human infrastmcture
Architectural representations should contain infonnation pertaining to the above. This can then be used to
make acquisition decisions and to provide the appropriate environment for deployment. Those who are
responsible for this aspect of deployment can use architectural representations in order to communicate with
other stakeholders, including the architect in order to feed infmmation back into the design process.
151

A typical scenario is when a large system is comptised of a number of components, and these components are
distributed across a number of physical platforms and geographic areas. One such system is a company's
intranet portal. Portals consist of a number of components, listed below:
• Portal home system
• Customer database.
• Contact database.
• Customer support system
• IT helpdesk
• Enterprise Resource Plarming application
• Web-based e-mail access
The components are distTibuted across an internal network.
Application
Arch Vis requires infotmation about each component, and about the network infrastmcture of the company.
From diagrams of the network topology, a stakeholder can input network topolO!,'Y information into the
Arch Vis ER store. From the architectural descriptions, the physical deployment characteristics of each of the
components can be determined and input into the ER store. Along with the above information, human
resource data can also be added that indicates which groups are responsible for the operation, maintenance
and support of each of the components.
Once this infotmation is available, Arch Vis can show a number of views:
• Network topology of the portal
• Physical location of components of the pottal
• Support responsibility
In order to show real-time information regarding the operation of the portal, several transient data capture
components can be deployed to various sub-components of the portal. For example, the ArchVis HTTP
sniffer can be deployed at the portal home system and web-based e-mail access system (Figure 8-12).
152

CPU: 47'Jio M! m: t421S I2MB Dis k: 0.02H41lsu N•t: S.I2KI/ tK
lt• qu • su : 114 p•r ~nm GETs: I I p•r 111.1n
POSTs: ) J !Hf nun
a ...... Swot I ouz LA>
-C) lnknntll
Figure 8-12 Real-time deployment information
Each machine that the portal system is deployed on can have an appropriate ArchVis activity monitor
deployed on it that will communicate real-time CPU, disk and memmy usage statistics (Figure 8-12).
8.3.7 Architecture Evaluation
Scenario
Evaluation of an architectural predicts the quality of systems whose architectures confmm to that architecture.
Quality measures for systems resulting from an architecture description are measured in terms of non
functional qualities such as efficiency, reliability, security and performance.
Application
In order for Arch Vis to represent architecture quality, that infmmation must be available in the ER store.
Typically, components will have properties that record such quality measurements, and these can be used in
any of the appropriate views.
Many of ArchVis' render model elements suppot1 the assignment of a quality rating measured as a
percentage. It is the responsibility of the renderer to assign the appropriate entity property to the quality
rating of the graphical element. Arch Vis also allows stakeholders to view the properties of any selected
element, however graphical elements supp011 only one quality value, so if multiple quality measures are
present, the renderer to determine which quality measure takes precedence, or combine the two quality
measures in some way.
153

Figure 8-13 Quality shown as rust
Figure 8-13 indicates how a graphical element can have an association with a sphere that is at various stages
of rusting. From left to 1ight, the quality of the graphical element would be indicated as high quality to low
quality.
8.3.8 System Development
Scenario
Du1ing the construction of the system, architectural representations are used in a number of ways in all areas
of the life cycle. Designers will use the architecture in order to create interfaces between the major elements
of the architecture such as the components and connects. Developers will use the architecture representation
in order to gain an understanding of where their work fits into the system as a whole. Testers will use the
architecture representation in order to determine test plans, impact analysis and integration testing.
Maintainers will use the architecture in order to gain an understanding of the context of the changes they are
to make. Managers can also use architectural representations in order to track development, development
resources and plan budgets.
154
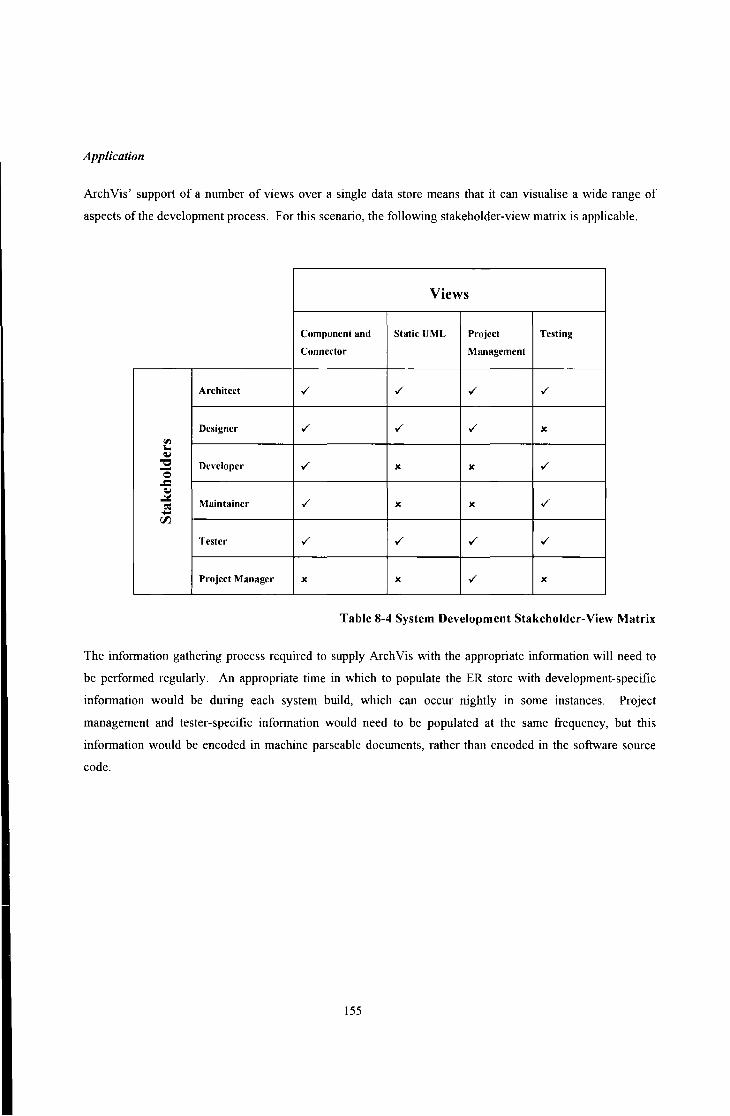
Application
Arch Vis' support of a number of views over a single data store means that it can visualise a wide range of
aspects of the development process. For this scenario, the following stakeholder-view matrix is applicable.
Views
Component and Static UML Project Testing
Connector Management
Architect ./ ./ ./ ./
Designer ./ ./ ./ X
"' I. ~
"0 Developer ./ X X ./ 0 .c ~
.::c: Maintainer ./ ~ X X ./ .... r.FJ.
Tester ./ ./ ./ ./
Project Manager X X ./ X
Table 8-4 System Development Stakeholder-View Matrix
The information gathe1ing process required to supply Arch Vis with the approp1iate information will need to
be pelformed regularly. An appropriate time in which to populate the ER store with development-specific
information would be during each system build, which can occur nightly in some instances. Project
management and tester-specific infmmation would need to be populated at the same frequency, but this
information would be encoded in machine parseable documents, rather than encoded in the software source
code.
155

Andrew Halch
SesslonHandle r
.. o ponSeni on() Yo id •valldal eSesalo n() vo id "' invallda teSeoss ion () : vo1 d
90.2%
Figure 8-14 Developer task assignment
Figure 8-14 shows how developer assignments are represented along with progress infonnation.
8.4 Informal Evaluation
The fmal part of evaluation is infonnal. The intention is to further explore both the potential of Arch Vis
along with some of its limitations. In order to comprehensively review Arch Vis, this section is divided into
several areas . Each of these areas represents a fundamental pati of the Arch Vis visualisation approach and
are discussed below.
8.4.1 Static Data Support
Arch Vis classifies data into two categories. Static data describes the static structures of the softwru·e system
in tenns of its elements and relationships. Static structures are those structures of the system that describe the
softwru·e before its execution. Transient data, the second category, is data that relates to the system during its
execution, and is described in the next section.
During the static data capture process, Arch Vis static tools take data from static data sources and represents
them in tenns of entities, relationships and properties . This is a process of decomposition, taking complex
structures and reducing them down into a set of entities and relationships with a number of associated
prope1ties. Whilst this data model of entities and relationships presents a very simple and flexible model to
work with, it also means that the data volume increases, and that to work with the complex data structure
156

dming later stages requires a re-composition process. This means that the visualisation has to work in order
to be able to use a higher-level data structure for visualisation.
Data expansion is also necessary as a result of the definition of equality of two entities. Two entities are equal
if and only if both their names and types are of equal value. Properties are not considered in this equality
check. One scenario in which problems can a1ise is when two entities of a pmticular type may have the same
name, but not be equal. One obvious example of this scenario is in the decomposition of classes in separate
packages. Consider a package com.company that contains class A and class B, and both classes have a
method do() that has the same signatme in each class. One way to encode this would be to have the following
entities shown (Table 8-5).
Entity name Entity type
com.company package
A Class
do() Method
B Class
do() Method
Table 8-5 Entity equality problem
The obvious problem is that there are two entities that are now equal when they should not. In order to
overcome this problem, Arch Vis uses a fully qualified path approach, meaning that the encoding would in
fact be as shown in Table 8-6.
157
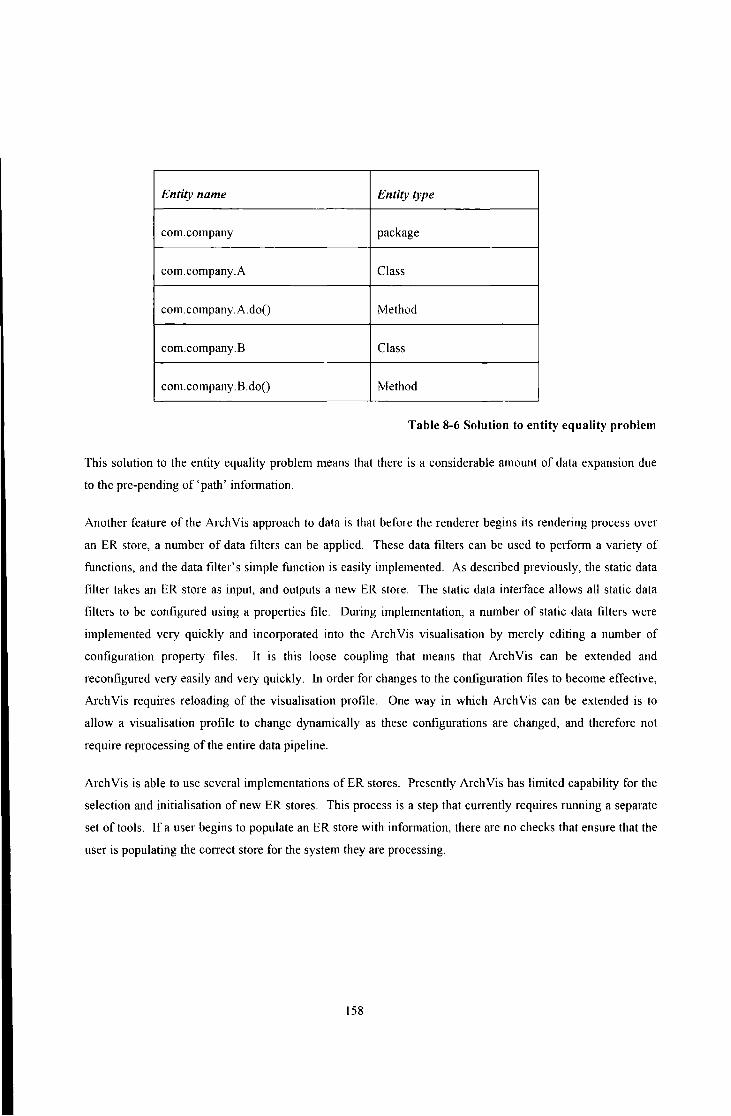
Entity name Entity type
com.company package
com.company.A Class
com.company.A.do() Method
com.company.B Class
com.company.B.do() Method
Table 8-6 Solution to entity equality problem
This solution to the entity equality problem means that there is a considerable amount of data expansion due
to the pre-pending of 'path' inf01mation.
Another feature of the Arch Vis approach to data is that before the renderer begins its rendering process over
an ER store, a number of data filters can be applied. These data filters can be used to perform a vmiety of
ftmctions, and the data ftlter's simple function is easily implemented. As described previously, the static data
filter takes an ER store as input, and outputs a new ER store. The static data interface allows all static data
filters to be configured using a properties file. During implementation, a number of static data filters were
implemented very quickly and incorporated into the Arch Vis visualisation by merely editing a number of
configuration property files. It is this loose coupling that means that Arch Vis can be extended and
reconfigured very easily and very quickly. In order for changes to the configuration files to become effective,
Arch Vis requires reloading of the visualisation profile. One way in which Arch Vis can be extended is to
allow a visualisation profile to change dynamically as these configurations are changed, and therefore not
require reprocessing of the entire data pipeline.
Arch Vis is able to use several implementations of ER stores. Presently Arch Vis has limited capability for the
selection and initialisation of new ER stores. This process is a step that cunently requires running a separate
set of tools. If a user begins to populate an ER store with information, there are no checks that ensure that the
user is populating the conect store for the system they are processing.
158

8.4.2 Renderers and Render Model Capability
Arch Vis clearly separates out the elements that make up a visual rendering, and the renderer that produces it.
This separation allows for many different implementations of the renderer interface, and each renderer can
use any of the graphical elements defined in the render model.
The render model uses a number of inte1faces by which two classes of graphical element can be built. They
are Drawable Node and DrawableRelationship. From these interfaces, any number of implementations can be
derived. Again, this provides a mechanism by which Arch Vis can easily be extended, and implementations of
new graphical elements are easily achieved.
Renderers are reliant on having the appropriate data presented to them. The configuration of a view in the
visualisation profile should be designed with the renderer in mind. The choice of data filters is crucial in
order to present the conect data to the renderer. Arch Vis' render pipeline does not provide a mechanism by
which a renderer can publish its data requirements to the static data providers that supply it.
8.4.3 Views
Views are designed with a number of stakeholders in mind. Arch Vis does not enumerate which stakeholders
are to be associated with a pmticular view. Stakeholders therefore do not have an easy means by which they
can determine which views are appropriate for them to use.
Fmther to this, views that may be related are not shown to be related - there is no means by which those
views can be shown as associated. As an exmnple, consider a system that has its architecture defined in a
number of views modelled in the UML. It would be useful to relate these views together.
When a view is asked to perform a render to generate a render model, Arch Vis passes the source data to the
first data filter, and then each filter in tum receives the output ER store from the previous data filter.
Relational infmmation is not kept from one ER store to the next such that an entity in one ER store does not
have a direct and formal relationship to the same entity in a previous ER store. This infonnation is
pmticularly useful when linking views together. If an element is selected in one view, and it is composed of a
number of elements in another view, this should be shown. However, as the relationship between the
composed element and its constituents is lost, this cannot easily be shown.
8.4.4 Implementation
The Arch Vis prototype tool is successful in demonstrating a system hy which architectural infmmation can be
successfully extracted from a va1iety of sources, and be consolidated into a reposito1y that can then be used to
159
visualise the system. Much of the focus of this tool has been to demonstrate a great degree of flexibility in
this approach to visualising software architecture. As such, much of the implementation has been on the data
extraction and view creation mechanisms rather than generating refined views of software architecture.
Several implementations of static data filters and renderers were given in order to demonstrate how these
components could be built in order to generate more refmed and complete visualisations. Given further work,
the full potential of this visualisation system could be realized.
8.5 Conclusions
This chapter has evaluated the research presented in the thesis, and has taken the evaluation approach
described in section 7.3 and applied it to Arch Vis. There are three distinct areas of evaluation. Firstly,
software architecture visualisation evaluation framework was applied to ArchVis. Secondly, a number of
scenarios were used in order to identify how Arch Vis supports various tasks in the life cycle of a software
system. Finally, ArchVis is described and evaluated informally. This informal evaluation explores some
areas of Arch Vis that are not uncovered in the fust two evaluation methods.
The feature-based evaluation framework applied to Arch Vis yields interesting results, indicating both positive
and negative aspects of the visualisation approach. The scenarios were most suited to showing how Arch Vis
performs in supporting various tasks that stakeholders in software architecture perform during the life cycle of
that software system. The results of these scenarios show that Arch Vis does perform well in certain areas of
architecture visualisation, but is less suited to situations where architectures change dynamically, or when
multiple software architectures are to be shown.
An empirical study would be useful in order to demonstrate how useful Arch Vis is to real stakeholders in real
software systems where factors that are not able to be recreated in scenarios come in to play.
160

Chapter 9: Conclusions
9.1 Introduction
Software architecture is increasingly being recognised as of fundamental importance to the success of
software engineering projects. Computer science has a history of abstraction, from machine code, to high
level languages, to design methods and design patterns. Software architecture forms part of this move in
abstraction, and is a high-level abstraction of software design. For a software system, there are a number of
stakeholders in the software architecture. The stakeholders reflect all aspects of the life cycle of that software,
from its inception by the architect to the purchase by the customer and deployment by technicians.
Software visualisation has very much concentrated its efforts on supporting developers and maintainers. This
is a feature of the fact that software visualisation has its roots in program comprehension. Software
architecture brings more stakeholders, and many existing software visualisations are not currently capable of
dealing with this. Many of the software architecture visualisation does not explicitly cater for stakeholders
other than architects and developers.
Architecture visualisations often have a limited capability to retrieve architectural information from the anay
of sources that contain such data. Source code is the typical means by which architectural information is
retrieved, but in modem applications architectural information can be found more readily in other places.
9.2 Summary of Research
This research presents a new approach to software architecture visualisation that addresses issues and
challenges raised through the analysis of software visualisation research and the cunent use of software
architecture.
Taking a practical approach to software architecture, this thesis identifies key ways in which architecture is
used, why it is used and who uses it. It is important to consider these pragmatic issues in software
architecture in order to ensure that the research would yield results that can be applicable to real world
software engineering problems. This philosophy also extended to consideration of how software architecture
is represented. Present day enterprise software has architectural information specified in places other than the
software source code, and recovery of this information is vital in being able visualise the architecture of these
classes of software systems.
This result of this research is an approach to software architecture visualisation that enables a number of
stakeholders to access the visualisation, and to see views of the software architecture that are relevant and
161

comprehensible by them. In this way, inter-stakeholder communication can be improved. In order to support
multiple stakeholders, the approach was designed to support a number of different representations of the
software architecture. This meant that the render pipeline had to be flexible and customisable at the
approp1iate stages of data recover, filtering and render model construction.
A prototype tool has been developed to demonstrate the applicability of the visualisation approach. This tool
demonstrates a significant propmtion of the concepts and strategies associated with the Arch Vis approach.
Development of the tool facilitated the application of the visualisation approach to real world software
systems and enabled an evaluation process.
To successfully evaluate the Arch Vis approach to software architecture visualisation, a new feature-based
evaluation framework had to be developed. Whilst software visualisation research has a number of evaluation
frameworks, none were particularly well suited to software architecture visualisation. This research presented
a new framework that inherits many characteristics from previous visualisation frameworks, and added
features that are particular to software architecture.
Evaluation of the visualisation approach took on three fonns. The software architecture visualisation
evaluation framework was applied to the Arch Vis visualisation approach. This results in a rating for each
feature. In order to explore how Arch Vis might be used in real world situations, a number of scenarios were
used and the way in which Arch Vis would support these tasks was described. Finally, an informal evaluation
described some aspects of Arch Vis that the framework and scenarios did not uncover.
9.3 Criteria for Success
At the beginning of this thesis, a set of criteria was given by which this research can be judged in te1ms of its
success. This section examines each criterion and discusses the degree to which it has been achieved.
9.3.1 Identify the current use of architecture visualisation in practice
by showing the tasks different stakeholders perform.
In chapter 2, the motivation and use of software architecture was introduced, including a discussion on the
stakeholders in a system's architecture. Chapter 3 discusses the cunent research in software architecture
visualisation and discusses how these might be applied to real world systems. One key finding in this thesis is
that architecture visualisations are generally not suited for the broad range of stakeholders in an architecture.
Typically, visualisations are suited to architects and developers only.
162

9.3.2 Address the visualisation issues of representing software
architecture for different stakeholders.
Chapter 2 identifies several classes of stakeholder in software architecture. Chapter 4 introduces the concept
of views of software architecture as much of software architecture literature discusses the necessity of having
different views. The IEEE standard for architectural descriptions [IEEE 14 71] makes a strong link between
views of software architecture and the stakeholders in that architecture and describes a model for maintaining
an explicit connection between the two. The Arch Vis approach, discussed in chapter 5, defines a view model
by which multiple views can be represented in a visualisation of an architecture. In this way, different
stakeholders can see the architecture from a viewpoint suited for them. Under evaluation, in section 8.2,
Arch Vis is partially successful in supporting multiple users simultaneously, but does score well in supporting
the communication of software architecture to a large number of stakeholders in that architecture.
9.3.3 Identify a mechanism for providing architectural information to
an architecture visualisation.
Architectural information can be found amongst a variety of collateral related to a software system, including
software source code and configuration information. Some of these representations are identified in chapter
2, and Arch Vis provides a mechanism by which many of these sources can be used for architectural
visualisation. This mechanism is described in detail in chapter 5. The application of the evaluation
framework in chapter 8 indicates that Arch Vis rates well in terms of retrieving both static and dynamic data.
9.3.4 Develop visual representations of software architectures that are
suited to the identified tasks.
Chapter 2 identifies the uses of software architecture in practice. Chapter 5 identifies five sets of views that
will support those tasks (component views, developer views, project manager views, technology and
deployment views, sales and marketing views). These views are developed within the ArchVis framework,
showing how the relevant data is captured, filtered and how a render model is generated from this to produce
the view. The evaluation of ArchVis (chapter 8) shows that whilst ArchVis provides good support for a
number of different views to support tasks, there are some tasks that are not directly supported.
163

9.3.5 Develop a proof of concept prototype tool to demonstrate the
visualisations.
The Arch Vis proof of concept tool was developed in the Java language and demonstrates many of the key
areas of the Arch Vis approach as identified in chapter 5. Implementation specific detail is reviewed in
chapter 6 for those features that were implemented.
9.3.6 Demonstrate that the visualisations
automatically with minimal disruption to
itself.
can be generated
the software system
The methods of static data extraction that Arch Vis supports vary from invasive techniques such as
instmmentation through to non-invasive techniques such as parsing the source using a language parser. Static
data collection again varies from invasive approaches such as instrumentation through to the use of a virtual
machine interface such as the Java debugger interface.
9.3. 7 Create a feature based evaluation framework suitable for
software architecture visualisation.
As research in software architecture visualisation has had little work canied out in evaluation, the only
available frameworks are for software visualisation, and these have problems in application to software
architecture visualisation. Chapter 7 introduces a new evaluation framework suited to software architecture
that is based on the p1inciples of software visualisation and cognitive psychology. This framework is then
used in Chapter 8 in the evaluation of Arch Vis.
9.4 Comparing Arch Vis
Comparing Arch Vis to the six other architecture visualisations identified m section 4.2, a number of
observations can be made.
The areas in which ArchVis performs well, with respect to the evaluation framework described in section
7.3.1, are in its capability of supporting both static and transient data, views and navigation. Compa1ing these
to existing architecture visualisations, no other perfmmed as well in static data and transient data support.
The closest tool to Arch Vis in terms of views and navigation is Enterprise Architect, the system that also
performed better in task support. Enterprise Architect, however, lacks in its support of static and transient
data.
164
9.5 Future Work
Architecture visualisation is a relatively unexplored research tenitmy. This thesis identifies several areas of
future work.
9.5.1 Architecture Representations
For software engineering outside of a research lab, there are many non-ideal scenarios. When software
architecture is considered, the use of ADLs in software projects is ve1y much limited to a few documented
cases. In order for architecture visualisation to be of significant use to software engineers, mechanisms must
exist for retrieving architectural information from a multitude of sources and consolidate that into a repository
of architectural information ready for visualisation. This thesis has presented an approach to this process, but
can be improved in a number of ways.
Firstly, the mechanism presented requires decomposition followed by re-composition by individual views.
This is computationally expensive, and could potentially be avoided. Secondly, the re-composition process
uses individual filters that do not maintain context or history infmmation from one filter to the next. This
means that tracing a render element back to the original data source is difficult.
9.5.2 Architectural Views
Perhaps one ofthe easiest ways to take this research forward with respect to the views described, is to provide
more implementations of renderers and to provide extensions to the library of graphical elements that can be
used by those renderers. There are many views that are not developed through Arch Vis that are frequently
used by developers -particularly collaboration views in UML.
Another area of research would be to examine how viewpoint definitions can be better represented in the
visualisation, and to explicitly map stakeholders and their concerns to the views that address those concerns.
These issues are not currently addressed adequately in Arch Vis.
In order to more effectively supp011 some tasks such as choosing from alternative architectures, and
evaluating as-implemented architectures against as-prescribed architectures, a visualisation should be able to
support the visualisation of multiple architectures concunently. Arch Vis supports the concurrent visualisation
of the render model produced by each architecture, but this is fundamentally different to having the full
architecture on hand to retrieve infonnation from.
Views presented here all rely on two-dimensional graphics in order to produce displays. As noted in chapter
3, some research in software visualisation has examined the use of three dimensions in order to convey new
165

perspectives on software, and to alleviate some of the problems posed by two-dimensional displays. This is
an avenue that can equally be explored for software architecture visualisation.
9.5.3 Implementation
In terms of the implementation of Arch Vis, there are two ways in which the work can be canied forward.
The first is to examine a possible mechanism by which multiple stakeholders can use the visualisation
concunently. This would improve on the cunent suppmt which is multiple stakeholders, but one at a time.
The second direction would be to examine the transient data support in Arch Vis. This is cmTently ve1y
limited to the model described in chapter 5 - which does not allow for the visualisation of changing
architectures; it simply allows transient events to be associated with elements in the render model.
9.6 Conclusion
This thesis has examined the fundamental principles of software architecture visualisation by looking at
software architecture, and software visualisation, and reported on the cunent state of research in these fields.
It has also examined the state of research in software architecture visualisation to date. From this, this
research then identifies the issues and challenges that face software architecture visualisation, and proposes a
new approach. This approach, called ArchVis, is described in detail along with details on how a prototype
tool was developed to demonstrate the principle concepts of the Arch Vis approach. Arch Vis demonstrates
how architectural infmmation that is relevant to a number of stakeholders can be retrieved and input into a
view model in such a way as to present views that are appropriate to the stakeholders. An evaluation of
Arch Vis identified its relative merits, and the future work describes ways in which the work of this thesis can
be canied forward.
166
References
[ AbdurazikOO]
[Allen97]
[Batrnan99]
[Barbacci98]
[Booch98]
[BoschOO]
[Bredemeyer99]
[BredemeyerOO]
A. Abdurazik, Suitability of the UML as an Architecture Description
Language with Applications to Testing, technical report ISE-TR-00-0 l,
Inf01mation and Software Engineering, George Mason University, 2000.
R. Allen and D. Garlan, A Formal Basis for Architectural Connection,
ACM Transactions on Software Engineering and Methodology, Vol. 6, No.
3, July 1997.
J. Batman, Characteristics of an Organization with Mature Architecture
Practices, Software Engineering Institute, Carnegie Mellon University,
Pittsburgh, PA, 1999.
M. R. Barbacci, S. J. Carriere, P. H. Feiler, R. Kazman, M. H. Klein,
H. F. Lipson, T. A. Longstaff and C. B. Weinstock, Steps in an
Architecture TradeoffAnalysis Method: Quality Attribute Models and
Analysis, technical report CMU/SEI -97-TR-029, Software Engineering
Institude, Carnegie Mellon University.
G. Booch, J. Rumbaugh, and I. Jacobson, The Unified Modeling
Language User Guide, Addison Wesley, 1998.
J. Bosch, Design and Use of Software Architctures: Adopting and Evolving
a Product-line Approach, ACM Press/Addison-Wesley, New York, 2000.
Architecting Process, Architecture Action Guide, Bredemeyer Consulting,
http://www.bredemeyer.com/pdf_files/ProcessGuide.PDF
D. Bredemeyer and R. Malan, The Role of the Architect. Bredemeyer
Cons luting, http://www. bredemeyer.com/pdf _files/role. pdf
167

[Breu97]
[Card99]
[Cannichael95]
[Chi98]
[Clements96]
[Code Viz]
[DiBattista88]
[EA]
[Eden01]
[Eden02]
R. Breu, U. Hinkel, C. Hofmann, C. Klein, B. Paech, B. Rumpe and V.
Thurner, Towards a Formalization of the Unified Modeling Language,
technical report TUM-19726, Institut fur Informatik, Technische Universitat
Mtinchen, 1997.
S. K. Card, J. D. Mackinlay and B. Shneiderman (Eds.), Information
Visualization: Using Vision to Think, Morgan Kaufmann, San Francisco,
1999
I. Carmichael, V. Tzerpos, and R. C. Holt, Design Maintenance:
Unexpected Architectural Interactions, IEEE Intemational Conference on
Software Maintenance, 1995.
E.H. Chi, J. Pitkow, J. Mackinlay, P. Pirolli, R. Gossweiler, and S.K.
Card. Visualizing the Evolution of Web Ecologies. Proc. ACM CHI 98
Conference on Hrnnan Factors in Computing Systems, ACM Press, Los
Angeles, Califomia, 1998. pp. 400-407
P. Clements and L. Northrop, Software Architecture: An E-recutive
Overview, technical report CMU/SEI-96-TR-003, ESC-TR-96-003,
Software Engineering Institute, Camegie Mellon, 1996.
M. Gorman, Code Viz Project, http://www.skynet.ie/-mel/projects/codeviz/
G. DiBattista, R. Tamassia and C. Batini, Automatic Graph Drawing and
Readability of Diagrams, IEEE Transactions on Systems, Man and
Cybemetics, Volume 18, Issue I, 1988, pp. 61-79.
Ente1prise Architect, Sparx Systems (http://www.sparxsystems.com.au/)
A.H. Eden, Visualization of Object Oriented Architecture, Proc. 23'd Int'l
Conf. Software Engineering. (ICSE 2001), Toronto, Ontario, Canada, 2001,
pp. 5-10.
A. H. Eden, LePUS: A Visual Formalismfor Object-Oriented
Architectures, 61h World Conference on Integrated Design and Process
Technology, Pasadena, Califomia, Jun. 2002.
168
[Eisenstadt90]
[Feijs88]
[Feijs98]
[FowlerOO]
[Garlan93]
[Garlan95]
[Garlan97]
[Globus95]
[Grundy98]
[GrundyOO]
[HatchOI]
M. Eisenstadt and M. Brayshaw, A Knowledge Engineering Toolkit, part
I, BYTE: The Small Systems JoumallO (10), 1990, pp. 268-282.
L. Feijs, R. Krikhaar, and R. A. Van Ommering, A relational approach
to support sc?ftware architecture analysis. Soft. Prac. Exp. 28, Apr. 1988,
pp. 371-400.
L.M.G. Feijs and R. de Jong, 3D Visualization o_{Software Architectures,
Communications of the ACM, vol. 4 I, no. I 2, Dec. 1998, pp. 72-78.
M. Fowler and K. Scott, UML Distilled, 2"d ed., Addison-Wesley, 2000.
D. Garlan and M. Shaw, An Introduction to So_fiware Architecture,
Advances in Software Engineering and Knowledge Engineering, V.
Ambriola, ed., G. Tortora, ed., vol. 1. World Scientific Publishing
Company, 1993, pp. 1-40.
D. Garlan, What is Style?, Proc. ofDagshtul Workshop on Software
Architecture, Saarbruecken, Getmany, Feb. 1995.
D. Garlan, R. Monroe, D. Wile, Acme: An Archilcture Description
Interchange Language, Proceedings ofCASCON'97, Nov. 1997.
A. Globus, and S. Uselton, Evaluation of Visualization Software, Report NAS-
95-005, Computer Science Corporation, NASA Ames Research Center, 1995
J. Grundy, R. Mugridge and J. Hosking, Visual Specification of Multi
View Visual Environments, IEEE Symposium on Visual Languages,
Halifax, Nova Scotia, Canada, Sep. 1998, IEEE CS Press
J.C Grundy and J.G. Hosking, High-level Static and Dynamic
Visualisation of Software Architectures, Proc. IEEE Symposium on Visual
Languages, (VL'OO), Seattle, Washington, Sept. 2000.
A. S. Hatch, M. P. Smith, C. M. B. Taylor and M. Munro, No Silver
Bullet for Software Visualisation Evaluation, Proceedings of the Workshop
on Fundamental Issues of Visualization, Proceedings of The Intemational
Conference on Imaging Science, Systems and Technology (CISST), Las
Vegas, USA, June 2001, pp. 651-657.
169

[Hewett99]
[IEEE 14 71]
[Instance Store]
[Kazman99]
[Kehoe99]
[Kitchenham96]
[Klein99]
[KnightOO]
[Kruchten95]
[Lanza02]
[Leintz80]
T. T. Hewett, Human-Computer Interaction and Cognitive P~ychology in
Visualization Education, Proceedings of Graphics and Visualization
Education Workshop, SIGGRAPH, Portugal, July 1999.
IEEE Std. 1471-2000, IEEE Recommended Practice for Architectural
Description of Software Intensive Systems, IEEE, Picstataway, N. J., 2000.
Instance Store, Information Management Group, University of Manchester,
http://instancestore.man.ac.uk
R. Kazman and S.J. Carriere, Playing Detective: Reconstructing
Software Architecture from Available Evidence, Journal of Automated
Software Engineering, vol. 6, no. 2, Apr. 1999, pp. 107-138.
C. Kehoe, J. Stasko and A. Taylor, Rethinking the Evaluation of
Algorithm Animations as Learning Aid5: An Observational Study, technical
report GIT-GVU-9910, Graphics, Visualization and Usability Center,
College of Computing, Georgia Institute ofTechnoiO!:,ry, 1999.
B. Kitchen ham and L. Jones, Evaluating Software Engineering Methods
and Tools. Part]: The Evaluation Contexl and Evaluation Melhod5,
Software Engineering Notes, Vol. 21, No. 1, Jan. 1996. pp. 12-15.
M.H. Klein and R. Kazman, Attribule-Based Architectural Styles,
technical report CMU/SEI-99-TR-022, ESC-TR-99-022, Software
Engineering Institute, Carnegie Mellon, 1999.
C. Knight, Virtual Software in Realily, PhD Thesis, Depmtment of
Computer Science, University of Durham, June 2000.
P. Kruchten, 1'he "4+ 1" View Model of Software Architecllire, IEEE
Software, vol. 12, no. 6, Nov. 1995, pp. 42-50.
M. Lanza, CodeCrmFier- A Lighweight Software Visualization Tool,
Software Composition Group, University of Bern, Switzerland, 2002.
B. P. Lientz and E.F. Swanson, Software Maintenance Management: A
Study of the Maintenance of Computer Application Software in 487 Data
Processing Organizations, Addison-Wesley Reading, MA., 1980.
170
[Mayrhauser98]
[Medvidovic97]
[Monroe96]
[Moriconi95]
[UML]
[Peny92]
[Price93]
[Robbins97]
[Sander95]
[Shneidennan96]
A. von Mayrhauser, and A.M. Vans, Program Understanding BeiUJviour During
Adaption of Large Scale Software, 6th International Workshop on Program
Comprehension, IEEE Computer Society, Ischia, Italy, 1998, pp.164-172
N. Medvidovic and D. S. Rosenblum, Domains of Concern in Software
Architectures and Architecture Description Languages, Proc. Of USENIX
Conference on Domain-Specific Languages, 1997.
R. T. Monroe, A. Kompanek, R. Melton, and D. Garlan, Stylized
Architecture, Design Pattems, and Objects", IEEE Software, Jan 1996, pp.
43-52.
M. Moriconi, X. Qian, and R. A. Riemenshneider, Correct Architecture
Refinement, IEEE Transactions on Software Enginee1ing, vol. 21, no. 4,
Apr. 1995, pp. 270-283.
OMG Unified Modeling Language Specification, Object Management
Group, www.omg.org
D.E. Perry and A.L. Wolf. Foundationsfor the Study of Software
Architecture, Proc. ACM SIGSOFT. (SIGSOFT '92), Software
Engineering Notes, vol. 17, no. 4, Oct. 1992, pp. 40-52.
B. A. Price, R. M Baecker and I. S. Small, A Principled Taxonomy of
Software Visualization, Jouma1 of Visual Languages and Computing, Vol.
4, No.3, pp. 211-266, 1993.
J. E. Robbins, D. F. Redmiles and D. S. Rosenblum, Integrating C2 with
the Unified Modeling Language, Proc. Califomia Software Symposium,
hvine, CA, Nov. 1997.
G. Sander, VCG: Visualization ofCompiler Graphs, technical report A01-
95, Universitat des Saarlandes, FB 14 Informatik, 1995.
B. Shneiderman, The Eyes Have It: A Task by Data Type Taxonomy For
Information Visualizations, Proceedings for IEEE Symposium on Visual
Languages, IEEE Service Center, Sep 3-6, 1996, pp. 336-343.
171

[Shneidennan98]
[Shaw96]
[Sim99]
[Soni95]
[Smith02]
[Standish84]
[Storey99]
[Storey02]
[Struts]
[Taylor02]
[Tufte92]
B. Shneiderman, Designing the User Inteiface: Strategiesfor h1fective
Human-Computer Interaction, (3rd ed. ed.). Addison-Wesley, 1998.
M. Shaw and D. Garlan, Software Architecture: Perspectives on an
Emerging Discipline, Prentice Hall, New Jersey, 1996
S. E. Sim, C. L.A. Clarke, R. C. Holt and A. M. Cox, Browsing and
Searching Software Architectures, Proc. International Conference on
Software Maintenance, Oxford, England, Sep. 1999, pp. 381-390
D. Soni, R. Nord, and C. Hofmeister, Soflll'are Architecture in Industrial
Applications, International Conference on Software Engineering
M. Smith and M. Munro, Runtime Visualisation a,[ Object Oriented
Software, Proceedings of the IEEE I'' International Workshop on
Visualizing Software for Understanding and Analysis, Paris, pages 81-89,
June 2002.
T. A. Standish, An essay on software reuse, IEEE Transactions on
Software Engineering, Vol. I 0, No. 5, pages 494-497, 1984.
M.-A.D. Storey, F.D. Fracchia, and H.A. Miiller, Cognitive Design
Elements to Support the Construction of a Mental Model during Software
Exploration,JournalofSoftwareSystems, Vol44, 1999.pp.l71-185.
M. A. Storey, C. Best, J. Michaud, D. Rayside, M. Litoiu and M.
Musen, ShriMP Vie11•s: An Interactive Environment for Information
Visualization and Navigation, Computer-Human Interaction Conference
2002.
Jakarta StJuts, Apache Jakarta Project (http://jakarta.apache.org)
C. Taylor and M. Munro, Revision Towers, Proceedings ofthe IEEE 1st
International Workshop on Visualizing Software for Understanding and
Analysis, Paris, pages 43-50, June 2002.
E. R. Tufte, The Visual Display of Quantitative Information, Graphics
Press, February 1992 rep1int.
172

[Vestal93]
[Wiss98]
[Young97]
S. Vestal, A Cursory Overview and Comparison of Four Architecture
Description Languages, technical report, Honeywell, Technology Center,
1993.
U. Wiss, D. Carr, and H. Jonsson, Evaluating 3-Dimemiona/ Information
Visualization Desigm: a Ca1·e Study, Proc. IEEE Conference on Information
Visualization, London, England, July 29-31, 1998, pp. 137-144.
P. Young, A New View ofCa/1 Graphs for Visualising Code Structures,
technical repmt, Research Institute in Software Evolution, University of
Durham, 1997.
173