e file and content solutions - hitachi data systems
TRANSCRIPT
THIS REPORT CONTAINS ASSESSMENTS OF COMMODITY AND TRADE ISSUES MADE
BY USDA STAFF AND NOT NECESSARILY STATEMENTS OF OFFICIAL U.S.
GOVERNMENT POLICY
Required Report - public distribution
Date: 3/18/2010
GAIN Report Number: ID1008
Indonesia
Oilseeds and Products Annual
Oilseeds and Products 2010
Approved By:
Dennis Voboril
Prepared By:
Aji K. Bromokusumo/Jonn Slette
Report Highlights:
The Government of Indonesia (GOI) has targeted production levels to reach 40 million metric tons
(MT) by 2020. This target is double current levels of palm oil production and would increase areas
of production from current levels of approximately eight million hectares to at approximately 15
million hectares. Also, there has been no significant impact from the reported El Nino on Indonesian
palm oil production.
Executive Summary:
Indonesian palm oil production levels continue to increase. The Government of Indonesia (GOI) has
targeted production levels to reach 40 million metric tons (MT) by 2020. This target is double current
levels of palm oil production and would increase areas of production from current levels of
approximately eight million hectares to at approximately 15 million hectares. Also, there has been no
significant impact from the reported El Nio on Indonesian palm oil production.
The GOI also plans to shift the Indonesian palm oil industry to more sustainable, differentiated palm
oil production, focused on food-based and energy-based products. To achieve these goals, the GOI
has announced the Framework for Palm Oil Development 2010 and Beyond.
Commodities:
Oil, Palm
Production:
Indonesian palm oil production levels continue to increase. The Government of Indonesia (GOI) has
targeted production levels to reach 40 million metric tons (MT) by 2020. This target is double current
levels of palm oil production and would increase areas of production from current levels of
approximately eight million hectares to at approximately 15 million hectares. Also, there has been no
significant impact from the reported El Nio on Indonesian palm oil production.
The GOI also plans to shift the Indonesian palm oil industry to more sustainable, differentiated palm oil
production, focused on food-based and energy-based products. To achieve these goals, the GOI has
announced the Framework for Palm Oil Development 2010 and Beyond.
The objectives of the Framework are as follows:
1. Promoting Palm Oil base Industrial Cluster Area Development
2. Sustainable Palm Oil Systems
3. Palm Oil Estate Revitalization
4. Palm-Oil-Base-Biofuel Development
5. Incentive for Value Added and Down Stream Industry of Palm Oil
6. Promotion and Support
As stated above as the first Framework objective, the GOI has announced the development of the Palm
Oil Industrial Cluster Area Development program, which includes the Special Economic Zone Facilities
Policy. Under this policy, the following palm oil production areas have been identified as critical:
Sei Mangke, Kuala Tanjung, North Sumatera
Maloy, East Kalimantan
Kuala Enok, Riau
Dumai, Riau
Also under this policy, the following production areas have been identified as areas of high potential for
future development:
Jambi, Sumatera
West Sumatera
West Kalimantan
Because of strong pressure on the Indonesian palm oil industry from the European Union (EU), more
and more palm oil facilities are committing to sustainable expansion. The Indonesian palm oil industry
is also actively promoting the Indonesian crude palm oil as sustainable and meets Roundtable for
Sustainable Palm Oil (RSPO) guidelines
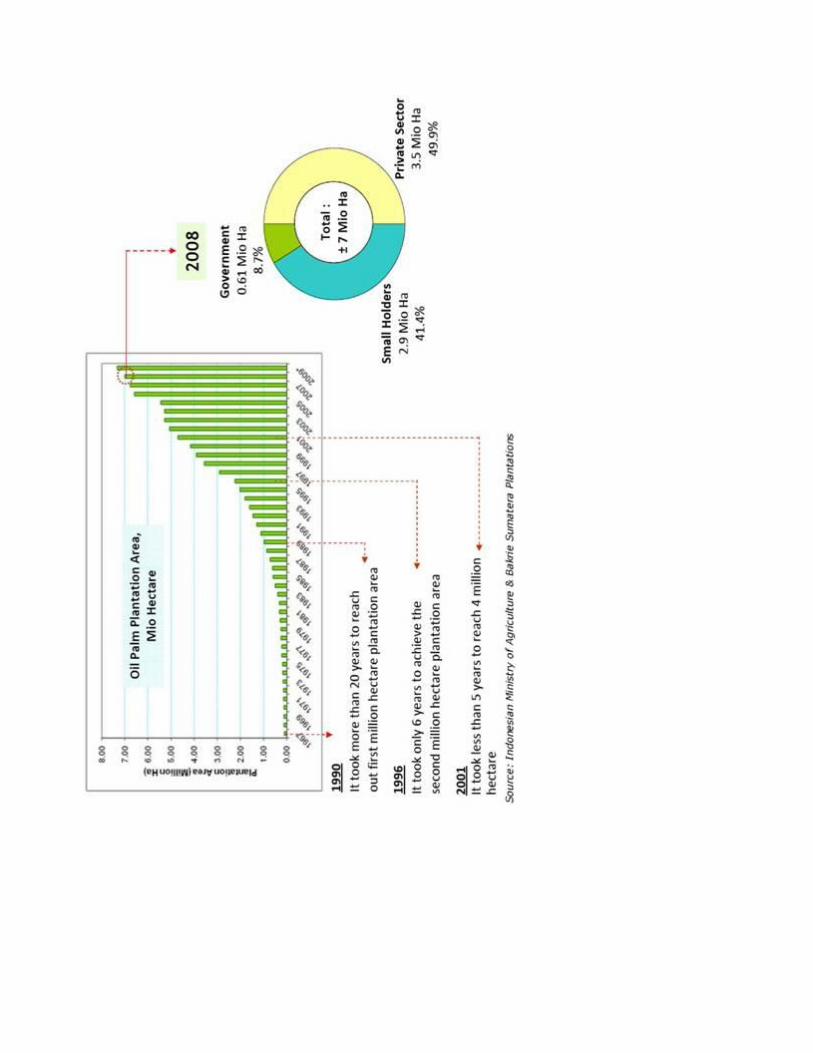
The Foreign Agricultural Service‟s Office of Agricultural Affairs in (FAS) Jakarta, forecasts that
approximate planting areas in 2010/11 will be 8.2 million hectares. This number is slightly higher than
the GOI forecast of 7.8 million hectares. Some press and government reports have indicated the
expansion of oilpalm plantations in 2010 at between 2-3 million hectares. Post believes this figure is
unlikely, considering the limited levels of land available and suitable for growing oilpalm. The most
realistic estimate for 2010/11 oilpalm production area growth is approximately one million additional
hectares over production area in 2009/10. More specifically, production areas will increase from 7.2
million hectares in 2009/10 to 8.2 million hectares in 2010/2011.
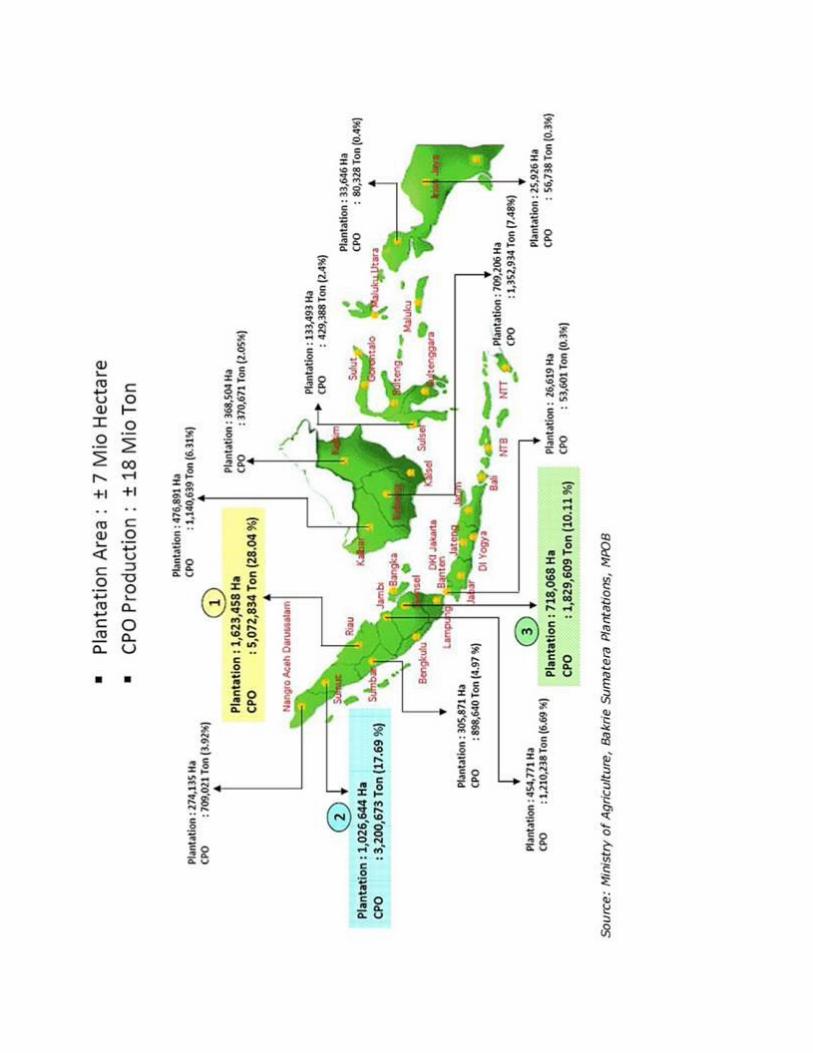
Plantation Area and Production in 2009/10:
Existing Oilpalm Plantations Area Map:
Consumption:
Total consumption of CPO and its derivative will continue to increase. CPO is widely used in various
sectors, including:
Food sectors (cooking oil, instant noodles, shortening, pastries and bakeries)
Biodiesel, possible increase if crude oil prices increase
Oleochemicals
Processed food (chocolate, ice cream, margarine)
Biomass from oilpalm crushing usually for electricity generator, self-sufficient power plant in the
plantations and oilpalm crushing facilities.
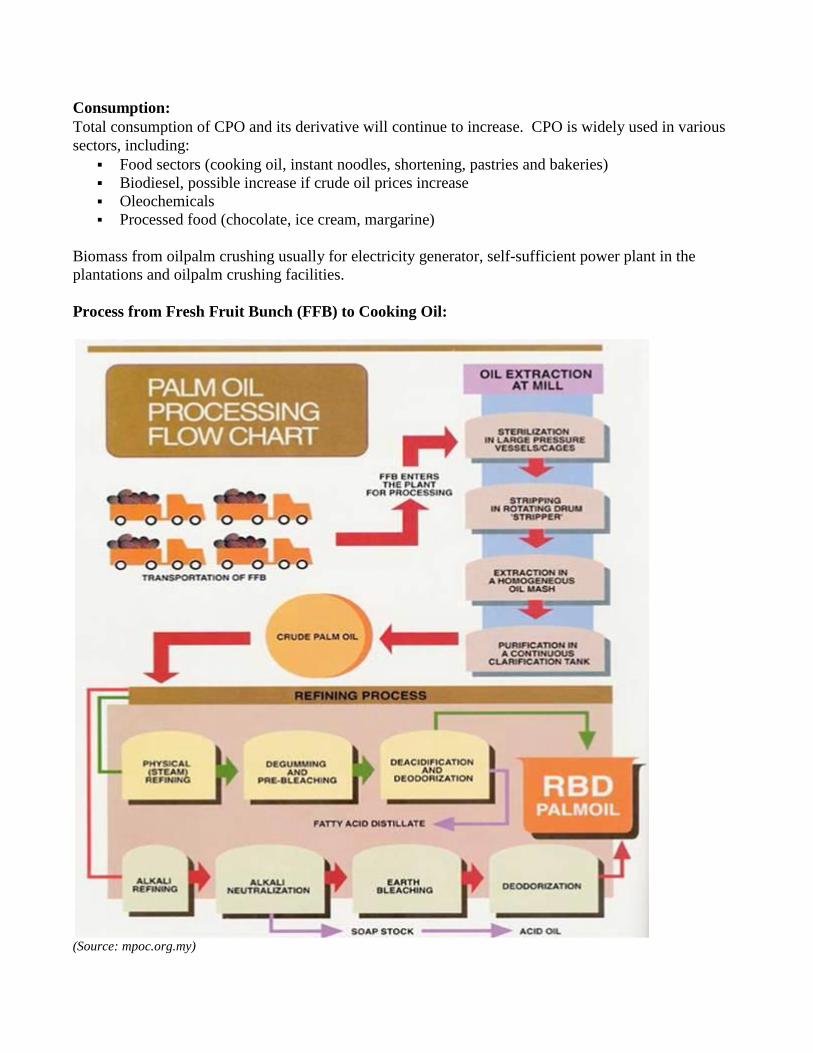
Process from Fresh Fruit Bunch (FFB) to Cooking Oil:
(Source: mpoc.org.my)
The primary processes are actually refining and fractionating. Refining consists of:
Bleaching (to absorb pigment and dirt)
De-acidification (to coagulate contaminants)
Deodorization
Thermal decomposition of carotene (to clarify color)
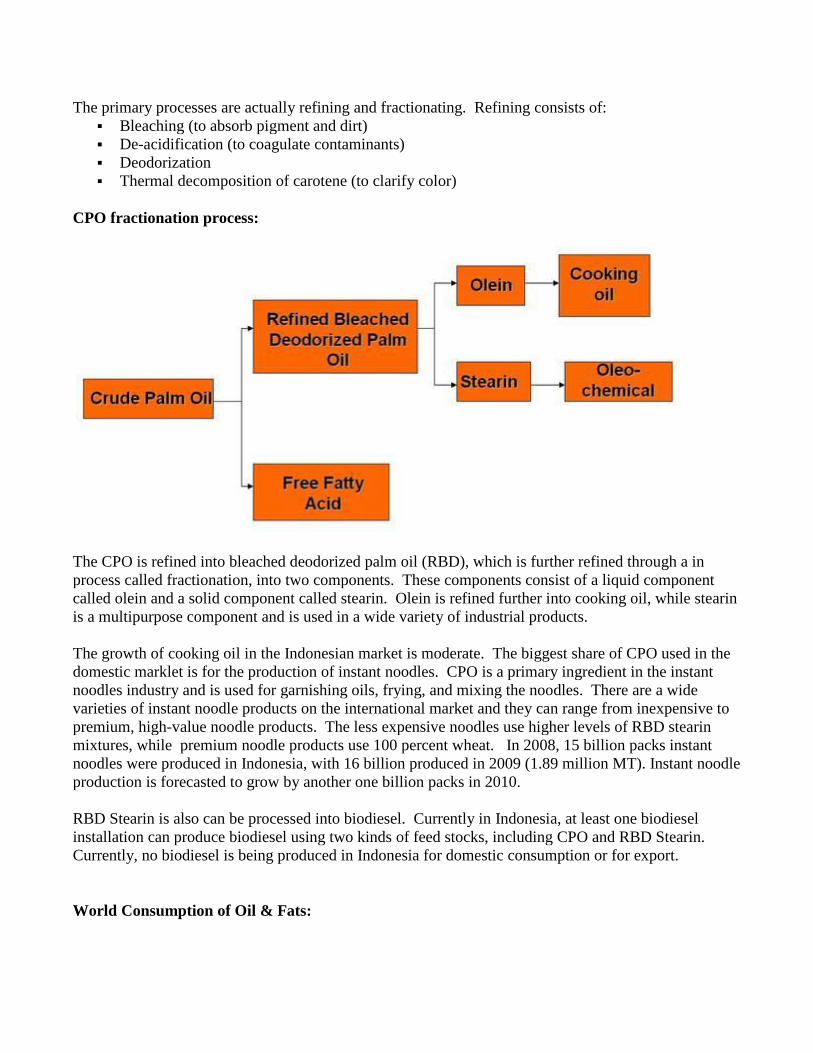
CPO fractionation process:
The CPO is refined into bleached deodorized palm oil (RBD), which is further refined through a in
process called fractionation, into two components. These components consist of a liquid component
called olein and a solid component called stearin. Olein is refined further into cooking oil, while stearin
is a multipurpose component and is used in a wide variety of industrial products.
The growth of cooking oil in the Indonesian market is moderate. The biggest share of CPO used in the
domestic marklet is for the production of instant noodles. CPO is a primary ingredient in the instant
noodles industry and is used for garnishing oils, frying, and mixing the noodles. There are a wide
varieties of instant noodle products on the international market and they can range from inexpensive to
premium, high-value noodle products. The less expensive noodles use higher levels of RBD stearin
mixtures, while premium noodle products use 100 percent wheat. In 2008, 15 billion packs instant
noodles were produced in Indonesia, with 16 billion produced in 2009 (1.89 million MT). Instant noodle
production is forecasted to grow by another one billion packs in 2010.
RBD Stearin is also can be processed into biodiesel. Currently in Indonesia, at least one biodiesel
installation can produce biodiesel using two kinds of feed stocks, including CPO and RBD Stearin.
Currently, no biodiesel is being produced in Indonesia for domestic consumption or for export.
World Consumption of Oil & Fats:
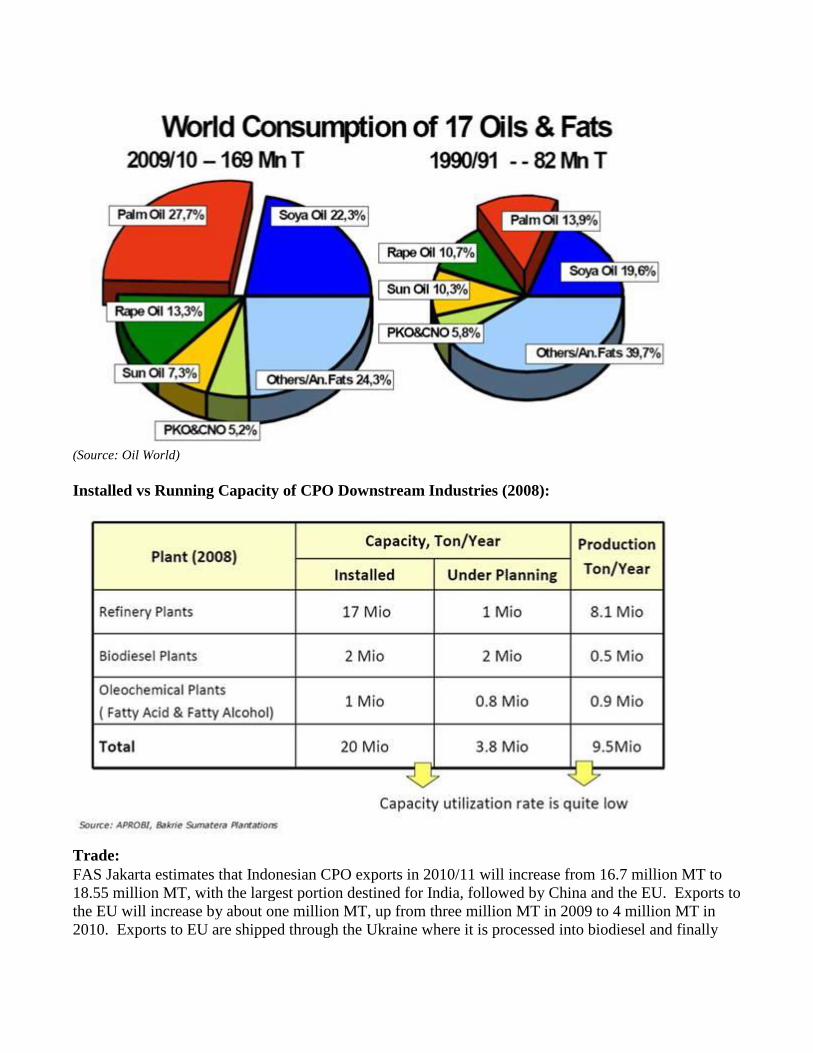
(Source: Oil World)
Installed vs Running Capacity of CPO Downstream Industries (2008):
Trade:
FAS Jakarta estimates that Indonesian CPO exports in 2010/11 will increase from 16.7 million MT to
18.55 million MT, with the largest portion destined for India, followed by China and the EU. Exports to
the EU will increase by about one million MT, up from three million MT in 2009 to 4 million MT in
2010. Exports to EU are shipped through the Ukraine where it is processed into biodiesel and finally

shipped to Germany. This is done because of EU Renewable Energy Directive (December 2008), which
prevents palm-based biodiesel entering the market.
Historically, Indonesian exports to China have been significant. However, since 1999 Indonesian CPO
exports to China have been replaced by Malaysian CPO. This has occurred because of the sharp
increase of Indonesian CPO export tax in 1998-1999, reached up to 62 percent and impacted CPO price,
which then completely dropped away the Indonesia export to China. China considers Indonesia is
inconsistent and non-transparent CPO trade policy. Moreover, the Indonesian palm oil industry has
done much less promotion in China, while Malaysia‟s palm oil industry has aggressively conducted
promotional activities throughout China.
Stocks:
Ending stock in 2010/11 will be 1.5 million MT. The GOI will maintain this level stock to stabilize
non-branded bulk cooking oil prices when the prices experience normal, seasonal fluctuations. Cooking
oil price spikes usually coincide with holiday, particularly Ramadan, Idul Fitri, Christmas, New Year
and Chinese New Year.
Prices of Cooking Oil (Branded and Non-branded-bulk) in 2009:
(Source: Commodity Futures Trade Regulatory Agency – CoFTRA)
Spot Price CPO & Olein 2009
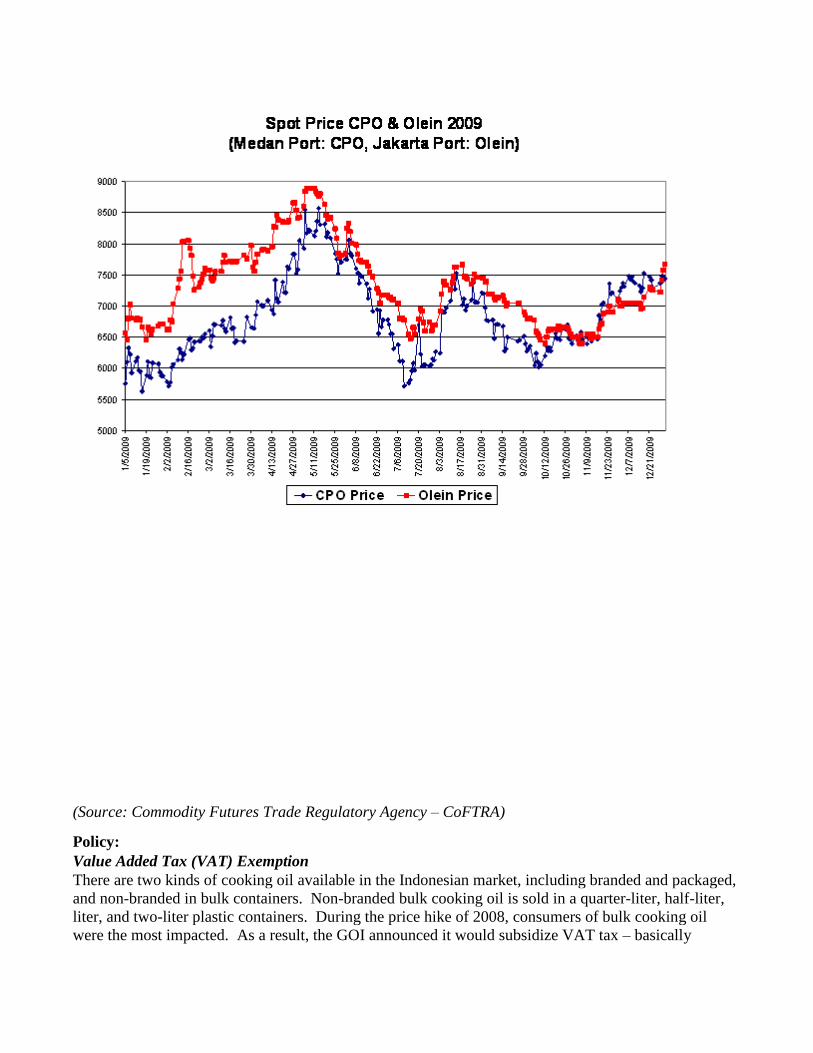
(Source: Commodity Futures Trade Regulatory Agency – CoFTRA)
Policy:
Value Added Tax (VAT) Exemption
There are two kinds of cooking oil available in the Indonesian market, including branded and packaged,
and non-branded in bulk containers. Non-branded bulk cooking oil is sold in a quarter-liter, half-liter,
liter, and two-liter plastic containers. During the price hike of 2008, consumers of bulk cooking oil
were the most impacted. As a result, the GOI announced it would subsidize VAT tax – basically
providing a VAT exemption on cooking oil. In 2009, the GOI allocated Rp. 800 billion ($80 million)
for a VAT exemption of non-branded-bulk cooking oil and under a program called Minyak Kita
(literally, „our oil‟). In January 2010, GOI announced the reduced allocation for VAT exemption of Rp.
250 billion (about $25 million) under this program. The GOI also urged cooking oil producers to be
“socially responsible” and provide affordable cooking oil.
The GOI has also urged producers of non-branded, bulk cooking oil to switch to packed cooking oil,
considering health benefits. Non-branded, bulk cooking oil is usually sold in plastic bags, often of
questionable quality. When the bags are transported the sun exposure, heat and high humidity can alter
the chemical composition of the bags, which can cause dangerous and/or harmful materials to seep into
the cooking oil.
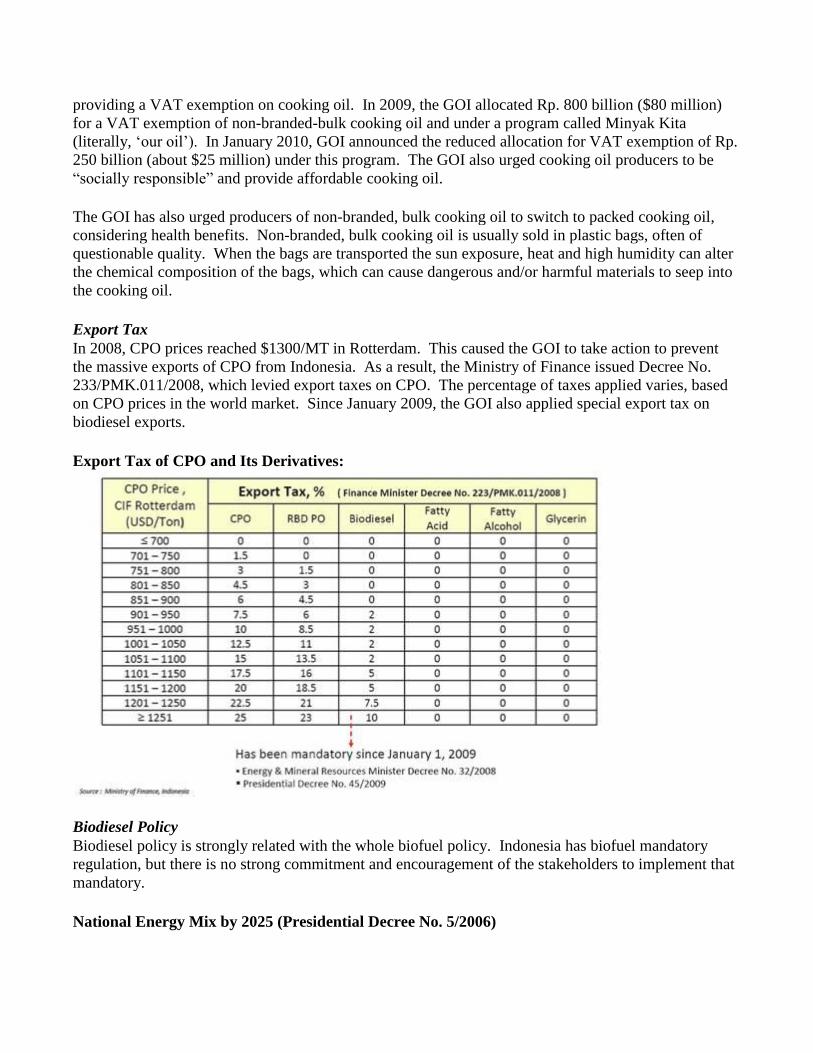
Export Tax
In 2008, CPO prices reached $1300/MT in Rotterdam. This caused the GOI to take action to prevent
the massive exports of CPO from Indonesia. As a result, the Ministry of Finance issued Decree No.
233/PMK.011/2008, which levied export taxes on CPO. The percentage of taxes applied varies, based
on CPO prices in the world market. Since January 2009, the GOI also applied special export tax on
biodiesel exports.
Export Tax of CPO and Its Derivatives:
Biodiesel Policy
Biodiesel policy is strongly related with the whole biofuel policy. Indonesia has biofuel mandatory
regulation, but there is no strong commitment and encouragement of the stakeholders to implement that
mandatory.
National Energy Mix by 2025 (Presidential Decree No. 5/2006)
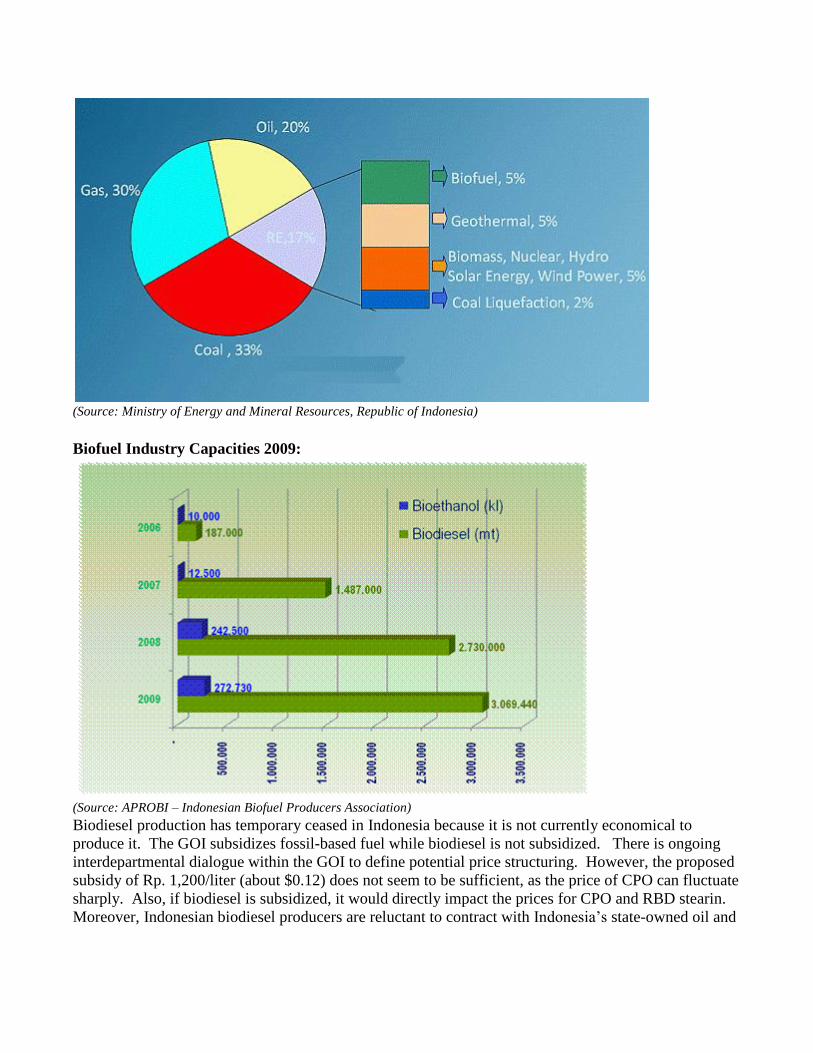
(Source: Ministry of Energy and Mineral Resources, Republic of Indonesia)
Biofuel Industry Capacities 2009:
(Source: APROBI – Indonesian Biofuel Producers Association)
Biodiesel production has temporary ceased in Indonesia because it is not currently economical to
produce it. The GOI subsidizes fossil-based fuel while biodiesel is not subsidized. There is ongoing
interdepartmental dialogue within the GOI to define potential price structuring. However, the proposed
subsidy of Rp. 1,200/liter (about $0.12) does not seem to be sufficient, as the price of CPO can fluctuate
sharply. Also, if biodiesel is subsidized, it would directly impact the prices for CPO and RBD stearin.
Moreover, Indonesian biodiesel producers are reluctant to contract with Indonesia‟s state-owned oil and
gas company, Pertamina, because they do not want to be forced into supplying Pertamina with biodiesel
at a loss.
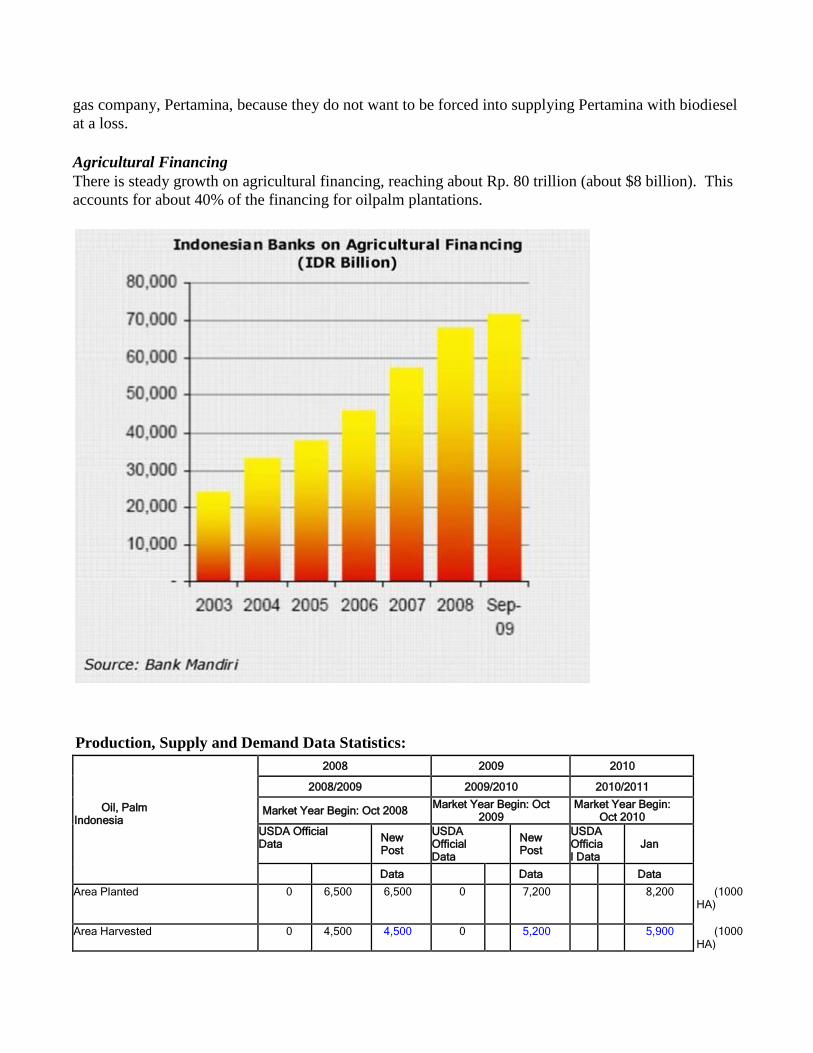
Agricultural Financing
There is steady growth on agricultural financing, reaching about Rp. 80 trillion (about $8 billion). This
accounts for about 40% of the financing for oilpalm plantations.
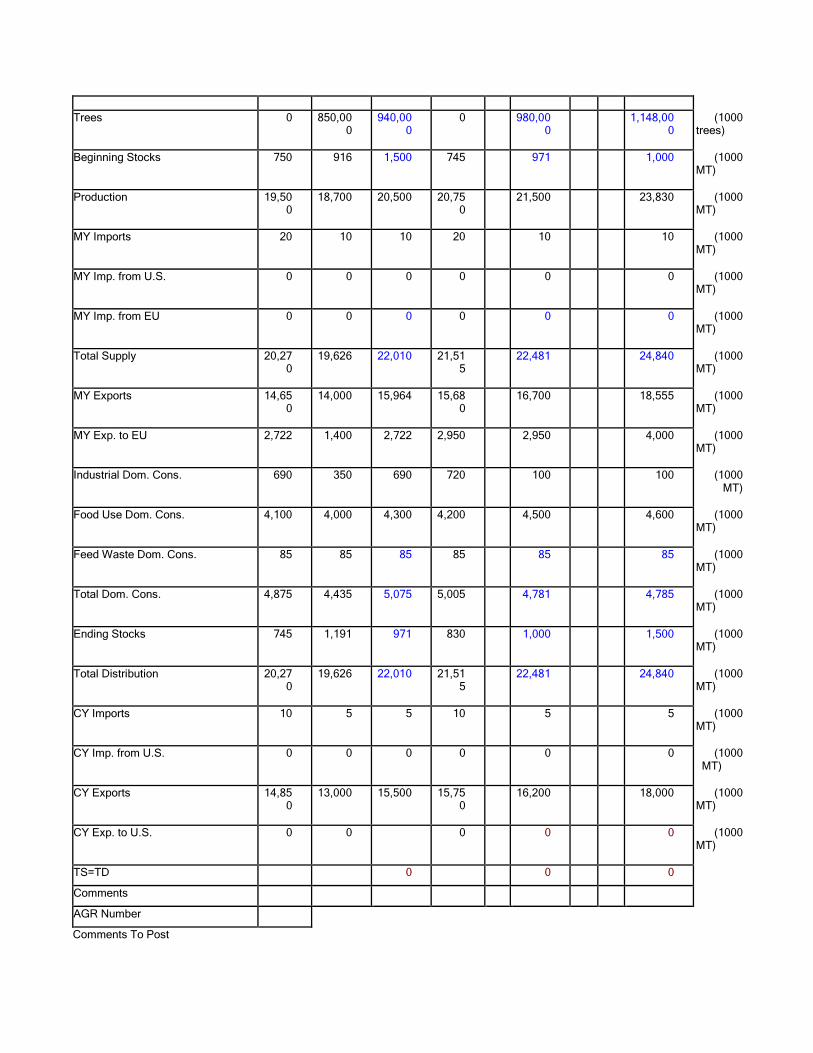
Production, Supply and Demand Data Statistics:
Oil, Palm Indonesia
2008 2009 2010 2008/2009 2009/2010 2010/2011
Market Year Begin: Oct 2008 Market Year Begin: Oct 2009
Market Year Begin: Oct 2010
USDA Official Data New
Post USDA Official Data
New Post
USDA Official Data
Jan
Data Data Data Area Planted 0 6,500 6,500 0 7,200 8,200 (1000
HA)
Area Harvested 0 4,500 4,500 0 5,200 5,900 (1000 HA)
Trees 0 850,00
0 940,00
0 0 980,00
0 1,148,000
(1000 trees)
Beginning Stocks 750 916 1,500 745 971 1,000 (1000
MT)
Production 19,500
18,700 20,500 20,750 21,500 23,830 (1000
MT)
MY Imports 20 10 10 20 10 10 (1000 MT)
MY Imp. from U.S. 0 0 0 0 0 0 (1000
MT)
MY Imp. from EU 0 0 0 0 0 0 (1000 MT)
Total Supply 20,27
0 19,626 22,010 21,51
5 22,481 24,840 (1000 MT)
MY Exports 14,65
0 14,000 15,964 15,68
0 16,700 18,555 (1000 MT)
MY Exp. to EU 2,722 1,400 2,722 2,950 2,950 4,000 (1000
MT)
Industrial Dom. Cons. 690 350 690 720 100 100 (1000 MT)
Food Use Dom. Cons. 4,100 4,000 4,300 4,200 4,500 4,600 (1000
MT)
Feed Waste Dom. Cons. 85 85 85 85 85 85 (1000 MT)
Total Dom. Cons. 4,875 4,435 5,075 5,005 4,781 4,785 (1000
MT)
Ending Stocks 745 1,191 971 830 1,000 1,500 (1000 MT)
Total Distribution 20,27
0 19,626 22,010 21,51
5 22,481 24,840 (1000 MT)
CY Imports 10 5 5 10 5 5 (1000
MT)
CY Imp. from U.S. 0 0 0 0 0 0 (1000 MT)
CY Exports 14,85
0 13,000 15,500 15,75
0 16,200 18,000 (1000 MT)
CY Exp. to U.S. 0 0 0 0 0 (1000
MT)
TS=TD 0 0 0 Comments AGR Number Comments To Post
Commodities:
Oilseed, Soybean
Production:
Indonesian soybean production has been slow to flat over the past several years due to low market
prices. Tempe, tofu and soymilk producers prefer to use imported soybeans because of better, more
consistent quality. U.S. soybeans are especially valued because of their superior quality and texture,
which are particularly important considerations for the Indonesian market, as the soybeans are
minimally processed directly into human food.
Although the GOI has expressed its desire to become self-sufficient in soy production by 2015, Post
believes it is unlikely this can actually be achieved, as current soybean production areas are not being
increased annually.
On 12 February 2010, the GOI launched its Food Estate Program in Merauke, Papua. Through this
program, the GOI has identified 1.6 million hectares for mechanized agricultural production, with the
objective of guaranteeing Indonesia‟s future food self-sufficiency. According to sources, 500,000
hectares of the available 1.6 million will be planted with corn, soybeans, and rice. The main goal to
have Food Estate Program is to achieve agricultural economies of scale by enlarging food crop growing
areas and switching from traditional agricultural practices to more modern, mechanical practices.
However, the Food Estate Program still needs to be developed and implemented. A main problem is the
lack of infrastructure, particularly transportation. The majority (60 percent) of the Indonesia‟s
population is located on the island of Java. The distant between Merauke to the two main Javanese
cities are as follows:
Jakarta: 3,703 km (2,300 miles), roads equivalent about 4,258-4,630 km (2,046-2,876 miles),
2,298-2,498 nautical miles.
Surabaya: 3,040 km (1,890 miles), roads equivalent 3,500-3,800 km (2,173-2,362 miles), 1,887-
2,051 nautical miles.
Because Indonesian seaports lack capacity, transportation will become the biggest challenge of the Food
Estate Program. Input materials, including seeds, fertilizers, pesticides, insecticides, and equipment,
will also pose a major challenge. Finally, the conversion of the land will become another challenge, as
the Ministry of Forestry has not approved any land conversion activities under the Food Estate Program.
Soybean production remains relatively low, although there is at least one multinational company
working with Indonesian farmers in growing black soybeans for soy sauce production. This company
works with farmer cooperatives, currently about 7,000 farmers on 1,500 hectares (still growing). Black
soybeans were traditionally grown in West Java, but are now grown throughout Java due to the suitable
climate for this specific type of soybean.
Black soybean is a „forgotten crop‟, abandoned until the company made a research cooperation with a
state university in Yogyakarta (Central Java) to develop professional breeding and resulted in a new
variety. This variety, named Mallika, has produced high yields and has been officially registered with
the Ministry of Agriculture.
Consumption:
Indonesia has a history of strong soybean consumption. Tempe and tofu are main protein source for
many Indonesian people and are staple protein sources for lower-income consumers. In addition to
tempe and tofu, the production of sweet soy sauce and tauco, a traditional, fermented soybean product,
are significant uses of U.S. soy.
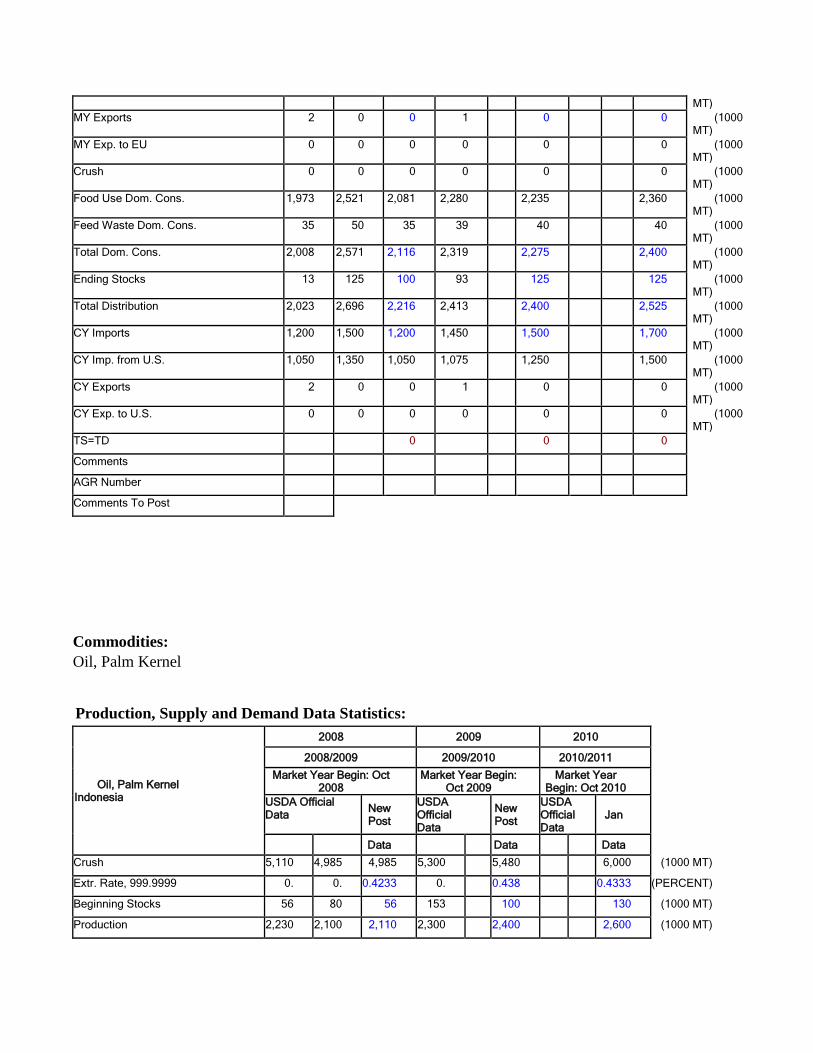
Currently, Indonesia soy consumption is about 10kg/year per capita, and still growing. With GOI
projection in 2025, consumption is projected about 11.5kg/year per capita; soybean imports should
continue to be strong. FAS Jakarta forecasts domestic consumption in MY2010/11 will be 2.4 million
MT, increase about nine percent over MY2009/10 of about 2.3 million MT.
Trade:
Imported soy will continue to dominate the Indonesian market, with a preference for U.S. soybeans for
human consumption. South Americans soybeans are generally used for animal feed. FAS Jakarta
forecasts that imports from the United States is 1.15 million MT in MY2009/10 and will increase about
6 percent to 1.22 million MT.
The Indonesian National Logistics Agency (BULOG) is interested in importing U.S. soybeans, in-line
with GOI policy about food security. Because soy is a staple commodity, the GOI is showing that it
wished to become more involved in soybean trading. BULOG and Bukopin Bank (state-owned bank,
majority shares owned by BULOG), have expressed interesting in using GSM-102 (credit guarantee
program) for soybean imports. BULOG and Bukopin have held preliminary meetings with FAS Jakarta
and other stakeholders.
Stocks:
Ending stock MY2010/11 will be 125,000 MT, higher than MY2009/10 due to the GOI‟s policy to
maintain stock to stabilize food prices.
Policy:
There are no specific policies regarding soybeans in Indonesia. GOI plans to be self-sufficient in
soybeans; however there are many challenges to face to reach that. Land or growing areas limitation,
competing crops which offer more attractive price to the farmers, inefficient agricultural practices that
result of high production cost; are few of those challenges.
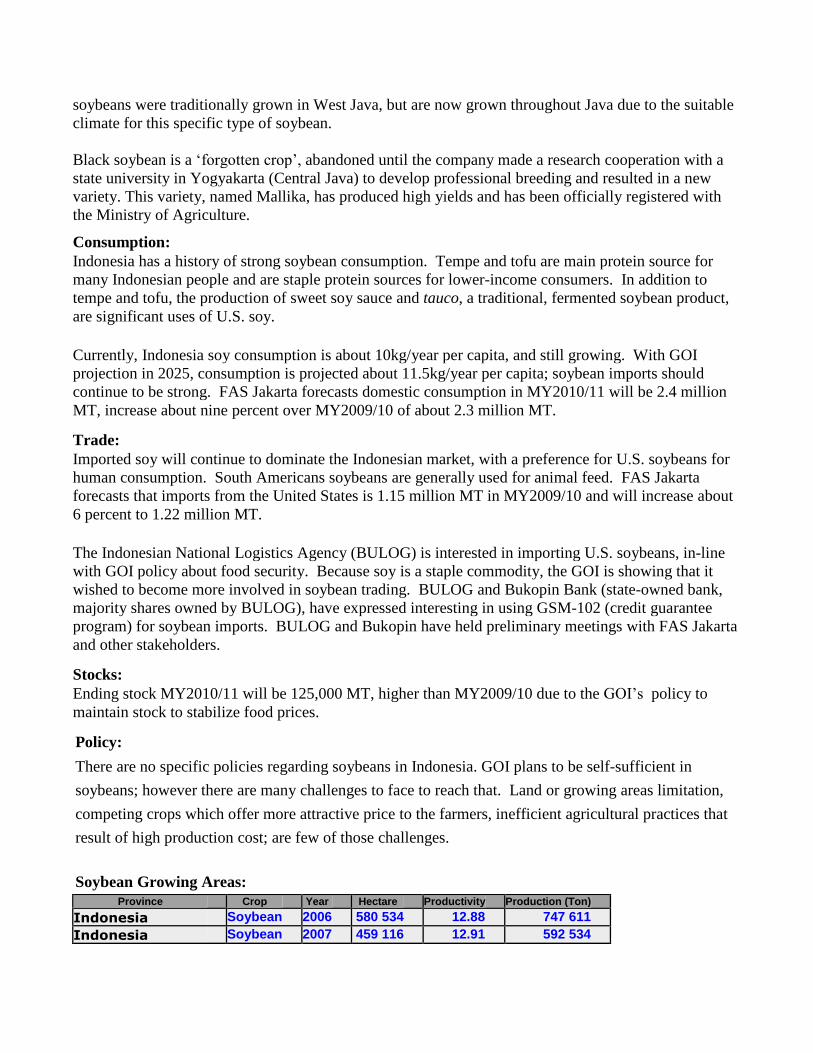
Soybean Growing Areas: Province Crop Year Hectare Productivity Production (Ton)
Indonesia Soybean 2006 580 534 12.88 747 611 Indonesia Soybean 2007 459 116 12.91 592 534
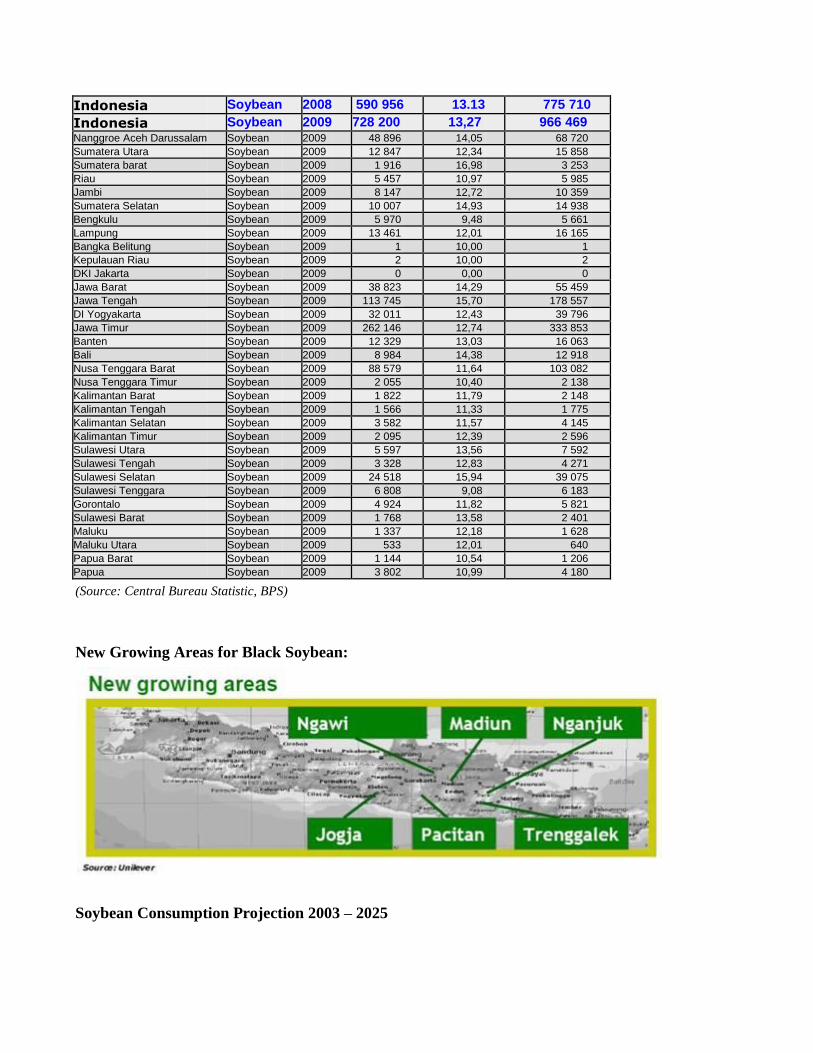
Indonesia Soybean 2008 590 956 13.13 775 710 Indonesia Soybean 2009 728 200 13,27 966 469 Nanggroe Aceh Darussalam Soybean 2009 48 896 14,05 68 720 Sumatera Utara Soybean 2009 12 847 12,34 15 858 Sumatera barat Soybean 2009 1 916 16,98 3 253 Riau Soybean 2009 5 457 10,97 5 985 Jambi Soybean 2009 8 147 12,72 10 359 Sumatera Selatan Soybean 2009 10 007 14,93 14 938 Bengkulu Soybean 2009 5 970 9,48 5 661 Lampung Soybean 2009 13 461 12,01 16 165 Bangka Belitung Soybean 2009 1 10,00 1 Kepulauan Riau Soybean 2009 2 10,00 2 DKI Jakarta Soybean 2009 0 0,00 0 Jawa Barat Soybean 2009 38 823 14,29 55 459 Jawa Tengah Soybean 2009 113 745 15,70 178 557 DI Yogyakarta Soybean 2009 32 011 12,43 39 796 Jawa Timur Soybean 2009 262 146 12,74 333 853 Banten Soybean 2009 12 329 13,03 16 063 Bali Soybean 2009 8 984 14,38 12 918 Nusa Tenggara Barat Soybean 2009 88 579 11,64 103 082 Nusa Tenggara Timur Soybean 2009 2 055 10,40 2 138 Kalimantan Barat Soybean 2009 1 822 11,79 2 148 Kalimantan Tengah Soybean 2009 1 566 11,33 1 775 Kalimantan Selatan Soybean 2009 3 582 11,57 4 145 Kalimantan Timur Soybean 2009 2 095 12,39 2 596 Sulawesi Utara Soybean 2009 5 597 13,56 7 592 Sulawesi Tengah Soybean 2009 3 328 12,83 4 271 Sulawesi Selatan Soybean 2009 24 518 15,94 39 075 Sulawesi Tenggara Soybean 2009 6 808 9,08 6 183 Gorontalo Soybean 2009 4 924 11,82 5 821 Sulawesi Barat Soybean 2009 1 768 13,58 2 401 Maluku Soybean 2009 1 337 12,18 1 628 Maluku Utara Soybean 2009 533 12,01 640 Papua Barat Soybean 2009 1 144 10,54 1 206 Papua Soybean 2009 3 802 10,99 4 180
(Source: Central Bureau Statistic, BPS)
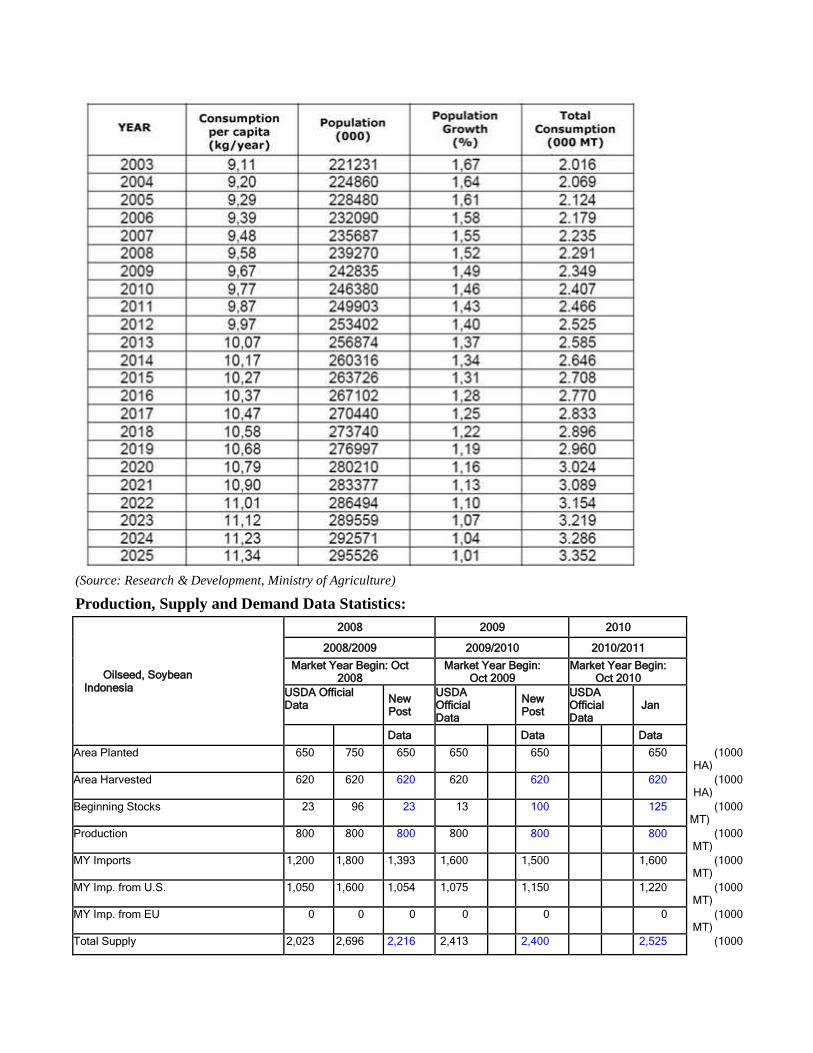
New Growing Areas for Black Soybean:
Soybean Consumption Projection 2003 – 2025
(Source: Research & Development, Ministry of Agriculture)
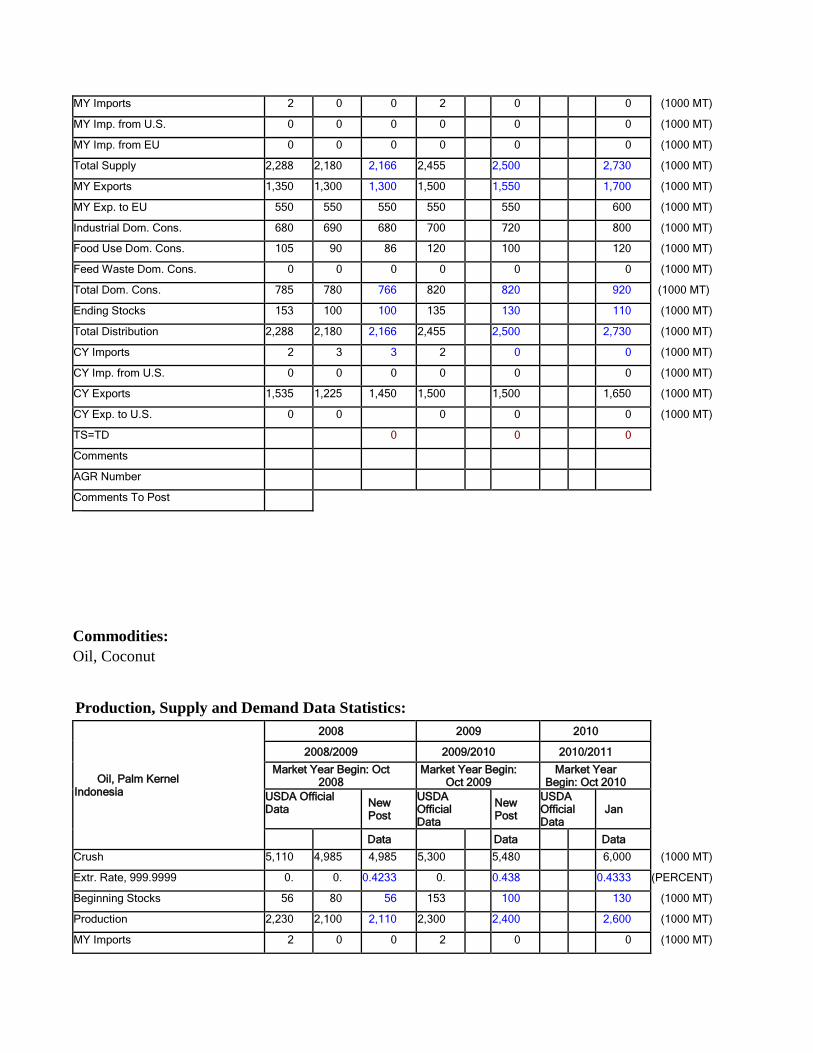
Production, Supply and Demand Data Statistics:
Oilseed, Soybean Indonesia
2008 2009 2010 2008/2009 2009/2010 2010/2011
Market Year Begin: Oct 2008
Market Year Begin: Oct 2009
Market Year Begin: Oct 2010
USDA Official Data New
Post USDA Official Data
New Post
USDA Official Data
Jan
Data Data Data Area Planted 650 750 650 650 650 650 (1000
HA) Area Harvested 620 620 620 620 620 620 (1000
HA) Beginning Stocks 23 96 23 13 100 125 (1000
MT) Production 800 800 800 800 800 800 (1000
MT) MY Imports 1,200 1,800 1,393 1,600 1,500 1,600 (1000
MT) MY Imp. from U.S. 1,050 1,600 1,054 1,075 1,150 1,220 (1000
MT) MY Imp. from EU 0 0 0 0 0 0 (1000
MT) Total Supply 2,023 2,696 2,216 2,413 2,400 2,525 (1000
MT) MY Exports 2 0 0 1 0 0 (1000
MT) MY Exp. to EU 0 0 0 0 0 0 (1000
MT) Crush 0 0 0 0 0 0 (1000
MT) Food Use Dom. Cons. 1,973 2,521 2,081 2,280 2,235 2,360 (1000
MT) Feed Waste Dom. Cons. 35 50 35 39 40 40 (1000
MT) Total Dom. Cons. 2,008 2,571 2,116 2,319 2,275 2,400 (1000
MT) Ending Stocks 13 125 100 93 125 125 (1000
MT) Total Distribution 2,023 2,696 2,216 2,413 2,400 2,525 (1000
MT) CY Imports 1,200 1,500 1,200 1,450 1,500 1,700 (1000
MT) CY Imp. from U.S. 1,050 1,350 1,050 1,075 1,250 1,500 (1000
MT) CY Exports 2 0 0 1 0 0 (1000
MT) CY Exp. to U.S. 0 0 0 0 0 0 (1000
MT) TS=TD 0 0 0 Comments AGR Number Comments To Post
Commodities:
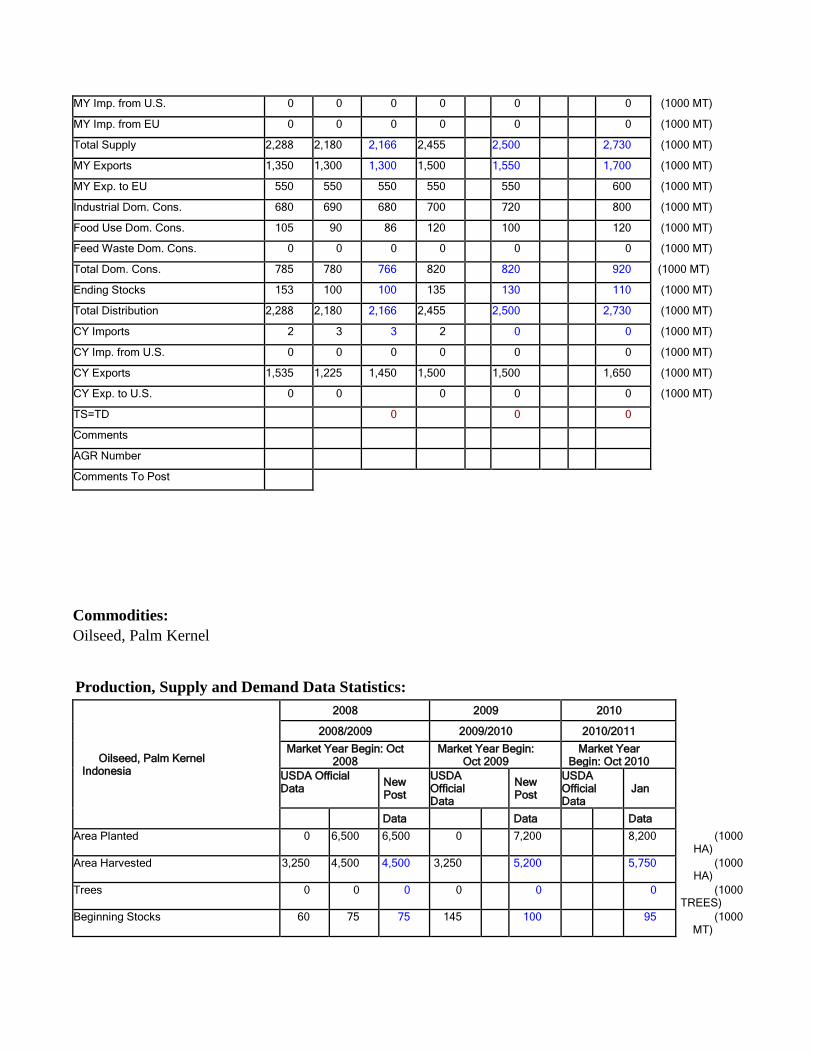
Oil, Palm Kernel
Production, Supply and Demand Data Statistics:
Oil, Palm Kernel Indonesia
2008 2009 2010 2008/2009 2009/2010 2010/2011
Market Year Begin: Oct 2008
Market Year Begin: Oct 2009
Market Year Begin: Oct 2010
USDA Official Data New
Post USDA Official Data
New Post
USDA Official Data
Jan
Data Data Data Crush 5,110 4,985 4,985 5,300 5,480 6,000 (1000 MT)
Extr. Rate, 999.9999 0. 0. 0.4233 0. 0.438 0.4333 (PERCENT)
Beginning Stocks 56 80 56 153 100 130 (1000 MT)
Production 2,230 2,100 2,110 2,300 2,400 2,600 (1000 MT)
MY Imports 2 0 0 2 0 0 (1000 MT)
MY Imp. from U.S. 0 0 0 0 0 0 (1000 MT)
MY Imp. from EU 0 0 0 0 0 0 (1000 MT)
Total Supply 2,288 2,180 2,166 2,455 2,500 2,730 (1000 MT)
MY Exports 1,350 1,300 1,300 1,500 1,550 1,700 (1000 MT)
MY Exp. to EU 550 550 550 550 550 600 (1000 MT)
Industrial Dom. Cons. 680 690 680 700 720 800 (1000 MT)
Food Use Dom. Cons. 105 90 86 120 100 120 (1000 MT)
Feed Waste Dom. Cons. 0 0 0 0 0 0 (1000 MT)
Total Dom. Cons. 785 780 766 820 820 920 (1000 MT)
Ending Stocks 153 100 100 135 130 110 (1000 MT)
Total Distribution 2,288 2,180 2,166 2,455 2,500 2,730 (1000 MT)
CY Imports 2 3 3 2 0 0 (1000 MT)
CY Imp. from U.S. 0 0 0 0 0 0 (1000 MT)
CY Exports 1,535 1,225 1,450 1,500 1,500 1,650 (1000 MT)
CY Exp. to U.S. 0 0 0 0 0 (1000 MT)
TS=TD 0 0 0 Comments AGR Number Comments To Post
Commodities:
Oil, Coconut
Production, Supply and Demand Data Statistics:
Oil, Palm Kernel Indonesia
2008 2009 2010 2008/2009 2009/2010 2010/2011
Market Year Begin: Oct 2008
Market Year Begin: Oct 2009
Market Year Begin: Oct 2010
USDA Official Data New
Post USDA Official Data
New Post
USDA Official Data
Jan
Data Data Data Crush 5,110 4,985 4,985 5,300 5,480 6,000 (1000 MT)
Extr. Rate, 999.9999 0. 0. 0.4233 0. 0.438 0.4333 (PERCENT)
Beginning Stocks 56 80 56 153 100 130 (1000 MT)
Production 2,230 2,100 2,110 2,300 2,400 2,600 (1000 MT)
MY Imports 2 0 0 2 0 0 (1000 MT)
MY Imp. from U.S. 0 0 0 0 0 0 (1000 MT)
MY Imp. from EU 0 0 0 0 0 0 (1000 MT)
Total Supply 2,288 2,180 2,166 2,455 2,500 2,730 (1000 MT)
MY Exports 1,350 1,300 1,300 1,500 1,550 1,700 (1000 MT)
MY Exp. to EU 550 550 550 550 550 600 (1000 MT)
Industrial Dom. Cons. 680 690 680 700 720 800 (1000 MT)
Food Use Dom. Cons. 105 90 86 120 100 120 (1000 MT)
Feed Waste Dom. Cons. 0 0 0 0 0 0 (1000 MT)
Total Dom. Cons. 785 780 766 820 820 920 (1000 MT)
Ending Stocks 153 100 100 135 130 110 (1000 MT)
Total Distribution 2,288 2,180 2,166 2,455 2,500 2,730 (1000 MT)
CY Imports 2 3 3 2 0 0 (1000 MT)
CY Imp. from U.S. 0 0 0 0 0 0 (1000 MT)
CY Exports 1,535 1,225 1,450 1,500 1,500 1,650 (1000 MT)
CY Exp. to U.S. 0 0 0 0 0 (1000 MT)
TS=TD 0 0 0 Comments AGR Number Comments To Post
Commodities:
Oilseed, Palm Kernel
Production, Supply and Demand Data Statistics:
Oilseed, Palm Kernel Indonesia
2008 2009 2010 2008/2009 2009/2010 2010/2011
Market Year Begin: Oct 2008
Market Year Begin: Oct 2009
Market Year Begin: Oct 2010
USDA Official Data New
Post USDA Official Data
New Post
USDA Official Data
Jan
Data Data Data Area Planted 0 6,500 6,500 0 7,200 8,200 (1000
HA) Area Harvested 3,250 4,500 4,500 3,250 5,200 5,750 (1000
HA) Trees 0 0 0 0 0 0 (1000
TREES) Beginning Stocks 60 75 75 145 100 95 (1000
MT)
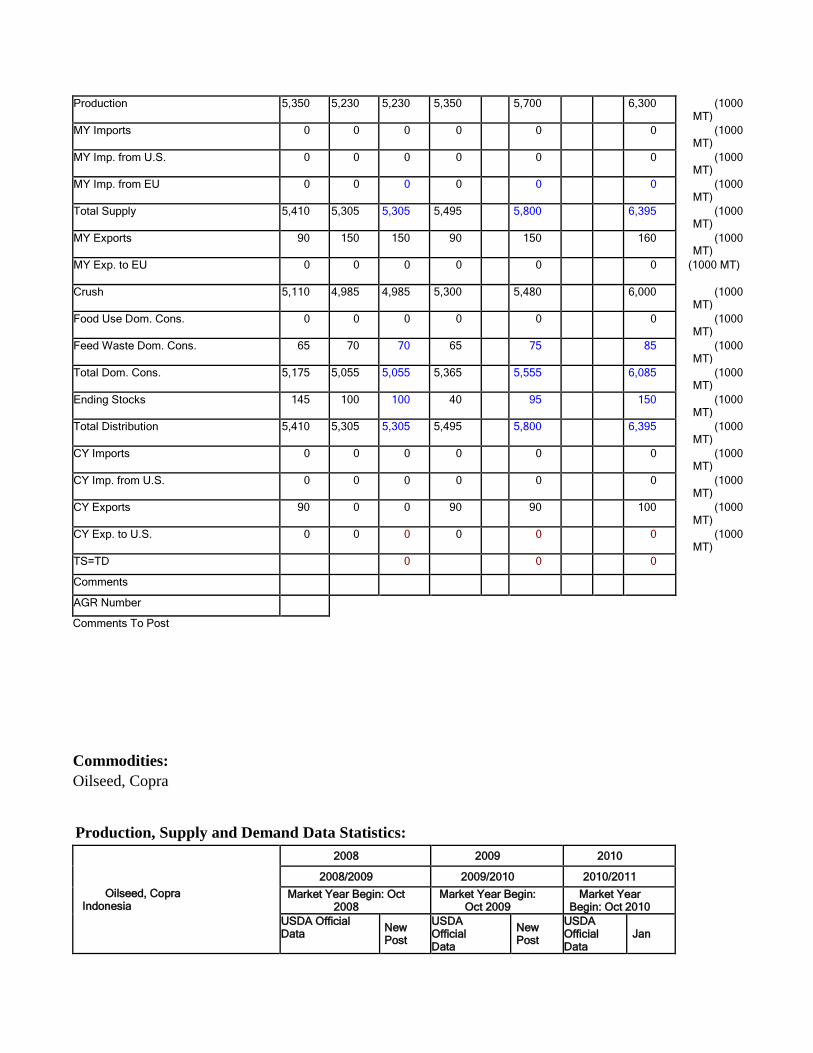
Production 5,350 5,230 5,230 5,350 5,700 6,300 (1000 MT)
MY Imports 0 0 0 0 0 0 (1000 MT)
MY Imp. from U.S. 0 0 0 0 0 0 (1000 MT)
MY Imp. from EU 0 0 0 0 0 0 (1000 MT)
Total Supply 5,410 5,305 5,305 5,495 5,800 6,395 (1000 MT)
MY Exports 90 150 150 90 150 160 (1000 MT)
MY Exp. to EU 0 0 0 0 0 0 (1000 MT)
Crush 5,110 4,985 4,985 5,300 5,480 6,000 (1000 MT)
Food Use Dom. Cons. 0 0 0 0 0 0 (1000 MT)
Feed Waste Dom. Cons. 65 70 70 65 75 85 (1000 MT)
Total Dom. Cons. 5,175 5,055 5,055 5,365 5,555 6,085 (1000 MT)
Ending Stocks 145 100 100 40 95 150 (1000 MT)
Total Distribution 5,410 5,305 5,305 5,495 5,800 6,395 (1000 MT)
CY Imports 0 0 0 0 0 0 (1000 MT)
CY Imp. from U.S. 0 0 0 0 0 0 (1000 MT)
CY Exports 90 0 0 90 90 100 (1000 MT)
CY Exp. to U.S. 0 0 0 0 0 0 (1000 MT)
TS=TD 0 0 0 Comments AGR Number Comments To Post
Commodities:
Oilseed, Copra
Production, Supply and Demand Data Statistics:
Oilseed, Copra Indonesia
2008 2009 2010 2008/2009 2009/2010 2010/2011
Market Year Begin: Oct 2008
Market Year Begin: Oct 2009
Market Year Begin: Oct 2010
USDA Official Data New
Post USDA Official Data
New Post
USDA Official Data
Jan
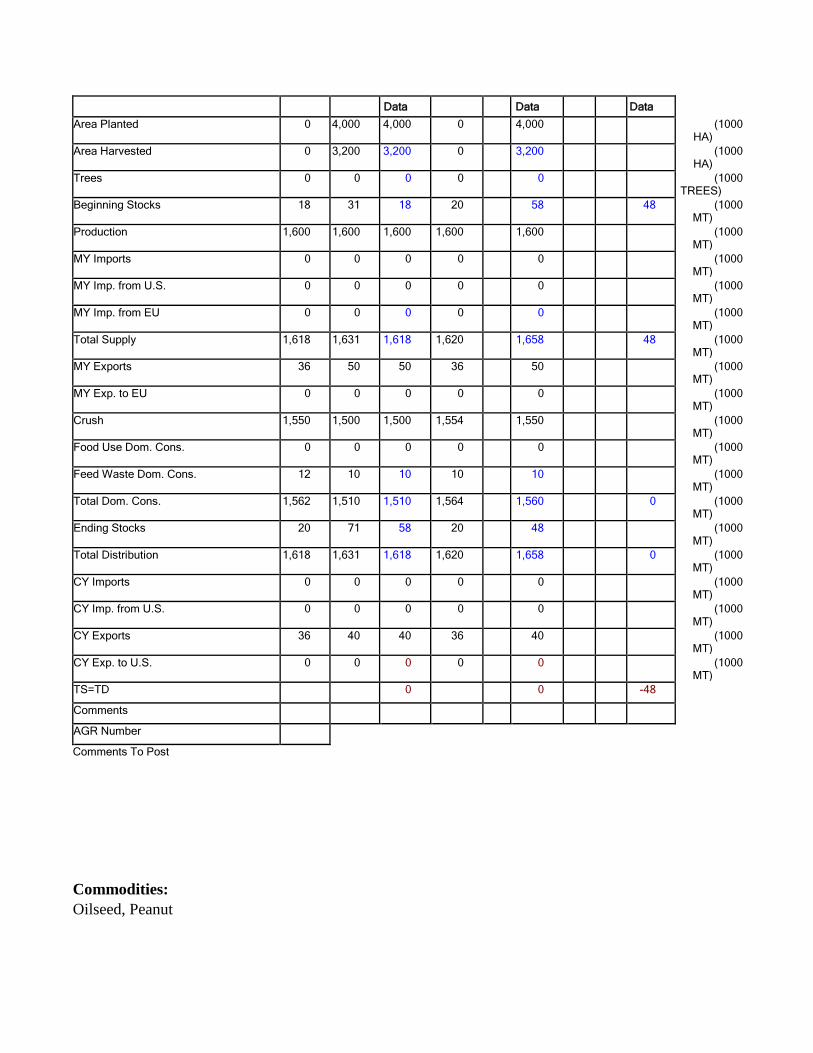
Data Data Data Area Planted 0 4,000 4,000 0 4,000 (1000
HA) Area Harvested 0 3,200 3,200 0 3,200 (1000
HA) Trees 0 0 0 0 0 (1000
TREES) Beginning Stocks 18 31 18 20 58 48 (1000
MT) Production 1,600 1,600 1,600 1,600 1,600 (1000
MT) MY Imports 0 0 0 0 0 (1000
MT) MY Imp. from U.S. 0 0 0 0 0 (1000
MT) MY Imp. from EU 0 0 0 0 0 (1000
MT) Total Supply 1,618 1,631 1,618 1,620 1,658 48 (1000
MT) MY Exports 36 50 50 36 50 (1000
MT) MY Exp. to EU 0 0 0 0 0 (1000
MT) Crush 1,550 1,500 1,500 1,554 1,550 (1000
MT) Food Use Dom. Cons. 0 0 0 0 0 (1000
MT) Feed Waste Dom. Cons. 12 10 10 10 10 (1000
MT) Total Dom. Cons. 1,562 1,510 1,510 1,564 1,560 0 (1000
MT) Ending Stocks 20 71 58 20 48 (1000
MT) Total Distribution 1,618 1,631 1,618 1,620 1,658 0 (1000
MT) CY Imports 0 0 0 0 0 (1000
MT) CY Imp. from U.S. 0 0 0 0 0 (1000
MT) CY Exports 36 40 40 36 40 (1000
MT) CY Exp. to U.S. 0 0 0 0 0 (1000
MT) TS=TD 0 0 -48 Comments AGR Number Comments To Post
Commodities:
Oilseed, Peanut
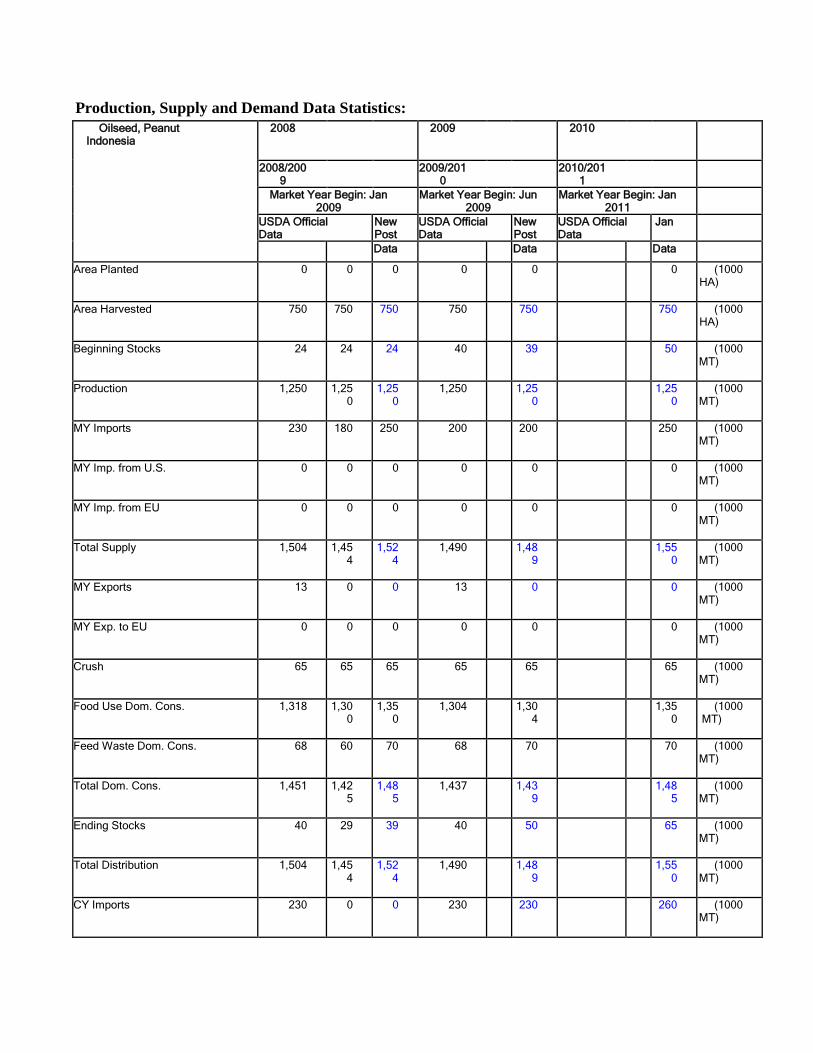
Production, Supply and Demand Data Statistics:
Oilseed, Peanut Indonesia
2008 2009 2010
2008/2009 2009/201
0 2010/2011
Market Year Begin: Jan 2009
Market Year Begin: Jun 2009
Market Year Begin: Jan 2011
USDA Official Data
New Post
USDA Official Data
New Post
USDA Official Data
Jan
Data Data Data Area Planted 0 0 0 0 0 0 (1000
HA)
Area Harvested 750 750 750 750 750 750 (1000 HA)
Beginning Stocks 24 24 24 40 39 50 (1000
MT)
Production 1,250 1,250
1,250
1,250 1,250 1,25
0 (1000
MT)
MY Imports 230 180 250 200 200 250 (1000 MT)
MY Imp. from U.S. 0 0 0 0 0 0 (1000
MT)
MY Imp. from EU 0 0 0 0 0 0 (1000 MT)
Total Supply 1,504 1,45
4 1,52
4 1,490 1,48
9 1,550
(1000 MT)
MY Exports 13 0 0 13 0 0 (1000
MT)
MY Exp. to EU 0 0 0 0 0 0 (1000 MT)
Crush 65 65 65 65 65 65 (1000
MT)
Food Use Dom. Cons. 1,318 1,300
1,350
1,304 1,304 1,35
0 (1000
MT)
Feed Waste Dom. Cons. 68 60 70 68 70 70 (1000 MT)
Total Dom. Cons. 1,451 1,42
5 1,48
5 1,437 1,43
9 1,485
(1000 MT)
Ending Stocks 40 29 39 40 50 65 (1000
MT)
Total Distribution 1,504 1,454
1,524
1,490 1,489 1,55
0 (1000
MT)
CY Imports 230 0 0 230 230 260 (1000 MT)
CY Imp. from U.S. 0 0 0 0 0 0 (1000 MT)
CY Exports 13 0 0 13 13 0 (1000
MT)
CY Exp. to U.S. 0 0 0 0 0 0 (1000 MT)
TS=TD 0 0 0 Comments AGR Number Comments To Post
Commodities:
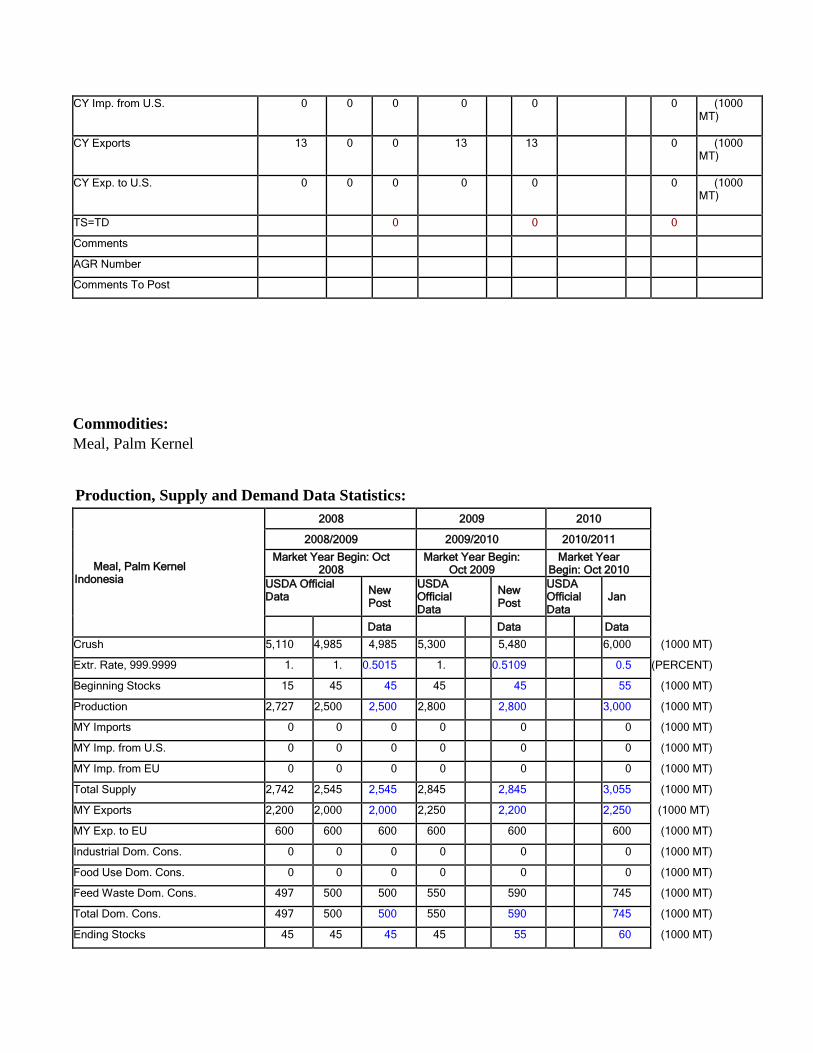
Meal, Palm Kernel
Production, Supply and Demand Data Statistics:
Meal, Palm Kernel Indonesia
2008 2009 2010 2008/2009 2009/2010 2010/2011
Market Year Begin: Oct 2008
Market Year Begin: Oct 2009
Market Year Begin: Oct 2010
USDA Official Data New
Post USDA Official Data
New Post
USDA Official Data
Jan
Data Data Data Crush 5,110 4,985 4,985 5,300 5,480 6,000 (1000 MT)
Extr. Rate, 999.9999 1. 1. 0.5015 1. 0.5109 0.5 (PERCENT)
Beginning Stocks 15 45 45 45 45 55 (1000 MT)
Production 2,727 2,500 2,500 2,800 2,800 3,000 (1000 MT)
MY Imports 0 0 0 0 0 0 (1000 MT)
MY Imp. from U.S. 0 0 0 0 0 0 (1000 MT)
MY Imp. from EU 0 0 0 0 0 0 (1000 MT)
Total Supply 2,742 2,545 2,545 2,845 2,845 3,055 (1000 MT)
MY Exports 2,200 2,000 2,000 2,250 2,200 2,250 (1000 MT)
MY Exp. to EU 600 600 600 600 600 600 (1000 MT)
Industrial Dom. Cons. 0 0 0 0 0 0 (1000 MT)
Food Use Dom. Cons. 0 0 0 0 0 0 (1000 MT)
Feed Waste Dom. Cons. 497 500 500 550 590 745 (1000 MT)
Total Dom. Cons. 497 500 500 550 590 745 (1000 MT)
Ending Stocks 45 45 45 45 55 60 (1000 MT)
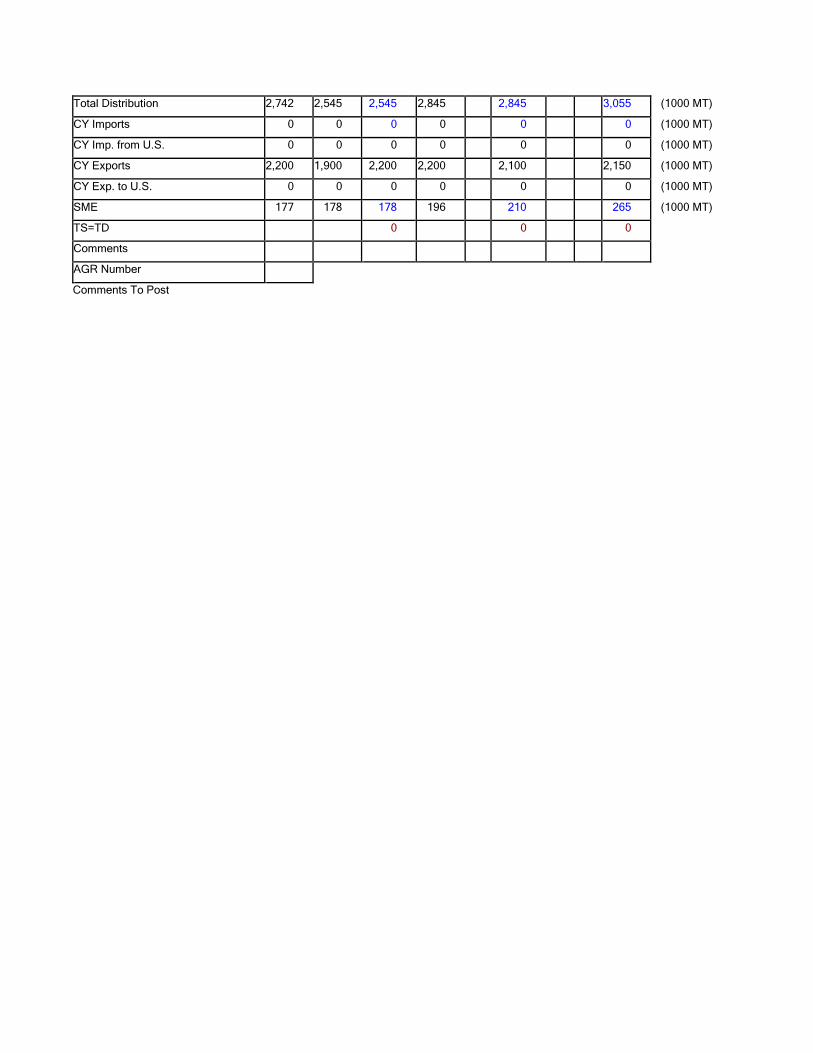
Total Distribution 2,742 2,545 2,545 2,845 2,845 3,055 (1000 MT)
CY Imports 0 0 0 0 0 0 (1000 MT)
CY Imp. from U.S. 0 0 0 0 0 0 (1000 MT)
CY Exports 2,200 1,900 2,200 2,200 2,100 2,150 (1000 MT)
CY Exp. to U.S. 0 0 0 0 0 0 (1000 MT)
SME 177 178 178 196 210 265 (1000 MT)
TS=TD 0 0 0 Comments AGR Number Comments To Post
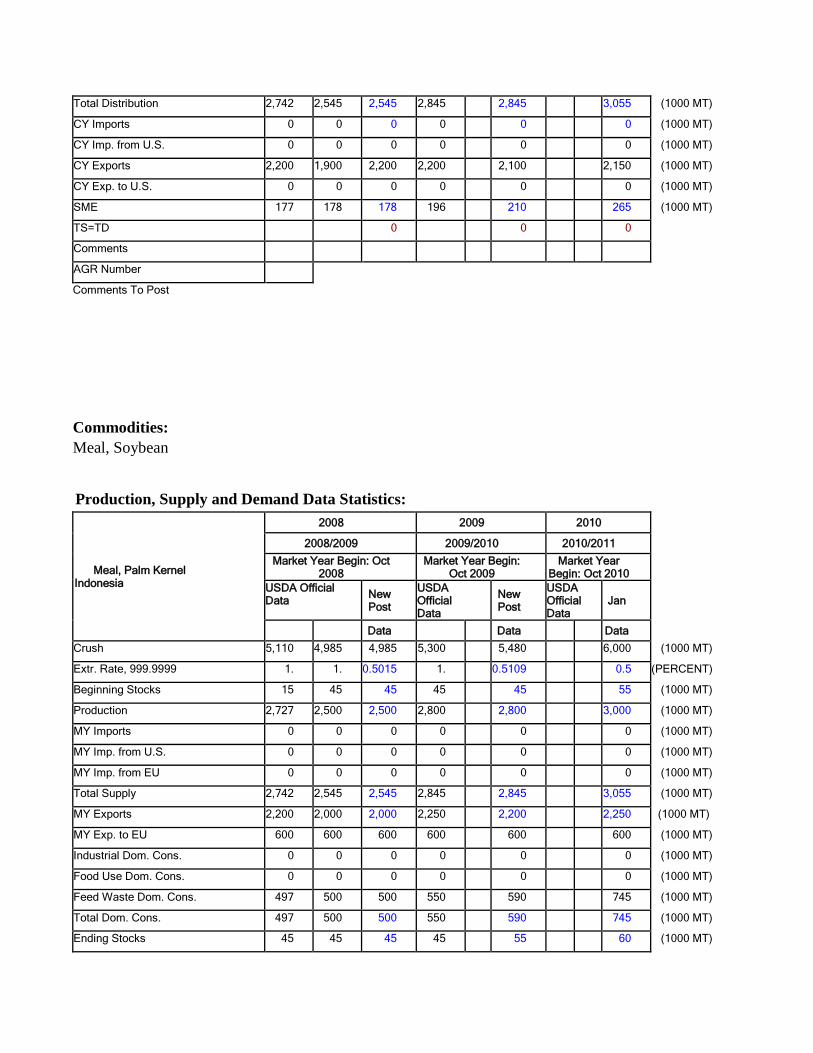
Commodities:
Meal, Soybean
Production, Supply and Demand Data Statistics:
Meal, Palm Kernel Indonesia
2008 2009 2010 2008/2009 2009/2010 2010/2011
Market Year Begin: Oct 2008
Market Year Begin: Oct 2009
Market Year Begin: Oct 2010
USDA Official Data New
Post USDA Official Data
New Post
USDA Official Data
Jan
Data Data Data Crush 5,110 4,985 4,985 5,300 5,480 6,000 (1000 MT)
Extr. Rate, 999.9999 1. 1. 0.5015 1. 0.5109 0.5 (PERCENT)
Beginning Stocks 15 45 45 45 45 55 (1000 MT)
Production 2,727 2,500 2,500 2,800 2,800 3,000 (1000 MT)
MY Imports 0 0 0 0 0 0 (1000 MT)
MY Imp. from U.S. 0 0 0 0 0 0 (1000 MT)
MY Imp. from EU 0 0 0 0 0 0 (1000 MT)
Total Supply 2,742 2,545 2,545 2,845 2,845 3,055 (1000 MT)
MY Exports 2,200 2,000 2,000 2,250 2,200 2,250 (1000 MT)
MY Exp. to EU 600 600 600 600 600 600 (1000 MT)
Industrial Dom. Cons. 0 0 0 0 0 0 (1000 MT)
Food Use Dom. Cons. 0 0 0 0 0 0 (1000 MT)
Feed Waste Dom. Cons. 497 500 500 550 590 745 (1000 MT)
Total Dom. Cons. 497 500 500 550 590 745 (1000 MT)
Ending Stocks 45 45 45 45 55 60 (1000 MT)
Total Distribution 2,742 2,545 2,545 2,845 2,845 3,055 (1000 MT)
CY Imports 0 0 0 0 0 0 (1000 MT)
CY Imp. from U.S. 0 0 0 0 0 0 (1000 MT)
CY Exports 2,200 1,900 2,200 2,200 2,100 2,150 (1000 MT)
CY Exp. to U.S. 0 0 0 0 0 0 (1000 MT)
SME 177 178 178 196 210 265 (1000 MT)
TS=TD 0 0 0 Comments AGR Number Comments To Post