e o rnest rlando lawrence b erkeley … · the corex process is estimated to use 15 to 18 gj/tonne...
TRANSCRIPT

1
LBNL-47205
Energy Use and Carbon
Dioxide Emissions from Steel
Production in China
Lynn Price, Jonathan Sinton, Ernst Worrell Environmental Energy Technologies Division
Dian Phylipsen Ecofys Energy and Environment
Hu Xiulian Center for Energy, Environment and Climate Change Research, Energy Research Institute, China
Li Ji Center for Energy Economics and Development Strategy, Energy Research Institute, China
May 2001
This work was supported under the U.S. Department of Energy Contract No.
DE-AC02-05CH11231.
ERNEST ORLANDO LAWRENCE
BERKELEY NATIONAL LABORATORY

2
Disclaimer
This document was prepared as an account of work sponsored by the United
States Government. While this document is believed to contain correct
information, neither the United States Government nor any agency thereof, nor
The Regents of the University of California, nor any of their employees, makes
any warranty, express or implied, or assumes any legal responsibility for the
accuracy, completeness, or usefulness of any information, apparatus, product,
or process disclosed, or represents that its use would not infringe privately
owned rights. Reference herein to any specific commercial product, process, or
service by its trade name, trademark, manufacturer, or otherwise, does not
necessarily constitute or imply its endorsement, recommendation, or favoring
by the United States Government or any agency thereof, or The Regents of the
University of California. The views and opinions of authors expressed herein
do not necessarily state or reflect those of the United States Government or any
agency thereof, or The Regents of the University of California.
Ernest Orlando Lawrence Berkeley National Laboratory is an equal
opportunity employer.

3
Energy Use and Carbon Dioxide Emissions from Steel Production in China
Lynn Price, Jonathan Sinton, Ernst Worrell,a Dian Phylipsen
b, Hu Xiulian
c, and Li Ji
d
a International Energy Studies Group, Energy Analysis Department, Environmental Energy Technologies
Division, Lawrence Berkeley National Laboratory, 1 Cyclotron Road, MS 90-4000, Berkeley CA 94720
USA.1
b Ecofys Energy and Environment, The Netherlands
c Center for Energy, Environment and Climate Change Research, Energy Research Institute, China
d Center for Energy Economics and Development Strategy, Energy Research Institute, China
This work was supported the U.S. Department of Energy under Contract No. DE-AC02-
05CH11231.
Abstract
In 1996, China manufactured just over 100 Mtonnes of steel and became the
world’s largest steel producer. Official Chinese energy consumption statistics for the steel
industry include activities not directly associated with the production of steel, “double-
count” some coal-based energy consumption, and do not cover the entire Chinese
steelmaking industry. In this paper, we make adjustments to the reported statistical data
in order to provide energy use values for steel production in China that are comparable to
statistics used internationally. We find that for 1996, official statistics need to be reduced
by 1365 PJ to account for non-steel production activities and double-counting. Official
1 Corresponding author: Lynn Price, [email protected], fax 1-510-486-6996.

4
statistics also need to be increased by 415 PJ in order to include steelmaking energy use
of small plants not included in official statistics. This leads to an overall reduction of 950
PJ for steelmaking in China in 1996. Thus, the official final energy use value of 4018 PJ
drops to 3067 PJ. In primary energy terms, the official primary energy use value of 4555
PJ is reduced to 3582 PJ when these adjustments are made.
1. Introduction
The industrial sector is the most important end-use sector in developing countries,
and was responsible for 50% of primary energy use and 53% of associated carbon
dioxide emissions in 1995 in these countries [1]. The industrial sector is extremely
diverse, encompassing the extraction of natural resources, conversion into raw materials,
and manufacture of finished products. Five energy-intensive industrial subsectors account
for the bulk of industrial energy consumption and related carbon dioxide emissions (iron
and steel, chemicals, petroleum refining, pulp and paper, and cement).
Iron and steel production consumes large quantities of energy, especially in
developing countries and countries with economies in transition where outdated,
inefficient technologies are often still used to produce iron and steel. Production of steel
in developing countries has grown at an average annual rate of 6.6% in recent years [2]
and is expected to continue to grow at similar levels due to the current low per capita
steel consumption levels in these countries. In contrast to industrialized countries, where
steel consumption averages over 425 kg/capita, key steel-producing developing countries
have extremely low average per capita consumption levels of 80 kg/capita in 1995.

5
China is the world’s largest producer of steel. Most of China’s steel industry
developed through a system of state-owned “enterprises”, in which an entire community
was devoted to the production of steel. As a result, data collection and reporting
regarding the energy used to produce steel in China also contains energy used for a
variety of other functions at the enterprise level, both directly and indirectly related to the
production of steel.2 In addition, a share of China’s steel is produced by small steel mills
that do not report energy use data to government statistical sources.
In this paper, we discuss our methodology and results of separating the reported
data on Chinese energy use for steel production into values for actual production of steel
and values for the other enterprise functions. It is important to disaggregate these data so
that Chinese energy use values can be fairly evaluated, especially when comparing
Chinese steel industry energy consumption and energy intensity values to those of other
countries or to particular “best practice” examples. We note that even with these
adjustments, it is possible that the data still include inaccuracies due to Chinese energy
production and consumption statistics reporting issues.
2. Energy Use for Steelmaking
Greenhouse gas emissions in the steel sector are primarily the result of burning
fossil fuels during the production of iron and steel. Currently there are two main routes
2 A significant percentage of enterprise’s energy use is for transportation and non-industrial buildings,
including worker housing, offices, schools, hospitals, and other service organizations, as explained below
in Section 4.
6
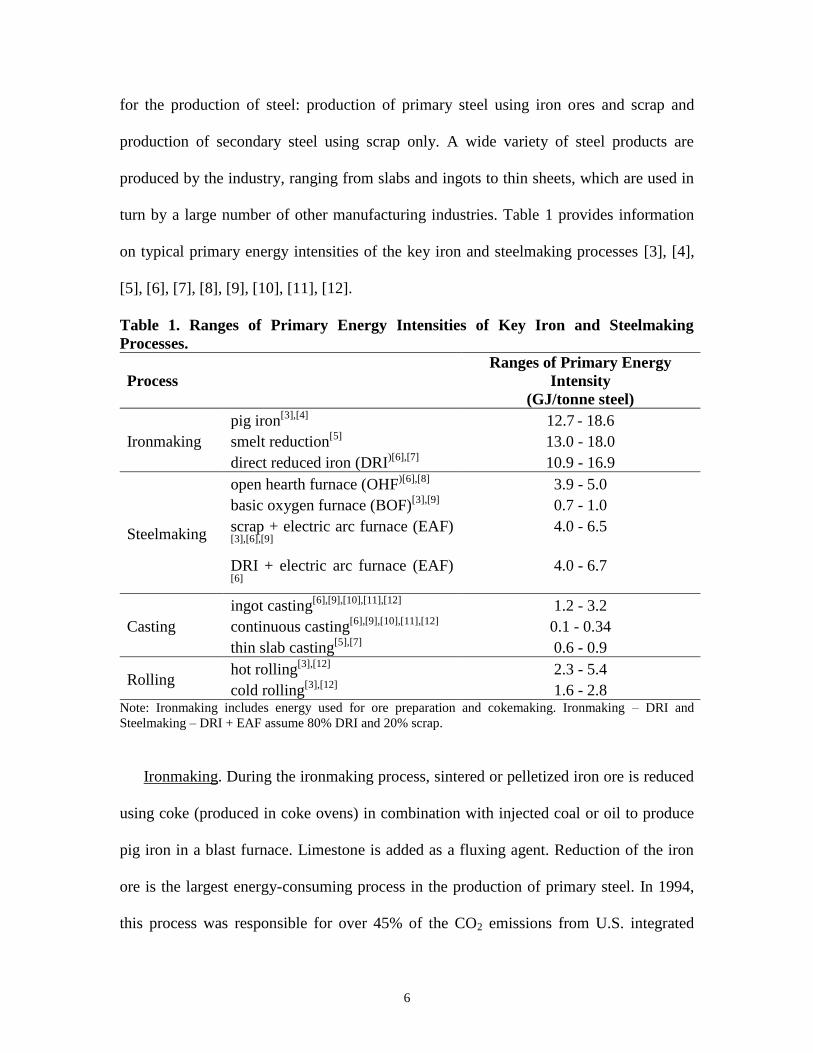
for the production of steel: production of primary steel using iron ores and scrap and
production of secondary steel using scrap only. A wide variety of steel products are
produced by the industry, ranging from slabs and ingots to thin sheets, which are used in
turn by a large number of other manufacturing industries. Table 1 provides information
on typical primary energy intensities of the key iron and steelmaking processes [3], [4],
[5], [6], [7], [8], [9], [10], [11], [12].
Table 1. Ranges of Primary Energy Intensities of Key Iron and Steelmaking
Processes.
Process
Ranges of Primary Energy
Intensity
(GJ/tonne steel)
Ironmaking
pig iron[3],[4]
12.7 - 18.6
smelt reduction[5]
13.0 - 18.0
direct reduced iron (DRI)[6],[7]
10.9 - 16.9
Steelmaking
open hearth furnace (OHF)[6],[8]
3.9 - 5.0
basic oxygen furnace (BOF)[3],[9]
0.7 - 1.0
scrap + electric arc furnace (EAF)
[3],[6],[9]
4.0 - 6.5
DRI + electric arc furnace (EAF)
[6]
4.0 - 6.7
Casting
ingot casting[6],[9],[10],[11],[12]
1.2 - 3.2
continuous casting[6],[9],[10],[11],[12]
0.1 - 0.34
thin slab casting[5],[7]
0.6 - 0.9
Rolling hot rolling
[3],[12] 2.3 - 5.4
cold rolling[3],[12]
1.6 - 2.8 Note: Ironmaking includes energy used for ore preparation and cokemaking. Ironmaking – DRI and
Steelmaking – DRI + EAF assume 80% DRI and 20% scrap.
Ironmaking. During the ironmaking process, sintered or pelletized iron ore is reduced
using coke (produced in coke ovens) in combination with injected coal or oil to produce
pig iron in a blast furnace. Limestone is added as a fluxing agent. Reduction of the iron
ore is the largest energy-consuming process in the production of primary steel. In 1994,
this process was responsible for over 45% of the CO2 emissions from U.S. integrated

7
steelmaking and had a primary energy intensity of 18.6 GJ/tonne of steel produced
(including the energy used for ore preparation and cokemaking) [3]. Other countries, such
as Finland and Luxembourg, use significantly less energy for ironmaking, consuming
12.7 and 12.9 GJ/tonne, respectively [4].
Smelt reduction processes are the latest development in pig iron production,
omitting coke production by combining the gasification of coal with the melt reduction of
iron ore. Processes under development include COREX, CCF, DIOS, AISI, and HISmelt.
Currently, only the COREX process (Voest-Alpine, Austria) is commercial and operating
in South Africa and South Korea, with plants under construction in India, South Korea, and
South Africa [13]. The COREX process uses agglomerated ore, which is pre-reduced by
gases coming from a hot bath. The pre-reduced iron is then melted in the bath. The process
produces excess gas, which is used for power generation, DRI-production, or as fuel gas.
The COREX process is estimated to use 15 to 18 GJ/tonne steel net energy consumption,
while the CCF process is estimated to use 13 GJ/tonne steel net energy consumption [5].
Direct reduced iron (DRI), hot briquetted iron (HBI) and iron carbide are all
alternative iron making processes [14]. Direct reduced iron (DRI) is produced by
reduction of the ores below the melting point in small-scale plants (< 1 Mtonnes/year)
and has different properties than pig iron. Production of DRI typically requires between
10.9 and 16.9 GJ/tonne of steel, including the energy used for ore preparation [6], [7].
DRI production is growing and nearly 4% of the iron in the world is produced by direct
reduction, of which over 90% uses natural gas as a fuel [15]. DRI serves as a high-quality
alternative for scrap in secondary steelmaking (see below).

8
Primary steel is produced by two processes: open hearth furnace (OHF) and basic
oxygen furnace (BOF). Steelmaking using a basic oxygen furnace (BOF) has a relatively
low energy intensity (0.7-1.0 GJ/tonne) compared to the 3.9-5.0 GJ/tonne energy
intensity of OHFs, which are much more common in developing countries [3], [6], [8],
[9]. The OHF is still used in Eastern Europe and some developing countries. While the
OHF uses more energy, this process can also use more scrap than the BOF process.
However, the BOF process is rapidly replacing the OHF worldwide, because of its
greater productivity and lower capital costs [16]. In addition, this process needs no net
input of energy and can even be a net energy exporter in the form of BOF-gas and steam.
The process operates through the injection of oxygen, oxidizing the carbon in the hot
metal. Several configurations exist depending on the way the oxygen is injected. The
steel quality can be improved further by ladle refining processes used in the steel mill.
The scrap input is rather small for the BOF-route, typically 10-25%.
Secondary steel is produced in an electric arc furnace (EAF) using scrap. In this
process, the coke production, pig iron production, and steel production steps are omitted,
resulting in much lower energy consumption and a primary energy intensity of 4.0-6.5
GJ/tonne [3], [6], [9]. To produce secondary steel, scrap is melted and refined, using a
strong electric current. The EAF can also be fed with iron from the DRI route, but energy
consumption increases due to the added carbon, resulting in an EAF primary energy
intensity of 4.0-6.7 GJ/tonne [6]. DRI is used to enhance steel quality, or if high-quality
scrap is scarce or expensive. Several process variants exist, using either AC or DC
currents, and fuels can be injected to reduce electricity use. Energy optimizing furnaces
(EOFs) can also be used to produce steel from scrap. This process is essentially an

9
oxygen steelmaking process using combined side blowing. The heat from the carbon-
oxygen reaction is used to preheat scrap [17].
Casting can be a batch (ingots) or a continuous process (slabs, blooms, billets).
Ingot casting is the classical process and is rapidly being replaced by continuous casting
machines (CCM). In 1998, 83% of global crude steel production was cast continuously
[18]. Continuous casting is a significantly more energy-efficient process for casting steel
than the older ingot casting process. Continuous casting uses 0.1-0.34 GJ/tonne of steel,
significantly less than the 1.2-3.2 GJ/tonne required for ingot casting [6], [9], [10], [11],
[12].
Rolling of the cast steel begins in the hot rolling mill where the steel is heated and
passed through heavy roller sections reducing the thickness of the steel. Hot rolling
typically consumes between 2.3 and 5.4 GJ/tonne of steel [3], [12]. The sheets may be
further reduced in thickness by cold rolling. Finishing is the final production step, and
may include different processes such as annealing, pickling, and surface treatment. Cold
rolling and finishing add 1.6-2.8 GJ/tonne to the rolling energy use [3], [12].
Thin slab or near net shape casting are more advanced casting techniques which
reduce the need for hot rolling because products are initially cast closer to their final
shape. Primary energy used for casting and rolling using thin slab casting is 0.6-0.9
GJ/tonne [5], [18].
3. The Chinese Steel Industry

10
0
20
40
60
80
100
120
140
1970 1975 1980 1985 1990 1995
Mt
Open Hearth Furnace
Basic Oxygen Furnace
Electric Arc Furnace
The Chinese steel industry has grown rapidly since the founding of the People’s
Republic of China in 1949. In 1996, China manufactured just over 100 Mtonnes of steel
and became the world’s largest producer of steel. In 1999, China produced 124 Mtonnes
of steel in 1999, the majority of which was primary steel using a BOF (82.8%) [19]. In
addition, 15.7% of the steel was secondary steel produced using EAF technology and
only 1.5% was produced using the outmoded and energy-intensive OHF technology (see
Figure 1 [19], [20]). It is predicted that the OHF technology will be phased-out
completely by the end of 2000 [21]. In 2000, China’s steel output continued to rise to
over 126 Mtonnes despite a government campaign to reduce output, and steel demand is
likely to keep growing [22], [23].
Figure 1. Steel Production in China by Process, 1970-1999 [19], [20].
Note: Less than 1% of crude steel is produced by methods in the “Other” category.
Shares of Total 1970 1980 1990 1997 1999
OHF 52% 32% 20% 9% 1.5%
BOF 26% 49% 59% 73% 82.8%
EAF 20% 19% 21% 18% 15.17%
Other 1.9% 0.1% 0.1% 0.2% 0.0%

11
In 1999, there were 33 key iron and steel enterprises in China operated by the
regulatory agency that inherited the duties of the former Ministry of Metallurgical
Industry (MMI).3 These key enterprises produced 76 Mt of crude steel in 1999 (see Table
2 [19], [24], [25], [26]). These plants are generally old, ranging from 17 to 89 years old
and averaging about 50 years old (although the age of the plant does not give adequate
information regarding later equipment upgrades). Overall, continuous casting was used
for 79% of the steel produced by these key plants in 1999.
3 In the 1998 reorganization of the central government, the decades-old Ministry of Metallurgical Industry
was demoted to the status of a bureau and placed under the of the State Economic and Trade Commission
(SETC), the body responsible for coordinating day-to-day administration of the government’s economic
regulatory activities. In 2000, most industrial bureaus, including that responsible for iron and steel, were
combined into a single Sectoral (or Industrial) Management Bureau (hangye guanlisi). Throughout these
administrative changes of the past several years, the regulatory staff and duties have evolved, but remained
fundamentally similar. For convenience in presentation and continuity with historical practice and reference
materials, we refer to the governmental body engaged in overseeing the iron and steel sector as “MMI”
throughout this document.

12
Table 2. Crude Steel Production in China by Enterprise, 1999 [19], [24], [25]. 26].
Enterprise
Steelmaking
Process
Year
Established
Continuously
Cast Steel
(%)
1999 Crude
Steel
Production
(Mtonnes)
Shougang Corp. BOF 1920 88 7.34
Tianjin Steel Plants OHF -- 29 3.16
Tangshan Iron and Steel (Group) Co. BOF 1944 98 3.08
Xuanhua Iron and Steel Corp. BOF 1912 68 1.12
Taiyan Iron and Steel Co. OHF, BOF, EAF 1934 64 2.27
Baotou Iron and Steel Rare-earth Co. OHF, BOF 1954 19 3.88
Anshan Iron and Steel (Group) Co. OHF, BOF 1919 63 8.51
Benxi Iron and Steel Co. BOF 1910 38 3.29
Fushun Steel Plant EAF 1938 7 0.49
Dalian Steel Plant EAF 1934 -- 0.36
Beigang Group Co. EAF 1957 -- 0.35
Shanghai Steel Plants: OHF, BOF, EAF 82 --
Shanghai No. 1 I&S Works 1943 84 2.21
Shanghai No. 3 I&S Works 1918 --
Shanghai No. 5 I&S Works 1958 68 1.62
Baoshan Iron and Steel Corp. BOF 1982 82 10.98
Shanghai Meishan (Group) 2 N/A 1970 99.5 0.38
Maanshan Magang Steel Co. 3 OHF, BOF 1909 80 3.55
Wuyang Iron and Steel Co. EAF 1978 -- --
Wuhan Iron and Steel (Group) Co. OHF, BOF 1958 90 6.22
Yegang Group Co. OHF, EAF 1913 9 0.48
Panzhihua Iron and Steel (Group) Co. BOF 1970 47 3.32
Chongqing Iron and Steel (Group) Co. OHF 1940 99.7 1.47
Chongqing Special Steel (Group) Co. EAF 1937 26 0.24
Changcheng Special Steel Co. EAF 1965 14 0.4
Chengdu Seamless Steel Tube Plant OHF 1962 53 0.55
Guiyang Steel Plant EAF 1958 -- 0.21
Guizhou Steel Wire Rope Plant EAF 1966 -- --
Shuicheng Iron and Steel (Group) Co. N/A 1966 99.95 1.13
Shaanxi Steel Plant EAF 1965 -- --
Shaanxi Precision Alloy Co. Ltd. EAF 1965 100 --
Juiquan Iron and Steel Co. N/A 1959 99.78 1.87
Xining Steel Plant EAF 1969 15 0.44
Ningxia Shizuishan Iron and Steel Works EAF 1959 -- --
MMI Key Iron & Steel Enterprises 1951 (avg) 79% 75.69
MMI Major Local Iron & Steel Enterprises 1957 (avg) 83% 37.69
MMI Small Enterprises 38% 5.35
Total MMI Enterprises 118.73
Other Producers 38% 5.22
Total Crude Steel Production 77% 123.95
Along with these key enterprises, MMI supervised an additional 56 major local
iron and steel enterprises that produced 37.7 Mt, or 30.4% of crude steel in 1999. Over
two-thirds of these plants were built in the 1950s; the most recently constructed plant was

13
built in 1972. Continuous casting is used for 83% of the steel produced in these plants
[19]. A small percentage of steel is produced by small enterprises in the MMI system.
These plants mainly operate small EAFs, or produce only iron. Some steel is
manufactured in non-MMI enterprises, i.e., iron and steel plants outside of MMI’s
supervision. Of the nearly 124 Mt of crude steel produced in 1999, 96% came from
enterprises in the MMI system, and 91.5% from MMI’s key enterprises and major local
enterprises.4
4. Adjusting Chinese Steelmaking Energy Consumption Statistics
We analyzed steel energy use data for 1996 as provided in the Yearbook of Iron
and Steel Industry of China, published by MMI.5 These official Chinese energy statistics
4 Since the 1990s, iron output from non-MMI enterprises has risen rapidly, from a 4.8% share of national
iron output in 1989 to 17% in 1997. The annual output of pig iron produced by non-MMI enterprises is
now over 10 Mt [20]. However, a central government campaign to close down small, inefficient iron and
steel producers shut down over 100 mills in 2000, and aims to close over 100 more in 2001 [27], [28].
Since many of these small plants are non-MMI plants, it is likely that their share of iron and steel output
will fall.
5 The Yearbook of Iron and Steel Industry of China, edited by the Ministry of Metallurgical Industry
(MMI), is an annual publication that records the historical development of the iron and steel industry of
China. The major data and information presented in this publication are obtained from the collected annual
reports from plants in the system of metallurgical industry of China. The output data in the publication are
for the whole country, while the energy data only include key enterprise and local enterprise within MMI’s
system. The data do not include the Hong Kong Special Administrative Region, Taiwan and Macao.

14
indicate that final energy use for steelmaking in 1996 was 4018 PJ [29]. The reported
energy consumption statistics include energy use for activities not directly associated
with the production of steel, “double-count” some coal-based energy consumption, and
do not cover the entire Chinese steelmaking industry. In 1991, Ross and Liu [30] pointed
out the inclusion of this non-steelmaking energy use in Chinese energy statistics, but
explained that data on energy use for these other services were not available. They
estimated that this “living energy use” (for households and social services) should be
reduced by about 20 kgce per tonne product, which in 1987 was 5.6% of energy used for
steel production in all plants in China [30].
Below, we modify the reported statistical data in order to provide energy use
values for steel production in China that are comparable to statistics used internationally
[20]. This allows us to compare China’s energy consumption and energy intensity to
those of other countries or to “best practice” energy use values.
4.1. Removing Non-Steelmaking Energy Use from MMI Energy Consumption
Values
Energy consumption statistics for the Chinese steel industry are only reported for
the key iron and steel enterprises, the major local iron and steel enterprises, and the small
enterprises operated or supervised by MMI. In 1994, 17% of reported MMI energy use
for steelmaking was for auxiliary production process such as ore mining (4%),
manufacturing of refractory materials (6%), carbon products (4%), and byproducts (2%),
as well as machine repair (1%) [20]. These activities, while related to steel production,

15
are not typically included in the strict definition of “steelmaking”, especially among
analysts making international comparisons [31]. Of the 4% used for ore mining in 1996,
coal accounted for 18%, coke for 25.5%, oil for 5%, and electricity for 51.5% [20]. In
1996, final energy use for ore mining was 38 PJ. Final energy use for the remaining
auxiliary production processes was 440.5 PJ that year.
MMI steelmaking energy use statistics also include on-site “livelihood” energy
use. On-site livelihood includes energy used in buildings, cafeterias, hospitals,
preschools, and other non-steel-producing activities within the enterprise. Further
refinement of the non-energy use estimate of Ross and Liu [30] was made by ERI
researchers who estimated that in 1994 on-site livelihood energy use was 7.6% of
reported MMI energy use for steel production [20]. Of this, it was estimated that about
70% was electricity and the remainder was coal. Using this information for 1996, final
energy use for on-site livelihood is calculated to be 258 PJ.
Finally, MMI statistics include energy used for off-site transportation.
Approximately 50% of motor gasoline use reported as energy use for steelmaking was for
off-site transportation [20]. In 1996, energy use for off-site transportation was 8 PJ.
4.2. Correcting for Double-Counting of Energy Use for Coal, Coking Coal, and
Steam Coal
MMI steelmaking energy use statistics include energy consumption values for
coal, coking coal and steam coal as well as for coke oven gas, blast furnace gas, heat, and
other electricity produced for own use on-site. Coke oven gas and blast furnace gas are

16
waste gases that result from burning coking coal during the cokemaking and steelmaking
processes, respectively. Heat is captured from the use of steam coal in furnaces and
boilers and on-site electricity is generated using coal. Thus, these process waste gases,
heat, and on-site electricity all derive from fuels already included in the energy
consumption statistics under “coking coal,” “steam coal,” and “coal” and thus are being
double-counted when all of these categories are summed. In 1996, the energy value of
coke oven gas, blast furnace gas, heat, and other electricity produced for own use on-site
was 621 PJ.
4.3. Adding Non-MMI Steelmaking Energy Use to Calculate a National Steelmaking
Energy Consumption Value
Approximately 5% of Chinese steel production is not included in the MMI data.
To account for the other producers not included in the MMI data, we first gathered iron
and steel production data for these other producers, including data on steel production by
process, from the Statistics of Iron and Steel Industry of China [32], [33]6 and the China
Energy Statistical Yearbook [34], [35], [36], [37].7 We then estimated energy use by fuel
6 Data in Statistics of Iron and Steel Industry of China are obtained from annual statistical reports of MMI’s
Department of Planning, and from industrial surveys. The output data presented in the publication are for
the whole country, while energy data only include key enterprise and local middle and small enterprises
within MMI’s system. The data in this book do not include the Hong Kong Special Administrative Region,
Taiwan Province and Macao.
7 The China Energy Statistical Yearbook has been published four times, in 1986, 1989, 1991 and 1997.
This yearbook is an essential reference for decision-makers at all levels, economists and energy

17
for ironmaking and steelmaking in non-MMI steel mills. For ironmaking, we calculated
solid fuel consumption assuming that the energy intensity per tonne of iron produced by
non-MMI steel mills is equivalent to 75% of overall solid fuel intensity for iron and steel
and 25% of electricity intensity for iron and steel at MMI mills.8 For steelmaking, we
assumed that the energy intensity per tonne of steel produced was equivalent to the
average MMI energy intensity. These energy intensities were then multiplied by non-
MMI iron and steel production data to calculate non-MMI steelmaking energy
consumption values. In 1996, non-MMI energy use for steel production is estimated to be
415 PJ to produce approximately 6 Mt of crude steel. This adjustment is likely to be
smaller for 2000 and future years, due to the government-mandated closure of hundreds
of small iron and steel plants.
4.4. Summary of Adjustments
Table 3 provides a summary of the adjustments we made to reported final energy
use in China for 1996. As discussed, reductions were made for ore mining, other
researchers. It provides information on the energy situation in China as well as the relationship between
energy and social economic development. The output data presented in the publication are for whole
country. The national data in this book do not cover the Hong Kong Special Administrative Region,
Taiwan Province and Macao. Also, the data in the energy balance tables does not cover non-commercial
energy.
8 We chose these approximate percentages to reflect the fact that ironmaking is the most fuel-intensive
process in iron and steel production, but accounts for a relatively small fraction of electricity use.

18
auxiliary processes, on-site livelihood, off-site transportation, and double-counting of
coal, coking coal, and steam coal. Non-MMI plant steelmaking energy use was added to
the reported final energy use. The result is a reduction of 1365 PJ and addition of 415 PJ,
leading to a net reduction of 950 PJ in final energy. Thus, the reported final energy use
value of 4018 PJ in 1996 drops to 3067 PJ. In primary energy terms, the reported primary
energy use value of 4555 PJ drops to 3582 PJ when these adjustments are made. To
analyze historic trends and make international comparisons, similar adjustments were
made for energy use for steelmaking for 1980 to 1995, assuming the same shares of
livelihood energy use, non-MMI output, and so on.9, 10
9 Ideally, these adjustments should be made on a year-by-year basis.
10 Recent concerns regarding the accuracy and reliability of China’s energy statistics [38] focus mostly on
coal consumption reporting issues. Problems with reporting are most acute in the non-state sectors. Thus,
we believe that the statistics reported here are as accurate as any national-level statistics [39] since 95% of
iron and steel production is state-owned (by MMI) and steel-making enterprises are not experiencing the
same political pressures that are forcing coal mines to under-report [38].

19
Table 3. Adjustments to Reported Steelmaking Energy Use in China, 1996.
Adjustments Final Energy Use (PJ)
Reductions:
- Ore mining 38
- Other auxiliary processes 441
- On-site livelihood 258
- Off-site transportation 8
- Double-counting (coal, coking coal, steam coal) 621
Additions:
- Non-MMI plant steelmaking energy use 415
Reported final energy use 4018
Adjusted final energy use 3067
Primary Energy Use (PJ)
Reported primary energy use 4555
Adjusted primary energy use 3582
Note: primary energy use calculated using a 33% electricity conversion factor.
5. Primary and Final Energy Use and Carbon Dioxide Emissions from Steel
Production in China
Based on the adjustments in reported energy consumption data described above,
primary energy use for steel production in China more than doubled between 1980 and
1996, growing from 1603 PJ to 3582 PJ (see Figure 2). This growth, which averaged
5.2% per year, was slower than the 6.5% average annual growth in steel production
experienced during this period, resulting in a drop in energy intensity (energy used per
tonne of steel produced) from 43 GJ/tonne to 35 GJ/tonne.
In 1996, final energy use for steel production in China was 3067 PJ. Solid fuels
accounted for 74% of final energy use (after accounting for all adjustments). Among
solid fuels, coking coal accounted for over two-thirds, purchased coke for nearly 9%, and

20
-
1,000
2,000
3,000
4,000
1980 1982 1984 1986 1988 1990 1992 1994 1996
Prim
ary
Ene
rgy
(PJ)
Electricity
Natural Gas
Liquid Fuels
Solid Fuels
steam coal for the balance.11
The proportion of purchased coke has been rising; in 1981
purchased coke accounted for about 4% of solid fuels.
Figure 2. Adjusted End-Use Energy Consumption for Steel Production in China, 1980-1996.
Gas fuels were used for 8% of final steel energy consumption in 1996. This was
composed mainly of coke oven gas (79%). The remaining gas fuels were blast furnace
gas (16%) and a small amount of natural gas (5%).12
In China, natural gas is
preferentially supplied to residential customers and a few large chemical fertilizer plants.
11
Nearly all (96%) of steam coal consumed in the iron and steel sector is used in manufacturing, 1% for
railway transport on site, and 3% for building heating in winter [20]. The adjustments above excluded use
of steam coal not directly related production of iron and steel and used at iron and steel mills.
12 The major use of collected coke oven gas is manufacturing. A small portion is used as residential
cooking fuel, and a negligible amount for power generation. The major use of collected blast furnace gas is
manufacturing. Currently about 15% is used for power generation.
21
In 1996, liquid fuels accounted for 5% of steelmaking energy use, a drop from the
9% share used in 1980. Fuel oil accounted for over three quarters of the liquid fuels
consumed in 1996, and diesel and gasoline for nearly all the rest.13
This was a great
change from the early 1980s, when 15% of the liquid fuel used was crude oil, a
consequence of the great faith China then had that it would continue to find large onshore
oilfields.
Electricity accounted for 8% of final energy use (22% of primary energy use) for
steel production in 1996. Four-fifths of this electricity was purchased, and the remainder
generated on-site. China’s largest integrated iron and steel plants run their own
conventional power plants, and an increasing number generate power using energy
byproducts of the manufacturing process, such as coke oven gas, blast furnace gas, and
by using blast-furnace top pressure recovery turbines.
Carbon dioxide emissions from steel production grew from 37.8 MtC in 1980 to
84.6 MtC in 1996.14
The structure of emissions mirrors energy use, with coal and coke
dominating, followed by electricity (mainly from coal-fired power plants), then fossil
liquids, and a small amount of natural gas. No biomass fuels are used in China’s steel
industry. Carbon dioxide emissions from steel production accounted for 9% of total
carbon dioxide emissions in China in 1995.
13
The major use of diesel is on-site transportation. Approximately half of gasoline consumption is used for
on-site transportation, and the remainder for off-site transportation. This is reflected in our adjusted figures
for energy consumption.
14 CO2 emissions factors based on IPCC [40].

22
-
4 0
8 0
1 2 0
1 9 8 0 1 9 8 5 1 9 9 0 1 9 9 5
Mt
cru
de
ste
el/
ca
rbo
n (b
ars
)
0 . 0
0 . 5
1 . 0
1 . 5
CO
2 I
nte
ns
ity
, tC
/
t s
tee
l (li
ne
)
C O 2 E m is s io n s C r u d e S te e l O u tp u t C O 2 In te n s ity
The carbon dioxide intensity of steel production is simply sectoral carbon dioxide
emissions (expressed in metric tons of carbon) divided by an indicator of total output, in
this case crude steel. Carbon intensity declined steadily from 1980 to the early 1990s, and
has recently begun to fall again after a short rise, reaching 1.03 tC/t steel in 1996 (see
Figure 3 [20], [41]).
Figure 3. Carbon Dioxide Emissions, Crude Steel Output, and Carbon Dioxide Intensity of
Steel Production in China, 1980-1996 [20], [41].
6. Energy Use and Carbon Dioxide Emissions of the Chinese Steel Sector in An
International Context
During the past decade, interest in comparing energy use and greenhouse gas
emissions trends between countries has grown in response to the many issues raised as a
result of the United National Framework Convention on Climate Change (UNFCCC).

23
The UNFCCC was signed in 1992 by over 150 countries that committed to the goal of
stabilizing greenhouse gas concentrations “at a level that would prevent dangerous
anthropogenic interference with the climate system” [42]. In 1997, at the third
Conference of the Parties (COP-3) to the UNFCCC in Kyoto, Japan, the signatories
agreed to the Kyoto Protocol that outlined emissions reduction targets for the Annex I
countries, but not for developing countries. Even so, it is generally acknowledged that
developing countries have a role to play in abating global climate change since
greenhouse gas emissions are growing rapidly in many of these countries. Thus, in order
to fairly compare and assess greenhouse gas emissions trends and reduction
opportunities, it is important to develop a consistent methodology for making
international comparisons.
The international comparisons made in this paper follow the methodological
recommendations from two workshops and a handbook on international comparisons of
industrial energy efficiency [31], [43], [44]. These comparisons can be used to analyze
differences in trends between countries as well as to identify opportunities for energy
efficiency improvement and greenhouse gas emissions reductions.
When compared to other major developing countries, China is clearly the largest
producer of steel and thus consumes a significantly larger amount of primary energy and
has equally large related carbon dioxide emissions (see Table 4 [20], [41], [45]).15
Primary energy consumption does not correlate exactly with steel production levels,
15
Primary energy consumption is calculated by using a constant conversion efficiency of 33% in order to
exclude differences in electricity generating efficiency between countries, thus highlighting only
differences in energy efficiency in the production of steel.

24
however, due to changes in production technology structure and in the energy efficiency
of steelmaking equipment.
Table 4. Primary Energy Use and Carbon Dioxide Emissions from the Steel Industry in
Five Developing Countries, 1995 [20], [41], [45].
Country
Primary
Energy Use
(PJ)
Primary Energy
Intensity
(GJ/tonne)
Carbon Dioxide
Emissions
(MtC)
Share of Total Country
Carbon Dioxide Emissions
(%)
Brazil 578 23.1 9.1 13%
China 3,576 36.7 104.0 12%
India 775 37.3 20.4 8%
Mexico 274 22.6 5.1 6%
South Africa 387 44.4 9.6 12%
Table 4 provides primary energy use, primary energy intensity (primary energy
consumption per tonne of crude steel), and carbon dioxide emissions for five key
developing countries: Brazil, China, India, Mexico, and South Africa. China and India
have high primary energy intensity compared to the other countries. Brazil and Mexico
have the lowest energy intensities of the five developing countries, but their intensity
values are still higher than those found in many European countries and some rapidly
developing countries (e.g., South Korea). Intensity in South Africa was quite high in the
1970s, and has since declined rapidly, though it rebounded somewhat in recent years.
Steel-related carbon dioxide emissions closely mirror primary energy use, with
China clearly dominating, followed by India, Brazil, and Mexico. Carbon dioxide
emissions from steel production are responsible for 13% of total emissions in Brazil, 12%
of total emissions in South Africa and in China, 8% of total emissions in India, and 6% of
total emissions in Mexico [45].

25
Carbon intensity trends are closely related to energy intensity trends but are also
dependent upon the fuel mix used by the iron and steel industry in each country.16
South
Africa, India and China have the highest carbon intensities from iron and steel
production, while Brazil and Mexico have relatively low carbon intensities.
Between 1980 and 1996, primary energy used per tonne of steel produced in
China dropped from 43 GJ/tonne to 35 GJ/tonne, based on the adjusted energy
consumption values described above. Other studies of China’s steelmaking energy
intensity, which also made various adjustments to China’s steelmaking energy use in
order to account for differences from international practices, show similar declines. For
example, a 1997 study by the Asian Development Bank indicates that in 1996, overall
energy intensity for key plants in China was 33.2 GJ/t steel (compared to a national
average of 40.8 GJ/t), while the “comparable” energy intensity for key plants was 28.3
GJ/t [46] (see Table 5 [19], [24], [25], [29], [32], [33], [46], [47]).17
Another study indicates
that the “comparable” energy consumption per ton of steel in large and medium sized
steel enterprises is 27.5 GJ/t while the international advanced level is 19.3 GJ/t in 1998
[49].
16 Carbon emissions factors are from the Intergovernmental Panel on Climate Change [40].
17
"Comparable energy intensity" is a calculation made to allow for comparisons between plants in China
and with plants in other countries. It refers to the “total energy necessarily consumed by certain defined
major processes for producing one tonne of steel, deducting process energy consumed by iron-ore mining
and auxiliary processes, etc.” [48].

26
Table 5. Energy Intensity of Steel Production in China (GJ/tonne) [19], [24], [25], [29], [32],
[33], [46], [47].
Indicator 1980 1985 1990 1991 1992 1993 1994 1995 1996
LBNL/ERI Calculations
Overall unadjusted primary
energy intensity
59.8 52.9 50.2 49.7 44.9 45.2 46.5 47.3 45.0
Overall adjusted primary energy
intensity
43.2 38.3 36.6 36.2 33.7 34.8 36.5 36.7 35.4
Asian Development Bank Study
Overall un-adjusted primary
energy intensity 1 59.8 51.3 47.2 46.9 46.1 45.3 44.5 44.4 40.8
Key enterprises 2 35.2 35.3 34.8 34.1 33.7 33.9 33.2
Major local enterprises 2 42.1 40.7 39.4 37.5 36.4 36.1
Comparable energy intensity 3 29.4
Key enterprises 2 35.2 31.1 29.2 29.2 28.3 28.6 28.1 28.5 28.3
Major local enterprises 2 45.5 35.8 30.5 29.0
1Overallunadjusted primary energy intensity refers to total plant energy use over crude steel output. Conversion to prmary energy
assuming about 30% conversion efficiency in power plants. 2 Key enterprises include the 33 largest plants belonging to the MMI system, and major local enterprises include 53 plants controlled
at the local level and within the MMI system. The plants include integrated iron and steel plants as well as manufacturers of finished
steel products. Ore mines and dressing operations, ferroalloy plants, and other enterprises in the MMI system are excluded. 3 Comparable energy intensity is adjusted to allow comparisons between plants in China with plants in other countries. Adjustments
are needed to compensate for unique characteristics of China's iron and steel industry, and to account for energy use at plants that produce only iron or only steel. 4 These figures represent overall sectoral consumption of energy divided by crude steel output. Coverage is for MMI system only.
Another study comparing energy use for steel production in China and the U.S. in
1987 made a small adjustment to remove 5.6% of “living energy use” from steelmaking
data. This study found that the U.S. relied more heavily on the efficient pellet-based
process for iron production while China used the less energy-efficient sinter-based
process. China used less energy per tonne for cokemaking than the U.S. due to the long-
standing experience of the Chinese with cokemaking as well as the energy loss in the
U.S. related to emissions controls and more extensive processing of coke by-products.
Other differences included the high electricity intensity in the blast furnace operation in
China, the low use of scrap in China, and the low complexity and quality of many
Chinese steel products. Overall, the study found that the energy intensity of China’s key

27
steel producing plants was about 20% higher than that for U.S. integrated plants in 1987
[30].
A more recent study comparing energy consumption for steel production in China
to that in Japan shows that China’s primary energy intensity of 36.5 GJ/tonne in 1995 is
17 GJ/tonne higher than that of Japan’s steel industry [50]. Most of the higher energy
consumption can be explained by the higher relative iron production in China, relatively
poorer material quality, a poorer electric utility transmission and delivery system, higher
relative iron alloy production, lower waste energy recovery, smaller scale of equipment,
lower conversion efficiency of steam and oxygen, and other miscellaneous factors [50].
7. Estimating Potential Energy Savings and Carbon Dioxide Emissions Reductions
in the Steel Industry in China
Differences in physical energy intensities between countries are due to differences
in energy efficiency as well as structural differences. In order to account for the structural
differences, a best practice benchmark energy intensity using best practice energy
intensities for the actual product mix and feedstocks used in each country can be
calculated. The best practice benchmark energy intensity is calculated to reflect the sector
structure for each year for each country, based on that country’s product mix and
feedstock. This methodology accounts for the share of both primary and secondary steel
produced in the country each year. In the iron and steel industry product mix is defined as
the share of iron, slabs, hot rolled steel, cold rolled steel and wire. Feedstocks (e.g. scrap,
iron ore) are important because the product quality can be influenced by the scrap input

28
due to contaminations from other metals (i.e. product mix is influenced) [31]. Also, the
quality of the ore (i.e. the iron content) can slightly affect energy use in the blast furnace.
These best practice benchmark energy intensities are then compared to actual energy
intensities. To make this comparison, we use an energy efficiency index (EEI) which is
the ratio of the actual energy intensity to the best practice energy intensity, where the best
practice equals 100.
As with energy intensity, the structural differences between countries can be taken
into account by calculating a carbon intensity index, which compares the actual level of
emissions per tonne of product to a best practice benchmark level of emissions. The best
practice benchmark carbon intensity for each of the processes and products is calculated
by multiplying the actual carbon intensities with the best practice carbon intensities and
the carbon emission factor for each process. The sectoral best practice benchmark carbon
intensity is calculated as a weighted average based on the shares of the processes and
products in each country. The carbon intensity index is the ratio of the actual carbon
intensity to the best practice benchmark carbon intensity, where a carbon intensity of 100
represents best practice and the higher the carbon intensity index the higher the emission
reduction potential for a given sector structure.
Compared to the energy efficiency index there is one complicating factor in
calculating the carbon intensity index. In addition to sector structure and energy
efficiency, fuel mix also influences CO2 emissions per tonne of product. Using the fuel
mix associated with the best practice technology in the carbon intensity index calculation
implies a fuel switch from actual fuel mix to this best practice fuel mix. Because of
constraints on the availability of indigenous resources this is not always economically

29
feasible. Therefore, we have excluded the influence of fuel mix in our calculations of the
carbon intensity index. This is done by using a national average fuel mix, instead of the
best practice fuel mix, to calculate the benchmark carbon intensity.18
This means that the
index is an indication of the emission reduction potential by efficiency improvements
only. Additional emissions reductions can be accomplished through fuel switching.
Identification of the technical potential primary energy savings and carbon
dioxide emissions reductions provides a rough estimate of the savings potential available
in various countries. While the technical potential is based on actual energy use and
carbon dioxide emissions from plants in commercial operation, country and plant-specific
conditions will determine what portion of the technical potential can be realized in any
given country.
Table 6 shows the results of the energy efficiency and carbon intensity index
calculations for China in 1995 [51]. That year, China had an actual primary energy
intensity of 36.7 GJ/tonne. If best practice technology had been used to produce the same
amount and types of steel in China that year, then the energy intensity would have been
20.2 GJ/tonne, resulting in energy savings of 16.5 GJ/tonne. Based on the amount of steel
produced that year, 95.4 Mtonnes, China could have consumed only 1927 PJ for steel
production, or 45% below the actual consumption of 3502 PJ. China’s carbon dioxide
intensity in 1995 was 0.87 tC/tonne steel produced. Using best practice technologies
would have reduced this intensity value to 0.43 tC/tonne, resulting in a savings of 0.39
tC/tonne steel. These best practice technologies would have almost cut actual carbon
dioxide emissions of 82.7 MtC almost in half, to 45.8 MtC in 1995.
18
This assumes that the efficiency of the best practice technology does not change with changing fuel mix.

30
Table 6. Potential Energy Savings and Carbon Dioxide Emissions Reductions Using Best
Practice Technologies in China in 1995 [51].
Primary energy intensity 36.7 GJ/tonne Carbon dioxide intensity 0.87 tC/tonne
Best practice energy intensity 20.2 GJ/tonne Best practice CO2 intensity 0.43 tC/tonne
Actual energy consumption 3502 PJ Actual CO2 emissions 82.7 MtC
Best practice energy consumption 1927 PJ Best practice CO2 emissions 45.8 MtC
Potential savings 1575 PJ (45%) Potential savings 36.9 MtC (45%)
8. Summary and Conclusions
Steelmaking is a very energy-intensive manufacturing process and accounts for
over 10% of China’s primary energy use and related carbon dioxide emissions. To
understand the potential for saving energy and reducing emissions in this industry, it is
important to clearly understand how the energy is used and to correctly account for the
energy consumed for actual steelmaking. We have made a number of adjustments to the
official Chinese energy consumption statistics for the steel industry in order to remove
energy use for activities not directly associated with the production of steel, to correct for
double-counting of some coal-based energy consumption, and to add energy use for a
small portion of the steelmaking industry that is not included in official statistics. Using
these adjusted values, we find that Chinese energy use and associated carbon dioxide
emissions are still very high when compared to other countries and to best practice
energy consumption values. If best practice technology had been used to produce the
same amount and types of steel in China in 1995, energy savings and carbon dioxide
emissions reductions of 45% could have been achieved.
Acknowledgments

31
Funding for this work was provided by the China Sustainable Energy Program of
the Energy Foundation, and the Climate Protection Partnerships Division, Office of
Atmospheric Programs, Office of Air and Radiation, U.S. Environmental Protection
Agency through the U.S. Department of Energy under Contract No. DE-AC03-
76SF00098.
References
[1] Price L, Michaelis L, Worrell E, Khrushch M. Sectoral trends and driving forces of
global energy use and greenhouse gas emissions. Mitigation and Adaptation Strategies
for Global Change 1998;3: 263-319.
[2] International Iron and Steel Institute (IISI). Steel statistics of developing countries,
1996 edition. Brussels: IISI, 1997.
[3] Worrell E, Martin N, Price L. Energy efficiency and carbon dioxide emissions
reduction opportunities in the U.S. iron and steel sector. Berkeley, CA: Lawrence
Berkeley National Laboratory (LBNL Report 41724), 1999.
[4] International Iron and Steel Institute. Statistics on energy in the steel industry, 1996
update. Brussels, Belgium: IISI, 1996.
[5] Worrell E, Moore C. Energy efficiency and advanced technologies in the iron and steel
industry. Proceedings 1997 ACEEE Summer Study on Energy Efficiency in Industry,
Washington, DC: ACEEE, 1997.

32
[6] World Energy Council (WEC). Energy efficiency improvement utilising high
technology, an assessment of energy use in industry and buildings. World Energy
Council, London, UK: WEC, 1995.
[7] International Iron and Steel Institute (IISI). Energy use in the steel industry. Brussels:
IISI, 1998.
[8] Kudrin V. Steelmaking. Moscow: Mir Publishers, 1985.
[9] Energetics. Energy and environmental profile of the U.S. steel industry. Prepared for
the U.S. DOE, Office of Industrial Technologies. Washington, DC: Energetics, 2000.
[10] Brown H, Hamel B, Hedman B. Energy analysis of 108 industrial processes.
Washington, DC: U.S. DOE, 1985.
[11] Energetics. The U.S. steel industry: an energy perspective. Energetics, Washington
D.C., 1988.
[12] Worrell E, de Beer JG, Blok K. Energy conservation in the iron and steel industry,
in: P.A. Pilavachi (ed), Energy efficiency in process technology, Elsevier Applied
Sciences, Amsterdam/London, 1993.
[13] Voest Alpine Industrieanlagenbau. COREX, revolution in ironmaking. Linz,
Austria:VAI, 1996.
[14] McAloon TP. Alternate ironmaking update. Iron & Steelmaker 1994;21(2): 37-39 +
55.
[15] Midrex. 1994 world direct reduction statistics. Charlotte, NC: Midrex Direct
Reduction Corporation, 1995.
[16] International Iron and Steel Institute (IISI). Statistics on energy in the steel industry
(1990 update). Brussel: IISI, 1990.
33
[17] Chatterjee A. The steel industry in India. Ironmaking and Steelmaking1996;23(4):
293-302.
[18] International Iron and Steel Institute (IISI). IISI web site:
http://www.worldsteel.org/steeldatacentre/lgcountry.htm. Brussels: IISI, 1999.
[19] Ministry of Metallurgical Industry. Yearbook of iron and steel industry of China.
Beijing: MMI, 2000.
[20] Energy Research Institute. Chinese steel input data for INEDIS database. Beijing:
Energy Research Institute, State Development Planning Commission of China, 1999.
[21] Li S, Wang Z. Present and future status of Chinese steel industry in the 21st century.
Iron and Steel Engineer, August, 1999.
[22] China Online. China ranks No.1 in iron and steel output in ‘00. 9 February, 2001.
http://www.chinaonline.com.
[23] South China Morning Post (SCMP). Consumption seen outpacing demand in rest of
world. 5 October, 2000. http://www.scmp.com.
[24] Ministry of Metallurgical Industry. Yearbook of iron and steel industry of China,
Beijing: MMI, 1994.
[25] Ministry of Metallurgical Industry. Yearbook of iron and steel industry of China,
Beijing: MMI, 1998.
[26] Joint Study Team. China: issues and options in greenhouse gas control. Washington,
DC: The World Bank, 1994.
[27] China Daily. China to close down 50 small steelworks. 29 June 2000.
http://www.chinadaily.com.cn.

34
[28] China Online. Steel industry growth down from average. 4 October, 2000.
http://www.chinaonline.com.
[29] Ministry of Metallurgical Industry (MMI). Yearbook of iron and steel industry of
China. Beijing: MMI, 1999.
[30] Ross M, Liu F. The energy efficiency of the steel industry of China, Energy
1991;16(5):833-848.
[31] Phylipsen GJM, Blok K, Worrell E. Handbook on international comparisons of
energy efficiency in the manufacturing industry. Utrecht, The Netherlands: Dept. of
Science, Technology and Society, Utrecht University, 1998.
[32] Ministry of Metallurgical Industry (MMI). Statistics of the iron and steel industry of
China. Beijing: MMI, 1986.
[33] Ministry of Metallurgical Industry (MMI). Statistics of the iron and steel industry of
China. Beijing: MMI, 1993.
[34] State Statistical Bureau (SSB). China energy statistical yearbook. Beijing: China
Statistical Publishing House, 1986.
[35] State Statistical Bureau (SSB). China energy statistical yearbook. Beijing: China
Statistical Publishing House, 1989.
[36] State Statistical Bureau (SSB). China energy statistical yearbook. Beijing: China
Statistical Publishing House, 1991.
[37] State Statistical Bureau (SSB). China energy statistical yearbook. Beijing: China
Statistical Publishing House, 1997.
[38] Sinton JE. Accuracy and reliability of China’s energy statistics. China Economic
Review. Forthcoming.

35
[39] Farla JCM, Blok K. The quality of energy intensity indicators for international
comparisons in the iron and steel industry. Energy Policy 2001;29:523-543.
[40] Intergovernmental Panel on Climate Change. Revised 1996 IPCC guidelines for
national greenhouse gas inventories: workbook. Geneva: IPCC, 1996.
[41] Price L, Worrell E, Khrushch M. Sectoral trends and driving forces of global energy
use and greenhouse gas emissions: focus on buildings and industry. Berkeley, CA:
Lawrence Berkeley National Laboratory (LBNL Report 42817), 1999.
[42] United Nations. United Nations framework convention on climate change. Geneva:
United Nations Environment Program/World Meteorological Organization, 1992.
[43] Martin N, Worrell E, Schipper L, Blok K. International comparisons of energy
efficiency: Workshop Proceedings. March 6-9, 1994. Berkeley, CA: Lawrence Berkeley
National Laboratory, 1994.
[44] Phylipsen GJM, Nyboer J, Oliver JT, Pape A, Worrell E, Blok K. Proceedings of the
workshop on methodologies for international comparisons of industrial energy efficiency.
April 1-2, 1996. Vancouver, BC: Simon Fraser University, 1996.
[45] Maarland G, Andres RJ, Boden TA, Johnston C, Brenkert A. Global, regional, and
national CO2 emission estimates from fossil fuel burning, cement production, and gas
flaring: 1751-1996. Oak Ridge, TN: Oak Ridge National Laboratory
(http://cdiac.esd.ornl.gov/ndps/ndp030.html) 1999.
[46] Asian Development Bank. Market-based industrial energy conservation and
environmental improvement project (final report). TA No. 2675-PRC. Manila: Asian
Development Bank, 1998.

36
[47] Li GT, Jiang, HH. Tigao jieneng jiangdi chengben tigao gangtie qiye jingzhengli
(Raise competitiveness of iron and steel enteprises by raising energy efficiency and
reducing costs). Zhongguo Nengyuan (Energy of China) 1999;(110): 26-28. February.
[48] Liu Z, Liu J, Wang Y. Energy consumption in the iron and steel industry in P.R.
China. Energy for Sustainable Development 1996;III (3), September.
[49] Li G, Zeng, G. Overview of the energy efficiency policies and regulations in energy-
intensive sectors of China. Proceedings of Learning from International Best Practice
Energy Policies in the Industrial Sector. Beijing, May 22-23, 2000.
[50] Hu XL, Xin DG, Qu SY. Comparative study on standard energy consumption in
high energy using industries between China and other countries. Beijing: Center for
Energy, Environment and Climate Change Research, Energy Research Institute, 1997.
[51] Price L, Phylipsen D, Worrell E. Energy use and carbon dioxide emissions in the
steel sector in key developing countries. Berkeley, CA: Lawrence Berkeley National
Laboratory (LBNL-46987), 2001.