earnings and welfare after downsizing: central bank...
TRANSCRIPT

THE WORLD BANK ECONOMIC REVIEW, VOL. 13, NO. 1: 89-116
Earnings and Welfare after Downsizing:Central Bank Employees in Ecuador
Martin Rama and Donna Maclsaac
This article measures the earnings and welfare losses experienced by displaced employ-ees of the Central Bank of Ecuador. It links these losses to individual characteristicssuch as gender, education, seniority, and salary in the public sector. Data are from asurvey of displaced employees that included subjective evaluations of well-being inaddition to information on activity and earnings. The welfare losses of separated em-ployees are not highly correlated with their earnings losses, partly because some ofthem (especially women) withdrew from the labor force after separation. Earnings andwelfare losses also vary depending on the nature of displacement, which was voluntaryfor roughly half the employees and involuntary for the rest. Overall, the losses werelarger for employees with less education and more seniority, but not necessarily largerfor employees with higher salaries. However, compensation for displacement was basedon a rule of thumb that involved only salary and seniority and was applied across-the-board. For those employees who left voluntarily, the resulting compensation packagewas, on average, about 20 percent higher than the welfare loss. The article derives theimplications of these findings for the design of assistance programs for displaced workersand, more specifically, for the tailoring of compensation packages to their individualcharacteristics.
Public sector downsizing is an increasingly important component of economicreform, both in industrial and in developing countries. Nowhere is the need totrim public sector employment more obvious than in formerly planned econo-mies. But it is also considerable in Latin American countries, where a long his-tory of populist economic policies has led to bloated bureaucracies and over-staffed state-owned enterprises. A good case in point, the Central Bank of Ecuador(BCE) had 5,800 relatively well-paid employees in the early 1990s. While theirwork is now done by some 2,700 (better-paid) employees, many other publicsector agencies and firms around the world have yet to start moving in thisdirection.
Martin Rama is with the Development Economics Research Group at the World Bank, and DonnaMaclsaac is with Wells Fargo. This article was written for the research project Public Sector Retrenchmentand Efficient Compensation Schemes, supported by the Research Committee of the World Bank throughgrant 679-51. The authors are especially grateful to Constanza Calderon. They are also grateful to JuliaGonzalez for her skillful assistance with the field interviews and to Bruce Fallick, Florencio L6pez-de-Silanes, John Newman, staff at the research department of the Central Bank of Ecuador, and threereferees for their helpful comments.
© 1999 The International Bank for Reconstruction and Development /THE WORLD BANK
89
Pub
lic D
iscl
osur
e A
utho
rized
Pub
lic D
iscl
osur
e A
utho
rized
Pub
lic D
iscl
osur
e A
utho
rized
Pub
lic D
iscl
osur
e A
utho
rized
Pub
lic D
iscl
osur
e A
utho
rized
Pub
lic D
iscl
osur
e A
utho
rized
Pub
lic D
iscl
osur
e A
utho
rized
Pub
lic D
iscl
osur
e A
utho
rized

90 THE WORLD BANK ECONOMIC REVIEW, VOL. 13, NO. 1
One of the main obstacles to public sector downsizing is the large welfare lossthat displaced workers may experience. Typically, some of these workers spendlong periods unemployed or out of the work force. Others move to activitiescharacterized by lower pay, less income security, and higher levels of effort thanthe jobs they used to hold. The extent of their welfare loss depends on the natureof the alternatives to their public sector job, the value they attach to incomesecurity, and their aversion to work effort. Not being able to predict these losses,or to defuse the resistance to downsizing, governments sometimes offer overlygenerous severance pay packages. Many potential losers are thus transformedinto winners, and public sector downsizing ends up being a very expensiveendeavor.
In this article we measure the individual losses experienced by displaced BCEemployees and link these losses to their observable characteristics. Although theexercise focuses on a relatively narrow group of public sector workers, its impli-cations go beyond their particular case. To date, there have been few studies onthis topic, and policymakers willing to assess the amount of resources needed tocompensate displaced public sector workers, or to predict the harshness of resis-tance to downsizing in the absence of such compensation, have little on which tobuild. Moreover, these studies seldom refer to white-collar workers in middle-income countries, a group that will face significant job losses in the comingyears.1 Because these workers tend to be highly vocal and politically influential,compensation issues will certainly be of paramount importance in their case.
This article should not serve to justify the complete compensation of dis-placed workers. Many public sector employees get rents from their jobs, andthese rents are paid for by the rest of society. On fairness grounds, it would seemthat they should bear some of the cost of adjustment. Moreover, public sectoremployees are rarely among the poorest segments of the population. Therefore,a government concerned about poverty alleviation could find better uses for itsscarce resources than the complete compensation of this particular group. But tocompensate displaced employees even partially, the government would need in-formation about the cost of complete compensation. And this information maybe relevant for predicting the fierceness of the resistance to restructuring. Fi-nally, in some countries public sector employees cannot legally be fired, whichimplies that the government has to "buy" them out. In those countries, an accu-rate estimate of the losses from displacement may help to reduce the cost ofdownsizing.
Our main contribution in this article is methodological. Attempts to estimatethe losses experienced by displaced workers usually involve a comparison of
1. Alderman, Canagarajah, and Younger (1996) analyze the case of government employees in Ghana,most of whom moved to agriculture after being retrenched. Tansel (1997) focuses on blue-collar workersin Turkey. Assaad (in this issue) compares workers in and out of the Egyptian public sector, taken as awhole. Only the study by Robbins (1996) considers a group of workers similar to ours. Other studies ofdownsizing are descriptive in nature, with no attempt to quantify the loss experienced by individualworkers.

Rama and Maclsaac 91
earnings in two different states, such as in and out of the public sector or beforeand after separation. But as important as the change in earnings may be, it rep-resents only one aspect of the welfare loss. The disutility from lesser incomesecurity and (possibly) higher effort levels, as well as the utility from additionalleisure time (if any), also need to be taken into account. We use discrete mea-sures of earnings losses and welfare losses reported directly by the displacedemployees, in addition to more traditional measures of earnings losses. We useregression analysis to estimate the link between these measures and the observ-able characteristics of the employees. These characteristics include salary andseniority in the public sector, which are the two main attributes considered inthe rules of thumb on which compensation is usually based, but they are notrestricted to these two variables.
BCE gave about half of the displaced employees the choice of staying in theirjobs and forced the rest to resign. Thus, self-selection is a key problem in evalu-ating the link between the losses ensuing from downsizing and the observablecharacteristics of the employees. Most likely, those who accept a severance paypackage and leave the public sector are also, other things being equal, those whoface the best outside alternatives or have the lowest aversion to risk and effort.Using the losses experienced by these workers to predict the losses of those whoremain in the public sector may be misleading. We deal with this problem byreplicating the analysis of welfare losses separately for BCE employees who had achoice and for those who did not. The differences observed between these twogroups provide an indication of the extent and nature of the biases resultingfrom self-selection.
Section I narrates the downsizing process; including the mechanisms set up byBCE to compensate the displaced employees, as well as to decide which amongthem would be forced to resign and which would have the choice of staying.Section II describes the survey we implemented to gather information on theactivity, earnings, and welfare of displaced employees from the Quito branch ofBCE in the 15 to 18 months following their separation. Section III analyzes howdisplaced employees allocated the compensation they received and evaluates thereturns on the investments they made with it. Section IV retraces employees'activity and earnings history after separation; it shows that unemployment rateswere quite low, but the quality of the new jobs was low as well. Sections V andVI construct and analyze indicators of the actual and perceived earnings lossexperienced by displaced BCE employees. Section VII focuses on indicators of thewelfare loss and systematically links them to the observable characteristics ofthe displaced employees. Section VIII draws policy implications from the analy-sis, and section IX concludes.
I. THE DOWNSIZING PROCESS
In the early 1990s it became apparent that BCE was overstaffed. Part of thegrowth in employment was due to political patronage, which had been particu-

92 THE WORLD BANK ECONOMIC REVIEW, VOL. 13, NO. 1
larly intense during the 1980s. But bad management was to blame as well. Overthe years, management did not restructure or suppress poorly functioning units;instead, it replicated them by creating other units with similar tasks. Moreover,financial liberalization reduced the scope for some of the activities traditionallyperformed by BCE, such as those related to credit allocation. Gradually, themanagement of BCE came to accept that a reduction in personnel was warranted.In 1991, it decided that the work force had to be cut by half. This target wasintended to signal management's resolve to address the overstaffing problem. Itwas not set as the result of a careful analysis of the functions of BCE and theproductivity of its staff.
The reduction in personnel took place over two distinct phases. A first roundin 1992 led to the departure of 1,400 employees on a strictly voluntary basis. Atthat time, there was no appropriate legal framework for the downsizing. Thecompensation mechanism was set up by the monetary authority (Junta deRegulation Monetaria, or JRM) itself. This mechanism was based on two vari-ables: salary and seniority. More specifically, the compensation offered to thosewilling to resign was 1.7 times their average monthly salary in 1992, multipliedby their number of years of service in BCE. The resulting figure could not fallbelow 5 million sucres or rise above 50 million sucres (Ecuador's currency is thesucre). This amounted to a range of $3,600 to $36,000 per employee in 1992U.S. dollars. At that time, income per capita in Ecuador was about $1,400 per 'year. Over a period of slightly less than three months, BCE offered these packagesto all employees below retirement age. It gave a special committee discretionarypower to reject applications by employees that it considered essential.
Chaos ensued, as most employees thought the compensation offered was toogenerous to last and applied for severance. Work effort dropped, as many startedplanning their impending exit. Still, the trade union representing BCE employeesfought to improve the severance pay package, while employees above retirementage lobbied for access to it. The latter group saw its efforts rewarded less thanone week after the mechanism was announced, under the condition of relin-quishing the entitlement to an old-age pension. But later on, many of those whobenefited from the severance pay package sued BCE to get their pensions paidanyway. Last but not least, employees whose applications were rejected (mainlytellers) managed to mobilize some politicians to gain access to the package.
Yet, not all politicians were supportive. Congress questioned the legitimacyof the mechanism set up by the JRM, considering it an abuse of governmentfunds. Electoral competition placed the downsizing process under even moresevere criticism. A parliamentary commission was created to investigate the is-sue, and the chair of BCE faced the possibility of a trial. The Ministry of Finance,in turn, succeeded in taxing severance payments as income, which led yet an-other group of former employees to sue BCE. In the meantime, labor productivitydeclined further, due to the lack of selectivity of the reduction in personnel.When the government changed, the chair of BCE was finally dismissed.

Rama and Machaac 93
The second phase of the downsizing took place in 1994 in a very differentcontext. Under the new, more market-oriented government, parliament passed alaw for "modernization of the state." This law provided a framework for theimplementation of compensation packages. Moreover, the management of BCEdecided that the second phase of the downsizing had to be based explicitly onthe role and functions defined by the law for "monetary regulation and statebanking" of May 1992. Thus reducing the overlap between units and the exist-ing duplication of effort became a deliberate goal of the exercise. It was finallyagreed that BCE had to return to its size prior to the great expansion ofthe 1980s, which amounted to taking some 1,500 extra employees off thepayroll.
In practice, the second phase commenced with a classification of all personnelin three groups, labeled A, B, and C. BCE could not afford to lose employees ingroup A; they were therefore denied access to the new severance pay package.Employees in group C were clearly redundant, BCE could not legally fire them,however, so they were informed, on an individual basis, that new laws underpreparation would eliminate job security for government employees and thatnext time the compensation package offered to them would be much less gener-ous. This threat was very successful, in that all of the employees in group Cagreed to leave BCE. Finally, employees in group B were given the choice to stayin BCE or to take the severance pay and leave. We refer to employees in group Bas those who "had a choice" and to employees in group C as those who "had nochoice."
The JRM set compensation at twice the average monthly salary in 1993, mul-tiplied by the number of years of service with BCE. The resulting figure could notfall below 10 million sucres or exceed 400 times the national minimum wage,which effectively capped individual compensation at 26 million sucres. Sever-ance pay thus ranged from $4,800 to $12,400 per employee (in 1993 dollars).From the outset, the government agreed not to tax severance pay as income. Thetotal cost of the operation was on the order of 35 billion sucres (roughly $17million in 1993), and its financial payback period was estimated at 20 months.As before, the trade union and some politicians pressured the management ofBCE, but overall the process went much more smoothly than in the- first phase.
Compensation was the main component of the 1994 downsizing program,but not the only one. The program included a training mechanism to facilitatethe transition out of the public sector. Courses on microenterprise managementand financial investments were offered free of charge to any resigning employeewilling to take them. Other courses were organized at the request of some of theparting employees who wanted to become insurance agents in the private sector.For those staying, BCE overhauled the pay structure and working conditions andintroduced job descriptions and performance evaluations, BCE sold 9 of its 14buildings in order to regroup personnel physically. Reportedly, the morale ofthose who stayed with BCE improved.

94 THE WORLD BANK ECONOMIC REVIEW, VOL. 13, NO. 1
n. A SURVEY OF DISPLACED EMPLOYEES
To assess the change in earnings, employment status, and welfare experi-enced, we interviewed a relatively large proportion of displaced BCE employ-ees. Our survey focused on employees who had left BCE during the secondphase of downsizing. When this research project started, employees who hadleft during the first phase had been out of BCE for more than two years already.Given the time needed to implement and run the survey, we were concernedthat limited recall capabilities would lead to a distorted picture of employmentand earnings histories. More important, unlike the second phase, the first phasewas not characterized by a mix of voluntary and involuntary job separations,and this mix is key to controlling for self-selection. Due to budget constraints,we decided to survey the displaced employees who used to work in the Quitobranch of BCE only. For this group of employees, the target was the entirepopulation.
The management of BCE kindly provided us with copies of its own files for the1,380 employees who left in February and March 1994, including 455 from theQuito branch. These records include information on gender, age, and years ofexperience both while working in BCE and before joining. They also include totalearnings in 1992 and 1993. The management of BCE helped us to identify theappropriate person to run the survey. This person was the former social workerof the institution, who had been classified into the C group during the secondphase of downsizing. One of the survey questionnaires filled was therefore hers.The personal knowledge she had of many employees of the Quito branch wascrucial in securing a high rate of response. To minimize the risk that her per-sonal involvement could unwittingly influence the responses, multiple-choicequestions were used whenever possible.
Unfortunately, in the time elapsed since their resignation, many former BCEemployees had moved, including 38 who could not be found, 31 who had leftQuito, and 15 who had migrated out of the country. One of the former employ-ees had died, and four others did not want to cooperate with the survey. Becausethe responses to three of the questionnaires were quite incomplete, in the end wegot a sample of 366 displaced employees, of whom 359 answered'all of thequestions asked.
Roughly half of the surveyed employees were male, and three-quarters weremarried either legally or by common law. The average age was 37 years, and theaverage family size was slightly larger than five. Average schooling was 14 years,as almost two-thirds of the interviewees had received at least some postsecondaryeducation. In fact, a mere 4 percent had not finished high school. Average expe-rience was 11 years, with almost 70 percent of the sample reporting no workexperience before joining BCE. An astounding 98 percent of the interviewees hadbeen members of the trade union while still working for BCE. Finally, about 53percent of the displaced employees declared that they had no choice but to leaveBCE, while the rest could have stayed, had they wished to do so.

Rama and Maclsaac 95
HI. THE COMPENSATION PACKAGE
The compensation package, as perceived by BCE employees who left in 1994,included up to three components. The most important was the severance payestablished by the JRM, based on salary and seniority, but it was not the onlyone. BCE reimbursed all of the surveyed employees for past contributions to itsown old-age pension fund. Many of them also recovered their contributions tothe general unemployment insurance mechanism (Fondo de Reserva) managedby the Ecuadorian social security system. The top portion of table 1 indicateshow many of the interviewees had access to each of these three components andthe importance of each component in monetary terms. (All monetary figures intable 1 and hereafter are measured in millions of sucres at constant June 1995prices. At that time, the exchange rate was 2,500 sucres per U.S. dollar.)
Strictly speaking, only severance pay represents a compensation for job loss.The other two components of the package, it could be argued, actually belong tothe workers and only change hands at the time of their resignation. But thiswould be so only if two conditions held true. First, pensions and unemploymentbenefits would have to be based on actual contributions plus accrued interest.And second, BCE employees would have unrestricted access to credit. Under thesetwo assumptions, the net wealth of displaced employees would not be affectedwhen they cashed in their past contributions. However, neither of the two as-sumptions is likely to be true. It is usually agreed that salaried workers havelimited access to credit, and there is no reason to believe that Ecuador is an
Table 1. The Compensation Package and Its Use among Former Employeesof the Central Bank of Ecuador, 1994-95
Number of former Average value (millions of•Source and use of funds employees sucres at June 1995. prices)
Components of the package (1994)Basic severance pay packageContributions to old-age pensionContributions to unemployment insuranceTotal
Use of the package (1994-95)Current spending (food, clothing, etc.)Physical investment (car, house, etc.)Repayment of debtsTransfer to other family membersFinancial investmentLaunching or expansion of businessTotal
Note: The average yearly salary before separation was 22.1 million sucres in June 1995 prices. AllBCE employees received more than one type of compensation, and most spent it on more than one item.Individual amounts received and spent may not add up to the total due to rounding.
Source: Authors' calculations.
363363170363
1782528518160140363
30.218.6-.2.451.0
3.621.52.60.711.910.551.0

96 THE WORLD BANK ECONOMIC REVIEW, VOL. 13, NO. 1
exception in this respect. More important, Ecuadorian social security programsare characterized by a very tenuous link between contributions and benefits.
There are several reasons for the weakness of this link. To begin with, indi-vidual pensions in Ecuador are based on age, years of experience, and salary atretirement, rather than on past individual contributions. Moreover, even theaverage pension may bear little resemblance to the average contribution becausethe Ecuadorian social security system is not financially viable. It is thereforelikely that benefits will be eroded as the population grows older. (The BCE pen-sion fund is independent of the social security system, but pressures could mountto merge them as the general old-age pension program runs out of resources.)The discounted loss from relinquishing an old-age pension today is thereforemuch smaller than the present value of the contributions that would be neededto gain access to that pension. As regards the unemployment insurance mecha-nism, any money deposited in it by BCE employees was likely to be consideredlost, too, given the lifetime job security employees enjoyed. Because this thirdcomponent is minor compared with the other two, the decision whether to countit as compensation should not affect the analysis.
The lower portion of table 1 describes how interviewees used their compensa-tion packages. The breakdown refers to the sum of all cash payments they re-ceived as a result of their resignation, including severance pay, past contribu-tions to the old-age pension, and, for some, past contributions to theunemployment insurance mechanism. The first column of the table indicateshow many of the surveyed workers spent at least part of their package on eachof a series of items. The second column reports the average spending by item.Because of the long period elapsed since displacement, the resulting breakdownprobably reflects the equilibrium allocation, rather than a point in the transitiontoward equilibrium.
Physical investment, including the purchase of a car, a house, or an apartment,or the expansion of a previously owned house or apartment, was by far the. pre-ferred investment of displaced BCE employees. Almost 70 percent of the samplefavored this type of spending, which amounted on average to more than 40 percentof the compensation package (table 1). A similar fraction of the sample either madefinancial investments or canceled previous debts, but the amount spefit, on aver-age, was smaller (less than 30 percent of the compensation package). The propor-tion of those who used some of their compensation package to start or expand anindependent activity was considerable. For those who incurred this type of expen-diture, the average spending was roughly 27.2 million sucres (10.5 x 363 / 140),equivalent to more than one year of salary at BCE. Finally, about half of theinterviewees used part of the compensation to pay for consumption expenditures.For this group, the average consumption spending amounted to 7.3 million sucres(3.6 x 363 /178), which is roughly a quarter of the income they would have earnedsince the separation date, had they not resigned.
The survey asked displaced employees to report their earnings from investedcompensation. Because of the way the question was phrased, the answers do not
Rama and Maclsaac 97
include imputed rent on any housing acquired or built for own use or on anyother physical assets purchased, or capital gains or losses. Consequently, theseanswers refer only to cash returns. For financial investments, an adjustment wasneeded to infer real returns from the reported nominal returns because inflationwas high in Ecuador at the time of the survey. The calculation is made under theassumption of a monthly increase in consumer prices of 2 percent. This figure isbased on the actual inflation observed in the years surrounding the downsizingof BCE. Because such an adjustment would require heroic assumptions in thecase of diversified portfolios, returns are evaluated for former employees whomade either physical or financial investments, but not both.
Figure 1 shows the distribution of real returns on invested compensation. Theupper graph in the figure represents the rate of return on physical assets forthose interviewees who made no financial investments. The lower graph corre-sponds to the rate of return on financial assets for those who made no physicalinvestments. The distribution remains roughly unchanged if small investments(less than 1 million sucres at June 1995 prices) are set aside. The reported ratesof return correspond to a 12-month period, under the assumption that the monthlyreturns observed at the time of the interview remain constant over time. As aresult of this assumption, the variance of the observed returns is most likelyoverestimated.
Although the average rate of return on invested compensation is high, themedian rate is quite moderate and is definitely insufficient to sustain householdconsumption. It is actually zero in the case of physical investments, which im-plies that the latter were mostly made for the individual's own use. It is 17.5percent in the case of financial investments. Using 10-point intervals, the major-ity of those who actually get earnings from their investments lies in the 10-20percent interval. The income stream from a 10 percent return on the averagecompensation package represents less than a quarter of the average salary be-fore separation. Although not negligible, this figure clearly suggests that thecompensation packages would not allow displaced BCE employees to financetheir consumption expenditures out of rents only. Their ability to work remainskey for them to make a living.
IV. ACTIVITY AND EARNINGS AFTER DISPLACEMENT
The retrenched employees scarcely used the support mechanisms implementedby BCE to facilitate the job transition. Only 12 percent of them took any of thetraining courses offered, although these were provided free of charge. Similarly,only one interviewee reported having received help from BCE in the search for anew job. That was the social worker identified by BCE management to assist uswith the survey. It appears that the BCE trade union was not instrumental infacilitating the transition either, given that none of the interviewees receivedsupport from it. Displaced BCE employees were therefore on their own after theyresigned.

98 THE WORLD BANK ECONOMIC REVIEW, VOL. 13, NO. 1
Figure 1. Annual Rates of Return on Invested Compensation of FormerEmployees of the Central Bank of Ecuador, 1995
Observations100
Physical investments
Annual rate of return (percent)
Observations20-1
Financial investments
Source: Authors' calculations.
Annual rate of return (percent)
Rama and Machaac 99
Table 2 reports the activities they performed in the months following theirresignation. Because multiple answers were allowed, the monthly total in thetable exceeds the sample size. A slight upward trend in the gap between the twoindicates that multiple activities, and, more specifically, multiple jobs, becameincreasingly prevalent over time. A more significant trend concerns the public-private split in the jobs taken. Many interviewees kept doing work for BCE afterseparation, in one way or another, but almost all of this work was finishedabout eight months later. The number of interviewees holding salaried jobs inthe private sector increased accordingly. The expansion of self-employment waseven larger, with more than half of the sample moving to this category withinone year of displacement.
The new jobs seem to be characterized by their relatively low quality, ratherthan by their scarcity. The unemployment rate, measured as the displaced em-ployees who were unemployed as a proportion of those who either had a job orwere actively searching for one, never exceeded 15 percent. It was down to 10percent six months after separation and to only 6.5 percent by the end of theperiod. The relatively low unemployment rate was not due to a buoyant economy.(The growth rate of output was 4.3 percent in 1994 and 2.3 percent in 1995,implying almost stagnant output per capita, given how fast population grows inEcuador.) But not all the new jobs were in compliance with labor laws. By sixmonths after separation, less than a quarter of those employed were entitled tothe "teen" salaries, which are the quintessential mandated benefit in Ecuador(see Maclsaac and Rama 1997). The thirteenth to sixteenth salaries are pay-ments to be made to the worker at different times in the year, on top of thetwelve monthly salaries. An equally small fraction of the employed was enrolledwith social security, and barely 5 percent of those at work were unionized. Thesefigures are hardly surprising in a context where most of the interviewees wereself-employed, but they contrast sharply with the characteristics of former BCEjobs.
We calculated annual labor earnings after separation based on data corre-sponding to the month when the interview took place. The calculation includedboth cash earnings and payments in kind but excluded earnings from investedcompensation. We added the benefits mandated by law to the resulting figurewhen the interviewees declared that they were entitled to "teen" salaries. Con-versely, contributions to the social security system were subtracted for thosewho were enrolled in it. The rationale for this subtraction is the weakness of thelink between contributions and benefits, as discussed in section II. In the end,the average labor earnings of those who had a job amounted to 12.3 millionsucres per year (at June 1995 prices), which is roughly 55 percent of what theyused to make at BCE.
The survey also asked displaced BCE employees to compare their total house-hold earnings in each of the months after separation with the household earn-ings they had when they worked for BCE. In what follows, we identify this sub-jective assessment as the perceived earnings. More specifically, all interviewees

f
Table 2. Activity Following Separation from the Central Bank of Ecuador, by Month after Separation, 1994-95(percentage of former employees)
©
Activity
Private employeePublic employeeSelf-employedUnpaid family
workerUnemployedStudyHome careRetirementRest, travel,
and otherTotalSample size
(number ofindividuals)
1
9.712.728.0
5.29.76.0
26.10.7
18.7116.8
268
2
10.214.629.2
5.59.46.9
25.90.6
15.2117.4
363
3
11.313.234.7
6.39.46.6
26.20.6
10.5118.7
363
4
12.910.738.6
6.99.66.1
26.70.6
8.5120.7
363
5
15.29.4
41.0
6.39.15.5
26.20.6
7.7120.9
363
6
16.58.3
41.6
6.68.55.5
26.70.6
5.8120.1
363
7
17.54.7
43.5
6.98.36.1
27.10.6
6.4121.1
361
8
20.10.6
47.4
6.98.06.1
27.00.8
6.6123.4
363
9
21.50.3
47.4
6.97.76.1
26.70.8
5.5122.9
363
10
21.20.3
48.5
6.37.26.3
26.20.8
6.3123.1
363
11
24.20.0
52.1
4.47.76.9
24.51.1
4.7125.6
363
12
24.80.0
52.6
4.47.77.2
24.81.1
3.3125.9
363
13
27.00.3
51.5
3.97.76.9
24.81.1
2.5125.6
363
14
27.90.3
51.0
3.66.76.1
24.81.1
2.2123.7
359
15
29.40.3
50.7
4.25.96.6
23.10.7
1.7122.7
286
Note: The total exceeds 100 percent due to multiple answers by some of the interviewees. The sample size is smaller at the beginning of the period because severalinterviewees saw month 1 as a transition point and did not answer questions about it. The sample declines at the end of the period because the first interviews were carriedout during month 15.
Source: Authors' calculations.

Kama and Maclsaac 101
were asked to rank their monthly household earnings from 1 (much lower thanwhen in BCE) to 5 (much higher), with 3 corresponding to the status quo. Forthose households with no earnings at all in a particular month, a 0 was reported.The answers to this question thus provide an indication of the overall earningsdistribution over the 15 months following the downsizing. Table 3 summarizesthem.
Few interviewees had no household earnings at all in any particular monthafter separation. There were, however, some changes in the level of those earn-ings over time. The proportion with much higher household earnings than be-fore declined very quickly in the months following separation. This trend couldreflect a selective memory, whereby past times look better as they become moredistant, but it is more likely to result from the gradual completion of publicsector jobs reported in table 2. Indeed, the proportion of those who declaredmuch higher household earnings than when they worked for BCE dropped byhalf in the first eight months after separation, which is roughly the time periodover which pending assignments with BCE were finalized. The proportion withhousehold earnings similar to those they had before increased steadily over time.By the end of the period considered, the weighted average of the answers was2.7, which is not too far from the status quo. The perceived earnings loss thusappears to be smaller than the actual earnings loss.
The question remains whether earnings 15 months after separation, eitheractual or perceived, provide an adequate measure of future earnings. For in-stance, studies suggest that displaced U.S. workers experience a drop in earningsat first, but a gradual recovery over time (see Hamermesh 1989; Topel 1990;Jacobson, LaLonde, and Sullivan 1993). In the case of BCE employees, the analy-sis in section VI indicates a similar trend in earnings, at least for those who hadno choice, but this recovery takes place at declining rates and is negligible by thetime of the survey. More important, the recovery can be expected to be partialanyway because pay at BCE was probably out of line with private sector pay tobegin with. An important rent component in BCE salaries would make it difficultfor displaced employees to find similar deals subsequently. Therefore we assumethat the losses from displacement had materialized fully by the time of thesurvey.
V. THE ACTUAL EARNINGS LOSS
The most straightforward indicator of the loss experienced by displaced em-ployees is the change in their annual earnings, excluding returns from investedcompensation. This indicator could be criticized on the grounds that earningsbefore separation do not provide an appropriate counterfactual. A case could bemade that the appropriate comparison is with the earnings these employees wouldhave received had there been no downsizing. If the situation prior to downsizingwas unsustainable, it could be argued, earnings would have declined in any event.Alternatively, if the situation was sustainable, some of these employees would

Table 3. Earnings Following Separation Compared with Previous Earnings from the Central Bank of Ecuador, by Monthafter Separation, 1994-95(percentage of former employees)
Relative earnings'
Much higher (5)Higher (4)Similar (3)Lower (2)Much lower (1)No earnings (0)TotalSample size
(number ofindividuals)
1
19.521.018.426.211.23.7
100.0
267
2
16.322.918.227.512.13.0
100.0
363
3
13.523.420.127.512.43.0
100.0
363
4
12.223.821.327.612.23.0
100.0
362
5
10.823.321.628.512.53.3
100.0
361
6
10.823.221.827.313.03.9
100.0
362
7
11.323.422.027.811.34.1
100.0
363
8
10.722.924.227.310.54.4
100.0
363
9
10.522.424.427.710.54.4
100.0
361
10
9.922.125.427.611.0
3.9100.0
362
11
8.321.926.926.312.73.9
100.0
361
12
8.022.227.126.012.73.9
100.0
361
13
8.921.226.725.613.14.5
100.0
359
14
8.121.126.426.713.24.5
100.0
356
IS
7.422.024.528.712.15.3
100.0
282
Note: The sample size is smaller at the beginning of the period because several interviewees saw month 1 as a transition point and did not answer questions about it. Thesample declines at the end of the period because the first interviews were carried out during month 15.
a. The value in parentheses is the rank given to the category of relative earnings.Source: Authors' calculations.

Rama and Machaac 103
have gotten pay raises and promotions in the 15 months elapsed since separa-tion. More generally, the appropriate comparison would be between the lifetimeearnings profile after separation from BCE and the corresponding earnings pro-file in the case of no separation. But this comparison would require heroic as-sumptions, so that it is safer to stick to observed earnings before and afterseparation.
We define the actual earnings loss of individual i (AEL,) as:
(1) A£L, = l o g £ G - l o g £ ?
where £Gis the average annual salary at BCE in the two years preceding separa-tion and Ep represents annual labor earnings 15 to 18 months after separation.This indicator overestimates the loss in earnings when public sector employeeshold multiple jobs, including moonlighting and daylighting activities. But mul-tiple job holding was not all that common among the relatively well-paid BCEemployees. Note that when £ G and Ep are not too far apart, AELt can be inter-preted as a percentage change in earnings. Both £G and Ep are likely to dependon individual characteristics such as gender, education, and experience. Denot-ing the observable characteristic h of individual i as Xhi, we assume the follow-ing Mincerian specifications:
(2) log £G = aG0 + aG, X u + . . . + a ^ , + « c
(3) log Ep = ap0 + ap, X u + . . . + ap
kXki + up,
where the u terms capture the effect of unobservable characteristics on earnings.Some relevant individual characteristics, such as talent or aversion to effort,
are unfortunately unobservable. We assume that the effects of these characteris-tics on earnings before and after separation are correlated and write this hypoth-esis as:
(4) M^P^+E,-
where e, is a stochastic disturbance. Replacing above yields:
(5) AEL( = Po + PG log E* + pjX,, + . . . + p tX i ( - e;
with p; = paFj-afjifj * G and pG = 1 - p.
The actual earnings loss is therefore a function of the set of individual character-istics usually included in Mincerian equations, augmented to include annual earn-ings before separation.
Estimating equation 5 for displaced BCE employees would provide valuableinformation on the individual characteristics most likely to be associated with asignificant earnings loss. However, this estimation raises an econometric prob-lem: almost half of the displaced employees had no labor earnings at the time ofthe survey. From a mathematical point of view, the earnings loss AELt is notdefined in their case because it would involve the log of zero. We address this

104 THE WORLD BANK ECONOMIC REVIEW, VOL. 13, NO. 1
difficulty by using the percentage change in earnings (£? - £^) / £^as a proxy forAELj. A more fundamental concern is that the lack of earnings does not justrepresent another level of EPj but rather reflects either unemployment or with-drawal from the labor force. It can therefore be argued that the change in earn-ings experienced by those who are out of a job does not belong to the linearequation above. To address this concern, we correct for self-selection by esti-mating the earnings loss conditional on having a job.
Table 4 reports the results obtained when estimating equation 5 with andwithout a correction for self-selection.2 The correction is based on the Heckmanselection model. Due to the limited number of observations available, we applythis correction to the full sample only. The coefficients of the underlying selec-tion model (not reported in the table) indicate that women, married employees,and those with more seniority in BCE are less likely to hold a job after separationthan their otherwise identical fellows. However, the data reject the existence ofa self-selection bias, as shown by the similarity of the coefficients in the first twocolumns in table 4 and by the lack of significance of the X value in the secondcolumn. This outcome is not surprising in a small sample like ours, but it leadsus to focus on the results obtained without a correction for self-selection.3
Education is an individual characteristic that reduces the earnings loss signifi-cantly, according to table 4. Everything else being equal, the loss falls by roughly3 percent for each additional year of schooling. But after controlling for educa-tion, the loss is not significantly affected by the level of salaries at BCE. Theimplicit value of parameter p is thus close to 1. By contrast, the earnings lossincreases with work experience at BCE. In the Mincerian framework, work expe-rience could of course be seen as an indicator of age. However, experience out ofBCE does not increase the earnings loss, which suggests that more than a mereage effect is involved. One possible interpretation of the gap between the twoexperience coefficients is that longer careers at BCE are associated with heavierinvestments in specific skills that have low returns in the private sector. Anotherpossibility is that working for an overstaffed public sector agency entails a de-preciation of human capital. Finally, the earnings loss is larger for female andmarried employees, and it could be larger for those with more dependents aswell.
The effects of individual characteristics on the actual earnings loss have roughlythe same signs for all displaced employees regardless of whether they had the
2. The statistical significance of the coefficients in table 4 is probably underestimated. This is becauselog £<? is by assumption correlated with the other explanatory variables. In practice, the adjusted R1
coefficient of a regression of log £<; on all the Xu variables is 0.69. However, the discussion in the textimplies that omitting log E^from the regression would yield biased coefficients on the Xw variables.
3. The lack of adequate identifying variables further diminishes the relevance of the results obtainedwith a correction for self-selection. It is indeed difficult to claim that any of the variables in our surveyare highly correlated with participation in the labor force but not with the extent of the earnings loss ofthose who do participate. For instance, the number of dependents is typically assumed to be an identifyingvariable in other studies dealing with labor force participation and earnings. But the results in tables 4and 5 suggest that the number of dependents has a direct effect on earnings.

Rama and Maclsaac 1 OS
Table 4. Determinants of the Actual Earnings Loss of Former Employeesof the Central Bank of Ecuador
Full sample
Variable
Independent term
Log of wage at BCE
Schooling (years)
Experience at BCE (years)
Previous experience (years)
Married (yes = 1)
Female (yes = 1)
Number of dependents
Had a choice (yes = 1)
X value
Adjusted R2
F value(X2 value for Heckman)
Sample size
Ordinary leastsquares
1.3496(0.359)-0.0664(-0.283)-0.0324* •
(-2.471)0.0404"
(2.550)0.0155
(1.420)0.1760*
(1.789)0.3294* •
(4.041)0.0438
(1.571)-0.1815**
(-2.303)
0.1147
6.80359
Heckmanselection model
-1.3883(-0.261)
0.0799(0.242)-0.0414**
(-2.106)0.0420*
(1.736)0.0253
(1.506)0.1323
(0.875)0.2469*
(1.733)0.0655*
(1.664)-0.2951**
(-2.529)0.0642
(0.224)
27.21359
Hadno choice?
2.5765(0.709)-0.1293(-0.570)-0.0251*(-1.954)
0.0298*(1.943)0.0146
(1.393)0.0670
(0.685)0.2604**
(3.115)0.0275
(1.025)
0.0851
3.51190
Had achoice*
-0.2610(-0.037)
0.0072(0.016)-0.0370
(-1.503)0.0532*
(1.784)0.0182
(0.882)0.2460
(1.413)0.3782* *
(2.595)0.0614
(1.151)
0.1051
3.82169
* Significant at 10 percent.** Significant at 5 percent.Note: The table compares 1995 with 1992-93 at June 1995 prices. The dependent variable, actual
earnings loss, is the wage at the Central Bank of Ecuador (BCE) minus earnings after separation as aproportion of the wage at BCE. t values are reported in parentheses.
a. Estimated using ordinary least squares.Source: Authors' calculations.
choice of staying with BCE (table 4). But when we split the sample between vol-untary and involuntary separations, the hypothesis that the p* coefficients multi-plying observable characteristics are the same for the two groups is rejected.Other things being equal, the loss is larger for those who were forced to leave, asshown by the negative and statistically significant coefficient on the dummyvariable for choice. Taken at face value, this coefficient implies that the earningsloss of employees who had a choice is roughly 18 percentage points smaller thanthat of those who had no choice.
VI. THE PERCEIVED EARNINGS LOSS
We use subjective assessments of household earnings after separation to con-struct a second indicator of the loss experienced by displaced BCE employees. As

106 THE WORLD BANK ECONOMIC REVIEW, VOL. 13, NO. 1
discussed in section IV, these assessments yield a slightly different (more posi-tive) view of earnings after downsizing, compared with the actual figures. Thisdifference could merely reflect measurement error in either or both of the twoearnings indicators. In this case, subjective assessments allow us to evaluate therobustness of the results obtained based on actual earnings figures. But subjec-tive assessments may capture more accurately the employees' sentiments follow-ing downsizing. Thus this second indicator of the earnings loss may be as rel-evant as the first one, in spite of being less precise.
We define the perceived earnings loss of household i in month t after separa-tion (PELit) based on the employee's assessment of household earnings in thatmonth (PHEit), as follows:
(6) PELit = 3-PHEit.
By definition, PHEit is equal to 0 in the case of no earnings and equal to 5 whencurrent earnings are much higher than the salary at BCE. The case where PHEit =3 corresponds to the status quo. As a result, PELU is an integer varying from 3for very large losses to - 2 for large gains, with 0 reflecting no change. Note thatbecause of the way it is defined, PELit measures the loss relative to householdearnings while still working for BCE and therefore bears some similarity to AELt.
By analogy with the analysis in section V, we assume the following relation-ship between PELit and the observable characteristics of individual i:
(7) PELit = Yo + YG log £?+ Yi^i/ + • • • + Y*X*. + Yn ' +
The right-hand-side variables in this relationship are the same ones used to ac-count for the actual earnings loss, plus a time trend and its square (t and t2,respectively). Indeed, many monthly observations are now available per em-ployee, so that it becomes possible to analyze how earnings losses evolve overtime. However, the coefficients on the common regressors are not strictly com-parable across the two relationships because PELit is not defined in the sameway as AELt. As a result, there is no direct link between the coefficients in theequation above and the a coefficients in the Mincerian equations for earnings inand out of the public sector (equations 2 and 3). This means, in particular, thatYG is not equal to 1 - p any more.
Table 5 reports the estimation results for the determinants of the perceivedearnings loss. Given the rejection of the self-selection model in the previous sec-tion, and given also the fact that only 5 percent or less of the employees reportno household earnings in any particular month, the estimation was carried outby ordinary least squares. The coefficients in table 5 have a higher significancethan those in table 4 due to the panel data aspect of the analysis. Not surpris-ingly, the signs of most of the coefficients are the same in the two tables. Asbefore, the earnings loss is smaller for employees with more education. It islarger for those with longer careers at BCE, for female and married employees,and for those with more dependents, as well. The loss also appears to be largerfor those who had no choice. There is, however, an important difference be-

Rama and Maclsaac 107
tween the two tables. In table 5 there is a significantly negative association be-tween the perceived earnings loss and the salary while at BCE. This means that,everything else being equal, employees at the top of the BCE hierarchy lost less, inrelative terms, than those at the bottom.
For the sample as a whole, table 5 displays a gradual recovery in householdearnings over time. However, trends are different depending on whether theemployees had a choice. For those who had a choice, the coefficients on the timetrend and its square are statistically insignificant. Their household earnings werethus fairly stable after separation. For those who had no choice, household earn-ings were lowest at separation and then increased gradually. If the obtainedcoefficients are taken literally, household earnings stabilized roughly one year
Table 5. Determinants of the Perceived Earnings Loss of Former Employeesof the Central Bank of Ecuador
Variable
Independent term
Log of wage at BCE
Schooling (years)
Experience at BCE (years)
Previous experience (years)
Married (yes = 1)
Female (yes = 1)
Number of dependents
Time (in months)
Time squared
Had a choice (yes = 1)
Adjusted R1
F valueSample size
Full sampleWithout dummy
for choice
20.7893 "(13.401)-1.1671"
(-12.062)-0.0850**
(-15.649)0.0391**
(5.958)0.0071
(1.581)0.1629**
(4.010)0.5859**
(17.379)0.1106**
(9.588)-0.0378**(-2.498)
0.0014(1.619)
0.1675123.01
5,458
With dummyfor choice
20.7380**(13.368)-1.1625**
(-12.012)-0.0848**
(-15.605)0.0390**
(5.940)0.0073
(1.618)0.1562**
(3.830)0.5895**
(17.456)0.1105**
(9.577)-0.0370**(-2.446)
0.0013(1.555)-0.0570*(-1.741)
0.1678111.05
5,458
Hadno choice
19.0599**(9.016)-1.0586**(-8.028)-0.0745**(-9.912)
0.0249**(2.789)0.0068
(1.105)-0.0194(-0.326)
0.5259 **(10.757)
0.1416**(9.004)-0.0469**(-2.282)
0.0020*(1.693)
0.159062.59
2,934
Had achoice
24.5693 »*(10.711)-1.4025**(-9.812)-0.0920* *
(-11.486)0.0629**
(6.456)0.0114*
(1.701)0.3462**
(6.091)0.6854**
(14.451)0.0564**
(3.245)-0.0249
(-1.114)0.0006
(0.434)
0.189266.41
2,524
* Significant at 10 percent.** Significant at 5 percent.Note: The table compares 1995 with 1992-93 at June 1995 prices. The dependent variable is the
perceived monthly loss in household earnings; it is an integer that can take a value between 3 (very largelosses) and -2 (large gains). The estimates were obtained by ordinary least squares, t values are reportedin parentheses.
Source: Authors' calculations.

108 THE WORLD BANK ECONOMIC REVIEW, VOL. 13, NO. 1
after separation. These different trends suggest that those who left voluntarilyalready had an alternative out of the public sector at the time of separation,whereas the rest of the employees were relatively unprepared to cope with theirnew situation.
The time trends remain roughly unchanged if fixed-effect estimates are used(results are not reported here). However, most of the coefficients on the Xh vari-ables become statistically insignificant. Fixed-effects estimates are obtained byreplacing the perceived earnings loss variable PELit with its deviation with re-spect to the individual mean (PELit - PELj). It follows that individual character-istics have an impact on the magnitude of the perceived earnings loss but not onits variation over time.
VII. THE IMPLICIT WELFARE LOSS
The change in well-being experienced by displaced employees has dimensionsthat are not necessarily captured by changes in earnings, either actual or per-ceived. The total loss can be higher than suggested by the corresponding earn-ings loss, if more effort is needed to achieve the same living standard as before.It can also be higher if the variability of earnings increases as a result of displace-ment, or if the prospects for earnings growth over time are worse out of BCE thanin it. The total loss can be lower, however, if the observed earnings loss reflectsa deliberate withdrawal from the labor force. Last but not least, the impact ofthe earnings loss on well-being is mitigated by the compensation received. Forall of these reasons, an evaluation of the consequences of displacement would bepartial if it focused on earnings only.
Rather than try to correct the earnings losses for these other dimensions ofthe change in well-being, in this article we generate a direct measure of the wel-fare loss ensuing from displacement. This measure is constructed from a subjec-tive assessment of well-being after separation. Of course, subjective assessmentsof this kind raise perennially thorny questions about the comparability of utilitylevels across individuals. But in spite of their limitations, they have been usedfruitfully before. For instance, there is a growing literature on the links betweenhappiness and employment status relying on indicators of psychological distressas a measure of disutility (see, for instance, Clark and Oswald 1994; Korpi 1997).In the present context, subjective evaluations of well-being can be used to iden-tify the individual characteristics that are more strongly associated with distressafter job separation.
Specifically, the surveyed employees were requested to evaluate their well-being relative to the time when they worked for BCE. The questionnaire explic-itly listed a series of elements that needed to be taken into account when answer-ing this question. The list included labor earnings and satisfaction at work ifapplicable, leisure time available, the possible implications of displacement forlabor force participation and migration of any members of the household, andthe amount of compensation received. The answer, hereafter identified as the

Rama and Madsaac 109
perceived well-being of the household (PHW,), is an integer ranging from 1 (whenwell-being is much lower than before separation) to 5 (when it is much higher).The case where PHWj = 3 corresponds to the status quo.
By analogy with the perceived earnings loss, the perceived welfare loss ofhousehold i {PWLj) is defined as:
(8) PWrL, = 3-.PHW I,
By construction, PWLj is an integer varying from 2 (for a large loss) to - 2 (for alarge gain), with 0 reflecting no change. This variable can be linked to individualcharacteristics like those considered in the analysis of the determinants of theactual earnings loss. But the perceived loss of well-being is also affected by theamount of compensation received (C,). The following specification can there-fore be used:
(9) PWLi = 80 + 5C log EGt + 8C log C, + 8, XM + . . . + 8tX4( + %
where coefficient 8C is expected to be negative.Unlike the actual or perceived earnings, which are calculated or reported based
on monetary figures, the level of well-being cannot be measured objectively.Consequently, the distance between adjacent values of PHWj is not necessarilyconstant. For instance, the gap in household well-being between 1 and 2 couldbe much larger, or much smaller, than the gap between 4 and 5. The problem isthe same with PWLj. An ordered logit regression is therefore warranted to esti-mate the coefficients in equation 9. In practice, however, this estimate yieldsalmost identical values for all of the distances between adjacent levels of PWLj,while reducing the significance of the estimated coefficients compared with anordinary least squares estimate.
Table 6 reports the results obtained using ordinary least squares. The statisti-cal significance of the coefficients may be more seriously underestimated than inthe previous two sections, due to the inclusion of log C, among the regressors.Severance pay was based on salary and seniority in BCE, so that the correlationamong right-hand-side variables is potentially very high. Fortunately, there wereupper and lower bounds on the amount of severance, and the latter was onlyone of the components of the compensation package. Still, the adjusted R2 of aregression between log C, and the other regressors is 0.82.
The main difficulty in interpreting the coefficients in table 6 stems from thelink between perceived well-being and the amount of compensation received.Because separated employees were compensated, their net welfare loss underes-timates the impact that displacement, on its own, had on their well-being. Thisimpact is called the implicit welfare loss in what follows. Note that from a policyperspective, it is relevant to know how the implicit welfare loss varies with theindividual characteristics of the employees. This information could help in thedesign of assistance strategies for displaced employees elsewhere. Knowing howthe net welfare loss varies with individual characteristics is less relevant becausetheir observed effects depend on the rules used to set up the compensation pack-

110 THE WORLD BANK ECONOMIC REVIEW, VOL. 13, NO. I
Table 6. Determinants of the Perceived Loss of Weil-Being of FormerEmployees of the Central Bank of Ecuador
Variable
Independent term
Log of wage at BCE
Schooling (years)
Experience at BCE (years)
Previous experience (years)
Married (yes = 1)
Female (yes = 1)
Number of dependents
Log of compensation received
Had a choice (yes = 1)
Adjusted R2
F valueSample size
Full sampleWithout dummy
for choice
18.5153"(3.642)-0.4945(-1.415)-0.0841"(-5.139)
0.0711"(2.895)0.0249*
(1.689)0.0100
(0.082)-0.0757(-0.746)
0.0800"(2.301)-0.5723*
(-1.896)
0.15219.029
359
With dummyfor choice
18.1507"(3.593)-0.4910(-1.414)-0.0833"(-5.126)
0.0694"(2.841)0.0251*
(1.716)-0.0178(-0.146)-0.0613(-0.607)
0.0794* *(2.299)-0.5477*(-1.825)-0.2328**(-2.385)
0.16338.765
359
Hadno choice
14.8293**(2.180)-0.2872(-0.646)-0.0824"(-3.784)
0.0621 **(1.927)0.0128
(0.665)-0.1786(-1.031)-0.0140(-0.099)
0.0641(1.405)-0.5411(-1.401)
0.12254.298
190
Had achoice
20.7632"(2.665)
-0.7764(-1.384)-O.0798"(-3.156)
0.0726*(1.863)0.0377
(1.635)0.1141
(0.638)-0.1370
(-0.898)0.1022*
(1.851)-0.4492
(-0.912)
0.15244.777
169
* Significant at 10 percent.* * Significant at 5 percent.Note: The table compares 1995 with 1992-93 at June 1995 prices. The dependent variable is perceived
loss of well-being; it is an integer that can take a value between 2 (large losses) and -2 (large gains). Theestimates were obtained by ordinary least squares, t values are reported in parentheses.
Source: Authors' calculations.
ages, and the specifics of those rules are likely to vary from one downsizingoperation to another.
Fortunately, the implicit welfare loss of separated employees can be inferredfrom their perceived welfare loss. A conceptual experiment may be useful here.Imagine that there is an individual whose compensation package C, exactly off-sets the impact of displacement on well-being, so that there is no perceived wel-fare loss (that is, PWL/ = 0). For this particular individual, the amount of com-pensation received provides a monetary measure of the implicit welfare loss. Ofcourse, there may not be many individuals in the sample for whom ? WL, = 0, sothat this measure is generally not available. But the estimated values of the 5coefficients allow us to predict the amount of compensation that would havebeen needed to keep the level of well-being of the separated employees unchanged,given their observable characteristics.
In analytical terms, we define the implicit welfare loss of individual i
Rama andMaclsaac 111
as the value of log C, for which the predicted value of the perceived welfare lossPWLj is equal to 0, which implies:
= e0 + eG log
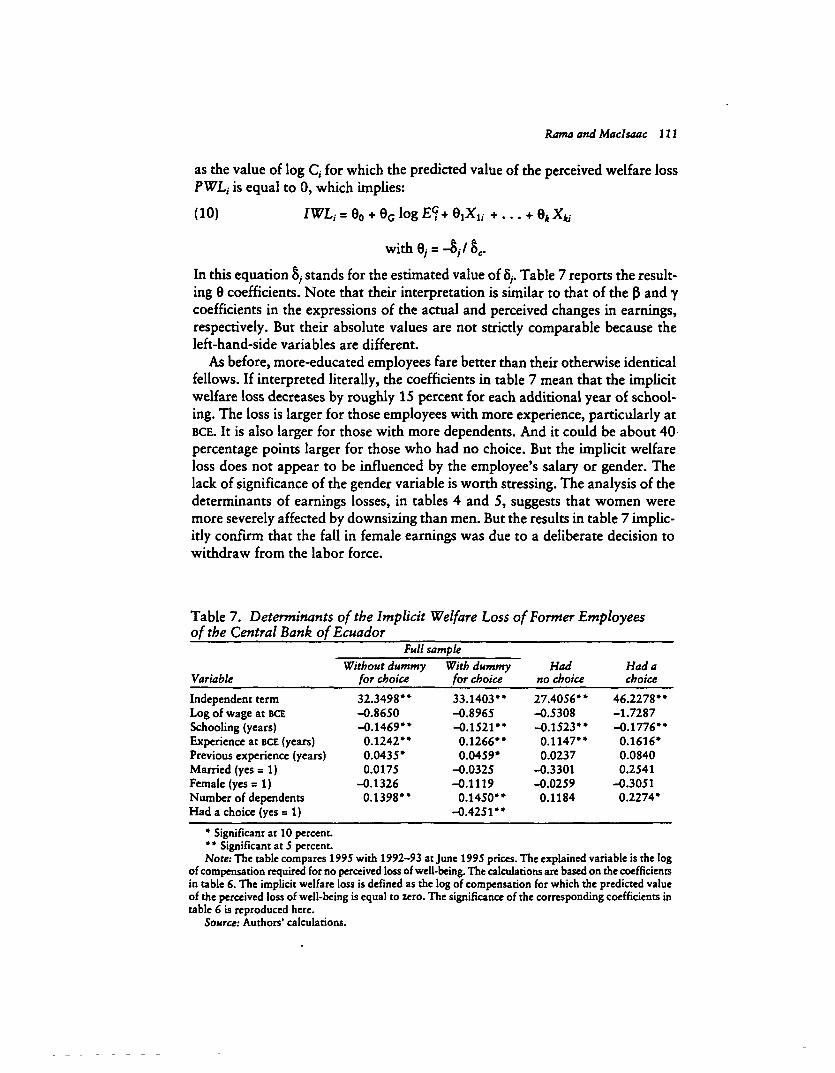
In this equation 87 stands for the estimated value of 8,-. Table 7 reports the result-ing 8 coefficients. Note that their interpretation is similar to that of the p and ycoefficients in the expressions of the actual and perceived changes in earnings,respectively. But their absolute values are not strictly comparable because theleft-hand-side variables are different.
As before, more-educated employees fare better than their otherwise identicalfellows. If interpreted literally, the coefficients in table 7 mean that the implicitwelfare loss decreases by roughly 15 percent for each additional year of school-ing. The loss is larger for those employees with more experience, particularly atBCE. It is also larger for those with more dependents. And it could be about 40'percentage points larger for those who had no choice. But the implicit welfareloss does not appear to be influenced by the employee's salary or gender. Thelack of significance of the gender variable is worth stressing. The analysis of thedeterminants of earnings losses, in tables 4 and 5, suggests that women weremore severely affected by downsizing than men. But the results in table 7 implic-itly confirm that the fall in female earnings was due to a deliberate decision towithdraw from the labor force.
Table 7. Determinants of the Implicit Welfare Loss of Former Employeesof the Central Bank of Ecuador
Full sample
VariableWithout dummy
for choice
32.3498"-0.8650-0.1469**0.1242**0.0435*0.0175
-0.13260.1398**
With dummyfor choice
33.1403**-0.8965-0.1521**0.1266**0.0459*
-0.0325-0.11190.1450**
-0.4251**
Hadno choice
27.4056**-0.5308-0.1523**0.1147**0.0237
-0.3301-0.02590.1184
Had achoice
46.2278**-1.7287-0.1776* *
0.1616*0.08400.2541
-0.30510.2274*
Independent termLog of wage at BCESchooling (years)Experience at BCE (years)Previous experience (years)Married (yes = 1)Female (yes = 1)Number of dependentsHad a choice (yes = 1)
* Significant at 10 percent.** Significant at 5 percent.Note: The table compares 1995 with 1992-93 at June 1995 prices. The explained variable is the log
of compensation required for no perceived loss of well-being. The calculations are based on the coefficientsin table 6. The implicit welfare loss is defined as the log of compensation for which the predicted valueof the perceived loss of well-being is equal to zero. The significance of the corresponding coefficients intable 6 is reproduced here.
Source: Authors' calculations.

112 THE WORLD BANK ECONOMIC REVIEW, VOL. 13, NO. 1
Ex post regret at having left BCE provides yet another way of assessing thewelfare loss from displacement, at least in principle. All of the surveyed employ-ees were asked whether, in retrospect, they would have preferred to stay withBCE. Their answer to this question can be assumed to be a function of the sameobservable characteristics considered before. It can also be expected to dependon the amount of compensation received. If such a function could be estimated,it would be possible to predict, for each individual in the sample, the amount ofcompensation that would have achieved ex post indifference. Such an amount,in turn, would provide another measure of the implicit welfare loss. A binarydependent variable model was thus estimated for the ex post regret variable,with the right-hand-side variables being the same as for the perceived loss ofwell-being. Unfortunately, the overall fit of the regression is poor, except in thecase of the employees who had a choice. The estimated coefficients are thereforenot reliable enough to make inferences about the amount of compensationthat would have left displaced BCE employees indifferent between staying andleaving.
VIII. POLICY IMPLICATIONS
In spite of the small sample size, our analysis of the changes in earnings andwelfare experienced by displaced BCE employees has potential implications fordownsizing operations elsewhere. These implications refer to the design of cost-effective ways to support displaced workers. To some extent, our analysis couldalso be interpreted as an ex post evaluation of downsizing at BCE. But such anevaluation would be intrinsically partial, for two reasons. First, when thedownsizing operation was decided on, the management of BCE did not have thekind of hindsight that our survey gives us. It would certainly be unfair to judgethe decisions it made using information that was not available at that time. Andsecond, our analysis can only tell us how the displaced employees fared afterseparation. It cannot tell us which among all BCE employees should have beenseparated in the first place.
A warning from our analysis concerns the potential of training programs tofacilitate the redeployment process. In the case of BCE, only 12 percent of thedisplaced employees took any of the courses offered, although these were pro-vided free of charge. This finding is similar to those from other studies (seeLindauer and Nunberg 1994) and runs against the belief that training programsmust be an important component of downsizing operations. These programstend to be costly and may become easy prey for ailing training agencies. If sepa-rated workers shun them, resources could be better spent on things they value,namely, direct compensation.
Other policy implications from our analysis are related to the appropriatedesign of compensation packages. Our analysis highlights the links between theobservable characteristics of public sector workers and the extent of the lossesthey experience as a result of displacement. The ability to predict those losses

Rama and Maclsaac 113
may be particularly important in cases where involuntary separations are pre-cluded by law. It may also be important when compensation is required due tofairness considerations or as a matter of political feasibility. No valid reasonsexist, however, for overcompensating displaced workers. The results in this ar-ticle could therefore be useful in mitigating some of the overcompensation biasthat characterizes downsizing programs based on voluntary job separations.
A result obtained consistently across the study is the negative association be-tween schooling and losses from displacement. Employees with higher levels ofeducation experience smaller earnings and welfare losses than their otherwiseidentical fellows. Severance pay packages that fail to take schooling into ac-count may therefore lead to a public sector brain drain. This possibility can onlybe exacerbated when the amount of compensation offered is a multiple of thepublic sector salary.4 Our results indicate that after controlling for other indi-vidual characteristics, the losses from displacement (in relative terms) are at bestindependent of the level of salaries in the public sector. If anything, there is anegative association between salaries and relative losses. A compensation pack-age that increases proportionally with the salary is more attractive for employ-ees who are at the top of the public sector ladder than for those at the bottom,whereas redundancies tend to be more prevalent at the bottom. However, theresults show that the losses from displacement do increase with seniority in thepublic sector, as is assumed by the standard rules of thumb for compensation.
Another result that deserves attention concerns gender. At first glance, womenlose more than men from displacement. As a percentage of public sector salaries,their earnings losses appear to exceed those of men by about 30 points. But thegap is partly explained by the withdrawal of many female employees from thelabor force after separation. Employees who withdraw from the labor force ex-perience a drop in earnings, but not necessarily a large reduction in welfare.Table 8 reports a low correlation between actual earnings loss and implicit wel-fare loss, particularly for employees who had a choice. The implicit welfare loss,in fact, does not vary significantly with gender. Because compensation packagesaim at offsetting welfare losses rather than earnings losses, our results suggestthat the packages should be similar for men and women.
A final policy implication of our analysis is that a poor tailoring of compensa-tion to individual characteristics can be both unfair and expensive. As shown intable 8, the correlation coefficient between the compensation received and theactual earnings loss is low, particularly in the case of displaced employees whohad a choice. The correlation coefficient between the compensation receivedand the implicit welfare loss is even lower. In the context of involuntary separa-tions, these low correlation coefficients imply that some employees are penal-ized (or rewarded) much more than others by the downsizing process. The per-ceived unfairness of this process can, in turn, create resistance to further publicsector restructuring. In a context of voluntary separations, moreover, the low
4. Whether education and other individual characteristics can actually be used to tailor compensationpackages depends, of course, on legal, political, and social considerations specific to each country.

114 THE WORLD BANK ECONOMIC REVIEW, VOL. 13, NO. 1
Table 8. Correlation between Loss Indicators for Former Employees of theCentral Bank of Ecuador
Indicator
Had no choiceActual compensation receivedActual earnings lossPerceived earnings loss
Had a choiceActual compensation receivedActual earnings lossPerceived welfare loss
Actualearnings loss
0.44481.00000.3822
0.36271.00000.3186
Perceivedearnings loss
-0.01610.38221.0000
0.00050.31861.0000
Implicitwelfare loss
0.31340.25400.1937
0.22290.15060.1697
Note: The table compares 1995 with 1992-93 at June 1995 prices. Actual compensation receivedincludes returned contributions to old-age pensions and to unemployment insurance, in addition toseverance pay. The perceived earnings loss is the individual average over the months following separation.The implicit welfare loss is calculated based on the coefficients in table 7.
Source: Authors' calculations.
correlation between compensation and losses may substantially increase the costof downsizing operations. Assume for a moment that employees have accurateexpectations about their prospects out of the public sector. If this is so, those forwhom compensation exceeds the expected welfare loss will leave the public sec-tor, while the others will stay. The former mistake will thus lead to overspend-ing, while the latter will not achieve any savings because the separation offerwill be rejected.
Table 9 compares the actual cost of BCE downsizing with the cost of payingeach displaced employee the equivalent of his or her implicit welfare loss. The twocosts turn out to be similar for the employees who had no choice. But the cost ofdownsizing could have been smaller in the case of those who had a choice, had thecompensation packages been better tailored. On average, the actual compensationreceived by these employees, including refunds of past contributions to sociafse-
Table 9. The Cost of Alternative Compensation Rules(average per employee)
In millions As a multiple As a percentageof sucresat of the wage of actual
Indicator June 199'5 prices at the BCE compensation paid
Had no choiceActual compensation received 50.89 2.26 100.0Implicit welfare loss 55.63 2.47 109.3
Had a choiceActual compensation received 51.58 2.29 100.0Implicit welfare loss 41.78 1.86 81.0
Note: The implicit welfare loss was calculated based on the coefficients in table 7. Actual compensationreceived includes returned contributions to old-age pensions and to unemployment insurance, in additionto severance pay.
Source: Authors' calculations.
Rama and Machaac 115
curity, amounted to 2.3 years of salary. Note that 2.3 years is the average paybackperiod of downsizing operations across the episodes surveyed by Haltiwanger andSingh (this issue). Our estimates suggest that an average of 1.9 years would havebeen enough to compensate appropriately for the ensuing welfare losses. The totalcost of the voluntary component of the downsizing operation would then havebeen about 20 percent lower than it actually was.
IX. CONCLUSIONS
Public sector downsizing will almost certainly become a major policy endeavorin the coming years. In the case of developing countries, efforts at trimming thepayroll will affect highly organized and vocal groups of public sector workers,thus giving a prominent role to compensation issues. Yet, relatively little is knownabout the nature and extent of the losses these workers may experience. Giventhe paucity of information, and given also the need to defuse the potential resis-tance to restructuring, governments around the world may be tempted by the"golden handshake" approach. A problem with this approach is that it mayexacerbate the adverse selection problem that plagues most downsizing pro-grams, whereby competent and hard-working employees leave the public sector,while those who are a real drag on efficiency stay. But even if the only separatedworkers are those who are genuinely redundant, golden handshakes could stillsignificantly increase the cost of public sector restructuring. Typically, a majordownsizing program has a price tag in the hundreds of millions of dollars. Ifignorance about the losses that displaced workers may experience leads to a"mere" 10 percent premium on the compensation offered, the total cost mayincrease by several tens of millions of dollars. All of this suggests that a carefulassessment of the losses that displaced workers may experience is warranted.
In this article we analyzed one particular episode of downsizing, but the find-ings may have implications for other cases as well. First, we showed that in spiteof their popularity, training programs may be ineffective in assisting displacedemployees. Second, we showed that both earnings and welfare losses are corre-lated with a variety of observable individual characteristics, such as educationor the number of dependents, and not just with salary and seniority in the publicsector, which are the two variables considered by the standard rules of thumbused for compensation. These rules implicitly assume that the loss from dis-placement increases with seniority, which is supported by our analysis. But theyalso assume that the loss decreases with salary, which is rejected. Finally, weshowed that the savings from better-tailored compensation can be substantial,particularly in the case of public sector workers who are offered the option ofstaying in the public sector.
The particular episode we analyzed was quite remarkable, in the sense thatoverspending was moderate in the case of the employees who had a choice andslightly negative in the case of those who had no choice. It is probable that themanagement of BCE, rather than luck, deserves the credit for this relatively good

116 THE WORLD BANK ECONOMIC REVIEW, VOL. 13, NO. 1
performance. Unlike the first phase of the downsizing process, the second phasewas indeed characterized by attention to details. And it would appear that theselection process to distinguish the employees who were dispensable from thosewho were essential might have been successful as well. But it would be a mistaketo assume that the second phase of BCE downsizing can be easily replicated else-where. In the absence of careful preparation, the standard downsizing operationis more likely to resemble the first phase.
REFERENCES
The word "processed" describes informally reproduced works that may not be com-monly available through library systems.
Alderman, Harold, Sudarshan Canagarajah, and Stephen Younger. 1996. "A Compari-son of Ghanaian Civil Servants' Earnings before and after Retrenchment." Journal ofAfrican Economies 4(2):259-88.
Clark, Andrew E., and Andrew J. Oswald. 1994. "Unhappiness and Unemployment."Economic Journal 104(424):648-59.
Hamermesh, Daniel S. 1989. "What Do We Know about Worker Displacement in theU.S.?" Industrial Relations 28(Winter):51-59.
Jacobson, Louis S., Robert J. LaLonde, and Daniel G. Sullivan. 1993. "Earnings Lossesof Displaced Workers." American Economic Review 83(4):685-709.
Korpi, Tomas. 1997. "Is Utility Related to Employment Status? Employment, Unem-ployment, Labor Market Policies, and Subjective Weil-Being among Swedish Youth."Labour Economics 4(2):125-47.
Lindauer, David L., and Barbara Nunberg, eds. 1994. Rehabilitating Government: Payand Employment Reform in Africa. World Bank Regional and Sectoral Study. Wash-ington, D.C.: World Bank.
Maclsaac, Donna, and Martin Rama. 1997. "Do Labor Market Regulations Affect La-bor Earnings in Ecuador?" Journal of Labor Economics 15(3, pt. 2):136-65.
Robbins, Donald. 1996. "Public Sector Retrenchment and Efficient Severance PaySchemes: A Case Study of Argentina." Harvard Institute for International Develop-ment, Cambridge, Mass. Processed.
Tansel, Aysit. 1997. "Public Sector Retrenchment and the Impact of Labor SheddingPrograms on Workers in Turkey." Department of Economics, Middle East TechnicalUniversity, Ankara. Processed.
Topel, Robert. 1990. "Specific Capital and Unemployment: Measuring the Costs andConsequences of Job Loss." Carnegie-Rochester Conference Series on Public Policy33(0):181-214.