east africa crossborder trade bulletin april 2015 … gha... · east africa crossborder trade...
TRANSCRIPT
EAST AFRICA CROSSBORDER TRADE BULLETIN APRIL 2015 VOLUME IX
1
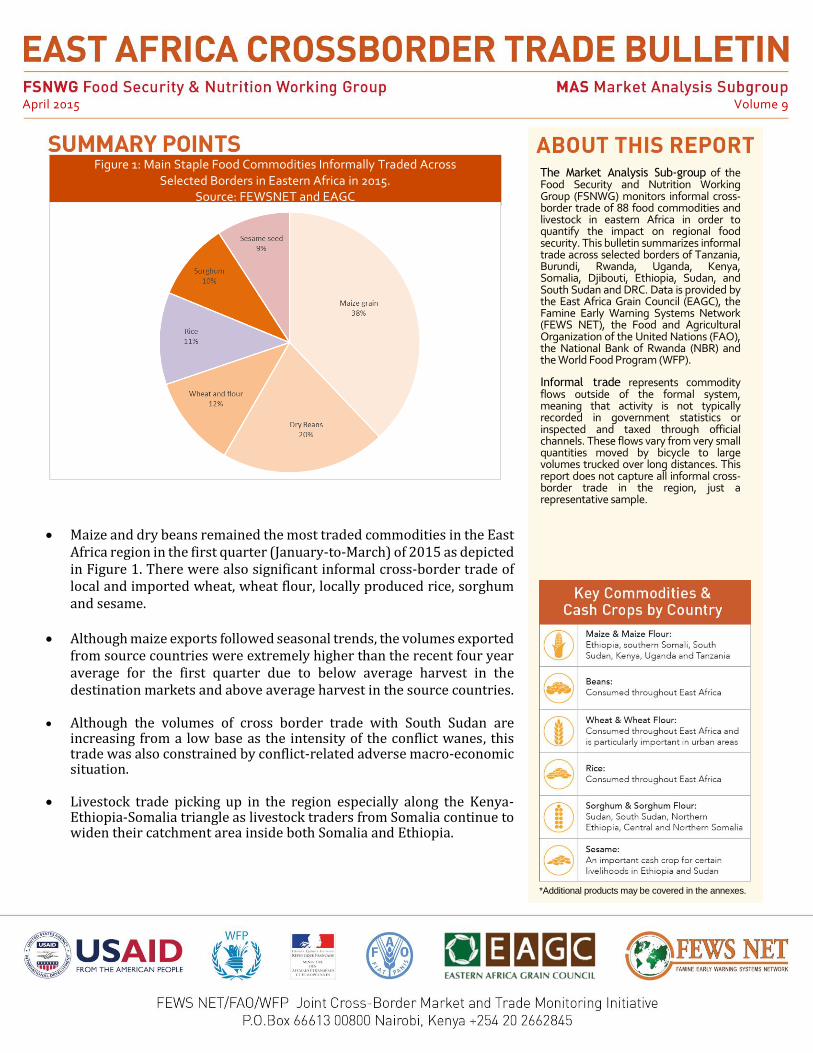
Maize and dry beans remained the most traded commodities in the East Africa region in the first quarter (January-to-March) of 2015 as depicted in Figure 1. There were also significant informal cross-border trade of local and imported wheat, wheat flour, locally produced rice, sorghum and sesame.
Although maize exports followed seasonal trends, the volumes exported from source countries were extremely higher than the recent four year average for the first quarter due to below average harvest in the destination markets and above average harvest in the source countries.
Although the volumes of cross border trade with South Sudan are
increasing from a low base as the intensity of the conflict wanes, this trade was also constrained by conflict-related adverse macro-economic situation.
Livestock trade picking up in the region especially along the Kenya-Ethiopia-Somalia triangle as livestock traders from Somalia continue to widen their catchment area inside both Somalia and Ethiopia.
The Market Analysis Sub-group of the Food Security and Nutrition Working Group (FSNWG) monitors informal cross-border trade of 88 food commodities and livestock in eastern Africa in order to quantify the impact on regional food security. This bulletin summarizes informal trade across selected borders of Tanzania, Burundi, Rwanda, Uganda, Kenya, Somalia, Djibouti, Ethiopia, Sudan, and South Sudan and DRC. Data is provided by the East Africa Grain Council (EAGC), the Famine Early Warning Systems Network (FEWS NET), the Food and Agricultural Organization of the United Nations (FAO), the National Bank of Rwanda (NBR) and the World Food Program (WFP). Informal trade represents commodity flows outside of the formal system, meaning that activity is not typically recorded in government statistics or inspected and taxed through official channels. These flows vary from very small quantities moved by bicycle to large volumes trucked over long distances. This report does not capture all informal cross-border trade in the region, just a representative sample.
April 2015 Volume 9
*Additional products may be covered in the annexes.
Figure 1: Main Staple Food Commodities Informally Traded Across Selected Borders in Eastern Africa in 2015.
Source: FEWSNET and EAGC

EAST AFRICA CROSSBORDER TRADE BULLETIN APRIL 2015 VOLUME IX
2
In December 2014, the IMF mission report stated that “The foreign exchange market is distorted, reserves are critically low, oil revenue management is wasteful, and governance problems are increasing”. The same situation still applies in March 2015. Most of the economic indicators for the South Sudan economy were worse in December 2014 than during a 15-month oil shutdown that severed income, even though the country’s production was around 160,000 barrels a day (down two thirds on maximum production before the domestic conflict). During the shutdown, the country was able to draw on $2bn in savings (International Monetary Fund-IMF) to keep the economy going but the domestic conflict has affected both oil output and agriculture, and drained spending. The key driving forces for the worsening macro-economic situation include:
1. Lack of confidence in local currency: The civil
strife and attendant perception of more political
and economic risk has resulted in a loss of
confidence in the country’s currency, reduction in
capital inflow and increased outflow of capital.
2. Reduced oil Revenues: Oil accounts for almost all
(95-98 percent) of the South Sudan's government
revenue after the country became independent in
2012. It has been reported that South Sudan may be
receiving the lowest price internationally for its oil
of around USD 20-25 a barrel because of falling
international oil prices, high cost pipeline contract
(Financial Times), and hampered production due to
civil strife.
In 2012, South Sudan made a deal with the Republic of Sudan that further increased the costs of exports through Sudan pipelines and to compensate Sudan for the potential damage done to its economy resulting from the partition. According to US Energy Information Administration, the August 2012 provisional agreement on oil, all fees associated with moving the crude oil to Sudan's export terminal, in addition to the compensation fee bring the total payment to $24.10/bbl for use of the Petrodar facilities and $26/bbl for use of the GNPOC facilities. The total fixed fee to use the Greater Nile Petroleum Operating Company (GNPOC) facilities and pipeline is $11/bbl; the Petrodar facilities and pipeline fee is $9.10/bbl. The fee also includes $15/bbl to compensate Sudan
with $3.028 billion to be paid within three and a half years. When making this agreement with Sudan, the government banked on oil staying at $100 and agreed on a fixed payment for the use of a pipeline that runs north through Sudan, rather than the industry practice of a sliding scale linked to global prices. At the time of the agreement, the South Sudan government was more interested in securing independence from the Khartoum regime after decades of war. With international prices falling, these fixed costs are adversely affecting government revenues. Also, crude oil output which is South Sudan’s main source of foreign exchange, has fallen by at least a third to about 160,000 barrels-per-day since the domestic conflict erupted in December and spread to the three producing and prospective oil States of Upper Nile, Unity and Jonglei. Consequently, the total amount of revenues have now fallen to about $100m a month by January 2015, equal to an oil price of about $20.5 per barrel based on output of 160,000 barrels a day according to the Financial Times and the Sudan Tribune.
3. Fiscal pressures re-emerged in 2014 as a result of
conflict-related fall in oil production explained
above and the recent decline in international oil
prices, leading to a projected worsening of the fiscal
deficit in 2014/15.
The availability of external financing has been
limited owing to high levels of country risk. In
addition, emergency unbudgeted expenditures,
extra-budgetary spending by government agencies,
and financing shortfalls have led to a continuous
accumulation of domestic arrears that the
authorities estimate could exceed 12 percent of
GDP according to IMF. As of the end of September
2014, central bank reserves had fallen to $379m,
enough only for three weeks of imports, down from
4.8 months at independence and an all-time low.
4. Rising Inflation: As the fiscal situation worsened
again in 2014, shortfalls in revenues and in external
financing are leading to a monetary expansion that
threatens to bring inflation to double digit levels in
2015.
SPECIAL FOCUS ON SOUTH SUDAN

EAST AFRICA CROSSBORDER TRADE BULLETIN APRIL 2015 VOLUME IX
3
5. Parallel market for foreign exchange. The South
Sudan parallel foreign exchange market was copied
from Sudan in September 2011 as the Bank of South
Sudan (the central bank) decided to peg the
currency at an overvalued level and apportion
foreign exchange. The unrealistic low government
foreign exchange rate creates a large demand than
if the rate was transparent and determined by
market forces. Hence the government is forced to
ration the scarce foreign currency which in itself,
brings about a hidden transfer of resources from
the government to those few with privileged access
to foreign exchange at the official lower rate. The
vast majority of genuine traders including food
importers are thus left with no alternative, but to
get foreign currency in the parallel market which is more competitive and the foreign exchange rates
are higher. The parallel market is closely correlated
with monetary stimuli and expectations about oil
flows as seen in the widening of the premium in
Figure 2 above and the local currency has been
depreciating as oil prices decline.
Prospects for resolving the conflict (and improving confidence in the local currency) through political inclusion is uncertain. In addition it is likely that the residual funding gap will be filled through central bank financing because of the it is unlikelihood of cutting spending, limited access to external funding, improvements in non-oil revenues in the
short-term (International Monetary Fund), in addition to lack of political will in unification of the foreign exchange rates (Bloomberg). Hence the most likely scenario is the status quo, which means spending as budgeted with dual foreign exchange rates. This will result in continued gradual worsening of the macro-economic situation.
Specifically, the conflict related reduction in oil
production, declining global oil prices, fixed
payment for use of Sudan pipelines, and a growing
fiscal deficit continue to limit the availability of
foreign currency amidst high
demand. This in turn is affecting
cross-border trade in staple
foods.
The depreciation in the
exchange rate, is anticipated to
bring about imported inflation
as the price of imported goods
rise because they are more
expensive to buy from abroad,
while at the same time, demand
is expected to continue picking
up as economic activities pick up
in Juba and non-conflict areas.
Although the prices of staple
foods are expected to decline
seasonally across most markets
(with exception of some markets
in the conflict States) between March and April with
increased availability from the November-to-
January harvest, inflation is expected to mitigate
the seasonal decline as prices of essentials goods
(supplemental food imports) and services
(transport) continue to increase. Oil demand is met
with imported refined products, with diesel used
for electricity generation and transportation,
accounting for most of the consumption, then
gasoline (transportation) and fuel oil (electricity),
according to the IMF.
Figure 2: South Sudan CPI, the Black Market Exchange Rate and projections. Source Deloitte, GRSS and FEWSNET

EAST AFRICA CROSSBORDER TRADE BULLETIN APRIL 2015 VOLUME IX
4
Maize Trade Uganda to Kenya. Maize exports from Uganda to Kenya increased seasonably by 110 percent between October-to-December 2014 (fourth quarter of 2014) and January-to-March 2015 (first quarter of 2015) due to increased supplies from the October-to-December harvest in Uganda. However, maize exports to Kenya were exceptionally high-up to three times the four year average for the same quarter, due to a 20-30 percent below average October-to-January (Long Rains) harvest in Kenya, and conflict-related depressed exports to South Sudan. See figure 3 above.
Uganda to South Sudan Maize exports from Uganda to South Sudan increased atypically by 42 percent instead of remaining stable between the fourth quarter of 2014 and the first quarter of 2015 due to improving cross-border trade between the two countries as conflict-related disruptions to some markets diminish. Still, first quarter exports were 43 percent below the four average volumes for the first quarter due to conflict-related constrains. Uganda to Rwanda Maize exports to Rwanda declined seasonably by 35 percent between the fourth quarter of 2014 and the first quarter of 2015 due to increased availability in Rwanda from the January-to-February harvest. However the exports were still five times higher than the four year average for the quarter due to high demand to replenish stocks that were depleted as result of two consecutive
seasons of below average harvest prior to the January-to-February 2015 harvest. Tanzania to Kenya. Maize exports from Tanzania to Kenya declined seasonably by 27 percent between the fourth quarter of 2014 and the first quarter of 2015 due to improved availability in the southeastern and coastal consumption markets. Nevertheless, first quarter maize exports were still extremely high as a result of a 60-70 percent below average February-to-March (short rains) harvest in the southeastern and coastal areas of Kenya. Tanzania to Rwanda.
Maize exports from Tanzania to Rwanda declined seasonably by 72 percent between the fourth quarter of 2014 and first quarter of 2015 due to increased supply within Rwanda from the January-to-February harvest. Still, maize exports from Tanzania to Rwanda were remarkably high because of depleted stocks from the previous below average June-to-July harvest. Ethiopia to Kenya Maize exports from Ethiopia to Kenya declined seasonably by 45 percent between the fourth quarter of 2014 and first quarter of 2015 as a result of availability from the October-to-January and February to March harvests from the neighboring source markets in Kenya. Nonetheless, exports from Ethiopia were still
unusually high (three times the four year average for the first quarter) due to below average harvests in Kenya as mentioned earlier. Sorghum Trade Ethiopia to South Sudan, Djibouti and Somalia. Sorghum exports from Ethiopia to South Sudan increased seasonably between the fourth quarter of 2014 and first quarter of 2015 but the volumes were exceptionally high because of increased demand in markets in eastern South Sudan cut off from the traditional sources of staple foods through Juba as a result of the ongoing civil conflict. Sorghum exports to Djibouti increased seasonably following increased supplies from the November-to-January (Meher) harvest in Ethiopia. Exports to Somalia declined atypically between the fourth quarter of 2014 and first quarter of 2015 due to increased availability in the
MAIN CROSS BORDER TRADE IN JANUARY TO MARCH 2015 QUARTER
Figure 3: Maize Prices and Informal Cross border Trade in Selected Markets in Eastern Africa.
Source: FEWSNET and EAGC

EAST AFRICA CROSSBORDER TRADE BULLETIN APRIL 2015 VOLUME IX
5
destination markets in Somalia from the above average January-to-February (Deyr) harvest. Sudan to South Sudan and Eritrea Sorghum exports from Sudan to South Sudan declined
typically by 51 percent between the fourth quarter of 2014 and first quarter of 2015 following increased supply from the below average October-to-January harvest in South Sudan. Nevertheless, sorghum exports to South Sudan were unusually high than the four year average volumes for the quarter due to increasing trade between the two countries following the easing of cross-border trade restrictions by Sudan. Exports to Eritrea were exceptionally higher between the two quarters and when compared to the four year average for the first quarter, which was attributed to increased supply from the above average November-to-January harvest in Sudan. See figure 4 above. Uganda to South Sudan, Rwanda and Kenya. Sorghum exports from Uganda Rwanda were exceptionally high exports to Kenya and South Sudan increased typically by 49 and 60 percent respectively between the fourth quarter of 2014 and first quarter of 2015, following increased market supply from the November-to-January harvest in Uganda. Exports to Kenya and Rwanda were outstandingly high when compared to the four year average volumes for the quarter. This is because Kenya and Rwanda have become alternative export destination markets as exports to South Sudan continued to be constrained by the civil strife, and were 50 percent below four average volumes for the first quarter.
Rice Tanzania to Kenya, Uganda, Rwanda and Burundi Rice exports from Tanzania to Kenya and Uganda increased unseasonably by 24 percent and tripled respectively
between the fourth quarter of 2014 and first quarter of 2015 due to increased availability and competitive prices in Tanzania as a result of the previous above average May-to-August harvest, and high demand in deficit producing Kenya and Uganda. Exports to Rwanda increased typically by 45 percent in the same period. First quarter rice exports from Tanzania to Kenya, Uganda and Rwanda were unusually higher than the four year average volumes for the first quarter. However, rice exports from Tanzania to Burundi, declined atypically by six percent between the fourth quarter of 2014 and first quarter of 2015 as result of insecurity-related uncertainties that disrupted trade, but were also exceptionally higher than the four year average volumes for the first quarter for the same reasons mentioned above. Uganda to South Sudan
Rice exports from Uganda to South Sudan declined seasonably by 11 percent between the fourth quarter of 2014 and first quarter of 2015 as a result of increased availability of other substitutes from the October-to-January harvest in South Sudan. Although rice exports have been improving from a low base since the third quarter of 2014, 2015 first quarter exports of rice from Uganda to South Sudan were still 44 percent lower than the four year average volumes for first quarters due to conflict-related constrains. Somalia to Kenya and Ethiopia Rice re-exports from Somalia to Kenya declined atypically by 37 percent between the fourth quarter of 2014 and first quarter of 2015 due to security-related operations along the Kenya-Somalia border. However, first quarter rice-re-exports to Kenya were 66 percent higher than the four year average volumes but on a low base of 924 MT.
Rice re-exports from Somalia to Ethiopia increased
unseasonably by 22 percent between the fourth quarter of 2014 and first quarter of 2015. This was attributed to
increased livestock exports and traders took advantage of
the head haul to export rice so as not to send empty trucks
to pick haul livestock back. Increased re-exports were also
supported by declining prices of these commodities on the
Figure 4: Sorghum Prices and Informal Cross border Trade between Sudan and South Sudan.
Source: FEWSNET and EAGC

EAST AFRICA CROSSBORDER TRADE BULLETIN APRIL 2015 VOLUME IX
6
international markets. First quarter rice re-exports from
Somalia to Ethiopia were exceptionally higher than the four
year average volumes for the first quarter.
Dry beans Uganda to Kenya, South Sudan and Rwanda, Rwanda exports to Uganda. Dry bean exports from Uganda to Kenya and South Sudan remained typically stable between the fourth quarter of 2014 and first quarter of 2015 as supplies from Uganda’s November-to-January harvest met demand in these destination markets. Still, dry bean exports to Kenya and South Sudan were four times higher than the four year average for the first quarter. This was attributed to below average production in Kenya, and increasing exports to South Sudan from a low base as trade continues to strengthen gradually as the intensity of the civil strife abates. Exports of broad dry beans exports from Uganda to Rwanda were unusually high between the fourth quarter of 2014 and first quarter of 2015 and when compared to the four year average volumes for the first quarter due to high demand to replenish depleted stocks from the previous two consecutive seasons of below average harvest. Exports of small dry beans from Rwanda to Uganda declined typically by 31 percent as the beans harvested between January and February in Rwanda were still being prepared for exports. However, the volumes traded were uncharacteristically higher than the four year average for the quarter due to high demand in Uganda, South Sudan and Kenya. See figure 5 below.
Tanzania to Kenya Dry bean exports from Tanzania to Kenya declined marginally but seasonably by eight percent between the fourth quarter of 2014 and first quarter of 2015 due to increased availability of below average October-to-January (long rains) and February-to-March (Short rains) harvests in the destination market. Even so, dry bean exports were remarkably higher than the four year average volumes for the quarter due to deficit production amidst high demand in Kenya. Ethiopia to Kenya and Sudan Dry bean exports from Ethiopia to markets in northern Kenya increased seasonably and exceptionally by 110 percent between the fourth quarter of 2014 and first quarter of 2015 due increased demand following a long spell of peace during which there were no worrisome incidences of inter-communal conflict and attendant disruption of cross-border trade. Dry beans export to northern Kenya were four times higher than the four year average for the first quarter. Exports of broad beans from Ethiopia to Sudan declined atypically by 26 percent between the fourth quarter of 2014 and first quarter of 2015 most likely as result of declining purchasing power and depreciating Sudanese currency. Livestock Trade Exports of goats from Ethiopia to Somalia increased typically but were remarkably high between the fourth quarter of 2014 and first quarter of 2015 and the four year average of the first quarters due to increased preference by Somali traders for high quality goats from Ethiopia which
are bigger in size. Livestock traders are also continually widening their catchment area inside both Somalia and Ethiopia. Exports of goats and sheep to Kenya declined typically by 24 and 27 percent respectively between the fourth quarter of 2014 and first quarter of 2015 percent due to reduced supply resulting from increased security-related patrols along the Kenya-Somalia border. However, first quarter goat and sheep exports to Kenya were 125 and 23 percent respectively higher than the four year average for first quarters due to high demand for meat in Kenya that cannot be fulfilled with domestic production only.
Exports of camels and camelids from Ethiopia to Somalia declined typically by 19 percent due to low demand in Arabian Gulf. There has been
Figure 5: 2014 Informal Dry Bean Trade in Eastern Africa. Source: FEWSNET and EAGC

EAST AFRICA CROSSBORDER TRADE BULLETIN APRIL 2015 VOLUME IX
7
gradual growth in camel herd size in northern Somalia after two-to-three consecutive seasons of good rains which is resulting in reduced demand for camel and camelids from Ethiopia. Nevertheless camel and camelids exports were 40 percent higher than the four year average for first quarter due to increased demand for fattening animals in preparations for the forthcoming Ramadan period starting in June.
Exports of camels and camelids from Somalia to Kenya was typically stable between the fourth quarter of 2014 and first quarter of 2015 due to low supply during the January-to-April dry season in southern Somalia. Still, the first quarter exports were six times the four year average for the first quarters due to high demand of camel meat in northeastern Kenya.

EAST AFRICA CROSSBORDER TRADE BULLETIN APRIL 2015 VOLUME IX
8
CROSS BORDER TRADE OUTLOOK JANUARY TO JUNE 2015 QUARTER
Although the January-to-February (Vuli) harvests in the northeastern bimodal rainfall areas of Tanzania were below average following poor performance of September-to-December rainfall, maize supplies from the above normal July-to-September (Masika) harvests in these areas, May-to-August harvests in the Southern bimodal areas in 2014 have compensated for the short-fall. Above normal availability and relatively lower prices of maize in Tanzania that are on average below recent five average prices are expected to propel exports to southeastern Kenya, Rwanda and Burundi between April and June. These exports will likely be reinforced by increased release of old stocks due to forthcoming start of harvest in May in the main producing southern regions of Tanzania.
In Uganda, the above normal November-to-December maize harvest in conjunction with decrease exports to South Sudan ever since the domestic conflict started in late 2013, have exerted downward pressure on prices which were still below respective 2014 in prices. Comparative low prices are expected to bolster exports to Kenya between April and June, but exports are expected face stiff competition with exports from Tanzania into Kenya limiting exports west of Nairobi.
While trade between South Sudan and Uganda will remain depressed when compared to pre-conflict period, it is expected to be much better than the same period in 2014, due to reduced incidences of clashes, and improved trade transactions between cross-border traders. In addition, supplies from Ethiopia and Sudan are expected to increase gradually from a low base as a result of ongoing development of alternative linkages to South Sudan especially in Jonglei and Upper Nile States. However, in localized areas in the conflict areas, supply will continue to be constrained by high levels of tension and lawlessness before the onset of the rains in May/June, lack of transport facilities, high levels of formal and informal taxes, tariffs, and fees, and other factors that increase marketing costs. In most of the country, limited availability of fuel and depreciation of the local currency are expected to increase the costs of basic commodities including staple foods.
Staple food production in Sudan was above average and well above the below average 2013/14 harvest. The prices of sorghum and millet will likely be at or drop below their levels of last year between April and June but will remain at high levels compared to their corresponding five-year average due to relatively high inflation rate and local currency depreciation. Hence exports from surplus-producing Blue Nile, Sinar, White Nile and Gadarif States in Sudan to the northern States of South Sudan including Upper Nile in the conflict area, are expected to be relatively higher when compared to the same period in 2014.
Maize exports from Ethiopia to northern Kenya are expected to continue seasonably between April and June following increased supply from the above average October-to-January (Meher) harvest. Onward supply to Mandera in northeastern Kenya may be limited by insecurity due to frequent incidences of inter-clan clashes and random killings by insurgents. Seasonal sorghum supplies from Ethiopia to Djibouti are also expected to be near average in the same period.
The January-to-February (Deyr) 2014/2015 maize and sorghum production in southern Somalia is estimated at 105,300 MT, which is higher 29 percent higher than Deyr 2013/14 and five percent higher than the five year average (2009-2013) production respectively. Sorghum and maize imports into southern Somalia from Ethiopia between April and June will likely be limited by better local availability from the above average Deyr harvest. However, seasonal exports from Ethiopia to central and northern Somalia areas that are structurally not will integrated with southern Somalia, are expected to be normal.
EAST AFRICA CROSSBORDER TRADE BULLETIN APRIL 2015 VOLUME IX
9
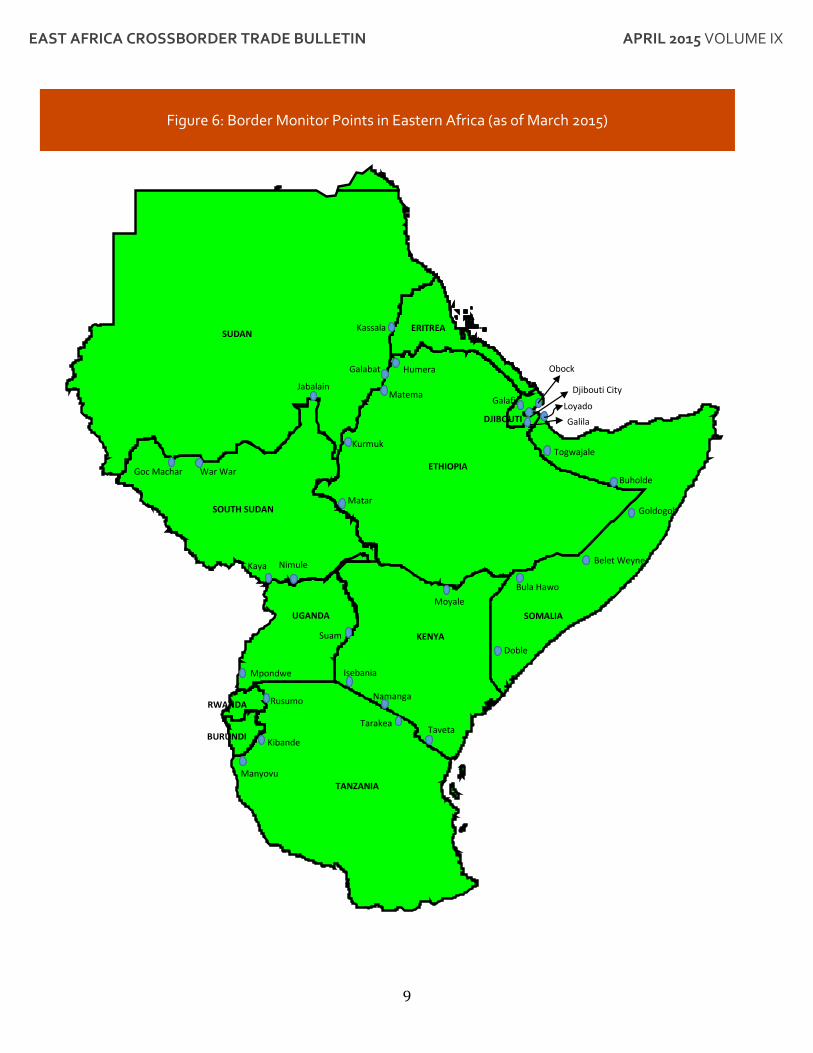
Figure 6: Border Monitor Points in Eastern Africa (as of March 2015)
Isebania
Namanga
Tarakea Taveta
Mpondwe
Nimule
Suam
Rusumo
Kibande
Manyovu
Belet Weyne
Bula Hawo
Moyale
Doble
Buholde
Togwajale
Goldogob
Kurmuk
War War Goc Machar
Matar
Galafi
Kassala ERITREA
Galabat
Jabalain
Kaya
Djibouti City
Galila
Loyado
Obock
SUDAN
SOUTH SUDAN
UGANDA
Humera
SOMALIA
ETHIOPIA
RWANDA
BURUNDI
TANZANIA
KENYA
DJIBOUTI
Matema