eastman matrikon paper presentation
TRANSCRIPT

Paper T8009F
Implementation of Alarm Management Software in a DCS-controlled Ethylene Plant
Doug Rode Eastman Chemical Company
PO Box 7444 Longview, TX 75607-7444
Karim Moti Matrikon Inc.
1330 Post Oak, Suite 1600 Houston, TX 77056
Allen Monholland Eastman Chemical Company
PO Box 7444 Longview, TX 75607-7444
Richard Bykowski Eastman Chemical Company
PO Box 7444 Longview, TX 75607-7444
Prepared for Presentation at the 2004 Spring National Meeting, New Orleans LA, Apr 25-29 16th Annual Ethylene Producers’ Conference
Session T8009 – Ethylene Plant Process Control
Copyright © Eastman Chemical Company April 2004
UNPUBLISHED
AIChE shall not be responsible for statements or opinions contained in papers or printed in its publications.

Abstract In 2000, Eastman retrofitted an older pneumatically controlled ethylene plant with a DCS. Since the retrofit, operators have been swarmed by alarms. Efforts were made to reduce the excessive load of alarms through operator input. This did not significantly affect the alarm count. In early 2003, Eastman entered into a pilot agreement with Matrikon to use their “ProcessGuard” alarm management software. Initially, the software was used to rank alarm data by alarm count. This quickly identified the most frequent alarms. Plant Management and DCS Technicians met daily and reviewed the top 20 alarms from the previous day. The team used this list to identify the obvious “nuisance” alarms and addressed them by changing alarm limits, deadbands, etc as needed. Once the majority of these “chattering” alarms were corrected, the software was then used to identify “parent/child” relationships between alarms. Each “parent/child” group was then analyzed, and long-term process improvement projects resulted. The pilot effort reduced the alarm count by 80% in the first 3 months. Eastman has decided to implement this alarm management process on all of its older ethylene plants and is evaluating implementation in other operating areas.

Introduction The main purpose of an alarm system is to provide an operator with critical process information at the right time. For older plants using panel-mounted instruments, alarms are typically reserved for extreme situations. This results in a “low” number of alarms. However, when an older plant is converted to DCS, the alarms available to the engineer are increased substantially. What was once just a TI (temperature indication), now has the ability to create an alarm. In fact, it can create a multitude of alarms – High, Low, HighHigh, LowLow, Deviation, etc. A newly installed DCS, plus a basket of new alarms available for the engineer, will result in a host of new alarms configured on the DCS. When creating an alarm for a point that never had an alarm before, an engineer will be making their “best guess” at what the alarm values should be for that point. If the DCS point deals with capacity, the alarm might be configured based on maximum production rates. If the point deals with safety, the alarm range might be configured based on safety concerns. Sometimes, an engineer might not know what to base the range on. All of these scenarios typically result in configurations that are too “tight”. An alarm point configured incorrectly can result in nuisance alarms. Operators begin to ignore the alarm, or worse, suppress it. An alarm system configured incorrectly can result in a “flood” of alarms during a process upset. Operators can receive so many alarms that the true problem with the process hides among the flood. Both of these situations negate the purpose of the alarm system. ProcessGuard ProcessGuard is a software package provided by Matrikon, Inc. ProcessGuard receives alarm and event data from the DCS, parses the data based on a set of rules, initiates action, and histories the data in a database. ProcessGuard allows the study and manipulation of alarm data. ProcessGuard consists of the following components:
• A&E Collector is the point of entry for alarm and event data to the ProcessGuard system. • Rules Builder helps create a set of rules. These rules are used by ProcessGuard to look at
the alarm data and segregate the alarm type, time, value, etc. • A&E Archiver receives the raw alarm data from the A&E Collector then applies the rules
from the Rules Builder. It can then forward the data to the A&E Viewer and store the results in the ProcessGuard database.
• A&E Viewer is a tool for real-time monitoring of the alarm data. • A&E Analysis is a Microsoft Excel Add- in that pulls data from the database. This lets
you view predefined reports or perform ad hoc queries and statistical manipulation on the data in Excel. These reports are based on EEMUA (Engineering Equipment and Materials User Association) guidelines – publication 191.
The A&E Analysis tool is the main window to the alarm data. With the use of various pre-defined reports, ad hoc queries, filters, etc, the alarm data is extracted from the database and deposited into an Excel workbook. The reports can be run on a specific DCS console, process

area, even a specific tag. Once the data is in Excel, it can be manipulated with all of the functions Excel has to offer. Network Architecture The following diagram outlines the architecture of collecting, storing, and accessing the alarm and event data.
Matrikon initially installed the A&E Collector on a collection PC. The collection PC was connected to one Fischer Provox Pro Vue console. The collected data was transferred to the ProcessGuard server through TCP/IP, and stored within the database on the server. The client applications were installed on various PC’s for data access and analysis. Eastman’s Experience In 2000, Eastman retrofitted one of its older pneumatically controlled ethylene plants with a DCS. Since the retrofit, there has been a constant flow of alarms to the console. During process upsets, the operators are “flooded” with alarms. Various programs were implemented in order to curb the alarm load. These included a DCS logbook, a DCS alarm work request database, etc. None of the programs had the desired impact on the alarm load. With a constant barrage of alarms, it was hard to pinpoint which alarms needed attention.

In early 2003, Eastman entered a pilot program with Matrikon. The ProcessGuard server and software were installed by Matrikon to monitor the alarms on one DCS console. After initial installation, data was collected for two weeks in order to establish a baseline. Matrikon advises that a well-configured alarm system should generate no more than 1 to 2 alarms every 10 minutes (150-300 alarms per day). This benchmark is intended to give the operator enough time to respond rationally to each alarm that occurs over the course of a shift. With this goal in mind, Eastman and Matrikon began to analyze the alarm data. The first part of the analysis was to look at the Alarm Distribution Over Time report. This report quantifies the amount of alarm traffic that the operator sees during a specific timeframe. Figure 1 is a graph of the number of alarms received in a 10-minute period over 7 days. For the week, the total alarm count was 6073, for a daily average of 868. Compared to a benchmark of 1 alarm every 10 minutes, the load on the operator is generally high but is sometimes extremely high.
Alarm Distribution Over Time
0
10
20
30
40
50
60
Day 1 Day 2 Day 3 Day 4 Day 5 Day 6 Day 7
Ala
rm C
ount
Figure 1 – 10 minute alarm count over 7 days (zero counts excluded)
After reviewing the Alarm Distribution Over Time, smaller periods of interest were picked out for further review. These were typically the peaks in the trend. Once a period was selected, the Alarm Count by Tag report was reviewed. This report shows the number of alarms each tag created during a specific timeframe. From Figure 1, it is obvious that there was a heavy alarm load on Day 5. Figure 2 shows the top 20 alarms during that period of interest.

Alarm Count By Tag
0
100
200
300
400
500
600
700
800
900
Tag 1
Tag 2
Tag 3
Tag 4
Tag 5
Tag 6
Tag 7
Tag 8
Tag 9
Tag 10
Tag 1
1Tag
12Ta
g 13
Tag 14
Tag 1
5Tag
16Ta
g 17
Tag 1
8Ta
g 19
Tag 2
0
Ala
rm C
ount
Figure 2 – Alarm Count by Tag for Day 5
Figure 2 shows that a large majority of the alarms were generated from just a few tags. After a few suspect tags had been selected, further review of the data was needed. Chronological Reports, Ad Hoc Queries, and process trends were used to determine the sequence of events that led to the frequent alarms. Table 1 shows a portion of the Tag 1 activity.
Tag Timestamp Alarm Identifier Value Message TypeTag 1 8:18:20 AM LOPRES 418.28 ReturnToNormalTag 1 8:18:22 AM LOPRES 357.13 AlarmTag 1 8:18:25 AM LOPRES 419 ReturnToNormalTag 1 8:18:26 AM LOPRES 399.79 AlarmTag 1 8:18:30 AM LOPRES 422.48 ReturnToNormalTag 1 8:18:30 AM LOPRES 389.69 AlarmTag 1 8:18:34 AM LOPRES 422.93 ReturnToNormalTag 1 8:18:37 AM LOPRES 356.17 AlarmTag 1 8:18:40 AM LOPRES 423.69 ReturnToNormal
Table 1 – Ad Hoc Query for Tag 1
Table 1 shows that Tag 1 is jumping around the low pressure alarm point. The Operator Intervention report was then used to determine that this tag had zero interventions during the period of alarming. Using the information from the reports, along with process knowledge about Tag 1, the controller tuning was modified and this “nuisance” alarm was eliminated.

After the initial 2 weeks of baseline data collection, modifications to the alarm configuration were started. Plant Management and DCS technicians met daily to review the alarm counts from the previous day. The top 3-5 alarms were selected, and the above methodology was incorporated to identify possible modifications. Modifications included controller tuning, changing dead bands, alarm limits, etc. Figure 3 shows the results after 2 weeks worth of modifications. For the week, the total alarm count was 1811, for a daily average of 258.
Alarm Distribution Over Time
0
10
20
30
40
50
60
Day 1 Day 2 Day 3 Day 4 Day 5 Day 6 Day 7
Ala
rm C
ount
Figure 3 – Improved 10 minute alarm count over 7 days (zero counts excluded)
Table 2 details the performance before and after the initial modifications.
Before After ChangeDaily Average Alarms 868 258 -70%
Peak 10-minute Alarm Count 166 63 -62%Peak Hourly Alarm Count 527 165 -69%
10-minute Intervals With no Alarms 13% of total 42% of total +29% of total
Table 2 – Performance before and after
Once the initial modifications were complete, the majority of the “nuisance” and chattering alarms were eliminated. With the “noise” eliminated from the data, various other reports were then used to further study the system. The Standing Alarm – Duration report looks at alarms that have occurred but have not returned to normal. This report was useful for checking how long conditions remained outside of the desired operating range. Because this report includes the start, end, and duration of an alarm, it

quickly identified redundant and related alarms. For many of these related alarms (typically a pair), one of the alarms was eliminated. As mentioned before, the Operator Intervention report shows the number of operator moves made on each tag over a specified time interval. This report was helpful in identifying alarm tags and process areas that required multiple operator adjustments. These tags were typically associated with control loops that required tuning adjus tments. The Symptomatic Analysis report shows correlations between an alarm (Parent) and the subsequent alarms that follow (Child). This report was useful in identifying how equipment and process areas affect one another. The various Parent/Child groups were studied, and typically resulted in long-term process improvement projects. Figure 4 shows the results after 2 months worth of modifications. For the week, the total alarm count was 1124, for a daily average of 160.
Alarm Distribution Over Time
0
10
20
30
40
50
60
Day 1 Day 2 Day 3 Day 4 Day 5 Day 6 Day 7
Ala
rm C
ount
Figure 4 – 10 minute alarm count after 2 months (zero counts excluded)

Table 3 details the performance after 2 months worth of modification.
Before 2 Weeks 2 Months Total ChangeDaily Average Alarms 868 258 160 -82%
Peak 10-minute Alarm Count 166 63 39 -77%Peak Hourly Alarm Count 527 165 81 -85%
10-minute Intervals With no Alarms 13% of total 42% of total 62% of total +49% of total
Table 3 – Performance after 2 months worth of modification Management Process After the initial optimization of the alarm system, a management process was developed and implemented in order to maintain the improved performance. During the daily production meetings, the top 20 alarms from the previous day are reviewed. Any problematic alarm tags are assigned to engineers for further review. The engineers use the various ProcessGuard reports and process data to analyze the tags. The engineers will then present any potential changes at the next day’s meeting. Approved changes are given to the DCS technician who makes the change and enters it into a database. The database includes temporary and permanent changes as well as date, time, reason for change, etc. The DCS technician also maintains measures aimed at tracking the alarm system performance. Plant upsets are reviewed in detail as they occur. Since upsets usually produce the "flood" of alarms, the goal is to look for ways to improve the alarming of that particular incident as opposed to individual tags. Other Observations In the later part of 2003, this ethylene plant had a shutdown and subsequent capacity increase. Shortly after startup, the alarm count jumped back up to previous alarm levels (>1000 per day). The same progression of analysis had to be repeated in order to re-optimize the alarm system at the higher production rates. The process is not a one-time fix. It does require continuous effort, albeit less than what is required initially. The software has identified equipment/instrument problems. For example, a faulty limit switch. Most of our older equipment does not have “first-out” type indication. The Chronological Report is helpful in determining what might have caused a piece of equipment to shutdown.

Summary An alarm system that is not optimally configured can lead to excessive alarms that are a nuisance to the operator. This can mask the true problems with the process, ultimately hindering effective operator response. In early 2003, Eastman installed Matrikon’s ProcessGuard alarm monitoring and analysis software on one of its older ethylene units in order to optimize the alarm system. The software was initially used to quantify the alarm traffic seen by the operator. Then, smaller periods of interest were chosen, and individual alarm tags were studied. Modifications to the alarm system were made after the software identified obvious nuisance alarms. Further study of standing alarms, Parent/Child alarms, etc identified various other alarm tags that needed modification. After 3 months of modification to the alarm system, the average daily alarm count was reduced from 868 to 160 (82% reduction). This alarm management process has since been installed on all of the older ethylene units and is being evaluated in other operating areas.

Implementation of Alarm Management Implementation of Alarm Management
Software in a DCSSoftware in a DCS--controlled Ethylene Plantcontrolled Ethylene Plant
Presented byPresented by
Doug Rode Doug Rode Senior Operations Technical StaffSenior Operations Technical Staff
Eastman Chemical CompanyEastman Chemical CompanyLongview, TXLongview, TX
AndAnd
Karim MotiKarim MotiRegional ManagerRegional Manager
Matrikon Inc.Matrikon Inc.Houston, TXHouston, TX
Process Control SubcommitteeProcess Control Subcommittee

OutlineOutline
nn IntroductionIntroductionnn ProcessGuard softwareProcessGuard softwarenn Eastman's ExperienceEastman's Experienceuu Initial Analysis ProcessInitial Analysis Processuu Alarm Count ImprovementsAlarm Count Improvementsuu Management ProcessManagement Process
nn Other ObservationsOther Observations

IntroductionIntroduction
Major Incidents Day-to-Day Losses
$10 Billion Dollars
“…cost of abnormal situations on a real process plant typically “…cost of abnormal situations on a real process plant typically equates to 3% equates to 3% -- 8% of plant throughput…”.8% of plant throughput…”. D. Campbell Brown, D. Campbell Brown,
BP Amoco, in Control MagazineBP Amoco, in Control Magazine
Abnormal Situation Management Consortium estimate of Abnormal Situation Management Consortium estimate of the cost of preventable abnormal situations in the U.S. the cost of preventable abnormal situations in the U.S. petrochemical industry alone: petrochemical industry alone:
$10 Billion DollarsOff-spec product
Reduced throughputIncreased wear and tear
Equipment damageSafety problems / injuriesEnvironmental releases
nn Plant UpsetsPlant Upsetsnn Unplanned OutagesUnplanned Outages
nn Equipment Problems, and Equipment Problems, and nn Lost ProductionLost Production

Why do we alarm?Why do we alarm?
nn Ensure personal safetyEnsure personal safetynn Protect the environmentProtect the environmentnn Prevent equipment lossesPrevent equipment lossesnn Improve process qualityImprove process qualitynn Reduce risk of economic loss incidentReduce risk of economic loss incident
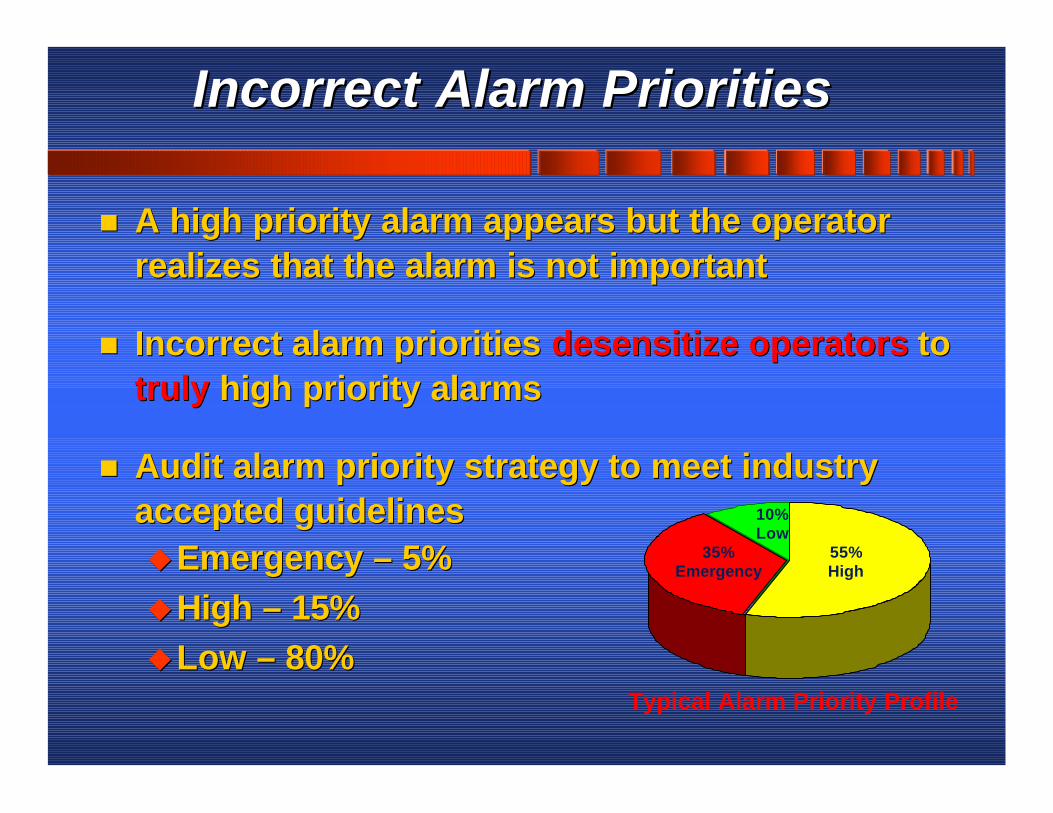
nn A high priority alarm appears but the operator A high priority alarm appears but the operator realizes that the alarm is not importantrealizes that the alarm is not important
nn Incorrect alarm priorities Incorrect alarm priorities desensitize operatorsdesensitize operators to to truly truly high priority alarmshigh priority alarms
nn Audit alarm priority strategy to meet industry Audit alarm priority strategy to meet industry accepted guidelines accepted guidelines uuEmergency Emergency –– 5%5%uuHigh High –– 15%15%uuLow Low –– 80%80%
Typical Alarm Priority Profile
55% High
10% Low
35% Emergency
Incorrect Alarm PrioritiesIncorrect Alarm Priorities

OtherOther
900
35
180
25/40/35
5
PowerPower
2000
65
350
25/40/35
8
PetroChemPetroChem
1500
100
180
25/40/35
9
Oil & GasOil & Gas
1200
50
220
25/40/35
6
EEMUAEEMUA
144
9
10
80/15/5
1
Matrikon Industry FindingsMatrikon Industry Findings
How many alarms do you get every day?
Average Alarmsper Day
Average StandingAlarms
Peak Alarmsper 10 Minutes
Average Alarms/10 Minute Interval
Distribution %(Low/Med/High)
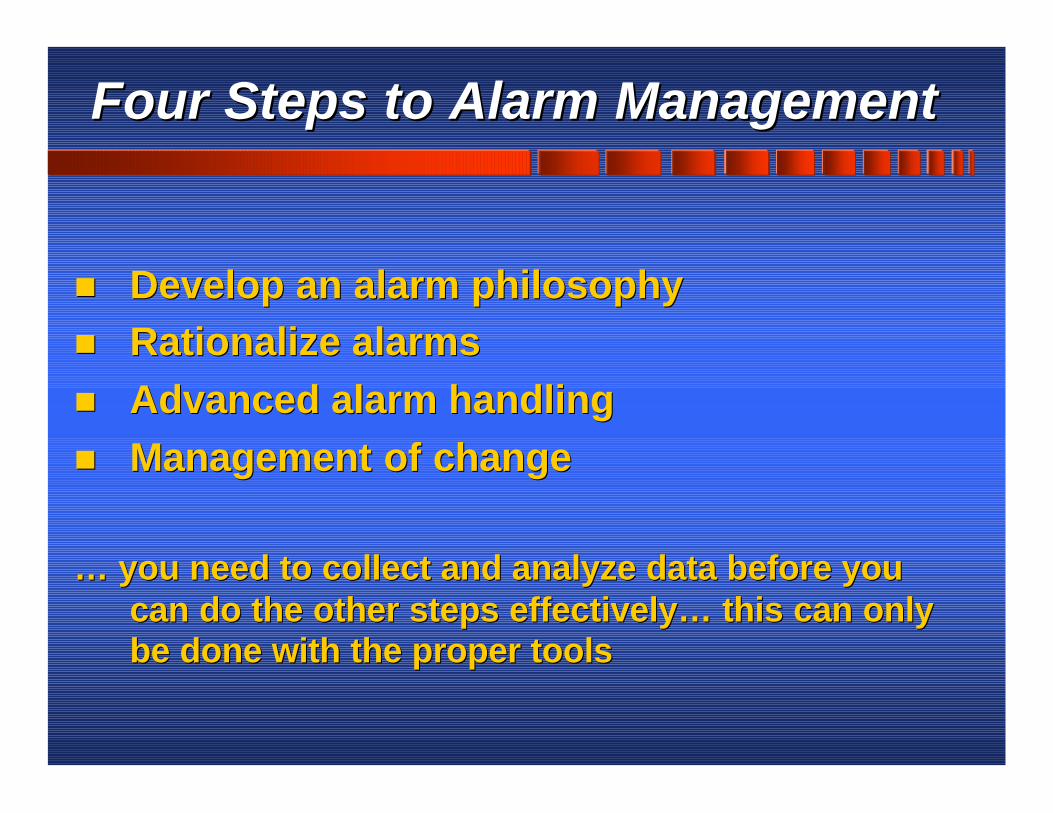
Four Steps to Alarm ManagementFour Steps to Alarm Management
nn Develop an alarm philosophyDevelop an alarm philosophynn Rationalize alarmsRationalize alarmsnn Advanced alarm handlingAdvanced alarm handlingnn Management of changeManagement of change
… you need to collect and analyze data before you … you need to collect and analyze data before you can do the other steps effectively… this can only can do the other steps effectively… this can only be done with the proper tools be done with the proper tools

Phase 1: Infrastructure & Automated Benchmarking• ProcessGuard seamlessly collects and stores all of your A&E data• Generates automated, web-based, EEMUA compliant KPI reportsPhase 2: Identify and Eliminate Bad Actors• Drill down to focus on areas of biggest risk & areas of greatest return• Fix 3 alarms/week = 60% reduction in one month Phase 3: Alarm Flood Analysis• With 3 months archived data, in-depth analysis lets you target and eliminate
worst alarms during floods: chattering, redundant, symptomatic, nuisancePhase 4: Alarm Rationalization• Systematically analyze and fix alarm systems to reduce alarms further• Master database to automatically track engineered settings
Alarm management is an engineering process Achieve step by step benefits depending on your timetable:
alar
ms
/ day
Phase 1
Phase 2
Phase 3
Phase 4
Methodology: Phased ApproachMethodology: Phased Approach

ProcessGuardProcessGuard
nn Provides an enterprise A&E historianProvides an enterprise A&E historiannn Replace alarm printersReplace alarm printersnn Seamlessly collects alarms and eventsSeamlessly collects alarms and eventsnn Built in reports Built in reports –– EEMUA guidelinesEEMUA guidelinesnn RealReal--time Viewing of alarms from desktoptime Viewing of alarms from desktopnn Eliminates nuisance alarmsEliminates nuisance alarmsnn Analyze, Manage, & Monitor alarm systemAnalyze, Manage, & Monitor alarm systemnn Monitor operations and operator work loadMonitor operations and operator work load
• Collect data from any DCS, HMI, Safety PLC, BMS, Fire System, etc.• Connect to multiple control systems simultaneously• Supports Foxboro, Honeywell, ABB, Bailey, Emerson, and all others
• Alarm and Event collectors … • “Store and Forward” capability preserves data during network problems• Supports serial, TCP/IP, files, ODBC, Network Printers, and OPC
• Specialized database for alarm and event storage • Central repository for easy access & analysis enterprise-wide• 55 million+ records online
• Integrate A&E data with process data for fast incident reviews• Supports all major historians (PI, IP.21, CIM.21) • Connectivity to CMMS for automated work orders (Maximo)
• Use MS Excel for detailed analysis• Automatically generate scheduled reports• Real-Time Viewer lets you monitor operations from anywhere• Eliminate alarm printers and piles of paper• Instantly search & review sequence of events, trips, faults, and alarms
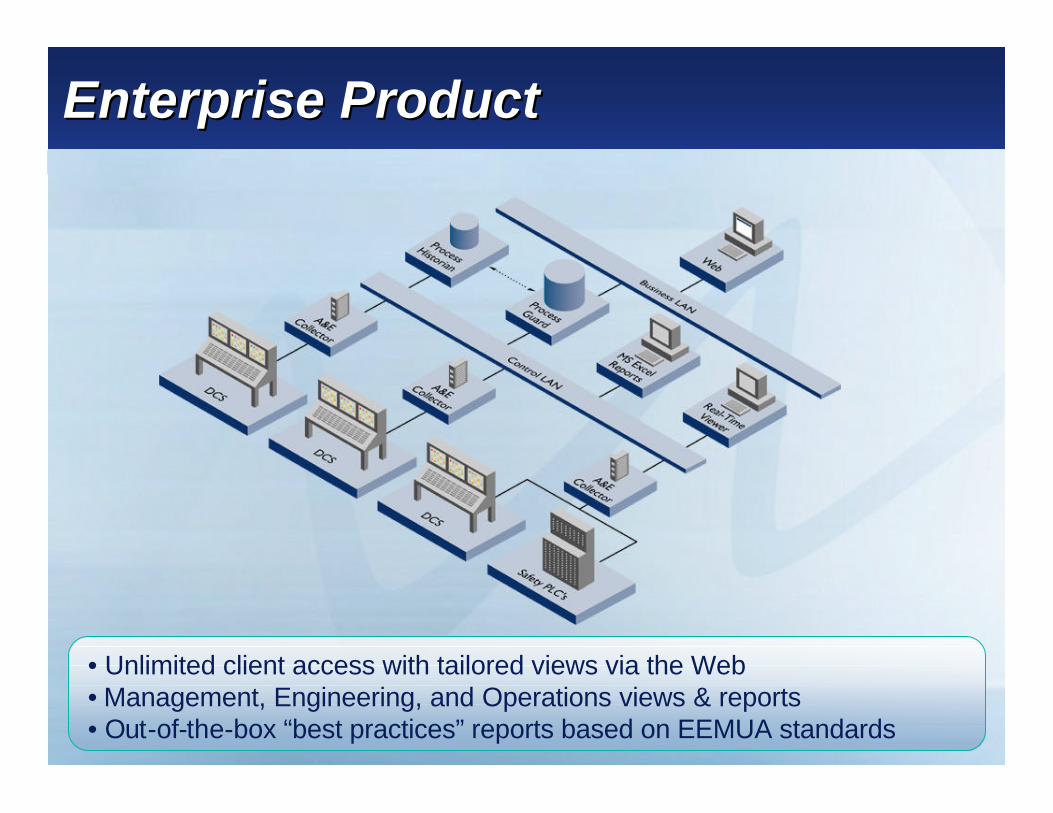
• Unlimited client access with tailored views via the Web • Management, Engineering, and Operations views & reports• Out-of-the-box “best practices” reports based on EEMUA standards
Enterprise ProductEnterprise Product

Business BenefitsBusiness Benefits
Alarm Management protects your bottom line
RegulatoryRegulatory Compliance for Environmental, Health & SafetyCompliance for Environmental, Health & Safety§ Audit trails: reliable longAudit trails: reliable long--term alarm and event archiveterm alarm and event archive
InsuranceInsurance
§ Premium reductionsPremium reductions
OperationalOperational
§ ââ alarms = alarms = áá operator actions = better control = $$$operator actions = better control = $$$
§ Reduced operator workloadReduced operator workload
§ Additive waste, energy usage, off spec, equipment damageAdditive waste, energy usage, off spec, equipment damage
§ Less time spent on alarm management & incident reviewsLess time spent on alarm management & incident reviews
§ Fewer unplanned shutdownsFewer unplanned shutdowns
§ Compliance reporting for regulatory bodiesCompliance reporting for regulatory bodies
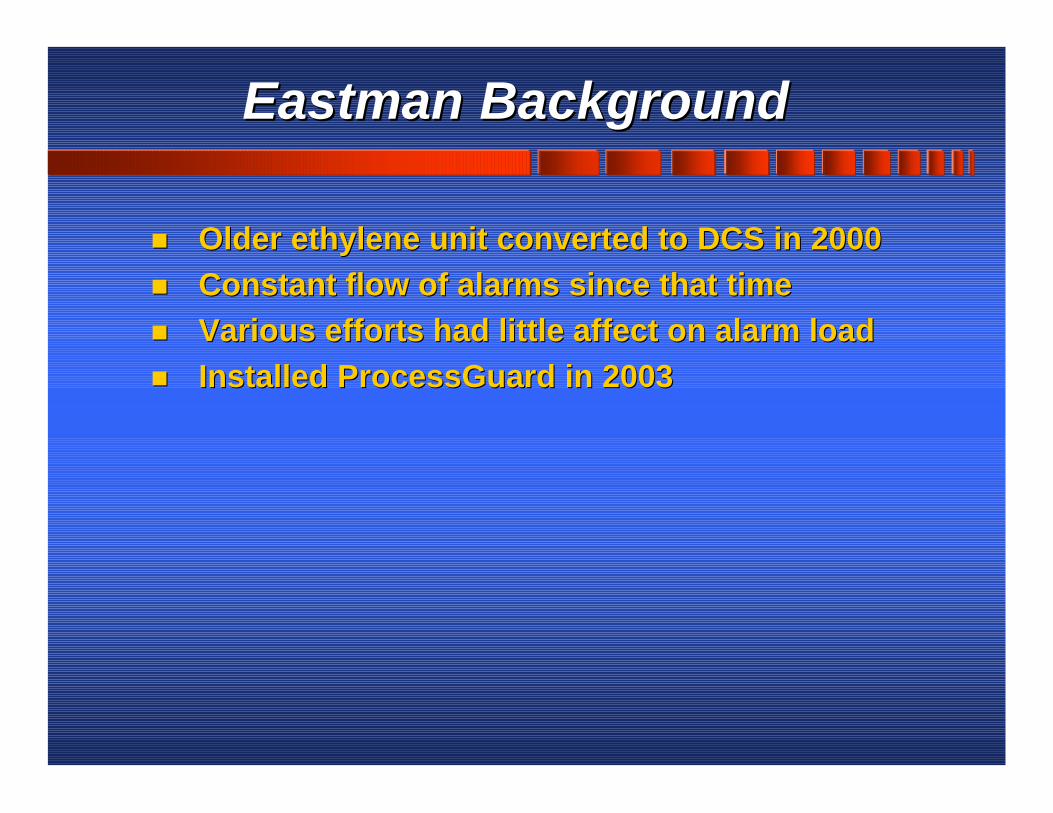
Eastman BackgroundEastman Background
nn Older ethylene unit converted to DCS in 2000Older ethylene unit converted to DCS in 2000nn Constant flow of alarms since that timeConstant flow of alarms since that timenn Various efforts had little affect on alarm loadVarious efforts had little affect on alarm loadnn Installed ProcessGuard in 2003Installed ProcessGuard in 2003

Initial Analysis ProcessInitial Analysis Process
1.1. Reviewed Reviewed Alarm Distribution over TimeAlarm Distribution over Time reportreport2.2. Selected smaller periods of interestSelected smaller periods of interest3.3. Reviewed Reviewed Alarm Count by TagAlarm Count by Tag for the smaller for the smaller
periodsperiods4.4. Selected suspect tags for further reviewSelected suspect tags for further review5.5. Adjusted dead bands, alarm limits, controller Adjusted dead bands, alarm limits, controller
tuning as needed tuning as needed
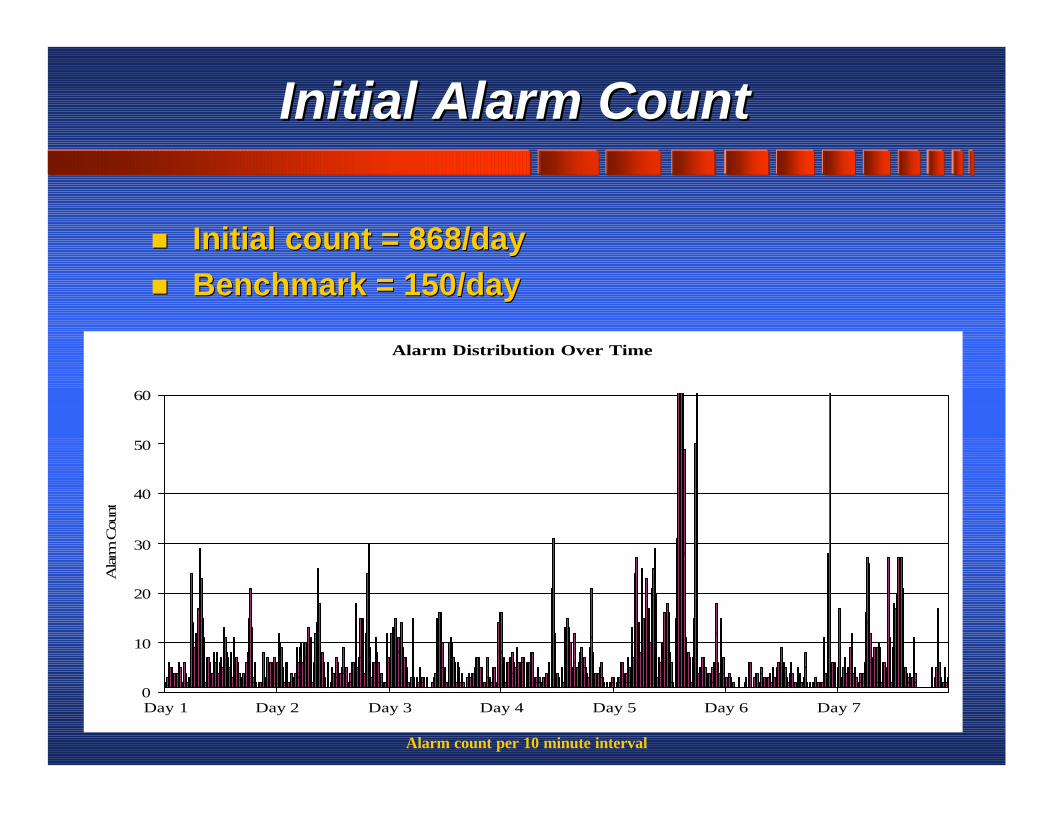
Initial Alarm CountInitial Alarm Count
nn Initial count = 868/dayInitial count = 868/daynn Benchmark = 150/dayBenchmark = 150/day
Alarm Distribution Over Time
0
10
20
30
40
50
60
Day 1 Day 2 Day 3 Day 4 Day 5 Day 6 Day 7
Ala
rm C
ount
Alarm count per 10 minute interval

Alarm Count by TagAlarm Count by Tag
nn Top 10 alarms accounted for >65% of total for Top 10 alarms accounted for >65% of total for Day 5Day 5
Top 20 Alarms for Day 5
A l a r m C o u n t B y T a g
0
20
40
60
80
100
120
140
160
180
200
Tag 1
Tag 2
Tag 3
Tag 4
Tag 5
Tag 6
Tag 7
Tag 8
Tag 9
Tag 10
Tag 11
Tag 12
Tag 13
Tag 14
Tag 15
Tag 16
Tag 17
Tag 18
Tag 19
Tag 20
Ala
rm C
ount

Chronological ReportChronological Report
nn Tag 1 is jumping around alarm trip pointTag 1 is jumping around alarm trip point
nn Operator Interventions = 0Operator Interventions = 0T a g T i m e s t a m p Ala rm Iden t i f i e r V a l u e M e s s a g e T y p e
T a g 1 8 : 1 8 : 2 0 A M L O P R E S 4 1 8 . 2 8 R e t u r n T o N o r m a lT a g 1 8 : 1 8 : 2 2 A M L O P R E S 3 5 7 . 1 3 Ala rmT a g 1 8 : 1 8 : 2 5 A M L O P R E S 4 1 9 R e t u r n T o N o r m a lT a g 1 8 : 1 8 : 2 6 A M L O P R E S 3 9 9 . 7 9 Ala rmT a g 1 8 : 1 8 : 3 0 A M L O P R E S 4 2 2 . 4 8 R e t u r n T o N o r m a lT a g 1 8 : 1 8 : 3 0 A M L O P R E S 3 8 9 . 6 9 Ala rmT a g 1 8 : 1 8 : 3 4 A M L O P R E S 4 2 2 . 9 3 R e t u r n T o N o r m a lT a g 1 8 : 1 8 : 3 7 A M L O P R E S 3 5 6 . 1 7 Ala rmT a g 1 8 : 1 8 : 4 0 A M L O P R E S 4 2 3 . 6 9 R e t u r n T o N o r m a lT a g 1 8 : 1 8 : 4 2 A M L O P R E S 3 6 6 . 3 1 Ala rmT a g 1 8 : 1 8 : 4 5 A M L O P R E S 4 1 3 . 3 8 R e t u r n T o N o r m a lT a g 1 8 : 1 8 : 4 7 A M L O P R E S 3 8 4 . 3 2 Ala rmT a g 1 8 : 1 8 : 5 1 A M L O P R E S 4 2 7 . 3 R e t u r n T o N o r m a lT a g 1 8 : 1 8 : 5 3 A M L O P R E S 3 7 2 . 4 6 Ala rmT a g 1 8 : 1 8 : 5 6 A M L O P R E S 4 1 8 . 9 3 R e t u r n T o N o r m a lT a g 1 8 : 1 8 : 5 8 A M L O P R E S 3 9 3 . 2 Ala rmT a g 1 8 : 1 9 : 0 2 A M L O P R E S 4 2 7 . 7 R e t u r n T o N o r m a l
Chronological Report for Tag 1

Other ReportsOther Reports
nn Standing AlarmsStanding Alarmsuu Redundant alarmsRedundant alarmsuu Ignored alarmsIgnored alarms
nn Operator InterventionOperator Interventionuu Loop tuningLoop tuning
nn Symptomatic AnalysisSymptomatic Analysisuu Parent/Child relationshipsParent/Child relationships

Improved Alarm CountsImproved Alarm Counts
A l a r m D i s t r i b u t i o n O v e r T i m e
0
10
20
30
40
50
60
D a y 1 D a y 2 D a y 3 D a y 4 D a y 5 D a y 6 D a y 7
Ala
rm C
ount
Before 2 Weeks 2 months Total ChangeDaily Average Alarms 1011 283 160 -84%
Peak 10-minute Alarm Count 166 63 29 -83%Peak Hourly Alarm Count 527 165 81 -85%
10-minute Intervals With no Alarms 13% of total 42% of total 62% of total +49% of total

Continuing ManagementContinuing Management
nn Top 20 alarms reviewed dailyTop 20 alarms reviewed daily
nn Problem Tags assigned to EngineersProblem Tags assigned to Engineers
nn DCS Technician maintains database for changesDCS Technician maintains database for changes
nn Upsets are reviewed in detailUpsets are reviewed in detail

Other ObservationsOther Observations
nn Continuous effort requiredContinuous effort required
nn Identify faulty equipment/instrumentsIdentify faulty equipment/instruments
nn FirstFirst--out determinationout determination

SummarySummary
nn ProcessGuard installed to analyze alarm ProcessGuard installed to analyze alarm systemsystem
nn >80% reduction in alarms over fist 2 months>80% reduction in alarms over fist 2 monthsnn Permanent management process started to Permanent management process started to
"hold the gain""hold the gain"