ebitda de r$ 32,9 milhões com generally accepted accounting practices in brazil (br gaap) and cvm...
TRANSCRIPT

1
Earnings Release

2
Earnings Release
SATIPEL INDUSTRIAL S.A.
Sales of 355.7 thousand m³ and Net Revenue of R$ 232.5 million
in the 1H09
São Paulo, August 13, 2009 – Satipel Industrial S.A. (Bovespa: SATI3), one of the largest manufacturers of Medium Density Particleboard (PBP) in Brazil, and also a manufacturer of Medium Density Fiberboard (MDF) since September 2008, announces its results for the second quarter of 2009 (2Q09). Except where stated otherwise, the operating and financial information herein is presented in Brazilian reais (R$), pursuant to Brazilian Corporate Law, in accordance with generally accepted accounting practices in Brazil (BR GAAP) and CVM (Brazilian Securities and Exchange Commission) regulations, including the changes proposed by Laws 11,638/07 and 11,941/09 (conversion of Edict 449/08). Comparisons refer to the quarter ended June 30, 2009 (2Q09) in relation to the second quarter of 2008 (2Q08) and to the first quarter of 2009 (1Q09) and, as applicable, to the first semester of 2009 (1H09) in relation to the same period of 2008 (1H08). The base for the presentation of results is subject to differences due to the rounding of figures. Some information released for prior quarters and periods has been reclassified due to the changes proposed by Laws 11,638/07 and 11,941/09 (conversion of Edict 449/08).
A New Cycle This report is particularly special to Satipel Industrial S/A because it will be the last one issued under this company’s name. From next quarter on our company’s name will be changed to Duratex S.A., due to the association of Satipel and Duratex. This report represents a quite relevant benchmark to Satipel’s shareholders and employees. Since 2006, the Company has invested around R$ 700 million, building two new plants, of which one is an MDF plant in Uberaba, with production capacity of 350,000 m3/year, and the other is an BP plant in Taquari, recently inaugurated, with production capacity of 700,000 m3/year. In addition, it has consolidated its self-sufficient condition in terms of wood in the Uberaba plant, with a forest area of approximately 70,000 hectares. In September 2007, as a result of its shareholders’ modern and entrepreneurial vision, the Company went public and raised R$ 227.8 million in net funds, which were fully invested in its expansion projects. Satipel is now a modern company, with state-of-the-art industrial facilities, total production capacity of 1,750,000 m3/year – the second largest in Brazil – with low production costs, strategically located plants. All the efforts made by the company to implement this startegy that made possible its association with Duratex. A new cycle has thus begun, bringing new challenges to be faced with the same determination, competence and trust.

3
Earnings Release
Association between Duratex S.A. and Satipel Industrial S.A. A Relevant Fact was published on June 22, 2009 informing the market about the creation of the largest manufacturer of industrialized wood panels in the South hemisphere, and one of the largest in the world, as a result of the association between Duratex S.A. and Satipel Industrial S.A. A global company resulted from the above referred association, with scale gains in ever more competitive markets and prepared to continue its successful sustained growth course. Other advantages are allied to the exceptional complementarity nature of the association not only from a geographic viewpoint, with manufacturing plants located near the main furniture manufacturing centers, but also in terms of product lines, from a more balanced mix between PB and MDF, which is expected to strengthen competitive edges based on the increased capacity to meet market needs, development of products and technological innovation, in the adoption of the best management practices and in potentializing corporate cultures and competencies by retaining the best talents. In order to obtain the gains derived from the association in a most quick and efficient manner, 14 Integration Committees were created. Such committees are made up by executive officers of the two companies and their purpose is to review the different operations, seeking the best practices and synergies, as above mentioned. This operation will be implemented, after the approval by the competent agencies, by means of a corporate reorganization in which Satipel will icorporate Duratex and, concomitantly, will have its name changed into Duratex S.A. Its shares will be traded at Bovespa’s Novo Mercado (“New Market”) and provisions will be set forth in its bylaws to the effect of ensuring the payment of a minimum dividend of 30% of the adjusted net profit. The Shareholders’ Agreement executed between the controlling shareholders of Duratex and Satipel ensures a minimum free float of 40%. Additionally, the controlling shareholders of both companies will be bound by a lock-up agreement under which they undertake themselves not to sell their respective shares for a minimum period of 5 years. New PB Factory in Taquari (RS) – Production on a commercial basis started last June 23, as scheduled. MDF Plant in Uberaba (MG) – resumed regular operations by mid-June. CAPEX reached R$ 118.2 million in the 1H09, in accordance to the investment spending plan.
Net Operating Revenue (NOR) in the 1H09 reached R$ 232.5 million, recording a reduction of 5.7% in relation to the same period of 2008.
Nonrecurring Events in the 1H09 totaled R$ 11.4 million due to costs and expenses due to the decommission of the cyclic press in Taquari, the MDF line stoppage in Uberaba and the early liquidation of derivative transactions with strikes.
R$ 61.7 millions Underlying EBITDA in the 1H09, (underlying EBITDA Margin of 26.5%).

4
Earnings Release
R$ thousand 2Q09 2Q08 % 1Q09 % 1H09 1H08 %
INCOME STATEMENT
Net Operating Revenue 113,821 125,773 (9.5) 118,681 (4.1) 232,502 246,652 (5.7)
Underlying Gross Income (1) 36,180 53,007 (31.7) 40,065 (9.7) 76,245 99,929 (23.7)
Gross Margin 31.8% 42.1% (10.4) pp 33.8% (2.0) pp 32.8% 40.5% (7.7) pp
Underlying EBITDA (2) 26,243 42,989 (39.0) 35,410 (25.9) 61,653 80,136 (23.1)
Underlying EBITDA Margin 23.1% 34.2% (11.1) pp 29.8% (6.8) pp 26.5% 32.5% (6.0) pp
Underlying Net Income (3) 8,377 24,143 (65.3) 12,298 (31.9) 20,675 43,540 (52.5)
BALANCE SHEET
Cash 58,772 252,865 (76.8) 76,917 (23.6) 58,772 252,865 (76.8)
Current Assets 209,502 361,997 (42.1) 229,088 (8.5) 209,502 361,997 (42.1)
Total Asset 1,182,870 1,027,030 15.2 1,164,418 1.6 1,182,870 1,027,030 15.2
Current Liability 179,456 156,115 15.0 173,862 3.2 179,456 156,115 15.0
Gross Debt 473,856 332,694 42.4 464,067 2.1 473,856 332,694 42.4
Shareholders Equity 530,343 515,299 2.9 527,532 0.5 530,343 515,299 2.9 (1) Elimination of the negative effects of the costs arising out of the shutdown in the BP Taquari and MDF Uberaba lines (severance pay, transfer
freights between plants and low production scale). (2) Elimination of the negative effects of the costs arising out of the shutdown in the MDP Taquari and MDF Uberaba lines as mentioned in note (1)
above, in addition to the costs related to manufacturing idleness (excluding depreciation) of the referred lines accounted for in other operating expenses.
(3) Elimination of the effects of notes (1) and (2), as well as of the advanced settlement of derivatives, all of them net of the income tax and social contribution portion assessed on such amounts.
Events of a Nonrecurring Nature In this semester, the Company incurred expenses in connection with manufacturing idleness, severance pay and transfer of products due to: 1) stoppage for repairs in the MDF line in Uberaba, which had been recording technical problems that caused vibration in the refiner since the start-up; and 2) expenses incurred since the deactivation of the cyclic line in Taquari in February 2009 until the start-up of the continuous line production on June 23. These expenses totaled R$ 9.5 million for EBITDA effects. Additionally, the Company incurred financial expenses of R$ 6.2 million due to the advanced settlement of derivatives. All these costs and expenses, deducted from the respective income tax and social contribution, impacted the net profit of the semester by R$ 11.4 million.
R$'000 1Q09 2Q09 1H09
Reported EBITDA 32,9 19,3 52,2
(+) BP Line (Taquari) 1,9 4,2 6,1
(+) MDF Line (Uberaba) 0,7 2,7 3,4
(=) Underlying EBITDA 35,5 26,2 61,7
Reported Net Income 6,5 2,8 9,3
(+) EBITDA Nonrecurrent Adjustments 2,6 6,9 9,5
(+) Depreciation 0,2 1,5 1,7
(+) Financial Expenses 6,2 - 6,2
(-) IR effects on adjustments (3,1) (2,9) (6,0)
(=) Underlying Net Income 12,4 8,3 20,7
Comments
Idleness costs, severance costs and transportation costs
of semifinished products since the decommission of the cyclic line till
the new line production started (Feb-June)
Idleness costs and expenses due to the stoppage to adjust the refiner
that presented excess vibration since its start-up
Taquari BP and Uberaba MDF Lines
Idleness/Taquari and Uberaba Lines
Derivatives/Early Liquidation
-

5
Earnings Release
Operating Performance The date June 23 will be remembered as the that of the beginning of the commercial operation of a the new BP Taquari plant. With a capacity of 700,000 m3/year and total investments of R$ 255 million, said plant is one of the most modern in the world, with state-of-the-art technology and ready to operate at competitive costs. As previously informed to the market in the end of March, following the preventive maintenance stoppage of the new MDF line, a technical problem that caused vibration in the refiner - an essential equipment in the MDF production process - was detected. With the supervision of companies Andritz and Siempelkamp, respectively the equipment manufacturer and the company in charge for the system, several repairs and tests were carried out and the line restarted its regular operation by middle June (approximately 75 days of stoppage). Since then, production has been regular and the refiner vibration levels are within the manufacturer’s specification. After the MDF production was resumed, the Company has been registering daily production levels above the forecast by the ramp-up plan for the line.
PANEL 2Q09 2Q08 % 1Q09 % 1H09 1H08 %
Total Panels Production (m³) 168,392 199,201 (15.5) 173,441 (2.9) 341,832 380,119 (10.1)
Panel Sales - Total (m³) 183,408 183,153 0.1 172,262 6.5 355,670 361,841 (1.7)
NON - COATED PANEL 106,442 92,145 15.5 83,287 27.8 189,729 184,877 2.6
COATED PANEL 69,467 86,301 (19.5) 81,472 (14.7) 150,939 167,525 (9.9)
/1 Considers Non Coated and Coated Panel, Ready-made parts and Strips
/2 Considers MDP + MDF
/1
/2 /2 /2
Total 2Q09 panel production fell by 15.5%, or 30.8 thousand m3, year-on-year due to the planned shutdown of the cyclic line in the Taquari BP plant, beginning in February 2009 (nominal installed capacity of 200 thousand m3/year or 50 thousand m3/quarter) and to the stoppage of the MDF line in Uberaba (MG). In the year-on-year comparison, the reduction was of 10.1% and is explained by the same factors. The MDF production accounted for 9.8% of total panel production in the 1H09. Total panel sales in the 2Q09 were 183.4 thousand m3, stable in relation to the 2Q08, including MDF’s share in the period, which accounted for approximately 12.3% of total sales in the 2Q09, which exceeded the produced volume due to the sale of inventories. The 1.7% drop in sales in the 1H09 over the 1H08 is explained by the reduction in the supply of products due to the shutdown in the 2 lines (MDF in Uberaba and BP in Taquari), and due to the economic scenario that affected the market of wood panel for furniture, especially in the popular furniture segment and in the first quarter of this year, in which period a high level of inventory in the furniture producing chain was recorded. There was a change in the product mix resulting from the increase in the share of non-coated panels in the 2Q09, which accounted for 58.0% of total sales, versus 50.3% in the 2Q08 and 48.3% in the 1Q09. With respect to the 1H09, non-coated panels accounted for 53.3% of sales versus 51.1% in the 1H08. This behavior results from the change in the demand of one type of coated panel (FF) to non-coated panel, which is designed to the production of furniture, most of which of a popular type, with painted finishing, without deteriorating the margins to the Company.

6
Earnings Release
The mix also changed due to the supply of MDF, which has greater value and that was included in the product mix as from September 2008. Coated MDF panels also presented higher quarter-on-quarter growth in the 2Q09 in relation to the 1Q09.
Gross Income and Gross Margin
R$ thousand 2Q09 2Q08 % 1Q09 % 1H09 1H08 %
Gross Revenue 158,141 173,727 (9.0) 163,865 (3.5) 322,006 340,360 (5.4)
Taxes and Deductions (44,320) (47,954) (7.6) (45,184) (1.9) (89,504) (93,708) (4.5)
Net Operating Revenue (NOR) 113,821 125,773 (9.5) 118,681 (4.1) 232,502 246,652 (5.7)
Recurrent Cost of Goods Sold (COGS) (77,641) (72,766) 6.7 (78,616) (1.2) (156,257) (146,723) 6.5
Cost of Goods Sold (Cash) (64,990) (64,234) 1.2 (64,730) 0.4 (129,720) (129,828) (0.1)
Depreciation and Depletion (included in COGS) (12,651) (8,532) 48.3 (13,886) (8.9) (26,537) (16,895) 57.1
Recurrent Gross Income 36,180 53,007 (31.7) 40,065 (9.7) 76,245 99,929 (23.7)
Recurrent Gross Margin 31.8% 42.1%(10,0) pp 33.8% (3,4) pp 32.8% 40.5% (7,7) pp
/1 COGS without Depreciation and Depletion
/1
Net Operating Revenue (NOR) NOR of R$ 113.8 million in the 2Q09 in relation to the 2Q08 represented a 9.5% reduction despite the stability in the sales volume in m3. This results from the reduction in the market prices, due to a higher supply of wood panels and to the change in the product mix, partially offset by the inclusion of MDF in the products portfolio. In the 2Q09, NOR fell by 4.1% in relation to the previous quarter, while sales volume increased by 6.5% in the same period, which result was due to the market scenario that required the adoption of sales strategy adequate to the current macroeconomic situation. For the same reasons, in the comparison of the 1H09 over the 1H08, the NOR recorded a reduction of 5.7% versus a drop of 1.7% in the sales volume.
Cost of Goods Sold (COGS)
R$ thousand 2Q09 2Q08 % 1Q09 % 1H09 1H08 %
Reported Cost of Goods Sold (COGS) (80,234) (72,766) 10.3 (80,588) (0.4) (160,822) (146,723) 9.6
Nonrecurring Events
Depreciation and Depletion (8,700) (8,777) (0.9) (8,700) (0.9) (100.0)
PB Line Taquari (2,262) - - (1,327) 70.5 (3,589) - -
MDF Line Uberaba (331) - - (645) (48.7) (976) - -
Underlying Cost of Goods Sold (COGS) (77,641) (72,766) 6.7 (78,616) (1.2) (156,257) (146,723) 6.5
/1 Severance costs and transfer freight
/1
The increase of 6.7% in the underlying COGS comparing 2Q09 to 2Q08 is due to cost of MDF, (which is higher than the cost of PB), and which was not produced in the 2Q08. In addition, the activation of the MDF plant in Uberaba (MG) caused depreciation to increase from R$ 8.5 million to R$ 12.7 million (of which R$ 1.5 million refers to the portion of the manufacturing idleness posted to Other Revenue/Operating Expenses). These same factors explained the 6.5% increase in the comparison between 1H09 and 1H08. Underlying Gross Income of R$ 36.2 million in the 2Q09 corresponds to a underlying Gross Margin of 31.8%, versus 42.1% in the 2Q08 and 33.8% in the 1Q09. This behavior results from the reduction in the sale price, reduction in the production volume, and the MDF costs, which are

7
Earnings Release
higher than the PB. Due to the same factors, the underlying Gross Income of R$ 76.2 million (underlying Gross Margin of 32.8%) in the 1H09 was 23.7% lower than the R$ 99.9 million recorded in the 1H08 (underlying Gross Margin of 40.5%).
Operating Revenues
R$ thousand 2Q09 2Q08 % 1Q09 % 1H09 1H08 %
Selling Expenses (13,774) (10,459) 31.7 (9,085) 51.6 (22,859) (21,190) 7.9
General and Administrative Expenses (5,249) (4,609) 13.9 (5,441) (3.5) (10,690) (9,154) 16.8
Management Remuneration (1,321) (1,253) 5.4 (1,156) 14.3 (2,477) (1,806) 37.2
Depreciation and Amortization (552) (392) 40.8 (443) 24.6 (995) (780) 27.6
Employee Interest (587) (1,414) (58.5) (1,152) (49.0) (1,739) (2,729) (36.3)
Underlying Other Operating Income (Expenses) (5,062) (157) 3,124.2 (2,407) 110.3 (7,469) (965) 674.0
Total (26,545) (18,284) 45.2 (19,684) 34.9 (46,229) (36,624) 26.2 Selling Expenses – The increase of R$ 3.3 million in the 2Q09 over the 2Q08 and of R$ 4.7 million over the 1Q09 are due to increased freight expenses that was caused by the sales of MDF together with a bigger and concentrated sales effort in the period. Due to the same factors, selling expenses increased by R$ 1.7 million in the 1H09 over the 1H08. In relative terms, Selling Expenses in the 2Q09 correspond to 12.1% of the NOR, versus 8.3% in the 2Q08 and 7.7% in the 1Q09. In the semester-on-semester comparison, Selling Expenses accounted for 9.8% of the NOR in the 1H09 and 8.6% in the 1H08. EBITDA
R$ thousand 2Q09 2Q08 % 1Q09 % 1H09 1H08 %
Reported Net Income of the Period 2,811 24,143 (88.4) 6,448 (56.4) 9,259 43,540 (78.7)
Net Financial Results (deducting net exchange variations) 4,273 (1,440) (396.7) 10,551 (59.5) 14,824 (1,367) (1,184.4)
Depreciation, Amortization and Depletion 14,694 8,924 64.7 14,489 1.4 29,183 17,675 65.1
Income Tax and Social Contribution (559) 12,020 (104.7) 1,001 (155.8) 442 21,132 (97.9)
Reported Adjusted EBITDA 19,300 42,989 (55.1) 32,900 (41.3) 52,200 80,136 (34.9)
Underlying Cost of Goods Sold (COGS) 2,593 - - 1,972 31.5 4,565 - -
Income Tax and Social Contribution 4,350 - - 538 708.6 4,888 - -
Minority/Employee Interest 26,243 42,989 (39.0) 35,410 (25.9) 61,653 80,136 (23.1) The underlying EBITDA totaled R$ 26.2 million in the 2Q09. When compared to the 2Q08, the variation is due to the decline in Net Operating Revenue, in turn caused by the economic scenario and by lower dilution of fixed costs and of the MDF higher costs.
Depreciation, Amortization and Depletion This line figure grew by R$ 5.8 million in the 2Q09 in the year-on-year comparison due to the startup of the new MDF plant. The same explanation applies to the comparison between the 1H09 and the 1H08, which recorded an increase of R$ 11.5 million. In relation to the 1Q09, this line figure remained almost stable.
CAPEX Capital Expenditures in the 2Q09 totaled R$ 51.6 million. The aggregate investment in the last 12 months was of approximately R$ 340 million, there remaining only R$ 25.0 million for completing the industrial expansion investment.

8
Earnings Release
Forest Base On June 30, 2009, Satipel had 86,600 hectares of forest, including long-term wood supply agreements with third parties, of development, leasing and partnership types. Satipel, in pursuance of the forest management system development project, has consolidated the implementation of the record, planning and operating control modules, in addition to completing the preparation of the MG and RS forest massifs charts. The conclusion of these modules as well as of the charts, will allow macro and micro-planning procedures to be implemented, thus potentializing the process for integration of ecologic, social and economic aspects of the company’s forest base management. The field research program started recording the anticipated gains. The conclusion of experimental tests enabled a 30% reduction in the doses of herbicides used for controlling vegetative competition in Eucalyptus pre and post-planting. This work, besides enabling a significant operating cost reduction, will provide material environmental gains in the handling of Satipel’s Eucalyptus plantation.
Indebtedness
R$ thousand 06/30/09 06/30/08 03/31/09
Short-term 101,443 60,261 101,879
Long-term 372,413 272,433 362,188
Loans and Financing 473,856 332,694 464,067
Cash and Cash Equivalents 58,772 252,865 76,917
Net Indebtedness 415,084 79,829 387,150 Net financial debt increased by R$ 335.3 million in relation to June 30, 2008, due, mainly, to the investments made in the MDF plant in Uberaba (MG) and in the PB plant in Taquari (RS). It must be pointed out that most of the new loans were borrowed from the BNDES and the BDMG, at lower than market costs.
Financial Income and Expenses
R$ thousand 2Q09 2Q08 % 1Q09 % 1H09 1H08 %
Financial Revenues 2,334 8,905 (73.8) 6,044 (61.4) 8,378 15,095 (44.5)
Financial Expenses (11,074) (8,451) 31.0 (17,199) (35.6) (28,273) (14,580) 93.9
CPMF, IOF and Other Taxes (62) (25) 148.0 (103) (39.8) (165) (225) (26.7)
Net Exchange Variation 4,529 1,011 348.0 707 540.6 5,236 1,077 386.2
Reported Net Financial Results (4,273) 1,440 (396.7) (10,551) (59.5) (14,824) 1,367 (1,184.4)
Nonrecurring Events
Derivative / Early liquidation - - - 6,193 6,193 - -
Underlying Net Financial Results (4,273) 1,440 (396.7) (4,358) (2.0) (8,631) 1,367 (731.4) Financial income in the 2Q09 dropped by 73.8% in relation to the 2Q08 due to the reduction in investments as a result of the expenditures effected in the period. Financial income in the 1H09 also recorded a reduction in relation to the 1H08 for the same reasons. Financial expenses increased by approximately R$ 2.6 million or 31% over 2Q08 thanks to the 42.4% increase in the indebtedness as a consequence of the investments made. In comparison to 1Q09, the underlying net financial income remained stable. It is worth noting, further, that after

9
Earnings Release
the settlement of the transactions with derivatives with strikes in the 1Q09, Satipel has no other such transaction.
Capital Stock – Capital Structure Satipel’s capital stock totals R$ 344,458,972.55, represented by 109,576,806 registered common shares, with no face value, of which 31,222,879 are publicly held and 463,200 are treasury shares arising out of the stock repurchase program approved in January 2008 and now terminated, because its one-year term has expired.
Quality Satipel’s Quality Management System (SQMS) seeks, through the continuous improvement of its processes, to ensure the highest quality products and services, supported by the 5 dimensions of quality: Perceived Quality, Cost, Delivery, Morale and Safety. The first SQMS milestone occurred in 1997 at the Taquari plant in Rio Grande do Sul State, which was the first panel manufacturer plant in Brazil to obtain ISO 9001 certification. Since then, new management tools have been implemented, consolidating the SQMS as an important quality-assurance instrument for Satipel. In 2001, the Management Guidelines and Daily Routine programs were implemented; in 2002, strategic planning was implemented; and in 2004, the Uberaba plant in Minas Gerais achieved ISO 9001 certification, implemented an improvement team and since 2005 has entered a continuous improvement stage. Moreover, ISO 9001:2000 certification helps support the entire Quality Management System through independent external audits, ensuring ever-higher levels of performance. The Expense Management Matrix (EMM) was implemented in 2008, which product was incorporated into the other routine tools. The management has been diligently working in redesigning the company’s processes.
Human Resources On June 30, 2009, Satipel had 1,034 employees. The Company offers compensation and benefits in line with best market practices, in addition to bonus Programs, private pension plans and educational and career development programs. Satipel has also implemented an employees’ profit-sharing plan, paid out at the end of each fiscal year whenever the targets established in the program are met. In 2009, Satipel moved ahead with its employee training and development program begun in 2007 and focused on developing leaders through individual development plans. It also proceeded with the technical qualification of production and maintenance teams, geared towards the start-up of the new PB plant in Taquari.
Sustainability
Satipel's commitment to the sustainability of its business goes beyond merely complying with
current laws and regulations, with a view to deepen the understanding and integration of the
sustainability concept into the Company’s business strategy.
Community Relations – Social Programs
Satipel’s Social Responsibility Policy promotes social responsibility initiatives that seek to benefit
those communities closest to its industrial and forestry complexes, with a special emphasis on
technical education and alternative income generation as a means of social inclusion and local
development, in partnership with local governments, labor unions and other entities. Among

10
Earnings Release
Satipel’s projects, the following are worthy of mention: (i) the Formare Project, from which 189
youngsters have graduated since 2003, 30 of whom in 2009, with the support of Satipel
employees who work as Volunteer Instructors; (ii) the maintenance of a municipal secondary
school in the Forestry Unit (Núcleo Educacional Municipal Castelo Branco), which provides
education to around 60 children per year, who also participate in health and environment
education programs offered to Company employees; (iii) the community library Reading is
Essential (Ler É Preciso) in Estrela do Sul, Minas Gerais; and (iv) the Forest Honey Project
(Mel da Floresta), a partnership with the Minas Gerais Triangle Beekeepers Association
(AAPITRIM) to help members produce honey in eucalyptus-planted areas for subsequent sale,
thereby generating an alternative source of income in the region; and (v) Cinema and Theater
Project (Projeto Circuito EstradAfora de Cinema e Teatro), a cultural project sponsored by
Satipel using tax benefits – Rouanet Law. The Company has also been running a Forestry
Development Program since 2001, establishing partnerships with small and medium-sized
farmers for the planting of eucalyptus, increasing timber supply in the Minas Gerais Triangle
region, providing an alternative use for land, implementing agricultural, forestry and grazing
systems, diversifying income opportunities, generating jobs and keeping people in the
countryside.
Relationship with the Environment The operation of Satipel’s industrial plants and the manufacture and sale of its products abide by the applicable environmental laws and regulations. The Company also manages its natural resources in accordance with the sustainable development concept, protecting the biodiversity and ecosystems in its forests and minimizing the impact of its operations on the environment. Satipel has obtained Operating Licenses for the MDP plant in Taquari (RS) and for the MDP and MDF plants in Uberaba (MG) as well as a Construction License for a new MDP line in Taquari. The silviculture operating licenses for the farms in Florestal (MG) are valid and will be renewed in 2009 for a 5-year term. Satipel obtained, for the fourth consecutive year, the Forest Management Certificate in Minas Gerais and the chain of custody certificate for the Uberaba plant, from the Forest Stewardship Council (FSC). Satipel Florestal undertakes environmental research and develops environmental programs, including: (i) the Environmental Monitoring Program for flora and fauna maintenance and protection; (ii) investments in the monitoring of small river basins; and (iii) the surveying and classification of soils in forest areas. In its industrial processes, Satipel uses wood waste (biomass) to produce 100% of the thermal power required in its Uberaba (MG) plant. In the Taquari (RS) unit, it uses wood byproducts generated by other industries in its panel production.
History/Description of Satipel and its Business Satipel is a publicly held company with head office in São Paulo (SP) and industrial plants located in Uberaba, Minas Gerais State and in Taquari, Rio Grande do Sul State for the manufacture of non-coated and coated Medium Density Particleboard (MDP) and Medium Density Fiberboard (MDF), as well as of semi-finished components for furniture. Satipel is the controlling shareholder of Satipel Florestal Ltda., a company specializing in planting and reforestation projects. Founded in 1971, in Taquari (RS), Satipel was the Brazil’s first large

11
Earnings Release
manufacturer of wood-based panels, and today has an installed production capacity of 1,350 thousand m³ of panels per year, of which 1.0 million m³ are MDP and 350 thousand m³ are MDF. Since its founding, Satipel has been renowned as a pioneer in the industry, regularly investing to meet the needs of its customers. Satipel’s enterprising vocation was further boosted in 1992 when it was acquired by the Ligna Group. Since then, the Company has heavily invested in modernizing and expanding its industrial facilities and in acquiring new forest assets. In September 2008, the new MDF plant at Uberaba (MG), with an installed production capacity of 350 thousand m³/year, started-up its commercial operations. The construction of a new MDP plant in Taquari (RS), with a production capacity of 700 thousand m³/year and startup expected by mid this year, is in progress, and is due to replace the 200 thousand m³/year produced by the cyclic line that was closed last February. The location of Satipel’s plants in Uberaba (MG) and Taquari (RS) provides strategic advantages, given their proximity to forests and Brazil’s main furniture manufacturing centers, such as Votuporanga, Araçatuba, Rio Preto, Mirassol, Linhares, Ubá, São José do Rio Preto, Arapongas, Curitiba, São Bento do Sul and Bento Gonçalves.
Satipel’s Main Products Satipel MDP: A Medium Density Particleboard Panel produced from selected wood particles from planted forests, glued together with synthetic thermoset resin and special additives in a simultaneous heat and pressure process. Satipel MDP BP: A Medium Density Particleboard Panel with one or both faces coated with thermofused melamine resin-impregnated cellulosic sheets submitted to pressing at high temperatures and low pressure, resulting in a single and indissoluble body with the panel surface, conferring excellent resistance to abrasion and chemicals. Satipel MDP FF: A Medium Density Particleboard Panel with one or both faces coated with finish foil cellulosic sheets, specially treated with varnish, which gives the product varying levels of brilliance or prepares it for subsequent varnishing. Satipel MDF: A Medium Density Fiberboard Panel produced from wood fibers from planted forests, glued together with synthetic thermoset resin and special additives in a simultaneous heat and pressure process. Satipel MDF BP: A Medium Density Fiberboard Panel with one or both faces coated with thermofused melamine resin-impregnated cellulosic sheets, by pressing at high temperatures and low pressure, resulting in a single and indissoluble body with the panel surface, conferring excellent resistance to abrasion and chemicals. Satipel MDF FF: A Medium Density Fiberboard Panel with one or both faces coated with finish foil cellulosic sheets, specially treated with varnish, which gives the product varying levels of brilliance or prepares it for subsequent varnishing.
Launches Satipel Naval MDP: The only MDP panel available on the market that is resistant to both termites and humidity and has a 5-year warranty. It can be sold non-coated or coated with BP. Satipel Native: An MDP panel with one or both faces coated with “eco-veneer” pulp sheets, which has a high visual impact, deriving from the use of advanced technology to highlight the

12
Earnings Release
wood’s grain and other natural aspects. It is the best cost-benefit solution for people seeking a BP appearance for a FF price. Satipel ECO Collection: Sold both in MDP and MDF forms, Satipel’s portfolio of MDP types and finishings has been reorganized and simplified to facilitate the work of the factories and of the commercial area. Broken-down into five exclusive lines, Satipel Eco Collection was present at Fimma Brasil 2009, with the launching of 9 types. For more details, please visit the collection’s hotsite: www.satipel.com.br/colecaoeco.
Disclaimer The forward-looking statements contained herein related to the future of Satipel’s business, its estimated operating and financial results and its growth prospects are merely projections and, as such, are based exclusively on Management's expectations. These expectations, in turn, depend substantially on market conditions and the performance of the Brazilian economy, the industry and the international markets and are, therefore, subject to change without prior notice.
EBITDA EBITDA is not a measure used in accounting practices in Brazil and does not represent cash flow for the periods reported. EBITDA also should not be considered an alternative to net income as an indicator of operating performance or an alternative to cash flow as an indicator of liquidity. EBITDA has no standardized meaning and our definition of EBITDA may not be comparable with the adjusted EBITDA used by other companies. Although EBITDA does not provide a measure of cash flow in accordance with Brazilian accounting standards, Management uses the same to measure the Company´s operating performance. Additionally, we understand that certain investors and financial analysts use EBITDA as an indication of a company’s operating performance and/or its cash flow.
13
Earnings Release
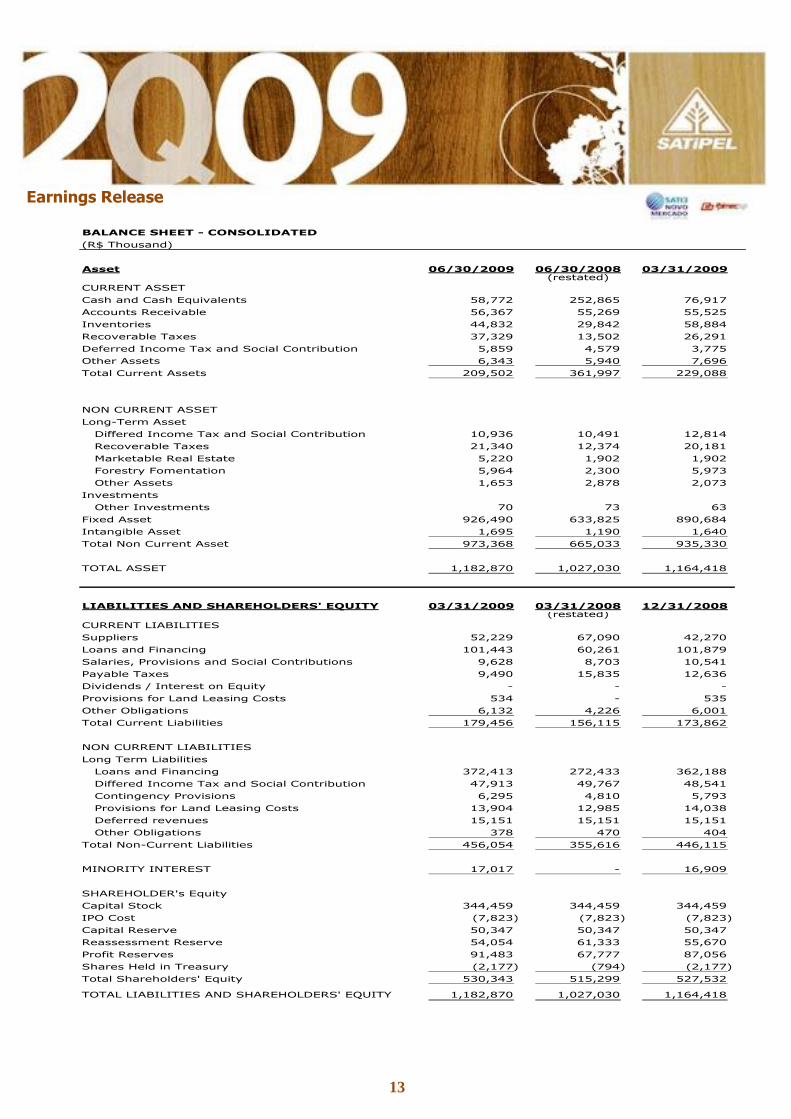
BALANCE SHEET - CONSOLIDATED
(R$ Thousand)
Asset 06/30/2009 06/30/2008 03/31/2009(restated)
CURRENT ASSET
Cash and Cash Equivalents 58,772 252,865 76,917
Accounts Receivable 56,367 55,269 55,525
Inventories 44,832 29,842 58,884
Recoverable Taxes 37,329 13,502 26,291
Deferred Income Tax and Social Contribution 5,859 4,579 3,775
Other Assets 6,343 5,940 7,696
Total Current Assets 209,502 361,997 229,088
NON CURRENT ASSET
Long-Term Asset
Differed Income Tax and Social Contribution 10,936 10,491 12,814
Recoverable Taxes 21,340 12,374 20,181
Marketable Real Estate 5,220 1,902 1,902
Forestry Fomentation 5,964 2,300 5,973
Other Assets 1,653 2,878 2,073
Investments
Other Investments 70 73 63
Fixed Asset 926,490 633,825 890,684
Intangible Asset 1,695 1,190 1,640
Total Non Current Asset 973,368 665,033 935,330
TOTAL ASSET 1,182,870 1,027,030 1,164,418
LIABILITIES AND SHAREHOLDERS' EQUITY 03/31/2009 03/31/2008 12/31/2008(restated)
CURRENT LIABILITIES
Suppliers 52,229 67,090 42,270
Loans and Financing 101,443 60,261 101,879
Salaries, Provisions and Social Contributions 9,628 8,703 10,541
Payable Taxes 9,490 15,835 12,636
Dividends / Interest on Equity - - -
Provisions for Land Leasing Costs 534 - 535
Other Obligations 6,132 4,226 6,001
Total Current Liabilities 179,456 156,115 173,862
NON CURRENT LIABILITIES
Long Term Liabilities
Loans and Financing 372,413 272,433 362,188
Differed Income Tax and Social Contribution 47,913 49,767 48,541
Contingency Provisions 6,295 4,810 5,793
Provisions for Land Leasing Costs 13,904 12,985 14,038
Deferred revenues 15,151 15,151 15,151
Other Obligations 378 470 404
Total Non-Current Liabilities 456,054 355,616 446,115
MINORITY INTEREST 17,017 - 16,909
SHAREHOLDER's Equity
Capital Stock 344,459 344,459 344,459
IPO Cost (7,823) (7,823) (7,823)
Capital Reserve 50,347 50,347 50,347
Reassessment Reserve 54,054 61,333 55,670
Profit Reserves 91,483 67,777 87,056
Shares Held in Treasury (2,177) (794) (2,177)
Total Shareholders' Equity 530,343 515,299 527,532
TOTAL LIABILITIES AND SHAREHOLDERS' EQUITY 1,182,870 1,027,030 1,164,418

14
Earnings Release
INCOME STATEMENT - CONSOLIDATED
(R$ Thousand)
2Q09 2Q08 % 1Q09 % 1H09 1H08 %
(restated) (restated)
GROSS REVENUE 158,141 173,727 (9.0) 163,865 (3.5) 322,006 340,360 (5.4)
Tax and Other Deductions (44,320) (47,954) (7.6) (45,184) (1.9) (89,504) (93,708) (4.5)
NET OPERATING REVENUE 113,821 125,773 (9.5) 118,681 (4.1) 232,502 246,652 (5.7)
Costs of Goods Sold (80,234) (72,766) 10.3 (80,588) (0.4) (160,822) (146,723) 9.6
GROSS INCOME 33,587 53,007 (36.6) 38,093 (11.8) 71,680 99,929 (28.3)
OPERATING REVENUES (EXPENSES)
Sales (13,774) (10,459) 31.7 (9,085) 51.6 (22,859) (21,190) 7.9
General and Administrative (5,249) (4,609) 13.9 (5,441) (3.5) (10,690) (9,154) 16.8
Management Remuneration (1,321) (1,253) 5.4 (1,156) 14.3 (2,477) (1,806) 37.2
Depreciation and Amortization (552) (392) 40.8 (443) 24.6 (995) (780) 27.6
Employee Interest (587) (1,414) (58.5) (1,152) (49.0) (1,739) (2,729) (36.3)
Other Net Operating Revenues (Expenses) (5,062) (157) 3,124.2 (2,407) 110.3 (7,469) (965) 674.0
(26,545) (18,284) 45.2 (19,684) 34.9 (46,229) (36,624) 26.2
OPERATING INCOME BEFORE FINANCIAL RESULTS 7,042 34,723 (79.7) 18,409 (61.7) 25,451 63,305 (59.8)
Financial Revenues 2,334 8,905 (73.8) 6,044 (61.4) 8,378 15,095 (44.5)
Financial Expenses (11,074) (8,451) 31.0 (17,199) (35.6) (28,273) (14,580) 93.9
Tax Expenses (62) (25) 148.0 (103) (39.8) (165) (225) (26.7)
Net Exchange Variation 4,529 1,011 348.0 707 540.6 5,236 1,077 386.2
PROFIT BEFORE INCOME TAX AND SOCIAL
CONTRIBUTION 2,769 36,163 (92.3) 7,858 (64.8) 10,627 64,672 (83.6)
Income Tax and Social Contribution - Current (276) (10,418) (97.4) (816) (66.2) (1,092) (18,567) (94.1)
Income Tax and Social Contribution - Differed 835 (1,602) (152.1) (185) (551.4) 650 (2,565) (125.3)
NET INCOME OF THE PERIOD BEFORE MINORITY
INTEREST 3,328 24,143 (86.2) 6,857 (51.5) 10,185 43,540 (76.6)
Minority Interest (517) - - (409) 26.4 (926) - -
NET INCOME OF THE PERIOD 2,811 24,143 (88.4) 6,448 (56.4) 9,259 43,540 (78.7)
EBITDA 19,300 42,989 (55.1) 32,900 (41.3) 52,200 80,136 (34.9) EBITDA MARGIN 17.0% 34.2% (16,6) pp 27.7% (10,7) pp 22.5% 32.5% (9,4) pp
EBIT 4,606 34,065 (86.5) 18,411 (75.0) 23,017 62,461 (63.1)
EBIT MARGIN 4.0% 27.1% (23.1) pp 15.5% (11.5) pp 9.9% 25.3% (15.4) pp

15
Earnings Release
CASH FLOW STATEMENT - CONSOLIDATED
(R$ Thousand)
06/2009 06/2008 03/2009(restated)
CASH FLOW FROM OPERATING ACTIVITIES
Net Income of the period 9,259 43,540 6,448
Items not Affecting Working Capital:
Net Book Value of Permanent Assets Written off 177 196 105
Depreciation, Amortization and Depletion 29,183 17,675 14,489
Net Financial Charges 12,207 7,660 10,844
Goodwill Amortization 3 2 2
Allowance for Doubtful Accounts (382) (13) (427)
Provision for Inventory Losses (1,265) (58) (108)
Minority Interest 926 - 409
Provision (reserve) for Contingencies 583 111 126
Differed Income and Social Contribution Taxes (650) 2,565 185
50,041 71,678 32,073
(Increase) Decrease in Assets
Trade Accounts Receivable (8,390) 1,692 (7,503)
Inventories 10,405 (5,617) (4,804)
Recoverable Taxes (17,573) (11,018) (5,376)
Other Receivables 811 (882) 2,347
Increase (Decrease) in liabilities:
Trade Accounts Payable (16,292) 14,950 (26,251)
Payroll and Related Charges (1,325) 143 (412)
Taxes Payable 2,704 4,344 5,848
Land Leasing - leveling off (268) 1,391 (133)
Other Payables 339 (137) 281
CASH PROVIDED BY OPERATING ACTIVITIES 20,452 76,544 (3,930)
CASH FLOW FROM INVESTING ACTIVITIES
Additions to Permanent Assets (118,191) (115,543) (66,639)
CASH USED IN INVESTING ACTIVITIES (118,191) (115,543) (66,639)
CASH FLOW FROM FINANCING ACTIVITIES
Repayment of Loans and Financing (75,897) (68,003) (42,457)
Loans and Financing 111,714 88,629 68,840
Minority Interest Increase 11,000 - 11,000
Buyback of Shares to be held in treasury - (794) -
Payment of Dividends/Profit/Interest on Equity (8,953) (5,000) (8,544)
CASH PROVIDED (USED IN) BY FINANCING ACTIVITIES 37,864 14,832 28,839
DECREASE IN CASH AND CASH EQUIVALENTS (59,875) (24,167) (41,730)
CASH AND CASH EQUIVALENTS AT BEGINNING OF PERIOD 118,647 277,032 118,647
CASH AND CASH EQUIVALENTS AT END OF PERIOD 58,772 252,865 76,917
DECREASE IN CASH AND CASH EQUIVALENTS (59,875) (24,167) (41,730)
CASH FLOW SUPPLEMENTAL INFORMATION
Payment of Income and Social Contribution taxes 2,408 13,759 1,813
Payment of Interest on Loans and Financing 16,282 9,964 6,228
Payment of Derivative Transactions 13,851 8,281 9,327

16
Earnings Release
1.CONFERENCE CALLS Portuguese English Date: August 13, 2009 Time: 9:00 a.m. (Brasília) 8:00 a.m. (New York) Phone: +55 (11) 2188-0188 Replay: +55 (11) 2188-0188 Code: Satipel
Date: August 13, 2009 Time: 10:00 a.m. (Brasília) 09:00 a.m. (New York) Phone: +1 (973) 935-8893 Replay:+1 (706) 645-9291 Code: 22430496
2. CONTACTS
Flávio Marassi Donatelli Administrative, Financial and Investor Relations Officer Charles E. Allen Investor Relations Superintendent Phone: (11) 3646 4760 Fax: (11) 3646-4761 E-mail: [email protected] http://www.satipel.com.br/ri