ecmwf training course 2005 slide 1 forecast sensitivity to observation carla cardinali
TRANSCRIPT

ECMWFTraining Course 2005 slide 1
Forecast sensitivity to Observation
Carla Cardinali
ECMWFTraining Course 2005 slide 2
Outline Part 2: Forecast Sensitivity
Forecast Sensitivity to Observation
Sensitivity gradient
A-TReC campaigns
Comparing Observation Analysis Influence and Observation Forecast
Impact
Results and Conclusion

ECMWFTraining Course 2005 slide 3
Forecast Sensitivity to Observation
Jy
J is measures the forecast error: its gradient respect the observation vector y gives the forecast error sensitivity respect
observations used in the initial condition for model forecast
J ax
ax
ythe sensitivity respect the initial condition xa
Analysis sensitivity with respect the observation

ECMWFTraining Course 2005 slide 4
Define Forecast Sensitivity
1 1 1 1( )T Ta
x
K R H B H R Hy
1 1 1 1( )T
a
J J
R H B H R H
y x
1
a
J J
R HA
y x
J Ja
a
x
y y x
ECMWFTraining Course 2005 slide 5
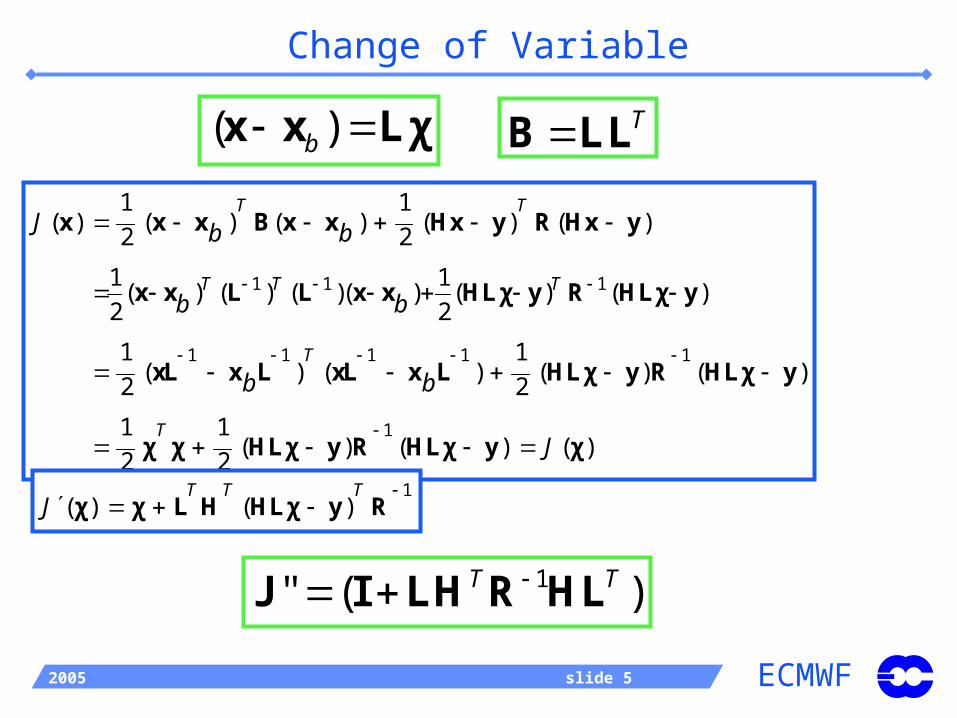
Change of Variable
1" ( )T T J I LH R HL
( )b x x Lχ
1 1 1
1 1 1 1 1
1
1 1( ) ( ) ( ) ( ) ( )
2 2
1 1( ) ( ) ( )( ) ( ) ( )
2 2
1 1( ) ( ) ( ) ( )
2 2
1 1( ) ( ) ( )
2 2
T T
T T T
T
T
J b b
b b
b b
J
x x x B x x Hx y R Hx y
x x L L x x HLχ y R HLχ y
xL x L xL x L HLχ y R HLχ y
χ χ HLχ y R HLχ y χ
TB LL
1( ) ( )
T T TJ
χ χ L H HLχ y R

ECMWFTraining Course 2005 slide 6
Computation
1 1 1 1( )T
a
J J
R H B H R H
y x
1 1 1 11 1 12 2 2 2( )T
a
J J
R HB I B H R HB B
y x1 1
1 1 12 2( )T T
a
J J
R HB I LH R HL B
y x
z
1( ") az J z
11 2
2 aLz J B z 11 1 2
2
JL
R H B zy
Linear system to solve
za

ECMWFTraining Course 2005 slide 7
Forecast Sensitivity to Observations
aJx
aJ J ay y xx
Tangent Linear Model ResolutionT95 L60
Jy
TJ J ay xK

ECMWFTraining Course 2005 slide 8
Sensitivity Gradients
Sensitivearea
Verificationarea
T1
100*TE at t=0 100*KE at t=0
TE at t=T1
KE at t=T1
500 hPa Temperature Sensitivity Gradients aJx

ECMWFTraining Course 2005 slide 9
aJx
Jy
Fc Sensitivity to Aircraft Temperature 500 hPa

ECMWFTraining Course 2005 slide 10
Fc Sensitivity to Surface Pressure
ECMWFTraining Course 2005 slide 11
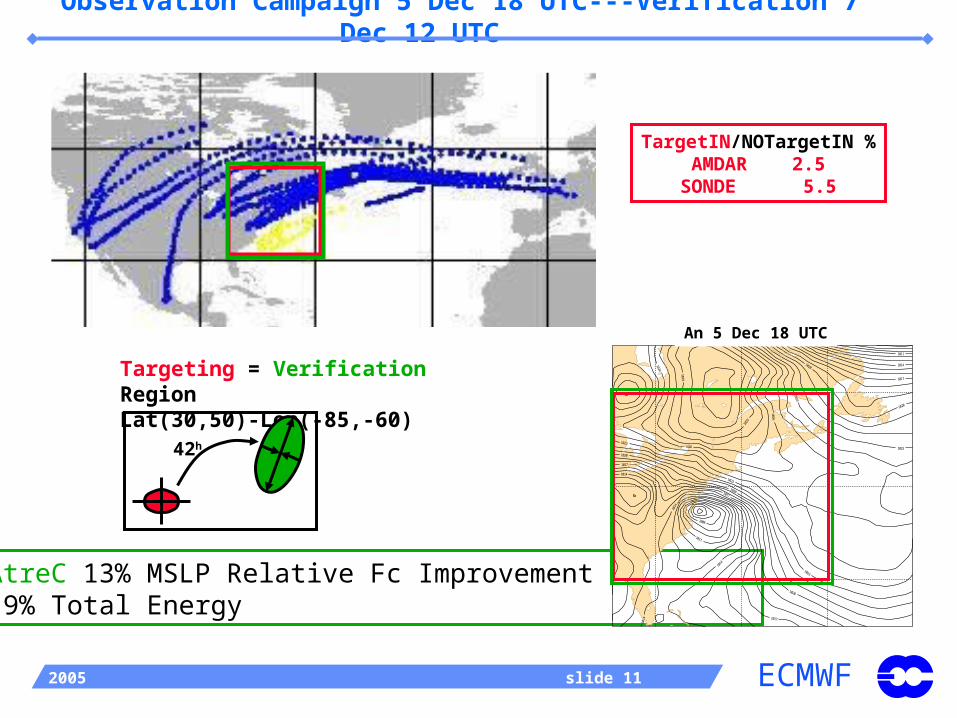
Observation Campaign 5 Dec 18 UTC---Verification 7 Dec 12 UTC
AtreC 13% MSLP Relative Fc Improvement 9% Total Energy
Targeting = Verification Region Lat(30,50)-Lon(-85,-60)
42h
TargetIN/NOTargetIN %AMDAR 2.5SONDE 5.5
1011
1014
1014
1017
10231026
An 5 Dec 18 UTC
ECMWFTraining Course 2005 slide 12
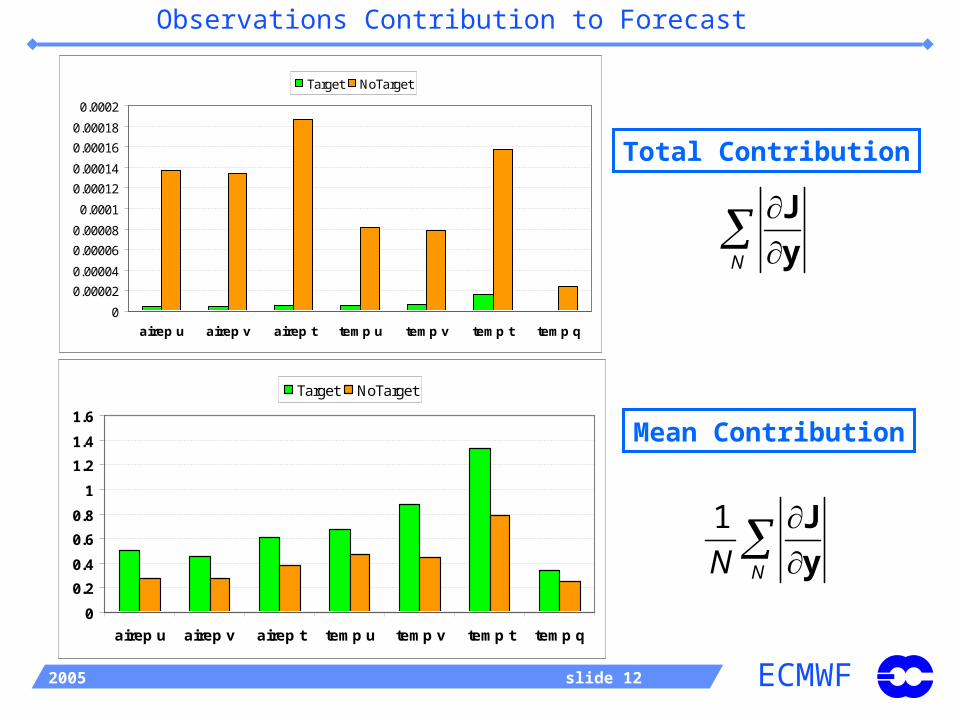
N
J
y
1
NN
J
y
Observations Contribution to Forecast
0
0.00002
0.00004
0.00006
0.00008
0.0001
0.00012
0.00014
0.00016
0.00018
0.0002
airep u airep v airep t temp u temp v temp t temp q
Target NoTarget
Total Contribution
0
0.2
0.4
0.6
0.8
1
1.2
1.4
1.6
airep u airep v airep t temp u temp v temp t temp q
Target NoTarget
Mean Contribution
ECMWFTraining Course 2005 slide 13
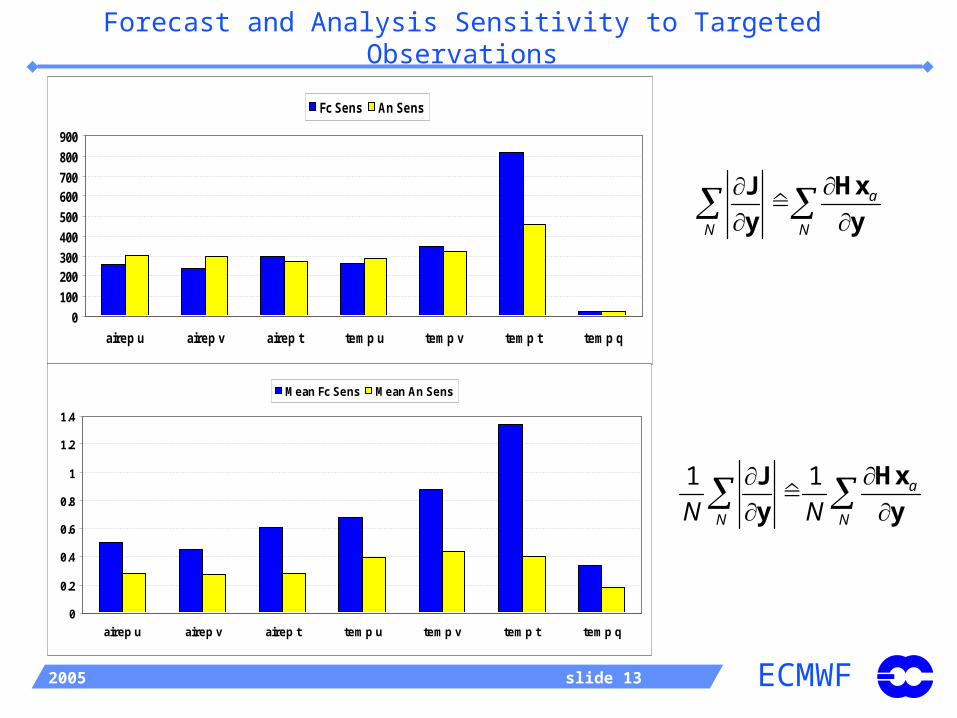
1 1 a
N NN N
HxJ
y y
a
N N
HxJ
y y
Forecast and Analysis Sensitivity to Targeted Observations
0
100
200300
400
500
600700
800
900
airep u airep v airep t temp u temp v temp t temp q
Fc Sens An Sens
0
0.2
0.4
0.6
0.8
1
1.2
1.4
airep u airep v airep t temp u temp v temp t temp q
Mean Fc Sens Mean An Sens

ECMWFTraining Course 2005 slide 14
200-300 hPa Targeted Aircraft Temperature Forecast Error
( )aJ y y HxJy Jy
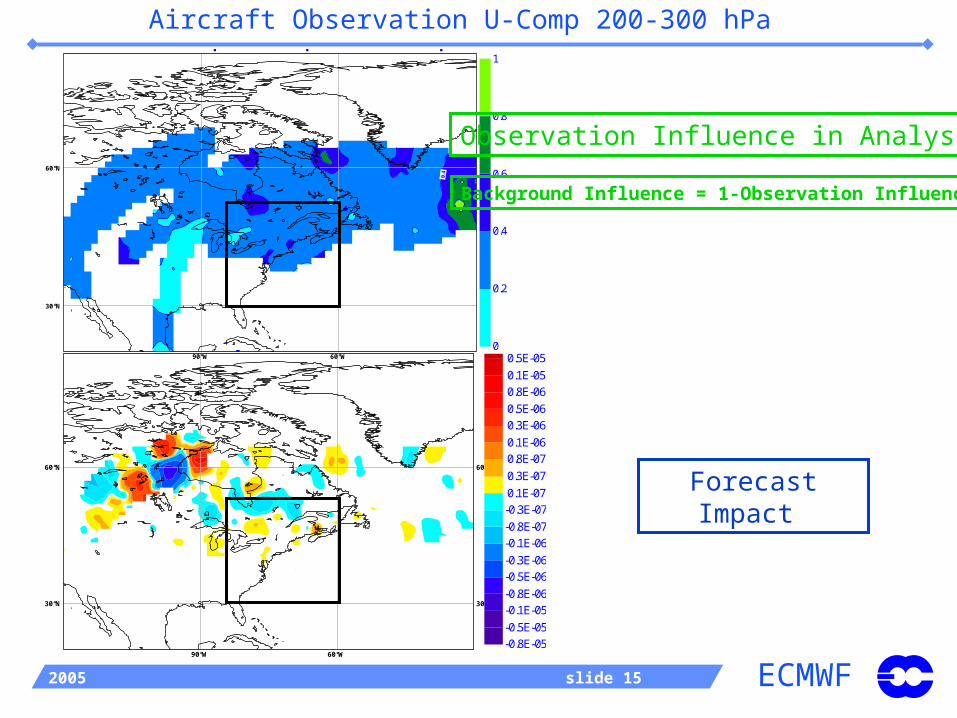
ECMWFTraining Course 2005 slide 15
Aircraft Observation U-Comp 200-300 hPa
30°N 30°N
60°N60°N
90°W
90°W 60°W
60°Wek4d airep_u Level:300
-0.8E-05
-0.5E-05
-0.1E-05
-0.8E-06
-0.5E-06
-0.3E-06
-0.1E-06
-0.8E-07
-0.3E-07
0.1E-07
0.3E-07
0.8E-07
0.1E-06
0.3E-06
0.5E-06
0.8E-06
0.1E-05
0.5E-05
0.8E-05
0.4
30°N 30°N
60°N60°N
90°W
90°W 60°W
60°WAn Sens Airep u-comp300-200 Hpa
0
0.2
0.4
0.6
0.8
1
Forecast Impact
Observation Influence in Analysis
Background Influence = 1-Observation Influence
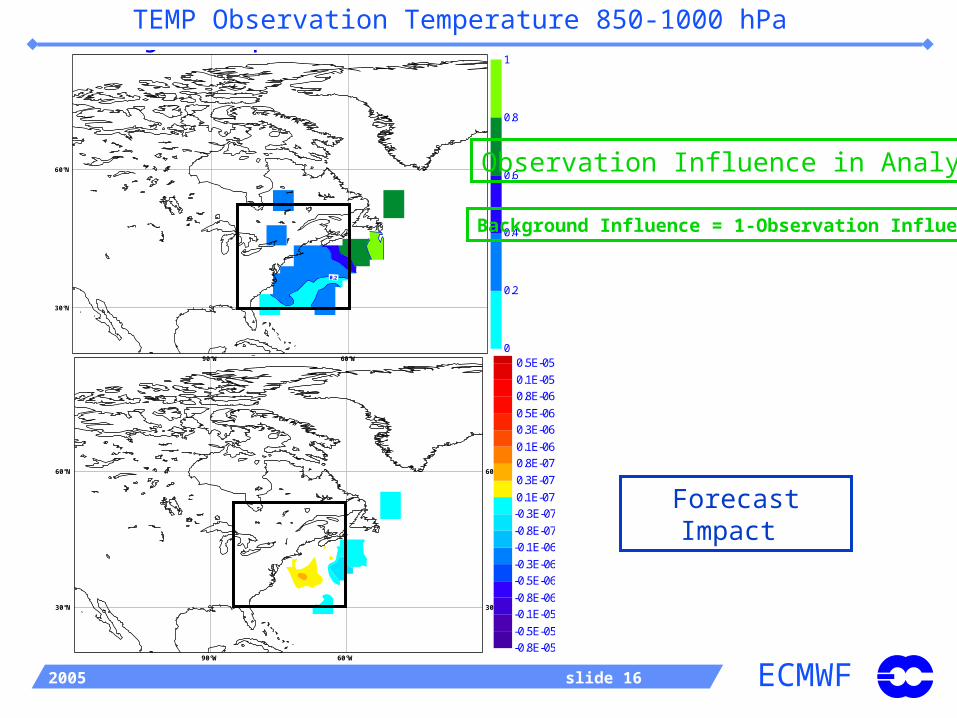
ECMWFTraining Course 2005 slide 16
TEMP Observation Temperature 850-1000 hPa
30°N 30°N
60°N60°N
90°W
90°W 60°W
60°Wek4d temp_t Level:900
-0.8E-05
-0.5E-05
-0.1E-05
-0.8E-06
-0.5E-06
-0.3E-06
-0.1E-06
-0.8E-07
-0.3E-07
0.1E-07
0.3E-07
0.8E-07
0.1E-06
0.3E-06
0.5E-06
0.8E-06
0.1E-05
0.5E-05
0.8E-05
0.2
30°N 30°N
60°N60°N
90°W
90°W 60°W
60°Wej4b temp_t Level:900
0
0.2
0.4
0.6
0.8
1
Forecast Impact
Observation Influence in Analysis
Background Influence = 1-Observation Influence
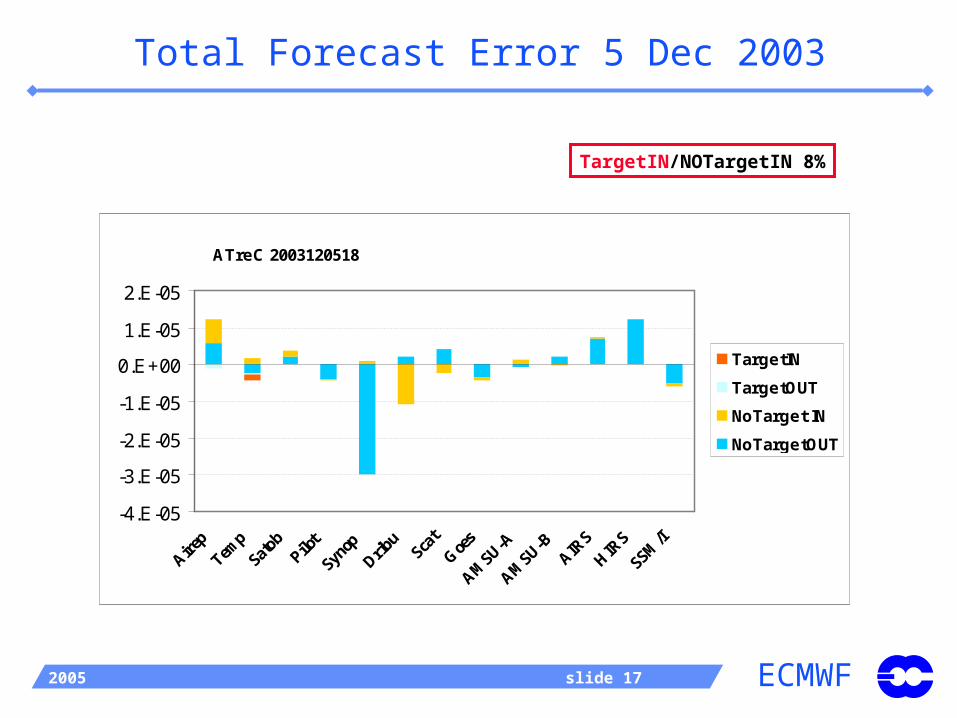
ECMWFTraining Course 2005 slide 17
Total Forecast Error 5 Dec 2003
TargetIN/NOTargetIN 8%
ATreC 2003120518
-4.E-05
-3.E-05
-2.E-05
-1.E-05
0.E+00
1.E-05
2.E-05
Airep
Temp
Satob
Pilot
SynopDrib
uSca
tG
oes
AMSU-A
AMSU-B
AIRS
HIR
S
SSM/I
TargetIN
TargetOUT
NoTarget IN
NoTargetOUT

ECMWFTraining Course 2005 slide 18
Observation Campaign 8 Dec 18 UTC---Verification 11 Dec 00 UTC
TargetIN/NOTargetIN %AMDAR 2.6SONDE 0.9
AtreC -71% MSLP Relative Fc Degradation -7% Total Energy
Targeting Lat(30,60)-Lon(-70,-15)Verification Lat(45,65)-Lon(-15,+10)
54h

ECMWFTraining Course 2005 slide 19
200-300 hPa Targeted Aircraft U Forecast Error
( )aJ y y Hx Jy
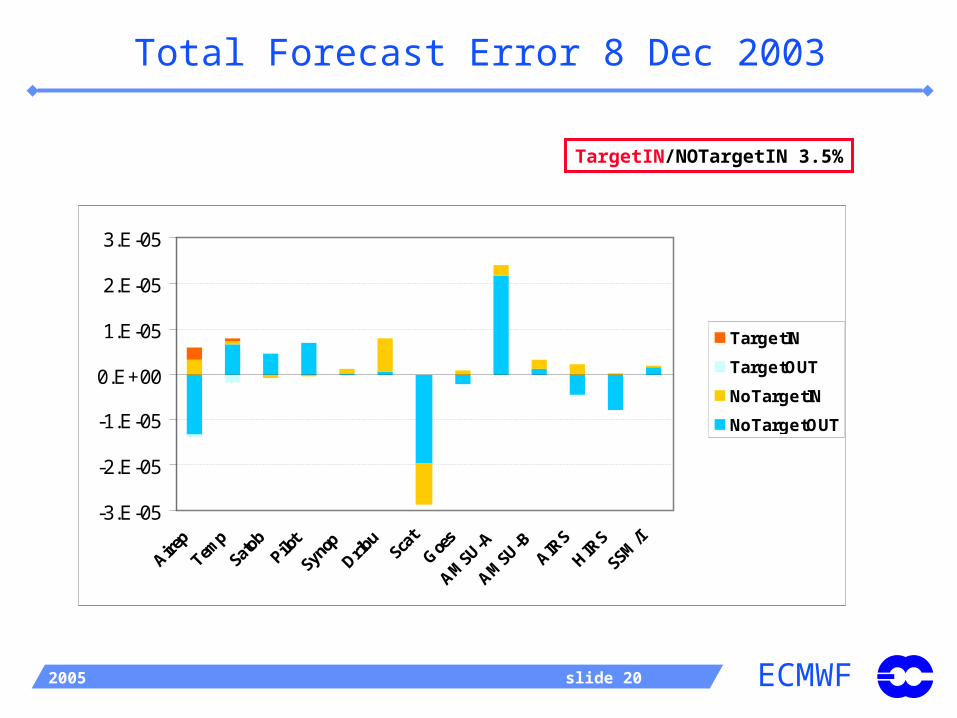
ECMWFTraining Course 2005 slide 20
Total Forecast Error 8 Dec 2003
TargetIN/NOTargetIN 3.5%
-3.E-05
-2.E-05
-1.E-05
0.E+00
1.E-05
2.E-05
3.E-05
Airep
Temp
Satob
Pilot
SynopDrib
uSca
tG
oes
AMSU-A
AMSU-B
AIRS
HIR
S
SSM/I
TargetIN
TargetOUT
NoTargetIN
NoTargetOUT

ECMWFTraining Course 2005 slide 21
Conclusions
Forecast sensitivity to observations has been computed for the campaigns showing an impact (ATreC-Cntr)/Cntr ≥ ± 10%
13 cases out of 38: 9 positive and 4 negative
Two campaigns have been shown
5 Dec at 18 UTC - Targeted observations improved the forecast of a cyclone moving along the east coast of North America for which severe weather impact was forecast
8 Dec at 18 UTC – Targeted observations deployed to clarify the models uncertainties for the remnants of the east cost storm, degraded the forecast over Northern Europe – UK
However, differences in forecast impact between ATreC and Cntr come also from the continuous assimilation cycling that provides different model trajectories
Forecast Impact computed for the cancelled campaigns gives on average ±10% in term of RMSE in the verification area

ECMWFTraining Course 2005 slide 22
END

ECMWFTraining Course 2005 slide 23
Singular vectors brief definition
Singular vectors was one of technique used in AtreC-TOST campaign to find sensitivity areas where releasing additional observations
Singular vectors (SVs) define perturbations with fastest growth during a finite time interval (optimization time interval). They are defined by:
The model characteristics: TL95L60, dry, with simplified physics
The norm used to measure growth: localized total energy
The optimization time interval: 42-54 hours
Diagnostic Singular vectors have been computed to investigate the observation impact in the forecast
time
Sensitivearea
Verificationarea

ECMWFTraining Course 2005 slide 24
Linear combination of 10 Diagnostic SVs
valid at observation time
AtreC observation time forecast step T1
localized total energymaximum in verification area
eigenvalues decompositionforecast error step T1
proj. fc error onto SVsBack to the observation time
Sensitivearea
Verificationarea
T1