economic impact of talbert house on · pdf filefiscal year 2010 economic impact of talbert...
TRANSCRIPT

ECONOMIC IMPACT OF TALBERT HOUSE ON
gREATER CINCINNATI
March 2012
www.economicsresearch.org
ABOUT THE ECONOMICS CENTER
The Economics Center, founded in 1977, is a leading provider of economic resources for educators, students, businesses, and public agencies. The Research and Consulting Division of the Economics Center provides the knowledge building blocks that help clients make better finance, policy and economic development decisions. Its dynamic approach and critical data analysis empower business and civic leaders to respond to changing economic conditions, strengthen local economies and improve the quality of life for their communities.

March 2012
Talbert House is one of Southwest Ohio’s largest non-profit organizations. We have grown out of a need to respond to community issues and to help our clients heal, recover, be accountable and in turn make our entire community a safer place.
Talbert House employs hundreds of dedicated staff who live and work in our service area and ultimately serve those children, adolescents, adults and families in need. It is not just about the number of individuals we impact. The Talbert House team continually makes a difference with its dedication and commitment to quality services. In order to measure our success we track data, engage in continuous quality improvement and submit our programs for external review and audits.
We engaged the University of Cincinnati’s Economics Center as another way to measure our impact in the region. This report is about the numbers from the 2010 fiscal year. It is a way for us to determine our economic impact as an employer and provider of services. We will use this report to inform funders, stakeholders and the community as well as to benchmark our progress in the future. This report is an important step in measuring and improving our contribution to the community.
Neil F. Tilow President / CEO

www.economicsresearch.org
Talbert House has an $115.2 million total impact on Greater Cincinnati.
ECONOMIC IMPACT
Payments to local suppliers of goods and services. These payments generate: New local spending from their suppliers and employee payroll, and
Spending outside the area which has no local economic impact
Employee payroll which generates: Household spending on purchases of goods and services, and
Household spending outside the area, which has no local economic impact
Talbert House fiscal year 2010 expenditures are analyzed in two ways:
The economic impacts attributable to Talbert House come directly from its own spending and indirectly from how local businesses and households spend the money they receive from Talbert House.1
The total impact of the organization is 2.18 times as large as its direct expenditures.
1 2

Talbert House contributes directly to the local
economy through its employment and spending.
DIRECT IMPACT
814 JobsOutside of government agencies, Talbert House is the largest employer in the social services industry sector in Southwest Ohio.
97 percent of Talbert House employees work within its four primary program areas: Residential Programs Non-Residential Programs Jail-Based Programs Centerpoint Health
$52,954,800 Total Expenditures in 2010. 2
PURCHASES OF GOODS AND SERVICES $20,455,200 PERSONNEL WAGES AND SALARIES OF EMPLOYEES $32,499,600
Employee payroll which generates: Household spending on purchases of goods and services, and
Household spending outside the area, which has no local economic impact
First Talbert House building in Cincinnati, 1965.

www.economicsresearch.org
$17,743,700$12,699,000 $3,411,400
$14,039,800$4,388,300
$672,700
$ 52,954,800$62,245,700
$ 115,200,500
Talbert House spends $53.0 million on its operations generating an additional $62.2 million in economic
activity within Greater Cincinnati.3
.
INDIRECT IMPACT
As Talbert House and its employees spend dollars on local goods and services, the suppliers of these goods and services create an additional impact by hiring new employees and purchasing supplies from local businesses.
Residential Programs Non-Residential ProgramsJail-Based Programs Centerpoint HealthCentral ServicesCapital Expenditures
Total Talbert House OperationsIndirect impact of Talbert expendituresTotal Economic Impact
Fiscal Year 2010 Economic Impact of Talbert House 4
Talbert House Board of Trustees

Seven industry sectors benefit the most from Talbert House.
INDUSTRY
$10,381,300$7,654,500$6,888,000$5,282,600$4,439,400$4,107,400$3,924,000
$42,677,200$19,568,500
$62,245,700
About 70 percent of the indirect economic impact affects seven industry sectors. The following table shows economic activity produced in each of these major sectors.
Real estate and rental and leasingManufacturingFinance and insuranceHealth care and social assistanceProfessional, scientific, and technical servicesRetail tradeAdministrative and waste management services
Sub-Totalother industry sectorsTotal Indirect Impact
Fiscal Year 2010 Indirect Economic Impact by Industry
16.7%12.3%11.1%
8.5%7.1%6.6%6.3%
68.6% 31.4%100%
Talbert House Client Family

www.economicsresearch.org
Talbert House accounts for nearly 1,400 jobs, directly or indirectly.
EMPLOYMENT
305217
59211
22
814584
1,398
In Fiscal Year 2010, Talbert House employed 814 individuals (97 percent of them in its four major program areas), with an annual payroll of $32.5 million. It is twenty-five times the average size of other entities in this industry.
Talbert House expenditures generate additional jobs and wages, resulting in an overall impact of $35.8 million in household income, and 584 additional jobs in the Cincinnati region.
Residential Programs Non-Residential ProgramsJail-Based Programs Centerpoint Health Central Services
Direct Jobs Sub-Total Jobs created from indirect impacts Total Employment Impact
Fiscal Year 2010 Total Employment Impact
$32,499,600$18,661,000
$51,160,600
Payroll and Benefits (direct impact)Indirect impactOverall Impact on Household Income
Fiscal Year 2010 Household Income Impact
Talbert House Fatherhood Project graduates
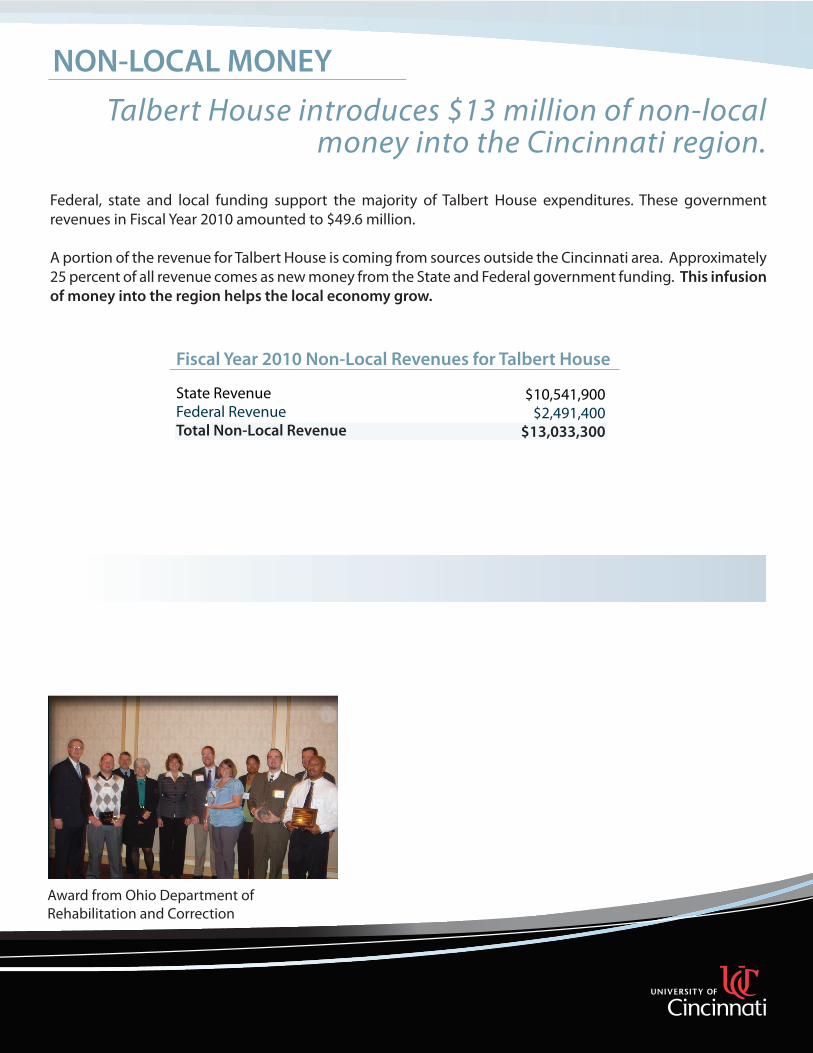
Talbert House introduces $13 million of non-local money into the Cincinnati region.
NON-LOCAL MONEY
$10,541,900$2,491,400
$13,033,300
Federal, state and local funding support the majority of Talbert House expenditures. These government revenues in Fiscal Year 2010 amounted to $49.6 million.
A portion of the revenue for Talbert House is coming from sources outside the Cincinnati area. Approximately 25 percent of all revenue comes as new money from the State and Federal government funding. This infusion of money into the region helps the local economy grow.
State RevenueFederal RevenueTotal Non-Local Revenue
Fiscal Year 2010 Non-Local Revenues for Talbert House
Award from Ohio Department of Rehabilitation and Correction
www.economicsresearch.org
METHODOLOGY AND APPROACH
This study employs data from Talbert House on revenues and expenditures to assess the impacts on the local economy. This information is combined with other data in an input-output model. Input-output modeling is a tool for measuring how spending by one business affects the larger economy. This analysis used the Regional Input-Output Modeling System (RIMS II) multipliers for the Cincinnati Metropolitan Statistical Area (MSA). The input-output multipliers are calculated and maintained by the U.S. Commerce Department’s Bureau for Economic Analysis and are available for a number of industries and various geographic areas. This study focuses on the Cincinnati MSA.3
The RIMS II multipliers estimate how expenditures and changes in demand for one industry affect the overall economy in an area (e.g., employment, goods and services, value added, and gross output). In the case of Talbert House, the average multiplier for the industries most relevant to Talbert House was 2.18, meaning that one dollar invested in Talbert House increased economic activity by $2.18.
This multiplier is comprised of two components: the direct impact and the indirect impact. Talbert House’s direct impact consists of its purchases of goods and services, capital expenditures, and personnel payments from within the Cincinnati Region.
The indirect impact occurs when Talbert House suppliers and employees increase their expenditures. For example, when Talbert House hires a cleaning service, that service will purchase more cleaning materials and hire more people. When Talbert House and its suppliers pay wages to employees, those people increase their household expenditures. All of this adds to the economic activity of the area.
When the direct and indirect economic impacts increase, employers must hire additional employees or increase the pay of existing workers (who are working more hours) leading to more spending in the region by these households.5 These direct and indirect economic activities also generate tax revenues for local jurisdictions. In the case of Talbert House, these are principally income and sales tax revenues for the City of Cincinnati and Hamilton County.
To help explain economic growth and development, economists differentiate types of businesses or industries according to who purchases their products. When sales to local customers are important, they don’t attract money from outside the area and don’t constitute new spending in the area. When businesses sell their goods or services to non-local customers (in the case of Talbert House, by receiving state and federal funding), this attracts new money into the area and increases the size of the local economy.6
As noted in the report, about 25 percent of the total revenue comes as outside money from the State and Federal governments. This cash flow into the region (i.e., new money) replenishes the local economy and helps the local economy grow. Because this money can be spent and re-spent within the region, the gross economic impact of the outside funds is greater than if Talbert House was funded solely by local entities.

1 Purchases of local resources (labor, goods and services) to produce services are direct impacts. Indirect impacts are the purchases made by local businesses that supply the Talbert House in order to produce the goods and services they supply. Induced impacts are the wage payments made by those local businesses that supply goods and services to the organization.
2 These expenditures, and the resulting impact calculations, include Centerpoint Health because it will be merging with Talbert House in FY2013. Currently, Centerpoint Health is a separate not-for-profit entity, serving as a subcontractor to Talbert House, which serves as the funding channel for nearly all of Centerpoint Health’s revenues.
3 In assessing the economic impact of Talbert House, the study area referred to as Greater Cincinnati is the 15-county Cincinnati Metropolitan Statistical Area (MSA) as defined by the Bureau of the Census. It is a 15-county region including Hamilton, Butler, Warren, Clermont, and Brown Counties in southwestern Ohio; Boone, Kenton, Campbell, Gallatin, Grant, Pendleton, and Bracken Counties in northern Kentucky; and Franklin, Dearborn, and Ohio Counties in southeastern Indiana.
4 Purchases of local resources (labor, goods and services) to produce Talbert House services are direct impacts. Indirect impacts are the purchases made by local businesses that supply the Talbert House in order to produce the goods and services they supply. Induced impacts, which are included in the indirect impacts, are the wage payments made by those local businesses that supply goods and services to the organization.
5 Robey, James E. and Jack Kleinhenz. “Economic Impact of the Cleveland Museum of Art: A Tourism Perspective.” Greater Cleveland Growth Association 2000. http://www.clemusart.com/downloads/impact.pdf.
6 Andrew C. Krikelas, “Why Regions Grow: A Review of Research On the Economic-Base Model” Economic Review, Federal Reserve Bank of Atlanta, July/August 1992, pp. 16-29.
endnotes

90 West DanielsCincinnati, OH 45221-0023www.economicsresearch.org