eda: tasks, tools, principles
TRANSCRIPT

1
EDA: Tasks, Tools, Principles
Natalia Andrienko & Gennady AndrienkoFraunhofer Institute AISSankt AugustinGermanyhttp://www.ais.fraunhofer.de/and
Potsdam, 27.09.2005
Presentation PlanIntroduction – What is EDA?– Examples of tools for EDA (demo)– Our ambitions
Our theory of EDA– General structure of data– Tasks– Principles– Top-down and bottom-up processes in EDA
Conclusion– The theory for a dual use– Open issues

2
Exploratory Data Analysis (EDA) and Evolution of Statistics
time
exploration
confirmation
Emergence of computational
methods
Emergence of the concept of EDA
(Tukey 1977)early
exploratorystatistics
confirmatorystatistics
contemporarystatistics
Tukey saw EDA as a return to the original goals of statistics, i.e. detecting and describing patterns, trends, and relationships in data and generation of hypotheses.
Data mining
EDA and Visualization
The greatest value of a picture is when it forces
us to notice what we never expected to see.
John W. Tukey
…by its very nature the main role of EDA is to open-mindedly explore, and graphics gives the analysts unparalleled power to do so…
NIST/SEMATECH e-Handbook of Statistical Methods
3
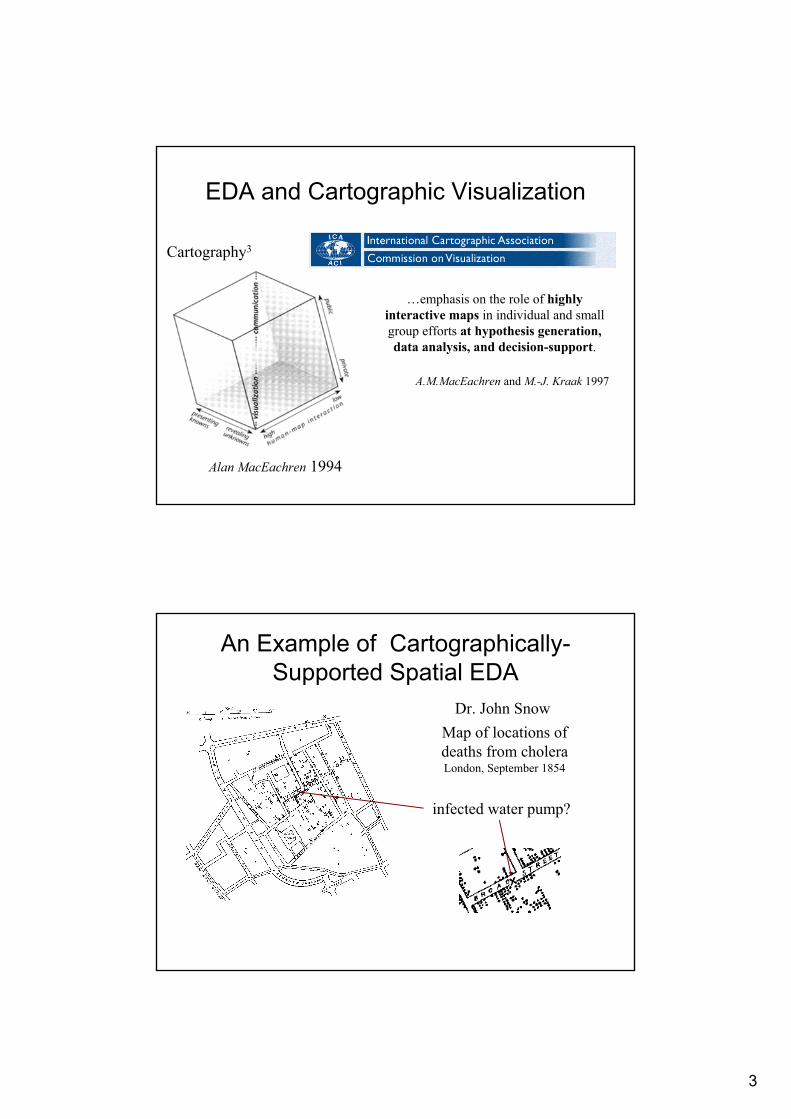
EDA and Cartographic Visualization
Alan MacEachren 1994
Cartography3
…emphasis on the role of highly interactive maps in individual and small group efforts at hypothesis generation, data analysis, and decision-support.
A.M.MacEachren and M.-J. Kraak 1997
An Example of Cartographically-Supported Spatial EDA
Dr. John SnowMap of locations of deaths from choleraLondon, September 1854
infected water pump?

4
Current EDA ToolsInformation visualisation software such as Dynamic Query, TreeMap, and TimeSearcherfrom HCIL, Univ. Maryland (Ben Shneiderman)Geovisualisation tools such as GeoVistaStudio(Penn State Univ.) and Descartes/CommonGIS(Fraunhofer Institute AIS)Graphical statistics tools, for example, Manetand Mondrian (Augsburg Univ.)
Usually such systems are research prototypes that implement innovative ideas but provide restricted functionality and limited user support
Examples of tools for EDA (demo)
…t1 t2 t3

5
Research ProblemsHow do we (tool designers) know what tools are needed? (i.e. what capabilities should be provided)What are the best ways to combine several tools providing complementary capabilities?How can we teach the users when and how to apply what tools?
We have a practical experience from many cases of choosing or designing tools to analyse various datasets given to us.
We have also experience in demonstrating users how to analyse their data
And now we want to generalise our experiences and to turn the practice into a theory
EDA: from Practice to Theory
DataTasksToolsPrinciples
to appear ≈ end 2005

6
EDA: Our TheoryData– A general model of data: f : R → C (a mapping from references
to characteristics)Tasks– A general model of task: target + constraints– Task levels: elementary (individual references and
characteristics) and synoptic (sets of references and behavioursof characteristics)
Tools– Tool catalogue: visualisation, display manipulation, data
manipulation, querying, computation– Modes and mechanisms for tool combination
Principles– To guide tool developers in tool/system design– To guide data analysts in choosing and using the tools
The Task-Centred Approach• EDA consists of tasks, i.e. finding answers to various
questions about data. • To find the answers, an analyst needs appropriate tools.• To create appropriate tools, a designer must know the
tasks.− The variety of possible tasks typically requires combining several
tools.• An analyst needs understanding what tools to choose for
what tasks.• We want to describe the tasks of EDA in a general and
comprehensive way.− The tasks serve as a basis for establishing the principles.
7
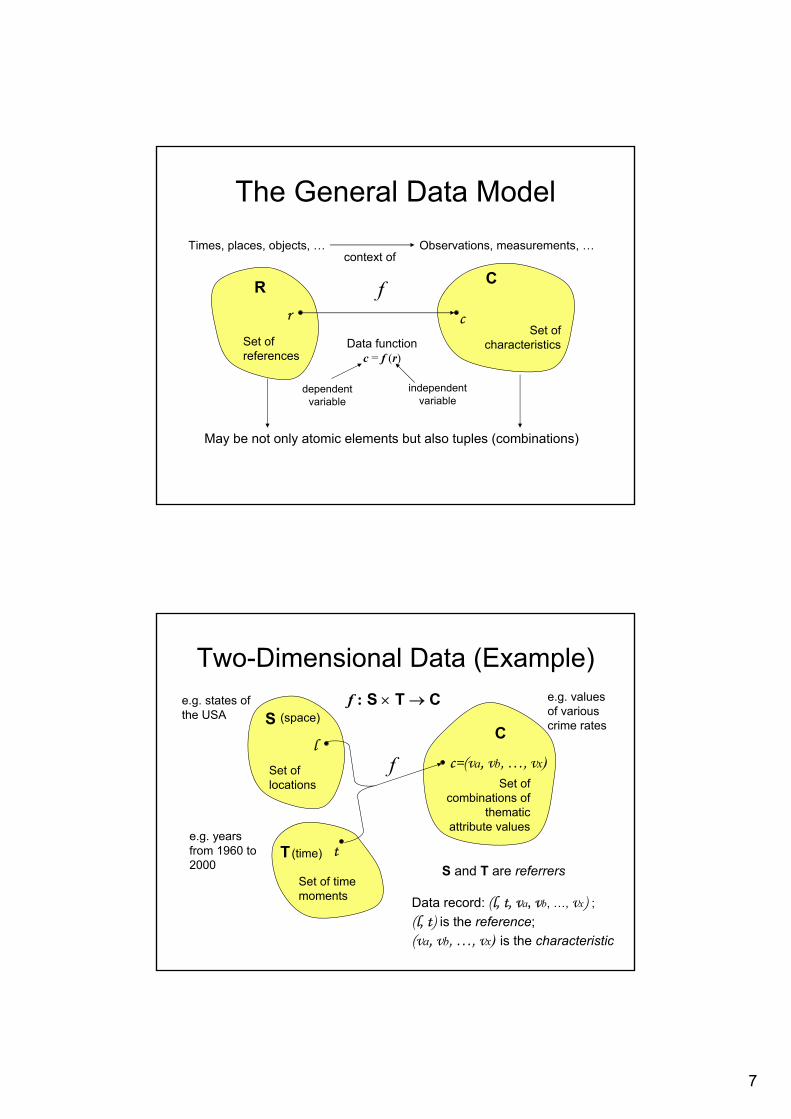
The General Data Model
R
Set of references
r
Times, places, objects, …
C
Set of characteristics
c
Observations, measurements, …context of
f
May be not only atomic elements but also tuples (combinations)
Data function c = f (r)
dependent variable
independent variable
Two-Dimensional Data (Example)
S
T
C
f : S × T → C
Set of locations
Set of time moments
Set of combinations of
thematic attribute values
l
t
c=(va, vb, …, vx)
Data record: (l, t, va, vb, …, vx) ;(l, t) is the reference; (va, vb, …, vx) is the characteristic
f
(space)
(time)
e.g. states of the USA
e.g. years from 1960 to 2000
e.g. values of various crime rates
S and T are referrers

8
Elementary TasksR
r
C
?
f
R C
cf
?
targets
Lookup (direct, inverse)
constraints
R Cfr 1
r 2?
R Cf
?c1
c2
Comparison (direct, inverse)
targets: relations
?
?
?
?
Support of Lookup TasksR
r
C
?
f Tool: allows the user to specify or locate r ; shows or allows the user to determine c
R C
cf
?
Tool: allows the user to specify c ; shows or allows the user to locate r
Query tools

9
Support of Comparison TasksShow the
kind of relation
Measure the relation: difference between numeric values, distance in space, distance in time, …
Compute combined distances in terms of multiple components
Display manipulation
Data manipulation
Elementary Tasks (Summary)
Relatively easy to doWell supported by tools: querying, display manipulation (e.g. visual comparison), data manipulation (e.g. computing differences, changes, multi-dimensional distances…)
− But play only a subordinate role in EDA
10
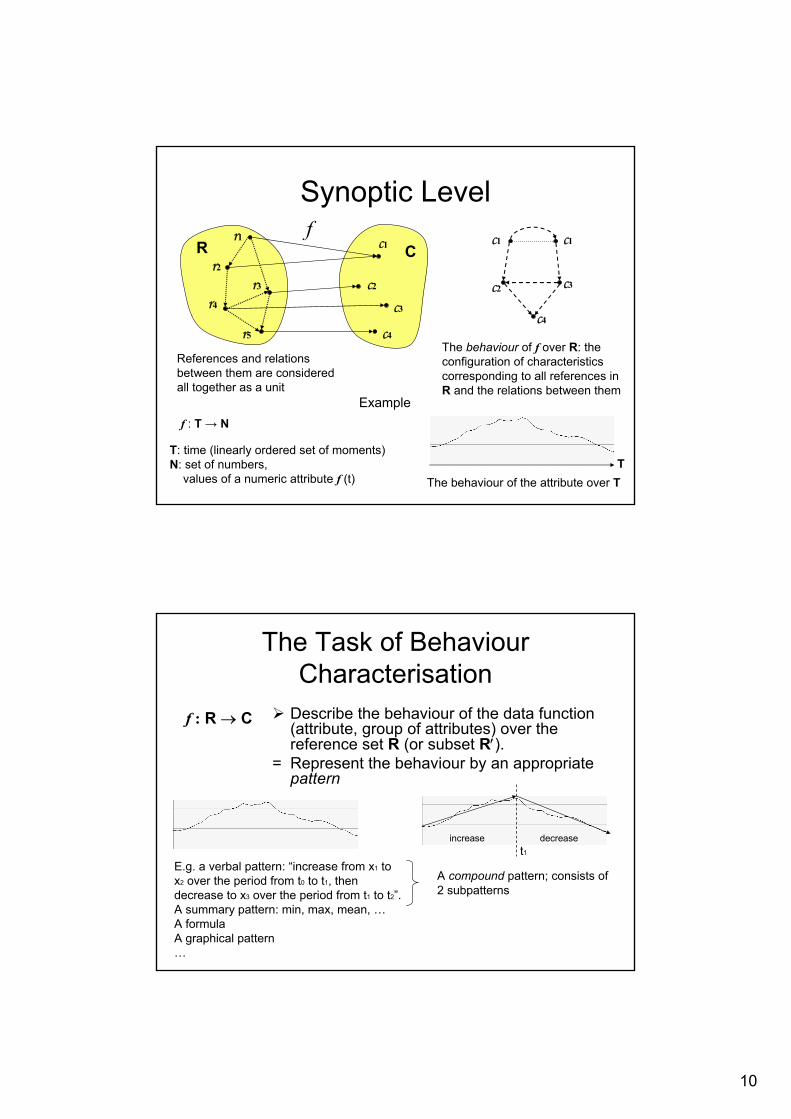
Synoptic Level
R
r3
Cc1f
r2
r4
r5
r1
c2
c3
c4
c1
c2
c1
c3
c4
References and relations between them are considered all together as a unit
The behaviour of f over R: the configuration of characteristics corresponding to all references in R and the relations between them
Examplef : T → N
T: time (linearly ordered set of moments)N: set of numbers,
values of a numeric attribute f (t)T
The behaviour of the attribute over T
The Task of Behaviour Characterisation
Describe the behaviour of the data function (attribute, group of attributes) over the reference set R (or subset R′).
= Represent the behaviour by an appropriate pattern
f : R → C
E.g. a verbal pattern: “increase from x1 to x2 over the period from t0 to t1, then decrease to x3 over the period from t1 to t2”.A summary pattern: min, max, mean, …A formulaA graphical pattern…
t1
increase decrease
A compound pattern; consists of 2 subpatterns

11
Other Synoptic TasksBehaviour (pattern) search: – find the subset(s) of the reference set where a given behaviour
(specified by a pattern) takes place, e.g. find the intervals ofvalue increase
Behaviour comparison:– Determine the kind of (same, different, opposite) and
characterise and/or measure the relation between behaviours• Of one function (attribute, attribute group) over two or more
reference subsets• Of two or more functions over the same reference (sub)set• Of two or more functions over different reference subsets
t1t0 t2
E.g. the behaviour over [t1, t2] is opposite to the behaviour over [t0, t1] and the change is about 1.5 times faster
The Primary Task of EDA
Characterise the behaviour of the data function over the entire reference set⇒The tool to support: 1) allows the user to see the
entire reference set and all the corresponding characteristics; 2) represents the characteristics so that they perceptually coalesce into a single unit
– Principle “See the Whole”; 2 aspects: completeness and unification
E.g. a good representation: all characteristics are represented by a single line, which is perceived as a unit
But… such a representation is seldom achievable

12
Data Complexities
Multi-dimensionality (more than one referrer)Multiple attributesLarge data volume (number of references in the reference set)Complex, heterogeneous nature of referrers (e.g. geographical space)Outliers, discontinuities, …
Example: Behaviour over a Two-Dimensional Reference Set
Referrers
Space (set of states of the USA)
Time (set of years from 1960 to 2000)
Attributes
• Property crime rate• Violent crime rate• …
The behaviour cannot be represented as a single unit

13
Slices of the Behaviour
t
Space as a whole
Specific time
Specific place
Time as a whole
Spatial behaviour(value distribution over the space)
Temporal behaviour(value variation over the time)
Synoptic with regard to space but elementary
with regard to time
Synoptic with regard to time but elementary with regard to space
Aspectual Behaviours
…
Aspect 1:Temporal variation of the spatial behaviour
t1 t2 t3
Aspect 2:Spatial variation of the temporal behaviour
Completeness: both aspects must be characterisedUnification: not achieved
Tasks: behaviour characterisation
(aspectual behaviours)

14
Principle: Simplify and AbstractThe temporal behaviour over the whole area can be overviewed.However, the properties of the spatial referrer are ignored.Task: behaviour
characterisation (overall behaviour, highly
aggregated)
Principle: Divide and Group
Complementary principle: See in Relation
Division of the spatial referrer into subsets of locations (states)
Tasks: behaviour characterisation
(subsets of references), behaviour comparison

15
Divide and Group (cont.)1960-1979 1987-20001980-1986
Division of the temporal referrer into intervals (continuous subsets of the whole time)
Tasks: behaviour characterisation
(subsets of references), behaviour comparison
Principle: Establish Linkages
Transition period
Tasks: behaviour characterisation
(subsets of references), behaviour comparison

16
Principle: Look for Recognisable
Task: behaviour (pattern) search
Principle: Attend to ParticularsExtreme values
Extreme changes
Extreme years (extremely many high values)
Tasks: pattern search (“local” features),
elementary lookup and comparison

17
EDA: Analysis and Synthesis
Overall behaviour
Partial behaviours
Partial patterns
Overall pattern
Analyse Synthesise
Characterise
(initial task)
Characterise
See the whole;Simplify and abstract
Divide and group;Look for recognisable;See in relation;Attend to particulars
Zoom and focus;See in relation;
Attend to particulars
Establish linkages;See in relation
Conclusion
Dual use of the theory– Guidance for data analysts (tool users)– Guidance for tool designers
Open issues– Human factors– Tool deficiencies

18
Guidance for Data Analysts Data
Data structure
Exploratory tasks
Tool selection and
application
Principles
Observations, findings, conclusions, decisions
Principles
Open Issues (Human Factors)• Lack of knowledge of the EDA concept• Unconventional tools and approaches • Complexity of the EDA process: many tasks, complex
data ⇒ many different tools ⇒ difficult to master, to choose, and to combine
• Primacy of graphical techniques ⇒ main results are perceptual impressions ⇒ hard to capture, represent, and communicate– How to report about the work done?
• The results have the flavour of subjectivity and do not produce a solid impression (unlike e.g. results from using statistical methods)– “Serious” analysts are reluctant to use the EDA techniques
• Inexperienced users may jump to conclusions on the basis of just a single (default) visualisation instead of performing systematic, comprehensive EDA

19
Guidance for tool designersData
Data structure
Potential tasks
Tool requirements
Assessment of existing
tools
Combining existing tools and inventing
new ones
Principles
General Requirements to EDA Software
• Space- and time-awareness• Work with multidimensional data• Work with uncertain and incomplete data• Scalability• Support and encouraging of multiple complementary
views• Easy tool linking and coordination• Support of different levels of analysis, from “see the
whole” to “attend to particulars”• Support of the whole chain: exploration and hypothesis
generation, computational analysis and hypothesis testing, presentation of findings and conclusions

20
Open Issues (Tools)Work with qualitative (non-numeric) dataWork with fuzzy, uncertain, and incomplete dataContinue scalability effortsEmbedded intelligence:• Know the principles and prompt the users to fulfil them• Know the tools and assist the users in choosing and utilising them • Relieve the users from the cognitive complexity of the EDA process • Adapt to user, data, tasks, and hardware
Support in the capture and management of observations: recording, structuring, browsing, searching, checking, linking, interpreting…Link to confirmatory methods (hypotheses testing)Help in presentation and communication of observations, discoveries, conclusions, and decisions