edelman - uk general election research 2015
TRANSCRIPT
EDELMAN - UK ELECTION CAMPAIGN
RESEARCH6 MAY 2015
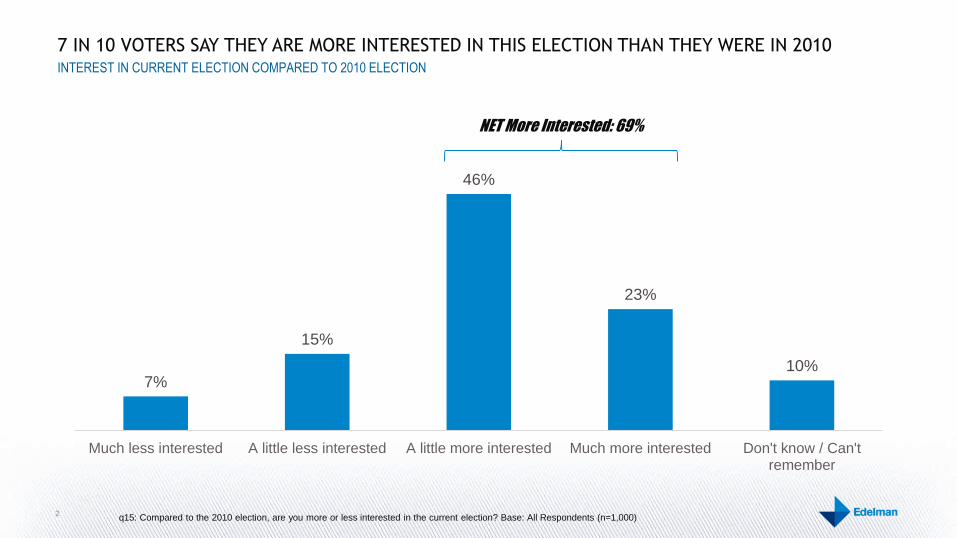
7 IN 10 VOTERS SAY THEY ARE MORE INTERESTED IN THIS ELECTION THAN THEY WERE IN 2010
2
INTEREST IN CURRENT ELECTION COMPARED TO 2010 ELECTION
q15: Compared to the 2010 election, are you more or less interested in the current election? Base: All Respondents (n=1,000)
7%
15%
46%
23%
10%
Much less interested A little less interested A little more interested Much more interested Don't know / Can'tremember
NET More Interested: 69%
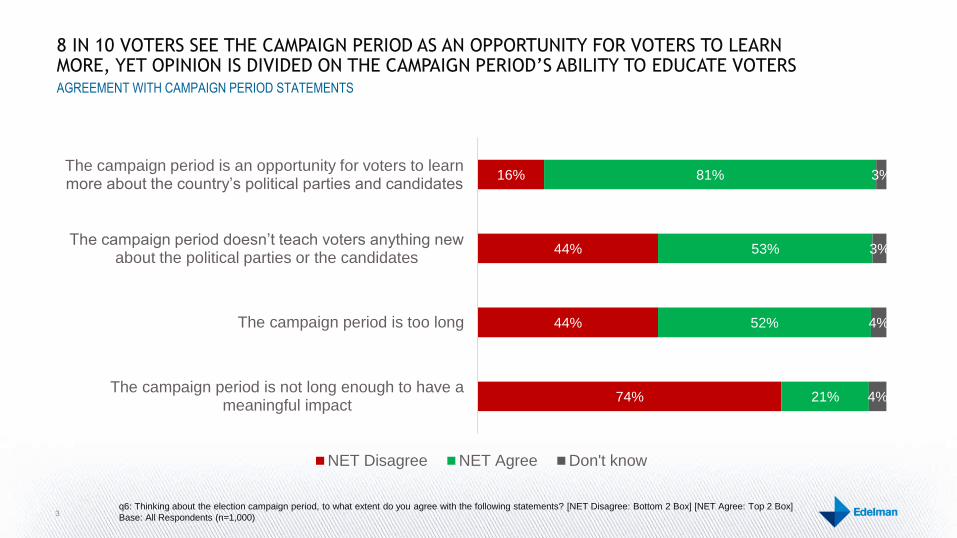
8 IN 10 VOTERS SEE THE CAMPAIGN PERIOD AS AN OPPORTUNITY FOR VOTERS TO LEARN MORE, YET OPINION IS DIVIDED ON THE CAMPAIGN PERIOD’S ABILITY TO EDUCATE VOTERS
3
AGREEMENT WITH CAMPAIGN PERIOD STATEMENTS
q6: Thinking about the election campaign period, to what extent do you agree with the following statements? [NET Disagree: Bottom 2 Box] [NET Agree: Top 2 Box]
Base: All Respondents (n=1,000)
16%
44%
44%
74%
81%
53%
52%
21%
3%
3%
4%
4%
The campaign period is an opportunity for voters to learn more about the country’s political parties and candidates
The campaign period doesn’t teach voters anything new about the political parties or the candidates
The campaign period is too long
The campaign period is not long enough to have ameaningful impact
NET Disagree NET Agree Don't know
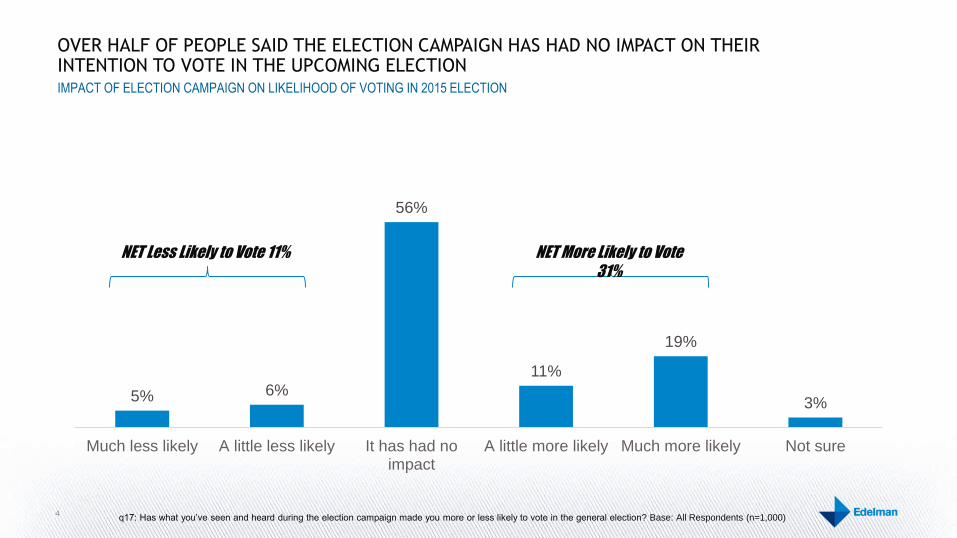
OVER HALF OF PEOPLE SAID THE ELECTION CAMPAIGN HAS HAD NO IMPACT ON THEIR INTENTION TO VOTE IN THE UPCOMING ELECTION
4
IMPACT OF ELECTION CAMPAIGN ON LIKELIHOOD OF VOTING IN 2015 ELECTION
q17: Has what you’ve seen and heard during the election campaign made you more or less likely to vote in the general election? Base: All Respondents (n=1,000)
5% 6%
56%
11%
19%
3%
Much less likely A little less likely It has had noimpact
A little more likely Much more likely Not sure
NET More Likely to Vote
31%
NET Less Likely to Vote 11%

VOTERS ARE LOOKING FOR LESS NOISE FROM CELEBRITIES AND BOOKIES, AND MORE INFORMATION FROM POLITICAL LEADERS AND BUSINESS LEADERS
5
VOICES VOTERS WANT TO HEAR LESS AND MORE OF DURING THE ELECTION CAMPAIGN
53%
35%
34%
23%
20%
19%
16%
15%
11%
7%
5%
7%
16%
13%
21%
30%
15%
8%
Celebrities
Bookies
Religious groups
Trade unions
Columnists/journalists
Business leaders
Political leaders
Pollsters
NGOs
Hear less from… Hear more from…
q20: Which of these voices do you want to hear more of during the election campaign? Base: All Respondents (n=1,000)
q21: Which of these voices do you want to hear less of during the election campaign? Base: All Respondents (n=1,000)
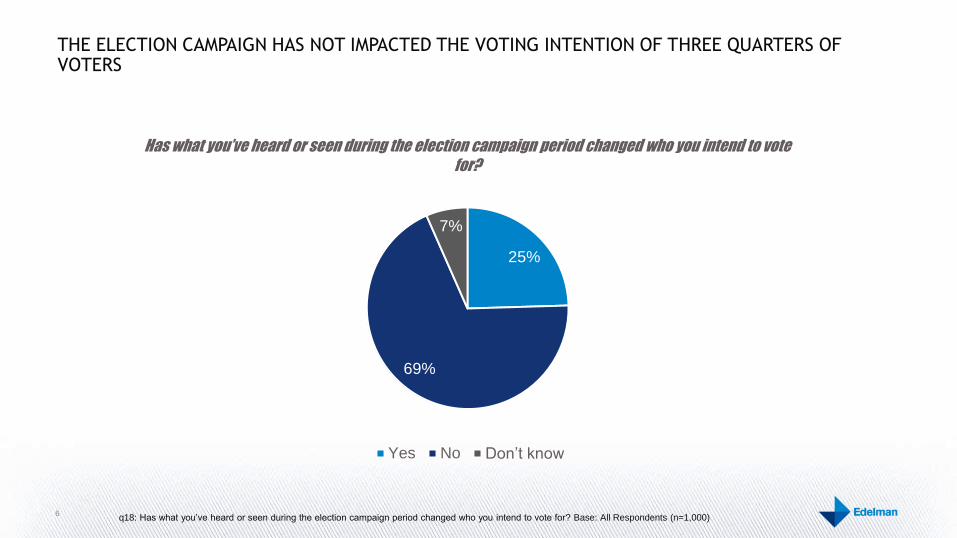
THE ELECTION CAMPAIGN HAS NOT IMPACTED THE VOTING INTENTION OF THREE QUARTERS OF VOTERS
6q18: Has what you’ve heard or seen during the election campaign period changed who you intend to vote for? Base: All Respondents (n=1,000)
25%
69%
7%
Has what you’ve heard or seen during the election campaign period changed who you intend to vote
for?
Yes No Don’t know

HOWEVER VOTERS ACKNOWLEDGE THAT NEGATIVE MESSAGES HAVE PUT NEARLY HALF OFF A POLITICAL LEADER OR PARTY
7
IMPACT OF NEGATIVE CAMPAIGNING ON VOTING FOR POLITICAL LEADER OR PARTY
q19: During this election campaign period, have you heard anything negative that has put you off voting for a political party or leader? Base: All Respondents
(n=1,000)
45%
48%
7%
A Leader
Yes No Don't know
45%
48%
7%
A Party
Yes No Don't know

TELEVISION NEWS IS SEEN AS MOST INFORMATIVE AND MOST TRUSTWORTHY BY VOTERS DURING THE ELECTION CAMPAIGN
8
MOST INFORMATIVE AND MOST TRUSTWORTHY SOURCES OF INFORMATION DURING ELECTION CAMPAIGN
76%
63%
54%
37%
36%
30%
28%
19%
18%
65%
59%
39%
47%
26%
24%
23%
19%
17%
Television news
Online news
Newspapers
Radio stations
Leaflets/flyers from political parties
Social media
Political parties’ websites
Email from political parties
BlogsInformative Trustworthy
q8: How informative did you find each of the following sources of information during this election campaign period? [Top 2 Box Informative] Base: All Respondents
(n=1,000)
q9: And how trustworthy did you find each of the following sources of information during this election campaign period? [Top 2 Box Trustworthy] Base: All Respondents
(n=1,000)

NEARLY A QUARTER OF VOTERS SAY THAT TELEVISION NEWS HAS CHANGED THEIR VOTING INTENTION
9
SOURCES WHICH HAVE CHANGED VOTING INTENTION DURING THE ELECTION CAMPAIGN
22%
17%
15%
13%
13%
12%
11%
8%
7%
Television news
Online news
Newspapers
Social media
Leaflets/flyers from political parties
Radio stations
Political parties’ websites
Blogs
Email from political parties
q10: Have any of the following sources of information changed the way you intend to vote in this election? Base: All Respondents (n=1,000)

BUT SOCIAL MEDIA IS EXERTING INCREASING INFLUENCE: 1 IN 3 UK VOTERS (32%) FOLLOWS A POLITICAL PARTY OR LEADER ON SOCIAL MEDIA
10
SOCIAL NETWORKS MOST USED BY VOTERS TO FOLLOW PARTIES OR LEADERS
q12: Which, if any, of the following social media networks do you use to follow political parties and/or leaders? Base: All Respondents (n=1,000)
24%
15%
11%
8%
3%
NB: Excludes “Something else” and “None of these” responses
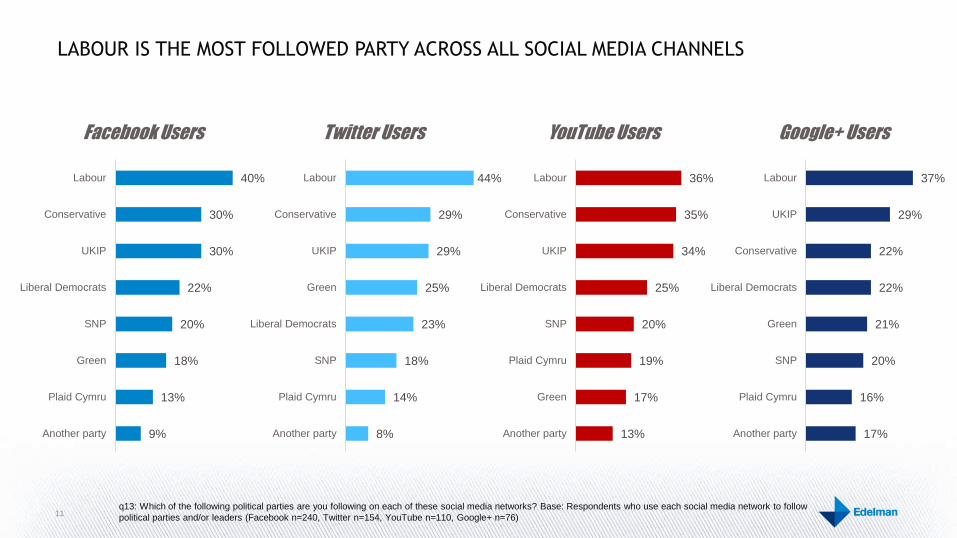
LABOUR IS THE MOST FOLLOWED PARTY ACROSS ALL SOCIAL MEDIA CHANNELS
11q13: Which of the following political parties are you following on each of these social media networks? Base: Respondents who use each social media network to follow
political parties and/or leaders (Facebook n=240, Twitter n=154, YouTube n=110, Google+ n=76)
40%
30%
30%
22%
20%
18%
13%
9%
Labour
Conservative
UKIP
Liberal Democrats
SNP
Green
Plaid Cymru
Another party
Facebook Users
44%
29%
29%
25%
23%
18%
14%
8%
Labour
Conservative
UKIP
Green
Liberal Democrats
SNP
Plaid Cymru
Another party
Twitter Users
36%
35%
34%
25%
20%
19%
17%
13%
Labour
Conservative
UKIP
Liberal Democrats
SNP
Plaid Cymru
Green
Another party
YouTube Users
37%
29%
22%
22%
21%
20%
16%
17%
Labour
UKIP
Conservative
Liberal Democrats
Green
SNP
Plaid Cymru
Another party
Google+ Users

WHILE MILIBAND, CAMERON, AND FARAGE COMPETE FOR THE GREATEST SOCIAL MEDIA ATTENTION
12q14: And which of the following political leaders are you following on each of these social media networks? Base: Respondents who use each social media network to
follow political parties and/or leaders (Facebook n=240, Twitter n=154, YouTube n=110, Google+ n=76)
31%
24%
23%
20%
18%
17%
14%
14%
Ed Miliband
Nigel Farage
David Cameron
Boris Johnson
Nick Clegg
Nicola Sturgeon
Leanne Wood
Natalie Bennett
Facebook Users
34%
33%
28%
24%
23%
23%
19%
14%
Ed Miliband
David Cameron
Nigel Farage
Boris Johnson
Nick Clegg
Nicola Sturgeon
Natalie Bennett
Leanne Wood
Twitter Users
35%
33%
31%
25%
22%
20%
19%
14%
David Cameron
Nigel Farage
Ed Miliband
Nick Clegg
Nicola Sturgeon
Natalie Bennett
Boris Johnson
Leanne Wood
YouTube Users
34%
30%
30%
26%
24%
24%
22%
17%
Nigel Farage
David Cameron
Ed Miliband
Nick Clegg
Nicola Sturgeon
Leanne Wood
Boris Johnson
Natalie Bennett
Google+ Users
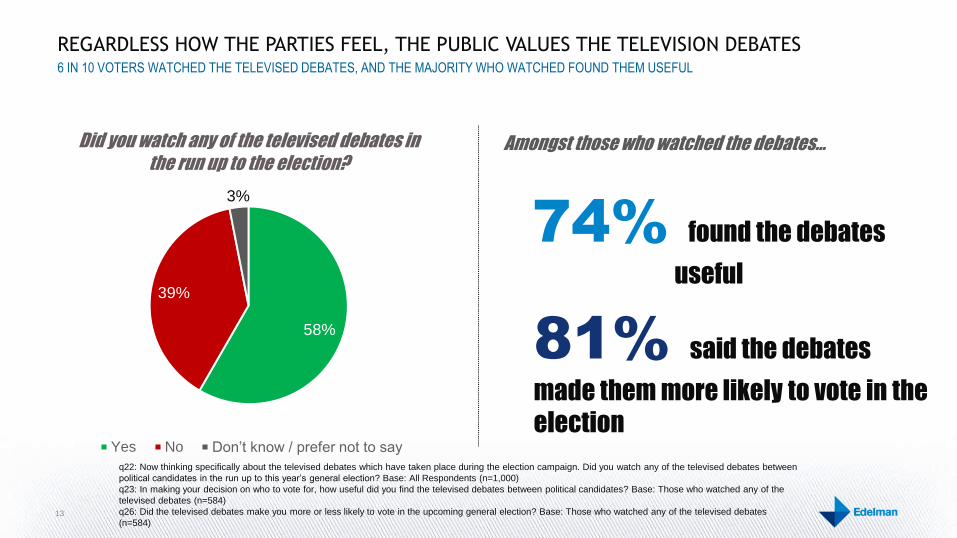
REGARDLESS HOW THE PARTIES FEEL, THE PUBLIC VALUES THE TELEVISION DEBATES
13
6 IN 10 VOTERS WATCHED THE TELEVISED DEBATES, AND THE MAJORITY WHO WATCHED FOUND THEM USEFUL
58%
39%
3%
Did you watch any of the televised debates in
the run up to the election?
Yes No Don’t know / prefer not to say
q22: Now thinking specifically about the televised debates which have taken place during the election campaign. Did you watch any of the televised debates between
political candidates in the run up to this year’s general election? Base: All Respondents (n=1,000)
q23: In making your decision on who to vote for, how useful did you find the televised debates between political candidates? Base: Those who watched any of the
televised debates (n=584)
q26: Did the televised debates make you more or less likely to vote in the upcoming general election? Base: Those who watched any of the televised debates
(n=584)
74% found the debates
useful
Amongst those who watched the debates…
81% said the debates
made them more likely to vote in the
election

PARTIES CANNOT AFFORD TO ABSTAIN: THE DEBATES IMPACTED THE PERCEPTION OF HALF WHO WATCHED
14
OPINION OF ED MILIBAND WAS POLARISED, WHILE STURGEON GOT A BOOST AND CAMERON TOOK A HIT
26%
23%
50%
1%
Did the televised debate change your mind
about any of the political leaders?
Yes, it made me more positive about themYes, it made me more negative about themNo, it did not change my mindPrefer not to say
q24: Did the televised debates change your mind about any of the political leaders? Base: Those who watched any of the televised debates (n=584)
q25: Which leader or leaders did the debates change your mind about? Base: Yes, it made me more positive about them (n=150), Yes, it made me more negative about
them (n=132)
44%39%
29% 27% 23% 23% 19%
Ed Miliband NicolaSturgeon
NigelFarage
DavidCameron
Nick Clegg NatalieBennett
LeanneWood
Yes, it made me more positive about them
45%38% 36% 34%
25%20% 18%
Ed Miliband DavidCameron
NigelFarage
NicolaSturgeon
Nick Clegg NatalieBennett
LeanneWood
Yes, it made me more negative about them
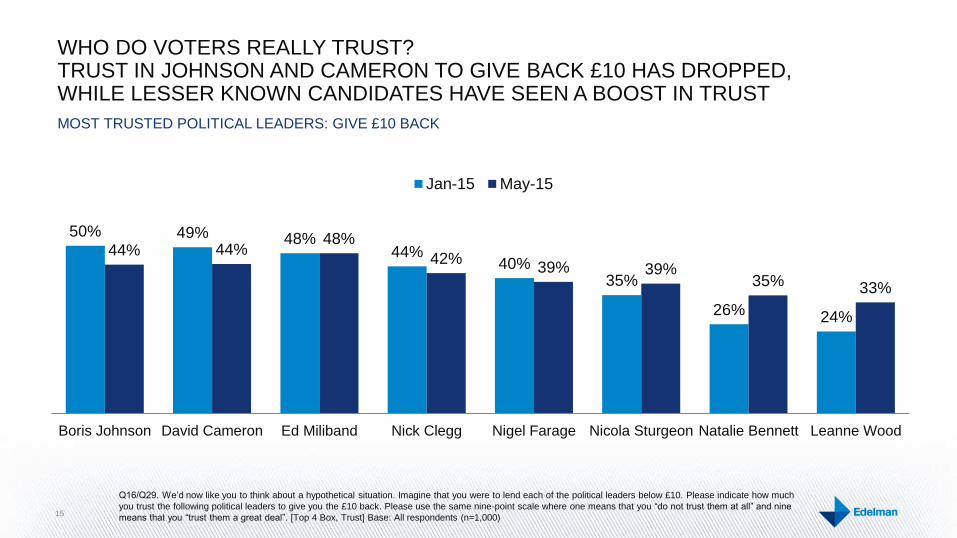
50% 49% 48%44%
40%35%
26% 24%
44% 44%48%
42%39% 39%
35% 33%
Boris Johnson David Cameron Ed Miliband Nick Clegg Nigel Farage Nicola Sturgeon Natalie Bennett Leanne Wood
Jan-15 May-15
15
MOST TRUSTED POLITICAL LEADERS: GIVE £10 BACK
Q16/Q29. We’d now like you to think about a hypothetical situation. Imagine that you were to lend each of the political leaders below £10. Please indicate how much
you trust the following political leaders to give you the £10 back. Please use the same nine-point scale where one means that you “do not trust them at all” and nine
means that you “trust them a great deal”. [Top 4 Box, Trust] Base: All respondents (n=1,000)
WHO DO VOTERS REALLY TRUST?TRUST IN JOHNSON AND CAMERON TO GIVE BACK £10 HAS DROPPED, WHILE LESSER KNOWN CANDIDATES HAVE SEEN A BOOST IN TRUST

Copyright ©2015 Daniel J. Edelman, Inc. All rights reserved.
All information contained herein is confidential and proprietary to Daniel J. Edelman, Inc. (“Edelman”).
THANK YOU
17
WHO WE SPOKE TO• 1,000 UK Adults aged 18+ who are legally allowed
to vote in the general election
• 5 minute online questionnaire
• Fieldwork was conducted between 1-3 May, 2015