edition #02 – march 2011 vmg newsletter - crisis...
TRANSCRIPT
1/11
Edition #02 – March 2011
VMG Newsletter
Victorian Modelling Group Special Interest Group focused on Hydraulic and Water Quality Modelling
in Water Distribution Systems and Sewer Systems
Motto
“Results! Why, man, I have gotten a lot of results. I know several thousand things that won’t work.”
Thomas Edison
Dear Readers & VMG Members
Welcome to the second edition of the VMG newsletter. After a very popular first edition, I consider that you will find this issue even more interesting and exciting.
You will read about the progress of the Victorian Desalination Project, find out how to achieve an automated water distribution system, explore projects which your colleague modellers from other organisations are working on, comprehend how to prepare your organisation for third party interventions, and view the results of the recent VMG survey, with much more. I also remind you of the first VMG meeting in Melbourne in December 2009.
I believe this newsletter will provide you with a great variety of information and also broaden your view of current industry developments.
Helena Mala-Jetmarova VMG Leader
Victorian Desalination Project
Update
Work on the Victorian Desalination Project is well underway.
Installation of the project’s marine intake and outlet structures, which will be used to draw seawater into the plant and diffuse it back into the ocean, is now complete. The jack up barge (Figure 1) used during these works has been towed away from
Williamson Beach and will soon be transported back to Europe. These works were completed ahead of schedule and represent a major milestone for the project.
Construction of the intake and outlet tunnels is also nearing completion. The 1.2 km intake tunnel is finished and more than 1.3 km of the 1.5 km outlet tunnel has been constructed. Works have commenced to connect the structures to the intake tunnel.
On the plant site itself (Figure 2), work is well underway on the reverse osmosis building. This building, where filtered seawater passes through two stages of reverse osmosis, has 5,951 m2 of 15,410 m2 of its precast panels erected, 9,795 m3 of 10,129 m3 of cast-in concrete poured and 760 m2 of 8,000 m2 building perimeter wall panels installed.
The reverse osmosis building is also the future home of the southern hemi-sphere’s largest living green roof. The roof will be covered with approximately 100,000 indigenous ground covers, tussocks and shrubs over a roof area spanning more than 26,000 m2.
Once seawater becomes drinking water, it is pumped through a 84 km pipeline which runs from the plant site in

2/11
Wonthaggi to the Melbourne water network near Soldiers Road in Berwick, and water will then flow to consumers directly, or to Cardinia Reservoir. More than 76 km of the 1.9 m diameter pipe has been strung along the easement and more than 53 km of the pipe has been laid. Of the 16 stream and drain crossings required, nine have been completed with another four currently in progress. The majority of the road crossings have also been completed – 34 of 38 to date.
Fig. 1: The jack up barge used for construction of the marine structures
The project will use about 90 MW of power from the grid to operate the plant and the water transfer pipeline. The dedicated power supply is 87 km and its cable is located in the same easement as the pipeline, sharing the same alignment except for a 9 km section where it diverts to Cranbourne Terminal Station. To date, 56.4 km of cable has been laid, 64.1 km of conduit laid and a total of 65 km welded and trefoiled.
Fig. 2: An aerial overview of the plant site
All of the power used for the operation of the plant and transfer pipeline will be offset by renewable energy certificates purchased through energy service retailer AGL. This is providing investment in green energy projects, including the Oaklands Hill and Macarthur wind farms.
Westernport Water
Uses WaterGEMS to
Achieve Automated
Distribution System
Delivers cost savings in the operation and management of more than $43 mi-llion in water assets
Accurate Decision Tool Was
Way to Go
Westernport Water provides water, wastewater, and recycled water services to nearly 16,000 properties on Phillip Island, in the state of Victoria, Australia, and an area of the mainland from The Gurdies to Archies Creek. Using Bentley’s WaterGEMS water distri-bution modelling software integrated with a geographic information system (GIS) and supervisory control and data acquisition (SCADA) system, both introduced into the utility over the past two years, Westernport Water’s managers were able to achieve a high performance, automated system. This targeted investment in new technologies is currently delivering substantial cost savings and contributes to the effective operation and management of more than $43 million in water assets.
The Open Spatial GIS, in conjunction with WaterGEMS, enables simple and easy updates of the system, including all new subdivisions. The Control Micro-systems SCADA system allows field-measured data to be brought directly into WaterGEMS using the modelling soft-ware’s SCADAConnect (Figure 3) and Darwin Calibrator modules.
Since SCADAConnect can use both historical and real-time data, the model is not only constantly up to date, but also has tables of previous values for trending and projections. This means that flow, pressure, and tank-level data for each demand zone can be fed on a real-time basis, enabling the system to model real-world conditions.
Using the imported SCADA values, Darwin Calibrator, and the demand inversing tool in WaterGEMS, We-sternport Water engineers can propor-

3/11
tionally change the demand values assigned to those nodes within each demand zone. This innovative first for the water industry in Victoria allows the model to continually update demand groups. As a result, all calculated values in the water model are more accurate, since the exact flow from the SCADA system is used to calculate, for example, velocity,
losses, and system curves. An up-to-date and accurate model gives engineering design and operational personnel the best possible platform for decision making.
Fig. 3: Westernport Water’s water model importing field data captured by its SCADA system, using WaterGEMS’ SCADAConnect
Cost Benefits, Efficiency, and Environmental
Improvements
Previously, Westernport Water engaged the services of external contractors to manually upgrade and calibrate its water model. The SCADAConnect technology with real-time updates will save Westernport Water the cost of these calibrations, which came to around $80,000.
Additionally, the WaterGEMS water model will help deliver savings in leak detection by measuring and identifying nonrevenue water. Westernport Water is aiming to achieve a 25 percent reduction in water losses and recover up to $85,000 (retail value) of water. Reducing water losses also means that less water will need to be pumped to customers to achieve the same level of service, so carbon emissions will be reduced as well.
Dean Jagoe, project engineer, Systems, at Westernport Water, concluded, “We-sternport Water’s outlook on its ability to effectively develop and sustain our water distribution infrastructure has never been so positive. The integration of GIS, SCADA, and water modelling technologies will provide unprecedented scope for managers, engineers, opera-tional, and maintenance personnel at Westernport Water to understand, on a real-time basis, how the water network is performing. The level of integration being achieved is expected to set benchmarks in informed decision-making for our organisation.”
Projects VMG Members Are Working On
In consideration of the popularity of the ‘Projects’ section of the last newsletter, VMG members have been asked to share current modelling projects with us.
This section tends to provide a broad overview of modelling projects from various participating organisations. This is anticipated to increase the confidence of modellers by raising an awareness of common modelling issues, and to illustrate that we all are a part of one big modelling group.

4/11
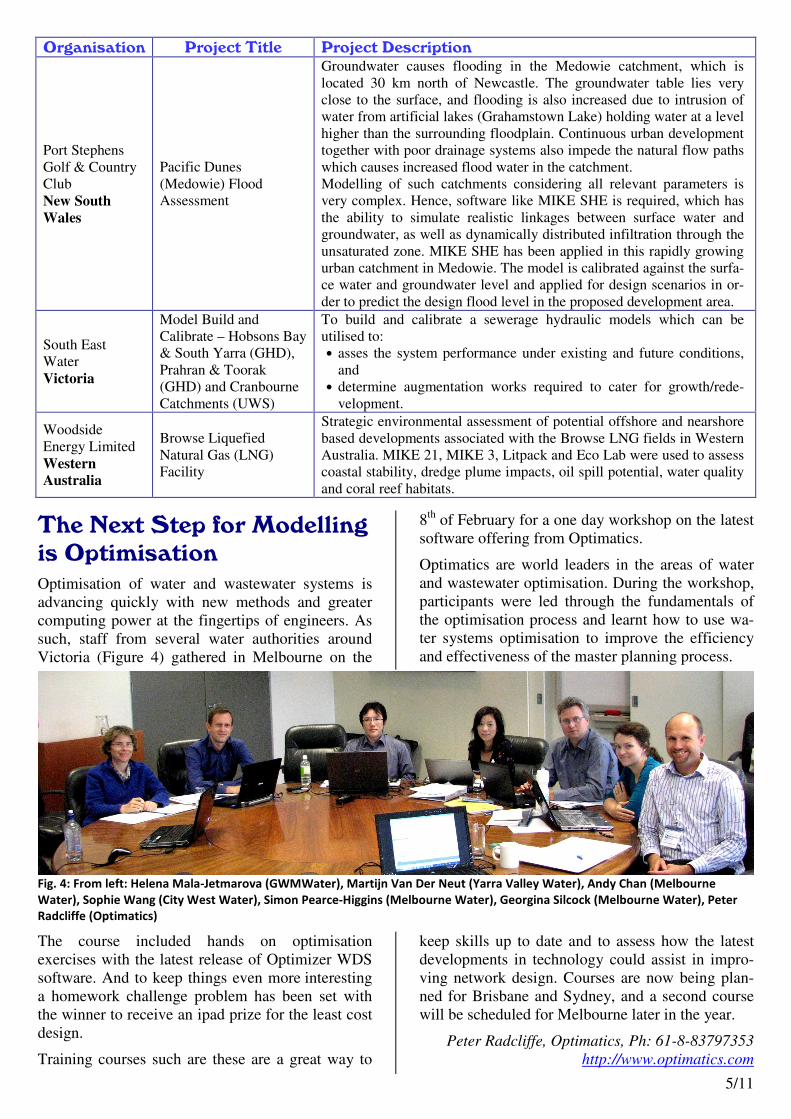
Organisation Project Title Project Description
Allconnex Water Queensland
Southern Seaway SmartRelease Project
Continuation of the award winning Gold Coast Seaway SmartRelease Project to determine the optimum release window for recycled water from the city of the Gold Coast to an estuarine environment. This custom made Decision Support System (DSS) allows for increased growth in the city (and therefore more releases from WWTPs) while minimising impact on the water quality and reducing energy consumption. The DSS is based around MIKE 21 HD, SW and AD modules and SOLUTIONS SOFTWARE by DHI.
Coliban Water Victoria
Echuca Water Network Augmentation Plan (Recently completed)
InforWorksWS hydraulic model was used to prepare the 25 year water distribution network augmentation plan for the township of Echuca. The hydraulic model was used to analyze fire flows, security of supply (for example analysis of impacts on the network if a critical main fails using critical link analysis tool in InfoWorksWS) and water quality (developed a water quality model in InfoWorksWS) in addition to evaluation system deficiencies (for example pipe capacities and residual pressures etc.)
Coliban Water Victoria
Sewer Models Update
Sewer network hydraulic models (InfoWorksCS) for seven major towns in the Coliban Water region were built and calibrated during 2007/08. Since then a number of upgrade works to the sewerage systems have occurred and the networks have expanded with growth. The objective of this project is to update the models to reflect current systems.
Coliban Water Victoria
Hydraulic Water Model Building and Calibration
Coliban Water has an ongoing program to develop hydraulic models for every system in Coliban region. The major challenge in model calibration is to obtain quality field data. Our modelling team together with our operations team has developed a program to obtain field data for ten water distribution systems during this summer. The first part of this project is to validate all the existing monitoring equipment (flowmeters, pressure & level sensors) and repair or replace the equipment where necessary. The second part is installation of temporary equipment where necessary and collect data.
Gold Coast City Council Queensland
Climate Change Impacts on Stormwater Management
MIKE FLOOD model development of Frank Street and Mount Warren catchments on the Gold Coast. The purpose was to assess impacts of climate change on flooding caused by surcharged drainage systems.
Grampians Wimmera Mallee Water (GWMWater) Victoria
Model Development for GWMWater’s Rural Pipeline Networks
GWMWater’s rural pipeline networks, namely the Northern Mallee Pipeline (NMP) and the Wimmera Mallee Pipeline (WMP) are a significant part of the Victorian water grid. The pipelines extend to a combined total pipe length of over 12,000 km, servicing a total area of about 29,000 km2. They supply a wide range of customer groups such as 52 towns, thousands of rural properties and other industrial, agricultural and environmental water users. Hydraulic models are built in-house using InfoWater (MWH Soft) modelling package. The main purpose of the models is to use them as a decision making tool for water allocations.
5/11
Organisation Project Title Project Description
Port Stephens Golf & Country Club New South
Wales
Pacific Dunes (Medowie) Flood Assessment
Groundwater causes flooding in the Medowie catchment, which is located 30 km north of Newcastle. The groundwater table lies very close to the surface, and flooding is also increased due to intrusion of water from artificial lakes (Grahamstown Lake) holding water at a level higher than the surrounding floodplain. Continuous urban development together with poor drainage systems also impede the natural flow paths which causes increased flood water in the catchment. Modelling of such catchments considering all relevant parameters is very complex. Hence, software like MIKE SHE is required, which has the ability to simulate realistic linkages between surface water and groundwater, as well as dynamically distributed infiltration through the unsaturated zone. MIKE SHE has been applied in this rapidly growing urban catchment in Medowie. The model is calibrated against the surfa-ce water and groundwater level and applied for design scenarios in or-der to predict the design flood level in the proposed development area.
South East Water Victoria
Model Build and Calibrate – Hobsons Bay & South Yarra (GHD), Prahran & Toorak (GHD) and Cranbourne Catchments (UWS)
To build and calibrate a sewerage hydraulic models which can be utilised to: • asses the system performance under existing and future conditions,
and • determine augmentation works required to cater for growth/rede-
velopment.
Woodside Energy Limited Western
Australia
Browse Liquefied Natural Gas (LNG) Facility
Strategic environmental assessment of potential offshore and nearshore based developments associated with the Browse LNG fields in Western Australia. MIKE 21, MIKE 3, Litpack and Eco Lab were used to assess coastal stability, dredge plume impacts, oil spill potential, water quality and coral reef habitats.
The Next Step for Modelling
is Optimisation
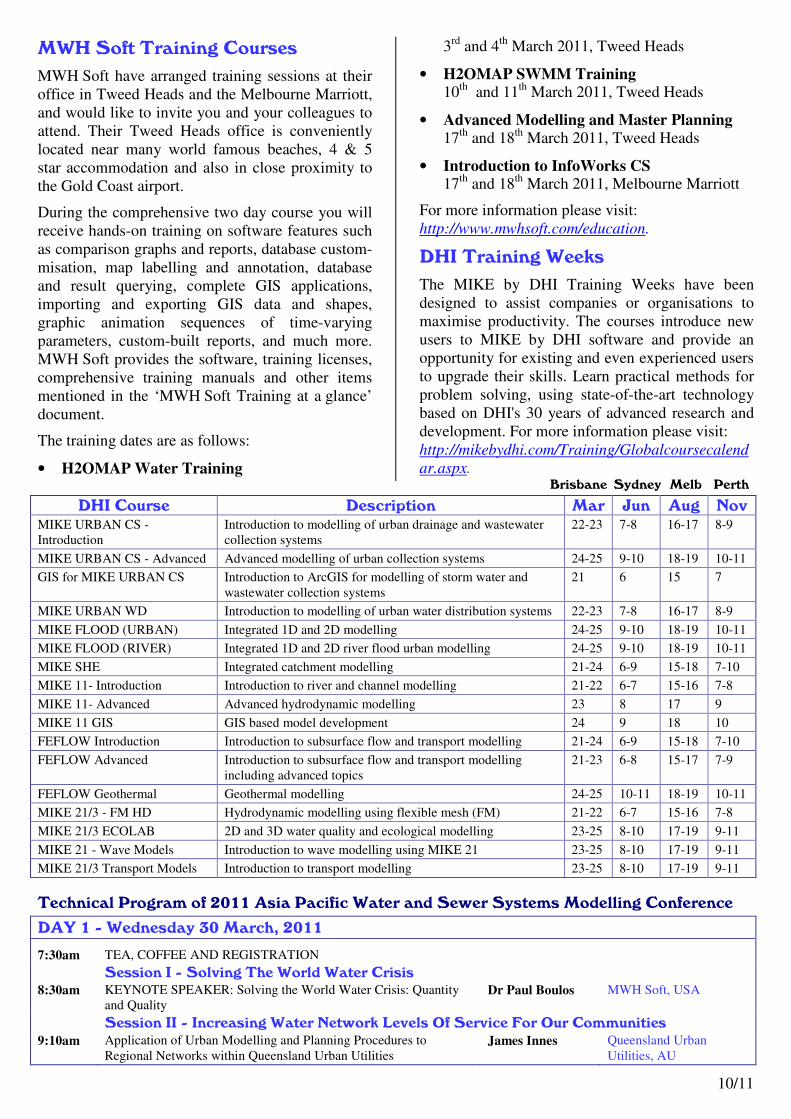
Optimisation of water and wastewater systems is advancing quickly with new methods and greater computing power at the fingertips of engineers. As such, staff from several water authorities around Victoria (Figure 4) gathered in Melbourne on the
8th of February for a one day workshop on the latest software offering from Optimatics.
Optimatics are world leaders in the areas of water and wastewater optimisation. During the workshop, participants were led through the fundamentals of the optimisation process and learnt how to use wa-ter systems optimisation to improve the efficiency and effectiveness of the master planning process.
Fig. 4: From left: Helena Mala-Jetmarova (GWMWater), Martijn Van Der Neut (Yarra Valley Water), Andy Chan (Melbourne
Water), Sophie Wang (City West Water), Simon Pearce-Higgins (Melbourne Water), Georgina Silcock (Melbourne Water), Peter
Radcliffe (Optimatics)
The course included hands on optimisation exercises with the latest release of Optimizer WDS software. And to keep things even more interesting a homework challenge problem has been set with the winner to receive an ipad prize for the least cost design.
Training courses such are these are a great way to
keep skills up to date and to assess how the latest developments in technology could assist in impro-ving network design. Courses are now being plan-ned for Brisbane and Sydney, and a second course will be scheduled for Melbourne later in the year.
Peter Radcliffe, Optimatics, Ph: 61-8-83797353 http://www.optimatics.com

6/11
Dunedin City Council’s
Three Waters Strategy
Project
As part of a Three Waters Strategy Project Dunedin City Council (DCC) has taken a bold step and embraced the modelling of three waters at the same time. In conjunction with this a Three Water Strategic Direction Statement was developed which supports forward planning and outlines the principles, priorities and planning assumptions that are to underpin decisions regarding three waters infrastructure planning and service delivery in
Dunedin for the next 50 years.
Phase 1 of the project involved the model build and calibration of the high level distribution and trunk systems for water and wastewater using InfoWorks WS and CS, respectively. In addition, a stormwater model was built and calibrated for a section of the city and used to develop a pilot stormwater Integrated Catchment Management Plan (ICMP). Phase 1 established a whole city strategic overview and identified focus areas for Phase 2. The initial work carried out in developing the first ICMP has allowed the remaining ICMPs to be programmed concurrently. DCC is now nearing completion of Phase 2 of the project.
Fig. 5: DCCs approach to ‘Manage Actively’ and ‘Manage Passively’ to improve level of service
The main advantage of modelling the three waters at one time is the outcome; the ability to prioritise works across the three waters based on modelled options. This provides strategic planning with focus and direction. Because all three waters are reviewed at once and one format of scoring is used, along with one set of valuation costs, the outcome is a definitive list of catchment requirements. Upon reviewing an identified issue the question was asked ‘Does it affect Levels of Service?’ DCC adopted a risk scoring matrix of likelihood versus consequence and has using this to separated catchment issues into ‘Manage Actively’ and ‘Manage Passively’. Active management indicates that DCC will seek to implement changes to the network management in the catchment, whereas passive management would tend more towards monitoring and review of existing management practices to ensure that the targets set can be met. Lower scoring issues were classed as ‘Manage Passively.’ Higher scoring issues were classed as
‘Manage Actively’ and brought through discussion workshops and further divided into ‘Operational Improvements’ or ‘Capital Upgrades’ with estimates for inclusion in future capital works plans. This approach has enabled DCC to review the current levels of service and confirm that the current approach is correct or needs to be amended. Figure 5 outlines this approach.
Certainly this project has shown the benefits of modelling all three waters at one time. Producing a forward works plan across the waters is feasible and an efficient use of money. Plans for further use of the models are already underway. The approach of modelling the three waters simultaneously should not be avoided because the outcome provides strategic direction and solutions for the area in question effectively. DCC has led the way forward for other New Zealand councils and beyond.
Louisa Sinclair, Dunedin City Council, New Zealand Ph: 64-3-4743896, [email protected]

7/11
Australian National and
Transnational Terrorism
Related to the Victorian
Water Industry
What if one of the main water treatment plants, or alternatively, say, the Melbourne main waste water treatment plant under the Western end of the West Gate Bridge was disabled by a high explosive bomb, or even worse, by the use of a Radiological Dispersion Device from the actions of a terrorist group?
Obviously these are designated as ‘hard’ targets due to the increased security, but what if it was a ‘soft’ target such as Ballarat, Bendigo or Geelong producing maximum impact for a small financial outlay, with a figure of 100,000 people severely affected?
What if at the same time there was a simultaneous attack on the Power Stations in the Latrobe Valley? What if there was a cyber attack on the water industry SCADA systems with a complete ‘denial of service’ attack. The two above scenarios are tangible, realistic and rank highly on Western Intelligence radar.
This is not a statement intended to frighten the reader as it is within the realms of possibility, with a long documented history of terrorist attacks on water1 traced back to 600 BC. In 1992 for example, lethal concentrations of potassium cyanide were reported discovered in the drinking water tanks of a Turkish Air Force Compound. The Kurdish Workers’ party claimed credit for this act. In 1994, there was a reported threat to contaminate the water supply of the Russian 14th Army in Tiraspol, Moldava with mercury. This action could have potentially resulted in up to 2,000 deaths. Closer to home, in 1982, an ex State Electricity Commission employee threatened to contaminate a major Melbourne reservoir with polychlorinated biphenyls (PCBs). In Queensland in 1998, a disgruntled SCADA contractor remotely dumped raw sewage into a 5 star resort water feature via external SCADA intervention.
Within the Victorian Water industry sector, are we adequately prepared to deal with these potential nightmare scenarios?
The Victorian Community Protection Act (2004) has been implemented by the Victorian Government
across all essential services sectors to ensure that they do consider potential emerging issues prior to them occurring. The main purpose and scope of the Act is to ensure that all water corporations perform mandatory annual functions to mitigate or reduce the likelihood of any potential incidents. The Act also provides some assurance that an effective response and recovery is in place, in the case of a potential future incident occurring.
The Act stipulates that water corporations shall on an annual basis:
• Have Risk Plan to plan for, and mitigate acts of terrorism.
• Review this Plan on an annual basis.
• Practice this Plan with a scripted Counter Terrorist Exercise.
The corporation Risk Plan describes mitigations and security requirements with the annual scripted exercise enacting, as realistically as feasible, a credible incident. The exercise, which is asse-ssed by Victorian Government regulators, is an assurance tool
to actually demonstrate effectiveness in reality.
This Victorian legislation tends to lead other States, and has been recently evaluated by a Victorian Auditor General’s review to be highly effective in illustrating and demonstrating effective mitigation controls for potential acts of terrorism. The provisions of the Act have been also extremely successful in enabling water corporations to understand the potential threats, and to prepare the defences more adequately for the challenges of the future.
Dave Birkett & Jim Truscott Ph: 61-8-92045141 or 61-421915441
http://crisisleaders.com
1 Gleick, P. H. (2006). "Water and Terrorism." Water Policy,
8(2006), 481-503. Pacific Institute, 654 13th Street, Oakland,
California, USA.

8/11
Results of VMG Survey #2
The survey, conducted in August – October 2010, was completed by 21 VMG members, which repre-sents approximately 20 percent of the total mem-bership.
The survey indicates that the responders are generally satisfied with the VMG and its services. 43 percent of survey responders, however, desire more discussions in the VMG meetings. This has been already addressed by the introduction of afternoon workshops, the first of which was in the November 2010 VMG meeting.
Q1: Do you represent?
A. Water authority. B. Consultant. C. Software provider. D. Other.
Q2: Are you happy with VMG meetings?
A. Yes. B. No. Please specify. C. I do not know.
Q3: At VMG meetings, do you want more?
A. Presentations. B. Discussions. C. Others. Please specify.
Examples of answers for ‘C’:
• Discussions.
• Knowledge sharing on specific fields, GIS automation, model applications.
• Information on outcomes or problems being encountered with associated fixes.
• Current balance is good.
Q4: Are you happy with VMG websites
(www.vmg.iplace.cz)?
A. Yes. B. No. Please specify. C. I do not know.
Q5: Are you happy with VMG newsletter?
A. Yes. B. No. Please specify. C. I do not know.
Q6: Why don’t you use VMG internet
forum?
A. I do not know it exists. B. It is too complicated. C. It is useless. D. I do not know. E. For another reason. Please specify.
Examples of answers for ‘E’:
75
0
25
0
20
40
60
80
100
A B C
70
5
25
0
20
40
60
80
100
A B C
81
5
14
0
20
40
60
80
100
A B C
16
50
21
58
0
20
40
60
80
100
A B C D E
54.5
41
4.50
0.0
20.0
40.0
60.0
80.0
100.0
A B C D
28.5
43
28.5
0.0
20.0
40.0
60.0
80.0
100.0
A B C

9/11
VMG Contact Helena Mala-Jetmarova GWMWater, 11 McLachlan Street, Horsham VIC 3402, Australia
http://vmg.iplace.cz / [email protected]
• Use internal forums before going to external sources.
• Little time available to view.
• Too Busy.
• Have not yet had time.
• Our office internet restrictions policy.
Q7: You are very welcome to write any
comments regarding VMG.
Example of answers:
• VMG is a valuable and interesting opportunity for networking with others interested in modelling. As a self-taught novice I greatly enjoy and benefit from the VMG meetings. The third meeting I was regrettably unable to attend since I was overseas at the time, but am looking forward to Nov 29, especially the workshop. Many thanks for the efforts of those who make
the meetings happen and support the VMG by providing venues and other resources.
• I like the part of the newsletter where members share what they are working on. I think it is useful and helpful for users to feel that they are part of the larger group and see what everyone else is doing. A calendar of key dates might be useful to include in the newsletter (eg. next meeting date, training dates, conference dates).
• Helena, well done on the significant effort you put in running the VMG, preparing the newsletter and website. Truly a fabulous job!
• Love your work, keep it up. You are an inspiration for us kiwis (ED: Reply from New Zealand).
• Very well organised. A credit to the Committee. Other states would also benefit from having this type of group and should follow VMG’s lead.
Lets Remember 1st VMG Meeting on 1.12.2009
Modelling Events
VMG Meeting #5
Friday 6 May 2011 AECOM Level 9, 8 Exhibition Street, Melbourne, VIC 3000
2011 Asia Pacific Water and Sewer
Systems Modelling Conference
30-31 March 2011, Gold Coast
The conference, which is organised by MWH Soft, is once-a-year learning opportunity for the Asia Pacific expert modelling community. It features unique technical presentations showcasing projects from throughout the region along with keynote addresses from industry leaders.
Technical program is included further. For more info please visit: http://www.asiapacificwater.com.
10/11
MWH Soft Training Courses
MWH Soft have arranged training sessions at their office in Tweed Heads and the Melbourne Marriott, and would like to invite you and your colleagues to attend. Their Tweed Heads office is conveniently located near many world famous beaches, 4 & 5 star accommodation and also in close proximity to the Gold Coast airport.
During the comprehensive two day course you will receive hands-on training on software features such as comparison graphs and reports, database custom-misation, map labelling and annotation, database and result querying, complete GIS applications, importing and exporting GIS data and shapes, graphic animation sequences of time-varying parameters, custom-built reports, and much more. MWH Soft provides the software, training licenses, comprehensive training manuals and other items mentioned in the ‘MWH Soft Training at a glance’ document.
The training dates are as follows:
• H2OMAP Water Training
3rd and 4th March 2011, Tweed Heads
• H2OMAP SWMM Training 10th and 11th March 2011, Tweed Heads
• Advanced Modelling and Master Planning
17th and 18th March 2011, Tweed Heads
• Introduction to InfoWorks CS 17th and 18th March 2011, Melbourne Marriott
For more information please visit: http://www.mwhsoft.com/education.
DHI Training Weeks
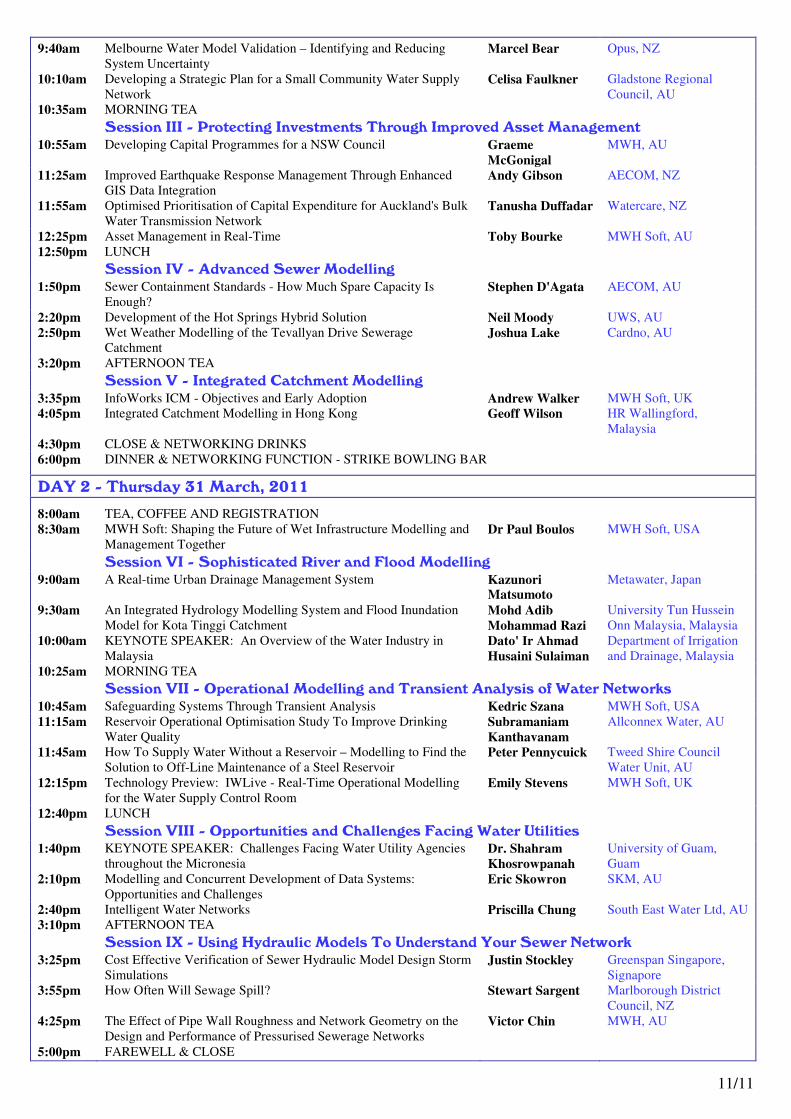
The MIKE by DHI Training Weeks have been designed to assist companies or organisations to maximise productivity. The courses introduce new users to MIKE by DHI software and provide an opportunity for existing and even experienced users to upgrade their skills. Learn practical methods for problem solving, using state-of-the-art technology based on DHI's 30 years of advanced research and development. For more information please visit: http://mikebydhi.com/Training/Globalcoursecalendar.aspx.
DHI Course Description Mar Jun Aug Nov MIKE URBAN CS - Introduction
Introduction to modelling of urban drainage and wastewater collection systems
22-23 7-8 16-17 8-9
MIKE URBAN CS - Advanced Advanced modelling of urban collection systems 24-25 9-10 18-19 10-11
GIS for MIKE URBAN CS Introduction to ArcGIS for modelling of storm water and wastewater collection systems
21 6 15 7
MIKE URBAN WD Introduction to modelling of urban water distribution systems 22-23 7-8 16-17 8-9
MIKE FLOOD (URBAN) Integrated 1D and 2D modelling 24-25 9-10 18-19 10-11
MIKE FLOOD (RIVER) Integrated 1D and 2D river flood urban modelling 24-25 9-10 18-19 10-11
MIKE SHE Integrated catchment modelling 21-24 6-9 15-18 7-10
MIKE 11- Introduction Introduction to river and channel modelling 21-22 6-7 15-16 7-8
MIKE 11- Advanced Advanced hydrodynamic modelling 23 8 17 9
MIKE 11 GIS GIS based model development 24 9 18 10
FEFLOW Introduction Introduction to subsurface flow and transport modelling 21-24 6-9 15-18 7-10
FEFLOW Advanced Introduction to subsurface flow and transport modelling including advanced topics
21-23 6-8 15-17 7-9
FEFLOW Geothermal Geothermal modelling 24-25 10-11 18-19 10-11
MIKE 21/3 - FM HD Hydrodynamic modelling using flexible mesh (FM) 21-22 6-7 15-16 7-8
MIKE 21/3 ECOLAB 2D and 3D water quality and ecological modelling 23-25 8-10 17-19 9-11
MIKE 21 - Wave Models Introduction to wave modelling using MIKE 21 23-25 8-10 17-19 9-11
MIKE 21/3 Transport Models Introduction to transport modelling 23-25 8-10 17-19 9-11
Technical Program of 2011 Asia Pacific Water and Sewer Systems Modelling Conference
DAY 1 - Wednesday 30 March, 2011
7:30am TEA, COFFEE AND REGISTRATION Session I - Solving The World Water Crisis
8:30am KEYNOTE SPEAKER: Solving the World Water Crisis: Quantity and Quality
Dr Paul Boulos MWH Soft, USA
Session II - Increasing Water Network Levels Of Service For Our Communities
9:10am Application of Urban Modelling and Planning Procedures to Regional Networks within Queensland Urban Utilities
James Innes Queensland Urban Utilities, AU
Brisbane Sydney Melb Perth
11/11
9:40am Melbourne Water Model Validation – Identifying and Reducing System Uncertainty
Marcel Bear Opus, NZ
10:10am Developing a Strategic Plan for a Small Community Water Supply Network
Celisa Faulkner Gladstone Regional Council, AU
10:35am MORNING TEA Session III - Protecting Investments Through Improved Asset Management
10:55am Developing Capital Programmes for a NSW Council Graeme
McGonigal MWH, AU
11:25am Improved Earthquake Response Management Through Enhanced GIS Data Integration
Andy Gibson AECOM, NZ
11:55am Optimised Prioritisation of Capital Expenditure for Auckland's Bulk Water Transmission Network
Tanusha Duffadar Watercare, NZ
12:25pm Asset Management in Real-Time Toby Bourke MWH Soft, AU 12:50pm LUNCH Session IV - Advanced Sewer Modelling
1:50pm Sewer Containment Standards - How Much Spare Capacity Is Enough?
Stephen D'Agata AECOM, AU
2:20pm Development of the Hot Springs Hybrid Solution Neil Moody UWS, AU 2:50pm Wet Weather Modelling of the Tevallyan Drive Sewerage
Catchment Joshua Lake Cardno, AU
3:20pm AFTERNOON TEA Session V - Integrated Catchment Modelling
3:35pm InfoWorks ICM - Objectives and Early Adoption Andrew Walker MWH Soft, UK 4:05pm Integrated Catchment Modelling in Hong Kong Geoff Wilson HR Wallingford,
Malaysia 4:30pm CLOSE & NETWORKING DRINKS 6:00pm DINNER & NETWORKING FUNCTION - STRIKE BOWLING BAR
DAY 2 - Thursday 31 March, 2011
8:00am TEA, COFFEE AND REGISTRATION 8:30am MWH Soft: Shaping the Future of Wet Infrastructure Modelling and
Management Together Dr Paul Boulos MWH Soft, USA
Session VI - Sophisticated River and Flood Modelling
9:00am A Real-time Urban Drainage Management System Kazunori Matsumoto
Metawater, Japan
9:30am An Integrated Hydrology Modelling System and Flood Inundation Model for Kota Tinggi Catchment
Mohd Adib
Mohammad Razi University Tun Hussein Onn Malaysia, Malaysia
10:00am KEYNOTE SPEAKER: An Overview of the Water Industry in Malaysia
Dato' Ir Ahmad
Husaini Sulaiman Department of Irrigation and Drainage, Malaysia
10:25am MORNING TEA Session VII - Operational Modelling and Transient Analysis of Water Networks
10:45am Safeguarding Systems Through Transient Analysis Kedric Szana MWH Soft, USA 11:15am Reservoir Operational Optimisation Study To Improve Drinking
Water Quality Subramaniam
Kanthavanam Allconnex Water, AU
11:45am How To Supply Water Without a Reservoir – Modelling to Find the Solution to Off-Line Maintenance of a Steel Reservoir
Peter Pennycuick Tweed Shire Council Water Unit, AU
12:15pm Technology Preview: IWLive - Real-Time Operational Modelling for the Water Supply Control Room
Emily Stevens MWH Soft, UK
12:40pm LUNCH Session VIII - Opportunities and Challenges Facing Water Utilities
1:40pm KEYNOTE SPEAKER: Challenges Facing Water Utility Agencies throughout the Micronesia
Dr. Shahram
Khosrowpanah University of Guam, Guam
2:10pm Modelling and Concurrent Development of Data Systems: Opportunities and Challenges
Eric Skowron SKM, AU
2:40pm Intelligent Water Networks Priscilla Chung South East Water Ltd, AU 3:10pm AFTERNOON TEA Session IX - Using Hydraulic Models To Understand Your Sewer Network
3:25pm Cost Effective Verification of Sewer Hydraulic Model Design Storm Simulations
Justin Stockley Greenspan Singapore, Signapore
3:55pm How Often Will Sewage Spill? Stewart Sargent Marlborough District Council, NZ
4:25pm The Effect of Pipe Wall Roughness and Network Geometry on the Design and Performance of Pressurised Sewerage Networks
Victor Chin MWH, AU
5:00pm FAREWELL & CLOSE