educating for the - minnesota · the minnesota office of higher education is a cabinet-level state...
TRANSCRIPT

EDUCATING FOR THE FUTURE 2016
UPDATE AND POLICY GUIDE
OFFICE OF H IG HE R EDUCA TION
Authors
Shaun Williams-Wyche
Research Analyst Minnesota Office of Higher Education Tel: 651-259-3967 [email protected]
Meredith Fergus
Manager, Financial Aid Research Minnesota Office of Higher Education Tel: 651-259-3963 [email protected]
Alexandra Djurovich
Senior Data Analyst Minnesota Office of Higher Education Tel: 651-259-3962 [email protected]
About the Minnesota Office of Higher Education
The Minnesota Office of Higher Education is a cabinet-level state agency providing students with financial aid programs and information to help them gain access to postsecondary education. The agency also serves as the state’s clearinghouse for data, research and analysis on postsecondary enrollment, financial aid, finance and trends.
The Minnesota State Grant Program is the largest financial aid program administered by the Office of Higher Education, awarding up to $180 million in need-based grants to Minnesota residents attending accredited institutions in Minnesota. The agency oversees tuition reciprocity programs, a student loan program, Minnesota’s 529 College Savings Plan, licensing and early college awareness programs for youth.
Minnesota Office of Higher Education 1450 Energy Park Drive, Suite 350 Saint Paul, MN 55108 Phone: (651) 642-0567 Toll Free: (800) 657-3866 Fax: (651) 642-0675 www.ohe.state.mn.us

Minnesota Office of Higher Education 1
Table of Contents Executive Summary ........................................................................................................................... 2 Introduction ...................................................................................................................................... 6 Minnesota’s Changing Demographics .............................................................................................. 10 Minnesota’s Educational Attainment Rate 2016 .............................................................................. 11
2016 Estimates ...................................................................................................................................... 11 Increases Needed to Meet the 70 Percent Goal by 2025 ..................................................................... 12
Levers for Increasing Attainment ..................................................................................................... 13 Lever 1: Enroll more college students .................................................................................................. 13 Lever 2: Import college-educated people to the state (in-migration).................................................. 14 Lever 3: Increase completion rates among adults with some college but no undergraduate credential............................................................................................................................................................... 15 Lever 4: Increase retention and completion rates among currently enrolled undergraduates .......... 16 Summarizing the Comparative Impact of the Four Levers ................................................................... 17
Best-Practice Strategies to Increase Completion .............................................................................. 19 Best-Practice Strategy: Social and Campus Integration ....................................................................... 19 Best-Practice Strategy: Programs Promoting Long-Term Academic Success ....................................... 21 Best-Practice Strategy: Alternative delivery models for developmental education ............................ 23 Best-Practice Strategy: Emergency assistance ..................................................................................... 24
2016 Legislation: Equity in Education and Job Connection Grants .................................................... 26 The Bottom Line.............................................................................................................................. 27 Appendix A: Population Estimates by Race and Ethnicity ................................................................. 29 Appendix B: Estimates of Associate Degree Attainment by Race and Ethnicity ................................. 31 Appendix C: Best Practice Strategy Cost Estimates ........................................................................... 33
Summer Bridge Programs ..................................................................................................................... 33 Proactive Advising ................................................................................................................................. 34 Developmental Education..................................................................................................................... 35
2 Minnesota Office of Higher Education
Executive Summary The 2015 Minnesota Legislature enacted a state postsecondary educational attainment goal: 70 percent of Minnesota adults (age 25 to 44) will have attained a postsecondary certificate or degree by 2025 (Minn. Laws 2015 Chapter 69 Article 3 Sec. 6). To achieve this goal, Minnesota must address disparities across the educational pipeline. This is the second annual report on Minnesota’s educational attainment goal, specifically providing an update of the original baseline targets established in the first report. Information included in this report is the combined work of the Minnesota Office of Higher Education (OHE), Minnesota State Demographic Center, and Minnesota State Colleges and Universities (Minnesota State). This and subsequent reports, as required by legislation, will include the updates to data and methodology used to establish educational attainment measures in Minnesota.
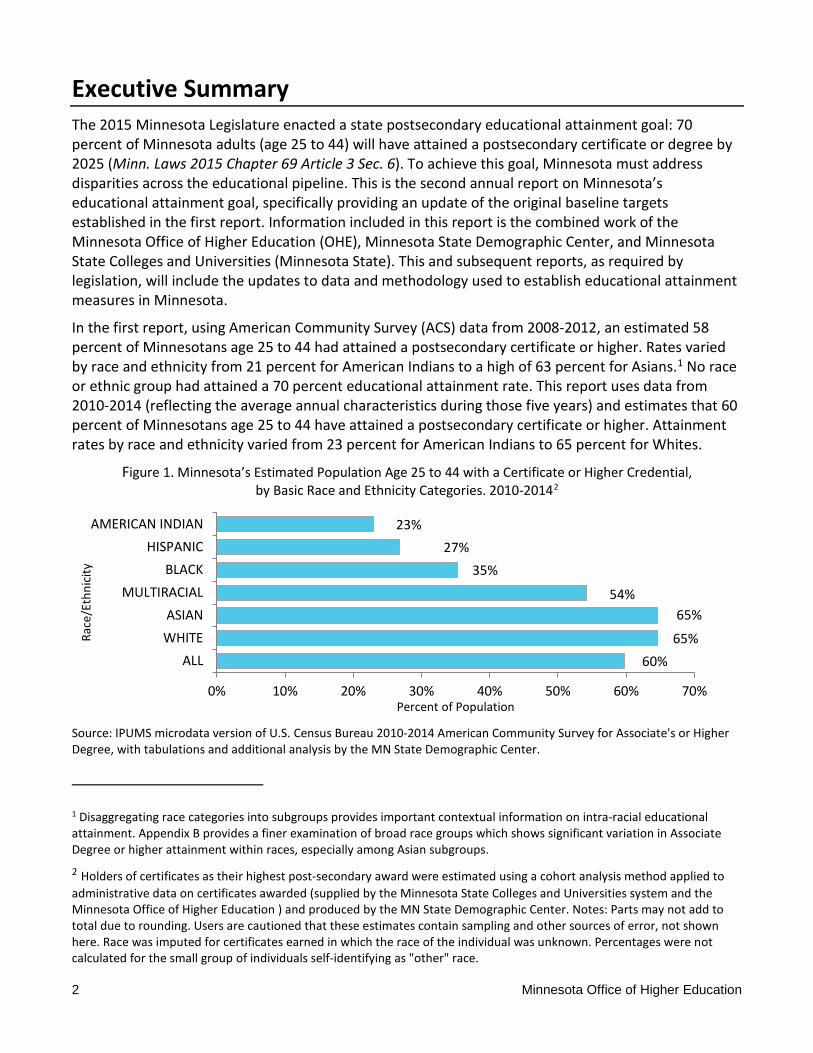
In the first report, using American Community Survey (ACS) data from 2008-2012, an estimated 58 percent of Minnesotans age 25 to 44 had attained a postsecondary certificate or higher. Rates varied by race and ethnicity from 21 percent for American Indians to a high of 63 percent for Asians.1 No race or ethnic group had attained a 70 percent educational attainment rate. This report uses data from 2010-2014 (reflecting the average annual characteristics during those five years) and estimates that 60 percent of Minnesotans age 25 to 44 have attained a postsecondary certificate or higher. Attainment rates by race and ethnicity varied from 23 percent for American Indians to 65 percent for Whites.
Figure 1. Minnesota’s Estimated Population Age 25 to 44 with a Certificate or Higher Credential, by Basic Race and Ethnicity Categories. 2010-20142
Source: IPUMS microdata version of U.S. Census Bureau 2010-2014 American Community Survey for Associate's or Higher Degree, with tabulations and additional analysis by the MN State Demographic Center.
1 Disaggregating race categories into subgroups provides important contextual information on intra-racial educational attainment. Appendix B provides a finer examination of broad race groups which shows significant variation in Associate Degree or higher attainment within races, especially among Asian subgroups.
2 Holders of certificates as their highest post-secondary award were estimated using a cohort analysis method applied to administrative data on certificates awarded (supplied by the Minnesota State Colleges and Universities system and the Minnesota Office of Higher Education ) and produced by the MN State Demographic Center. Notes: Parts may not add to total due to rounding. Users are cautioned that these estimates contain sampling and other sources of error, not shown here. Race was imputed for certificates earned in which the race of the individual was unknown. Percentages were not calculated for the small group of individuals self-identifying as "other" race.
23%27%
35%
54%65%
65%60%
0% 10% 20% 30% 40% 50% 60% 70%
AMERICAN INDIANHISPANIC
BLACKMULTIRACIAL
ASIANWHITE
ALL
Percent of Population
Race
/Eth
nici
ty
Minnesota Office of Higher Education 3
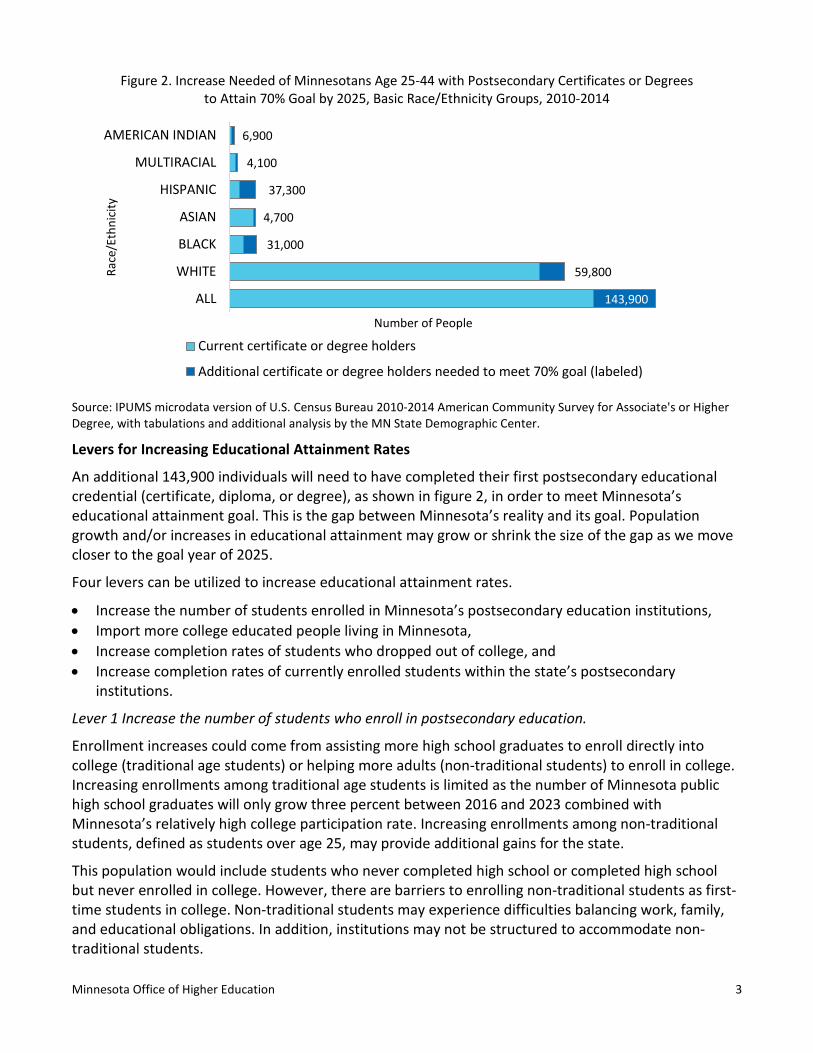
Figure 2. Increase Needed of Minnesotans Age 25-44 with Postsecondary Certificates or Degrees to Attain 70% Goal by 2025, Basic Race/Ethnicity Groups, 2010-2014
Source: IPUMS microdata version of U.S. Census Bureau 2010-2014 American Community Survey for Associate's or Higher Degree, with tabulations and additional analysis by the MN State Demographic Center.
Levers for Increasing Educational Attainment Rates
An additional 143,900 individuals will need to have completed their first postsecondary educational credential (certificate, diploma, or degree), as shown in figure 2, in order to meet Minnesota’s educational attainment goal. This is the gap between Minnesota’s reality and its goal. Population growth and/or increases in educational attainment may grow or shrink the size of the gap as we move closer to the goal year of 2025.
Four levers can be utilized to increase educational attainment rates.
• Increase the number of students enrolled in Minnesota’s postsecondary education institutions, • Import more college educated people living in Minnesota, • Increase completion rates of students who dropped out of college, and • Increase completion rates of currently enrolled students within the state’s postsecondary
institutions.
Lever 1 Increase the number of students who enroll in postsecondary education.
Enrollment increases could come from assisting more high school graduates to enroll directly into college (traditional age students) or helping more adults (non-traditional students) to enroll in college. Increasing enrollments among traditional age students is limited as the number of Minnesota public high school graduates will only grow three percent between 2016 and 2023 combined with Minnesota’s relatively high college participation rate. Increasing enrollments among non-traditional students, defined as students over age 25, may provide additional gains for the state.
This population would include students who never completed high school or completed high school but never enrolled in college. However, there are barriers to enrolling non-traditional students as first-time students in college. Non-traditional students may experience difficulties balancing work, family, and educational obligations. In addition, institutions may not be structured to accommodate non-traditional students.
143,900
59,800
31,000
4,700
37,300
4,100
6,900
ALL
WHITE
BLACK
ASIAN
HISPANIC
MULTIRACIAL
AMERICAN INDIAN
Number of People
Race
/Eth
nici
ty
Current certificate or degree holders
Additional certificate or degree holders needed to meet 70% goal (labeled)

4 Minnesota Office of Higher Education
Lever 2 Import educated workers into the state.
In-migration has proven to be an important lever of increasing the percentage of a state’s population who have postsecondary credentials. Prior to 2002, Minnesota experienced in-migrations of both domestic and international populations, leading to a robust total net gain in migration. Current projections from the Minnesota State Demographic Center show small positive rates of in-migration through 2030. Given current projections, in-migrants are unlikely to move the state substantially toward higher levels of educational attainment in the total population. In-migration of educated workers will not reduce gaps in educational attainment among persons who currently reside in Minnesota.
Lever 3 Increase completion rates of students who dropped out of college.
Among Minnesota adults age 25 to 44, an estimated 10 percent of the population dropped out without completing a certificate or degree. That is 143,000 individuals who enrolled in college and did not persist to achieve a certificate or degree. These former students expressed an initial desire to complete college, but for financial, personal, or other reasons, did not do so. This is a sizeable group in Minnesota—roughly the same number of persons needed to attain a postsecondary credential to reach the overall 70% goal. This group may have challenges in re-engaging in their studies due to a poor prior college experiences, greater family obligations later in life, or balancing current work schedules. The state could accelerate progress in meeting attainment goals by helping many of them complete studies.
Lever 4 Increase completion rates of undergraduates currently enrolled within the state’s postsecondary institutions.
Increasing institutional retention and completion rates among Minnesota undergraduates directly impacts state postsecondary educational attainment rates, and will place greater emphasis on students of color as they represent a larger share of current students now than any time previously. This may be one of the most direct and effective levers to meet Minnesota’s educational attainment goal and to reduce race and ethnic group gaps. Not all of Minnesota’s postsecondary institutions have the same success in graduating their undergraduates.
Strategies for Increasing Completion Rates
Increasing completion rates at Minnesota institutions requires changes at the institutional level. Institutions should adopt proven research-based best practices keeping students from underrepresented communities from leaving their college.
It is important to recognize that successful college strategies can, and often do, take multiple forms. These strategies are a collection of best practices that have been implemented across a range of institutions. Individual institutions must decide which practices would be the most beneficial for their student population. Four strategies addressed in this report are:
• Social and campus integration, which includes first-year programs, service-learning, and summer-bridge programs.
• Programs promoting long-term success, which includes proactive advising and degree mapping. • Alternative delivery models for developmental education, which includes paired courses,
mainstreaming into credit-bearing courses with added support, and co-curricular programming. • Emergency assistance programs addressing unforeseen student financial needs related to food and
housing insecurity.
Minnesota Office of Higher Education 5
The Bottom Line
Minnesota’s communities of color are projected to grow from 14 percent to 25 percent of the total population by 2035. Within postsecondary education, students of color are becoming a larger share of undergraduate enrollments. The state’s changing demographic profile requires the state to continue reducing postsecondary educational attainment gaps or the state’s economic future will be increasingly threatened. While ensuring equitable access to postsecondary education remains a priority, access without completion is neither affordable nor efficient for students or taxpayers of Minnesota.

6 Minnesota Office of Higher Education
Introduction The 2015 Minnesota Legislature enacted a state postsecondary educational attainment goal: 70 percent of Minnesota adults (age 25 to 44) will have attained a postsecondary certificate or degree by 2025 (Minn. Laws 2015 Chapter 69 Article 3 Sec. 6). To achieve this goal, Minnesota must address several disparities across the educational pipeline. • Disparity 1: Students of color graduate from high school within four years at a rate lower than
White students. • Disparity 2: Students of color enroll in college at a rate lower than White graduates. • Disparity 3: Undergraduates of color enroll primarily at two-year institutions. • Disparity 4: Undergraduates of color and non-English speakers enroll in developmental education
at higher rates. • Disparity 5: Undergraduates of color have lower college graduation rates.
Communities of color are growing in Minnesota, but have historically not been adequately served within Minnesota’s educational system. As a result, Minnesota faces significant race and ethnicity gaps in educational attainment outcomes from high school graduation to successful college completion.
Disparity 1: Students of color graduate from high school within four years at a rate lower than White students, 2015
In 2015, the four-year public high school graduation rate was 87 percent for White students, 83 percent for Asian students, 66 percent for Hispanic students, 62 percent for Black students, and 52 percent for American Indian students.3
Figure 3. Four-Year High School Graduation Race by Race/Ethnicity, 2015
3 Disaggregating race categories into subgroups provides important contextual information on intra-racial educational attainment. Appendix B provides a finer examination of broad race groups which shows significant variation in Associate Degree or higher attainment within races, especially among Asian subgroups.
82%
87%
83%
66%
62%
52%
11%
8%
11%
20%
24%
22%
5%
4%
3%
11%
10%
19%
0% 20% 40% 60% 80% 100%
All Students
White
Asian/Pacific Islander
Hispanic
Black
American Indian
Percentage of Students
Race
/Eth
nici
ty
Graduated Continuing Dropped Out UnknownSource: Minnesota Department of Education

Minnesota Office of Higher Education 7
Disparity 2: Students of color enroll in college at a rate lower than White graduates.
While Minnesota can be encouraged by an overall robust college participation rate, not all populations participate equally. For the high school graduation class of 2013, 79 percent of White students, 79 percent of Asian students, 72 percent of Blacks, 61 percent of Hispanic, and 61 percent of American Indian students enrolled in college within two years of high school graduation.
Figure 4. College Enrollment Rates of 2013 High School Graduates within 2 Years of High School Graduation
Source: Minnesota Office of Higher Education, SLEDS
Disparity 3: Undergraduates of color enroll primarily at two-year institutions.
Students of color more often choose to enroll at a two-year college as compared to White and Asian students who choose four-year institutions. The difference in college choices by race and ethnicity highlights a troubling stratification in Minnesota’s postsecondary system.
Figure 5. College Enrollments by Race/Ethnicity and Sector, Fall 2015, Minnesota
Source: Minnesota Office of Higher Education
61%
79%
61%72%
79%
0%
20%
40%
60%
80%
100%
American Indianor Alaska Native
Asian Hispanic Black or AfricanAmerican
White
Perc
ent o
f Pub
lic H
igh
Scho
ol G
radu
ates
Race/Ethnicity
Enrolled in Minnesota Enrolled Out-of-State
50% 44% 44% 36% 27% 23%
9%9% 6%
7%7% 10%
20%22% 23%
27% 39%24%
21% 26% 26% 30% 28%43%
0%
20%
40%
60%
80%
100%
White Asian Two or More Races Hispanic American Indian Black
Perc
ent o
f Stu
dent
s
Race/Ethnicity4-year full time 4-year part time 2-year full time 2-year part time
2-year colleges include state colleges and private career schools4-year colleges include state universities, University of Minnesota campuses and private colleges
8 Minnesota Office of Higher Education
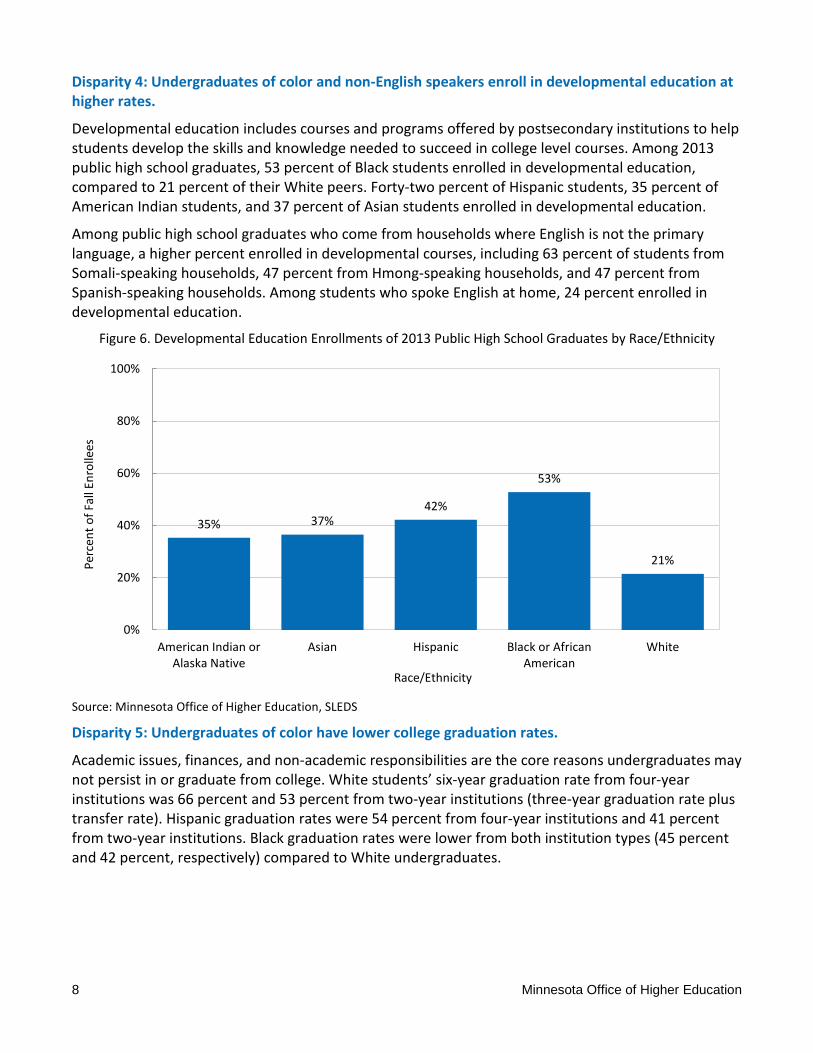
Disparity 4: Undergraduates of color and non-English speakers enroll in developmental education at higher rates.
Developmental education includes courses and programs offered by postsecondary institutions to help students develop the skills and knowledge needed to succeed in college level courses. Among 2013 public high school graduates, 53 percent of Black students enrolled in developmental education, compared to 21 percent of their White peers. Forty-two percent of Hispanic students, 35 percent of American Indian students, and 37 percent of Asian students enrolled in developmental education.
Among public high school graduates who come from households where English is not the primary language, a higher percent enrolled in developmental courses, including 63 percent of students from Somali-speaking households, 47 percent from Hmong-speaking households, and 47 percent from Spanish-speaking households. Among students who spoke English at home, 24 percent enrolled in developmental education.
Figure 6. Developmental Education Enrollments of 2013 Public High School Graduates by Race/Ethnicity
Source: Minnesota Office of Higher Education, SLEDS
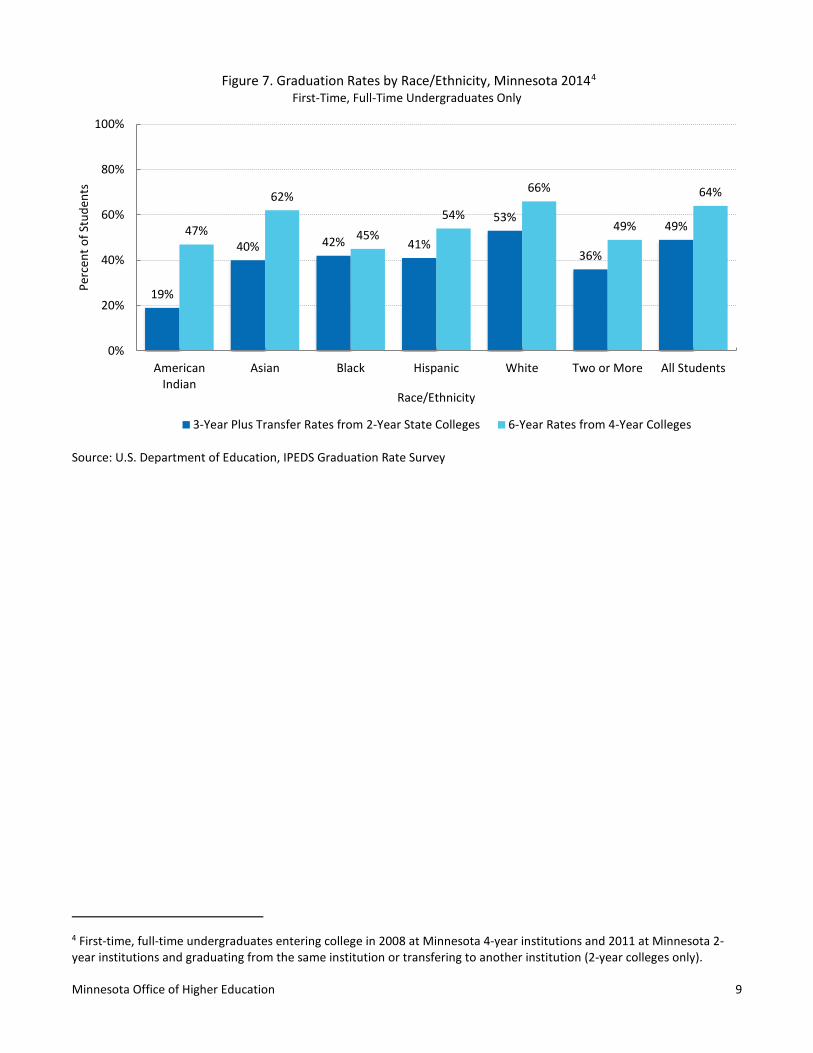
Disparity 5: Undergraduates of color have lower college graduation rates.
Academic issues, finances, and non-academic responsibilities are the core reasons undergraduates may not persist in or graduate from college. White students’ six-year graduation rate from four-year institutions was 66 percent and 53 percent from two-year institutions (three-year graduation rate plus transfer rate). Hispanic graduation rates were 54 percent from four-year institutions and 41 percent from two-year institutions. Black graduation rates were lower from both institution types (45 percent and 42 percent, respectively) compared to White undergraduates.
35% 37%42%
53%
21%
0%
20%
40%
60%
80%
100%
American Indian orAlaska Native
Asian Hispanic Black or AfricanAmerican
White
Perc
ent o
f Fal
l Enr
olle
es
Race/Ethnicity
Minnesota Office of Higher Education 9
Figure 7. Graduation Rates by Race/Ethnicity, Minnesota 20144 First-Time, Full-Time Undergraduates Only
Source: U.S. Department of Education, IPEDS Graduation Rate Survey
4 First-time, full-time undergraduates entering college in 2008 at Minnesota 4-year institutions and 2011 at Minnesota 2-year institutions and graduating from the same institution or transfering to another institution (2-year colleges only).
19%
40% 42% 41%
53%
36%
49%47%
62%
45%54%
66%
49%
64%
0%
20%
40%
60%
80%
100%
AmericanIndian
Asian Black Hispanic White Two or More All Students
Perc
ent o
f Stu
dent
s
Race/Ethnicity
3-Year Plus Transfer Rates from 2-Year State Colleges 6-Year Rates from 4-Year Colleges
10 Minnesota Office of Higher Education
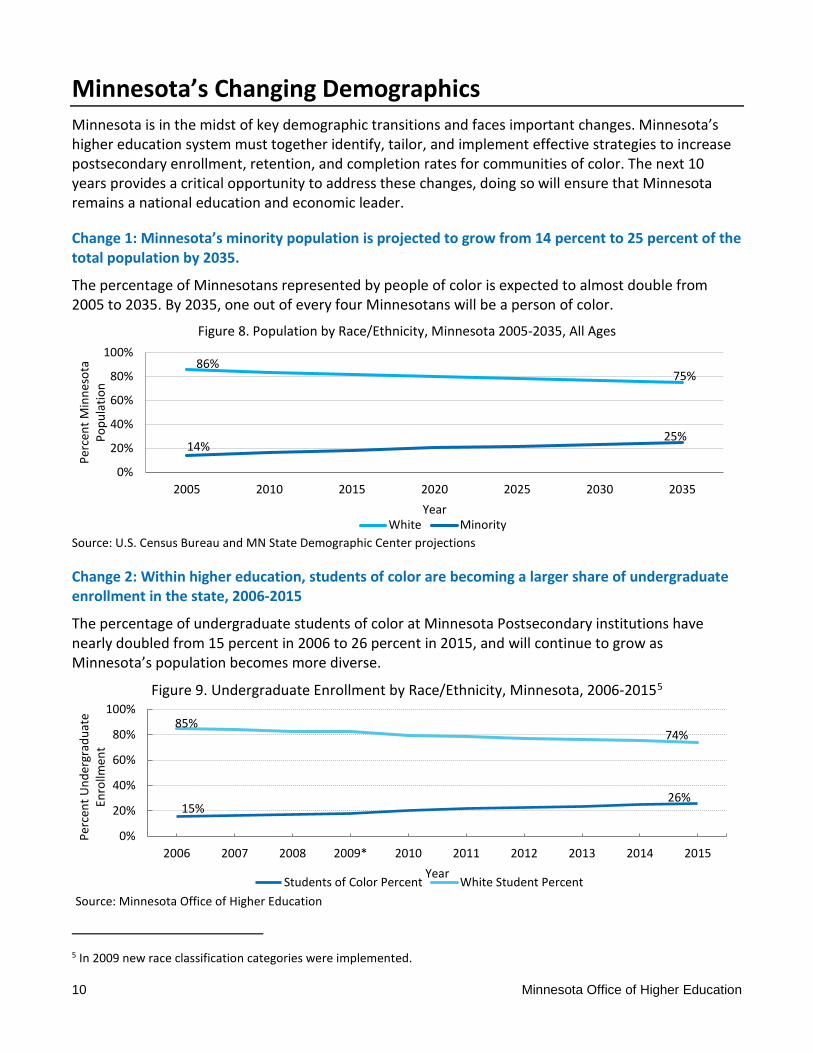
Minnesota’s Changing Demographics Minnesota is in the midst of key demographic transitions and faces important changes. Minnesota’s higher education system must together identify, tailor, and implement effective strategies to increase postsecondary enrollment, retention, and completion rates for communities of color. The next 10 years provides a critical opportunity to address these changes, doing so will ensure that Minnesota remains a national education and economic leader.
Change 1: Minnesota’s minority population is projected to grow from 14 percent to 25 percent of the total population by 2035.
The percentage of Minnesotans represented by people of color is expected to almost double from 2005 to 2035. By 2035, one out of every four Minnesotans will be a person of color.
Figure 8. Population by Race/Ethnicity, Minnesota 2005-2035, All Ages
Source: U.S. Census Bureau and MN State Demographic Center projections
Change 2: Within higher education, students of color are becoming a larger share of undergraduate enrollment in the state, 2006-2015
The percentage of undergraduate students of color at Minnesota Postsecondary institutions have nearly doubled from 15 percent in 2006 to 26 percent in 2015, and will continue to grow as Minnesota’s population becomes more diverse.
Figure 9. Undergraduate Enrollment by Race/Ethnicity, Minnesota, 2006-20155
Source: Minnesota Office of Higher Education 5 In 2009 new race classification categories were implemented.
86%75%
14%25%
0%
20%
40%
60%
80%
100%
2005 2010 2015 2020 2025 2030 2035
Perc
ent M
inne
sota
Po
pula
tion
YearWhite Minority
15%26%
85%74%
0%
20%
40%
60%
80%
100%
2006 2007 2008 2009* 2010 2011 2012 2013 2014 2015
Perc
ent U
nder
grad
uate
En
rollm
ent
YearStudents of Color Percent White Student Percent

Minnesota Office of Higher Education 11
Minnesota’s Educational Attainment Rate 2016 The law requires the Office of Higher Education to track the percentage of Minnesotans ages 25 to 44 who have obtained a postsecondary credential (certificate, diploma, or degree) and to provide estimates by race and ethnicity.
2016 Estimates
An estimated 60 percent of Minnesotans age 25 to 44 in 2010 – 2014 had attained a postsecondary certificate or higher. The number of Minnesotans age 25 to 44 who had obtained a postsecondary credential is the sum of the percent of individuals with an associate degree or higher (51.6 percent) plus the estimated percent of individuals with an undergraduate postsecondary certificate but not a degree (8.2 percent). Results were estimated by race and ethnicity and the full population for the specified age groups to determine Minnesota’s baseline postsecondary educational attainment rate. The estimates should be not be interpreted as fixed values but the likely attainment rate for each group in the population, given the margin of error.
As shown in Figure 1, none of the base racial and ethnic groups in Minnesota age 25 to 44 are currently attaining a 70 percent postsecondary attainment rate. Postsecondary educational attainment differences by race and ethnicity in Minnesota mirror gaps in educational achievement found at the elementary and secondary levels. Closing gaps in achievement and ensuring all students are college and career ready is critical to meeting the 70 percent achievement goal.
Figure 1. Minnesota’s Estimated Population Age 25 to 44 with a Certificate or Higher Credential, by Basic Race and Ethnicity Categories, 2010-20146 7
Source: IPUMS microdata version of U.S. Census Bureau 2010-2014 American Community Survey for Associate's or Higher Degree, with tabulations by the MN State Demographic Center.
6 Holders of certificates as their highest post-secondary award were estimated using a cohort analysis method applied to administrative data on certificates awarded (supplied by the Minnesota State Colleges and Universities system and the Minnesota Office of Higher Education ) and produced by the MN State Demographic Center. Notes: Estimates have been rounded to the nearest 100 or whole percent. Parts may not add to total due to rounding. Users are cautioned that these estimates contain sampling and other sources of error, not shown here. Race was imputed for certificates earned in which the race of the individual was unknown. Percentages were not calculated for the small group of individuals self-identifying as "other" race. 7 Disaggregating race categories into subgroups provides important contextual information on intra-racial educational attainment. Appendix B provides a finer examination of broad race groups which shows significant variation in Associate Degree or higher attainment within races, especially among Asian subgroups.
23%27%
35%54%
65%65%
60%
0% 10% 20% 30% 40% 50% 60% 70%
AMERICAN INDIANHISPANIC
BLACKMULTIRACIAL
ASIANWHITE
ALL
Percent of Population
Race
/Eth
nici
ty

12 Minnesota Office of Higher Education
Increases Needed to Meet the 70 Percent Goal by 2025
In order to meet the 70 percent goal for all racial and ethnic groups, Minnesota needs an additional 143,900 individuals age 25 to 44 to complete their first postsecondary educational credential (certificate, diploma, or degree) by 2025, as shown in Figure 2.
Figure 2. Increase Needed of Minnesotans Age 25-44 with Postsecondary Certificates or Degrees to Attain 70% Goal by 2025, Basic Race/Ethnicity Groups, 2010-2014
Source: IPUMS microdata version of U.S. Census Bureau 2010-2014 American Community Survey for Associate's or Higher Degree, with tabulations and additional analysis by the MN State Demographic Center.
Table 1 shows the number of additional persons within each race group needed to earn a certificate, diploma or degree to raise that group’s attainment rate to 70 percent.
Table 1. Increase Needed by Minnesotans Age 25 to 44 with Postsecondary Certificates or Degrees to Attain 70% Goal by 2025, Basic Race Categories, 2010 – 2014
Group
Persons Age 25-44 in 2010-
2014
Number Holding a Certificate or
Higher Degree in 2010-2014
Percent Holding a Certificate or Higher
Degree in 2010-2014
Additional Percentage
Points Needed to Attain 70% Goal by 2025
Additional Population
Needed to Attain 70% Goal by 2025
American Indian 14,700 3,400 23% 47% 6,900
Asian 84,900 54,700 65% 5% 4,700
Black 89,200 31,400 35% 35% 31,000
Multiracial 25,400 13,700 54% 16% 4,100
White 1,110,300 717,400 65% 5% 59,800
Hispanic 86,100 23,000 27% 43% 37,300
Other 1,400 N/A N/A N/A N/A
ALL 1,412,100 844,600 60% 10% 143,900 Source: IPUMS microdata version of U.S. Census Bureau 2010-2014 American Community Survey for Associate's or Higher Degree, with tabulations and additional analysis by the MN State Demographic Center.
143,900
59,800
31,000
4,700
37,300
4,100
6,900
ALL
WHITE
BLACK
ASIAN
HISPANIC
MULTIRACIAL
AMERICAN INDIAN
Number of People
Race
/Eth
nici
ty
Current certificate or degree holders
Additional certificate or degree holders needed to meet 70% goal (labeled)
Minnesota Office of Higher Education 13
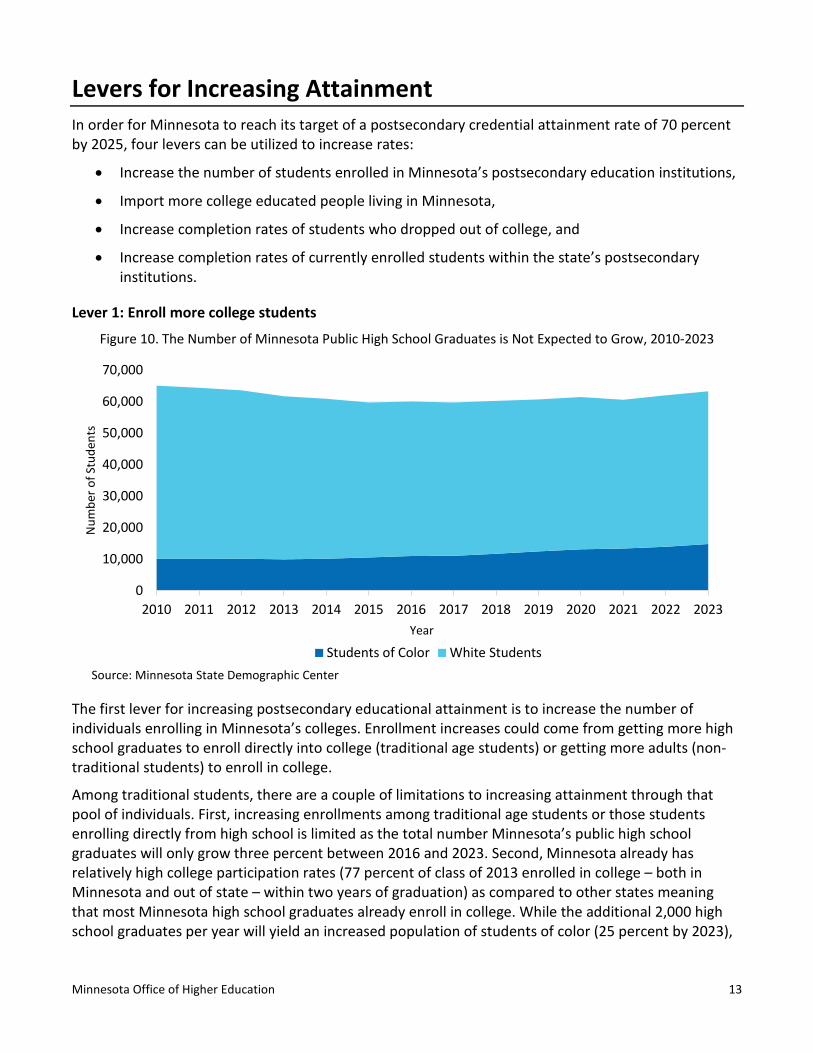
Levers for Increasing Attainment In order for Minnesota to reach its target of a postsecondary credential attainment rate of 70 percent by 2025, four levers can be utilized to increase rates:
• Increase the number of students enrolled in Minnesota’s postsecondary education institutions,
• Import more college educated people living in Minnesota,
• Increase completion rates of students who dropped out of college, and
• Increase completion rates of currently enrolled students within the state’s postsecondary institutions.
Lever 1: Enroll more college students
Figure 10. The Number of Minnesota Public High School Graduates is Not Expected to Grow, 2010-2023
The first lever for increasing postsecondary educational attainment is to increase the number of individuals enrolling in Minnesota’s colleges. Enrollment increases could come from getting more high school graduates to enroll directly into college (traditional age students) or getting more adults (non-traditional students) to enroll in college.
Among traditional students, there are a couple of limitations to increasing attainment through that pool of individuals. First, increasing enrollments among traditional age students or those students enrolling directly from high school is limited as the total number Minnesota’s public high school graduates will only grow three percent between 2016 and 2023. Second, Minnesota already has relatively high college participation rates (77 percent of class of 2013 enrolled in college – both in Minnesota and out of state – within two years of graduation) as compared to other states meaning that most Minnesota high school graduates already enroll in college. While the additional 2,000 high school graduates per year will yield an increased population of students of color (25 percent by 2023),
0
10,000
20,000
30,000
40,000
50,000
60,000
70,000
2010 2011 2012 2013 2014 2015 2016 2017 2018 2019 2020 2021 2022 2023
Num
ber o
f Stu
dent
s
Year
Students of Color White StudentsSource: Minnesota State Demographic Center

14 Minnesota Office of Higher Education
it will not yield a large enough number of individuals through high school graduates alone needed to meet the 70 percent goal.8
Increasing enrollments among non-traditional students, defined as students over age 25, may provide additional gains for the state. This population would include students who never completed high school or completed high school but never enrolled in college. An estimated 27 percent of Minnesotans age 25 to 44 or 377,000 individuals fall into this group. However there are barriers to enrolling non-traditional students as first-time students in college. Non-traditional students may experience difficulties balancing work, family, and educational obligations.
In addition, institutions may not be structured to accommodate non-traditional students. Facilitating nontraditional student enrollment may require institutions to redesign office and class hours, rethink student services, redefine ways students can get involved in institutional life, create additional credit acceptance policies for life and work experiences, and possibly change admissions criteria.9 Postsecondary undergraduates in this group currently tend to enroll part-time in higher percentages and have lower completion rates.
In conclusion, to positively impact the state’s postsecondary educational attainment rate two changes need to occur simultaneously: more of the state’s population needs to enroll in undergraduate education and postsecondary institutions need to accommodate the diverse and changing needs of currently enrolled undergraduates.
Lever 2: Import college-educated people to the state (in-migration)
In-migration has proven to be an important lever of increasing the percentage of a state’s population who have postsecondary credentials. This is especially significant for geographic areas where there is not a large home-grown college-educated population.
Prior to 2002, Minnesota experienced in-migrations of both domestic and international populations, leading to a robust total net gain in migration. While Minnesota still has a positive net in-migration rate, it is largely fueled by new international migrants. Beginning in 2001, the state has displayed a negative net domestic in-migration rate caused by more people leaving Minnesota than more people moving into Minnesota from other U.S. states. According to the Minnesota State Demographer, from 1990-1999 there were 15,500 in-migrants annually, while there were only 6,000 in-migrants annually from 2011-201410.
8 Minnesota State Demographic Center. Minnesota High School Graduates to Peak in 2010. https://www.ohe.state.mn.us/mPg.cfm?pageID=1290 9 Fairchild, E. E. (2003). Multiple roles of adult learners. New directions for student services, 2003(102), 11-16.
10 Minnesota State Demographic Center. 2015. Minnesota on the Move: Migration Patterns & Implications. St. Paul, MN: Minnesota State Demographic Center.

Minnesota Office of Higher Education 15
Figure 11. Minnesota’s Total Net Migration Has Declined, 1991-201411
Source: U.S. Census Bureau, Population Estimates Program.
The Minnesota State Demographic Center notes that except for the Dakotas, Minnesota’s pattern of negative domestic in migration, but positive international in-migration holds for all other states in the Midwest. Current projections from the Minnesota State Demographic Center shows that the small positive rate of in-migration will increase through 2030 but never regain levels seen between 1990 and 1999. Given current projections, in-migrants are unlikely to move the state substantially toward higher levels of educational attainment in the total population. In addition, in-migration of educated workers will not reduce gaps in educational attainment among persons currently residing in Minnesota.
Lever 3: Increase completion rates among adults with some college but no undergraduate credential
Among Minnesota adults age 25 to 44, an estimated 10 percent of the population or 143,000 individuals enrolled in college but dropped out without completing a certificate or degree, as shown in Figure 12. The 143,000 individuals includes:
• 2,300 American Indians • 5,900 Asians • 11,800 Blacks • 5,300 Hispanics • 3,300 Multiracial Minnesotans • 114,300 Whites
11 Note: 2000 data was interpolated.
-15,000
-10,000
-5,000
0
5,000
10,000
15,000
20,000
25,000
1991
1992
1993
1994
1995
1996
1997
1998
1999
2000
2001
2002
2003
2004
2005
2006
2007
2008
2009
2010
2011
2012
2013
2014
Popu
latio
n
YearInternational Net Domestic Net

16 Minnesota Office of Higher Education
Figure 12. Minnesotans Age 25-44 by Educational Attainment12
Source: IPUMS microdata version of U.S. Census Bureau 2010-2014 American Community Survey for Associate's or Higher Degree, with tabulations and additional analysis by the MN State Demographic Center.
Assisting these individuals in completing college will move Minnesota closer toward its educational attainment goal. However, this lever will have limited effective over time. College graduation rates have been slowly increasing each year and an increased percentage of younger adults have college degrees. In combination these trends should diminish the number of people in this age group who have dropped out of college over time. Additionally, encouraging these older (non-traditional) students to re-enroll and complete college presents a challenge for institutions as discussed in the first lever.
Lever 4: Increase retention and completion rates among currently enrolled undergraduates
Completing college is a goal of most students entering college. Not all students, however, complete their studies. While some students will transfer and complete their program at another institution, others will drop out of college altogether.
For institutions, high completion rates may indicate appropriately targeted student recruitment, effective campus communications, appropriate scheduling, quality instruction, proactive advising, and accessible student support services. Other variables, such as the academic preparation of students, college admissions policies, and financial support also influence institutional completion rates.
For students, the decision to stay in or drop out of college may include a wide range of reasons: not finding the right institutional fit, being academically underprepared for college, inadequate institutional supports, or family or personal circumstances. In addition, research highlights the importance of students having “college knowledge”. College knowledge encompasses contextual awareness and non-cognitive skills. Contextual awareness refers to having awareness of admissions requirements, costs, and programs of study, postsecondary goals, and types of institutions. Non-
12 Holders of certificates as their highest post-secondary award were estimated using a cohort analysis method applied to administrative data on certificates awarded (supplied by the Minnesota State Colleges and Universities system and the Minnesota Office of Higher Education ) and produced by the MN State Demographic Center. Notes: Estimates have been rounded to the nearest 100 or whole percent. Parts may not add to total due to rounding. Users are cautioned that these estimates contain sampling and other sources of error, not shown here.
52%
8%
10%
3%
27%Associate Degree or Higher
Certificate
Dropouts
Current Students
High School Graduate or Less

Minnesota Office of Higher Education 17
cognitive skills include the ability to build relationships with professors and peers while establishing a sense of belonging within the community.
Students from underrepresented groups such as students of color and first-generation students, may acquire less college knowledge as compared to peers. Students lacking in college knowledge are less likely than their peers to enroll in “best-fit” institutions that match their aspirations and abilities. Students who belong to communities that do not historically have a college-going culture or do not have family members or role models who have graduated from college, often do not gain access to meaningful college planning and preparation materials.
Increasing institutional retention and completion rates among Minnesota undergraduates directly impacts state postsecondary educational attainment rates, especially for students of color. However, not all of Minnesota’s postsecondary institutions have the same success in graduating their first time, full-time undergraduates. Graduation rates vary considerably from institution to institution. In 2014, the six-year graduation rates at four-year institutions ranged from 34 percent to 93 percent. The overall 2014 three-year graduation rate of first time, full-time undergraduates at Minnesota State Colleges was 27 percent with an additional 22 percent transfer rate. Institutions ranged from 14 to 58 percent graduation rate and 35 to 71 percent graduation plus transfer rate.
Graduation rates varied by race and ethnicity of undergraduates. White undergraduates had a six-year graduation rate of 66 percent from four-year institutions and a three-year graduation rate (including transfers) of 53 percent from two-year institutions. This is compared to 54 percent for Hispanic or Latino students from four-year institutions and 41 percent from two-year institutions. Black student graduation rates were lower from both institution types (45 percent and 42 percent, respectively). Closing gaps in institutional graduation rates as well as increasing graduation rates for all students will positively increase the percentage of Minnesota’s population with a postsecondary credential.
Summarizing the Comparative Impact of the Four Levers
In order for Minnesota to reach its target of a 70 percent postsecondary attainment rate by 2025, among 25 to 44 olds, all four levers discussed above will incrementally increase educational attainment. While each lever can positively impact the postsecondary educational attainment of Minnesota’s 25 to 44 year old population, the overall impact of each lever varies and no one lever alone will contribute enough for Minnesota to reach its goal. Each lever has limitations and positive impacts.
• Increase the number of students enrolling in postsecondary education.
Minnesota’s annual number of high school graduates is not expected to grow, thus the overall impact of enrolling more students directly from high school is limited.
• Import educated workers into the state.
At the current rate of in-migration there will not be a sufficient number of individuals to move the state substantially toward the needed higher levels of educational attainment. In-migration of college-educated workers alone will not reduce gaps in educational attainment among persons currently residing in Minnesota. While in-migration can increase the human capital of Minnesota, this is not something that can be controlled directly by state government or the private sector.

18 Minnesota Office of Higher Education
• Increase completion rates of students who dropped out of college.
This lever will move Minnesota closer toward its postsecondary educational attainment goal. However, this lever will have limited effectiveness over time as more individuals complete their programs and this group will be a smaller percentage of the population.
• Increase completion rates of undergraduates currently enrolled within the state’s postsecondary institutions.
This lever allows for the systemic change to occur that will increase the rates of attainment for underrepresented students. This may be the most direct and effective lever to meet Minnesota’s educational attainment goal and to reduce race and ethnic group gaps.
Minnesota Office of Higher Education 19
Best-Practice Strategies to Increase Completion To increase completion rates at Minnesota institutions, change must occur at the institutional level. Institutions should adopt, from the first day of enrollment, proven research-based best practices that keep students from underrepresented communities from leaving college. College success strategies can and often do take multiple forms, including:
• Social and campus integration
• Programs that promote long-term success
• Alternative delivery models for developmental education
• Emergency assistance
Utilizing a best-practice approach to increase completion and attainment may also require a different approach by the state in how it funds postsecondary institutions. The most direct approach to funding best practice strategies is to provide targeted funding with clearly defined goals of increasing completion and reducing completion gaps by race and ethnicity.
Each strategy discussed below will not necessarily be applicable to every institution. Instead, these are a collection of best practices that have been implemented across a range of institutions. Individual institutions must decide which practices would be the most beneficial for their student population.
Best-Practice Strategy: Social and Campus Integration
Target population: Students of color, first-generation college students, low-income students
Successful social integration into a college environment is beneficial for students. Social integration requires a sense of belonging on campus, which is fostered by the informal connections created with peers and faculty outside of the classroom.13 First-generation college students are often at a distinct disadvantage because of their lack of knowledge about the postsecondary process. Campus integration is greater for students whose parents attended college, first-generation students are less likely to persist and complete their degree than their peers.14
Opportunities to increase social and campus integration can occur in many formats including:
• First-year programs
• Service-learning
• Summer-bridge programs
First-year programs
Many institutions have implemented first-year programs or seminars bringing small groups of students together with faculty or staff on a regular basis to increase social integration. First-year programs place
13 Tinto, V. 1997. Colleges as Communities: Exploring the Educational Character of Student Persistence. Journal of Higher Education 68 (6). 14 Terenzini, P. T., Rendon, L. I., Upcraft, M. L., Millar, S. B., Allison, K. W., Gregg, P. L., & Jalomo, R. (1994). The transition to college: Diverse students, diverse stories. Research in Higher Education, 35(1), 57-73.

20 Minnesota Office of Higher Education
a strong emphasis on skills (e.g. critical analysis, intensive writing, information literacy and collaborative learning) that simultaneously develop students’ intellectual and practical competencies. First-year programs can also provide students the opportunity to engage with faculty members in research.15
Examples
The College of Liberal Arts First-Year Experience (FYE) at the University of Minnesota is an online, two-credit program (CLA 1001 & 1002) that first-year students take part in over the course of their first year. This program is designed to provide students with resources on degree planning, career advising, health and wellness, and campus engagement. In addition, students are paired with a FYE Section Leader, who mentors students on regarding student groups, campus jobs, housing, etc.16
Saint Cloud State University offers the Multicultural First Year Experience (MFYE) program. Using a first-year cohort model, this program offers an interdisciplinary approach to the study of race, ethnicity, identity, gender and community in the United States. MFYE encourages academic rigor and supports student success, improves retention rates and creates a community of students of color on Saint Cloud’s campus.17
Service-learning programs
Service learning provides a unique opportunity for students to develop a sense of belonging by engaging with their community, their college peers, and faculty. Studies have shown that students who participate in community engagement or service learning report a higher sense of personal efficacy and belonging which positively impacts college completion.
Examples
The University of Minnesota Twin Cities, Community Engagement Scholars Program recognizes students who undertake more than 400 hours of community volunteering as part of their educational experiences. Students take eight credits of service learning coursework and participate in structured reflections. Upon completing a final project based on a community identified need, students receive official recognition at graduation and on their academic transcript. Since its inception, enrollment in the program has grown five-fold, with more than 500 students now participating. Of these students, approximately 20 percent are honors students.
Century College has a strong and active service-learning program. Since it began in 2000, over 13,000 Century students have participated in service learning and students have contributed over 200,000 hours of service to the community. Approximately 2,000 Century students participate in service learning each year with service learning incorporated into over 40 percent of the programs at Century College.
15 Kuh, G.D. 2008. High-impact educational practices: What they are, who has access to them, and why they matter. Washington, DC: Association of American Colleges and Universities. 16 University of Minnesota College of Liberal Arts. 2016. CLA 1001/1002: The First-Year Experience. https://cla.umn.edu/academics-experience/signature-cla-courses/cla-10011002-first-year-experience 17 St. Cloud State University. 2016. First Year and Transition Program (FYTP). http://www.stcloudstate.edu/fytp/

Minnesota Office of Higher Education 21
Augsburg College contains a service-learning component integrated into many of their courses. Over 70 courses at Augsburg contain an embedded service-learning component. In addition, all incoming first-year students must participate in City Service Day the day before the fall semester begins. Here, students participate in service projects in the neighborhoods that surround Augsburg.18
Summer bridge programs
Summer bridge programs are another strategy to increase social and campus integration. Summer bridge programs help ease the transition from high school to postsecondary education by providing college-going knowledge and other student success skills. While bridge programs at institutions can serve a wide array of students (e.g. international, underrepresented and disabled students, along with students in specific fields of study), the main focus of all of these programs is to provide additional support for students.19
Examples
The TRIO/Student Support Services (SSS) Summer Bridge Program at Augsburg College provides 25 admitted first-year students the opportunity to gain a head start on the postsecondary education. Participants spend five weeks living on campus attending courses, academic support seminars, workshops, and other activities to facilitate a smoother transition to the fall semester.20
Institutions of the Minnesota State system offer many summer bridge or transition programs. The Summer Bridge at Southwest Minnesota State University provides 15-20 students the opportunity to enroll in 10 credits, seven of which meet requirements in the Liberal Arts Core and three of which count as electives toward their desired degree program. Tuition is waived for seven of the 10 credits.21
Riverland Community College’s Be Your Best College Prep Academy is a free program for teens and young adults between the ages of 16 and 22. At Be Your Best, students have the opportunity to take pre‐college Math, Reading, Writing, and Career Planning. Students receive guidance and support from dedicated instructors, advisors, counselors and tutors. Students also benefit from the educational seminars designed for college success and participate in leadership, volunteer activities and field trips.22
Best-Practice Strategy: Programs Promoting Long-Term Academic Success
Target population: first-generation college students, academically underprepared students, all students
Academic success (e.g. course grades) strongly predicts whether or not a student will complete their postsecondary education. However, research suggests that helping students understand course content alone only addresses immediate rather than long-term success. Students may fail to develop
18 Augsburg College Martin Olav Sabo Center for Democracy and Citizenship. 2016. Service Learning. http://www.augsburg.edu/sabo/what-we-do/service-learning/ 19 Tinto, V. 1997. Colleges as Communities: Exploring the Educational Character of Student Persistence. Journal of Higher Education 68 (6). 20 Augsburg College. TRIO/Student Support. Services. 2016. http://www.augsburg.edu/triosss/ 21 Southwest Minnesota State University. 2016. Summer Bridge Information. http://www.smsu.edu/campuslife/accessopportunitysuccess/?id=6958 22 Riverland Community College. 2016. Be Your Best / College Prep Academy. http://www.riverland.edu/beyourbest/

22 Minnesota Office of Higher Education
adequate academic self-confidence, identify personal academic goals, be motivated to achieve, and gain needed social supports and involvement with peers needed to complete their education.23
Upon enrolling in college, students are provided with an extensive list of courses and choices of majors but may not understand how to fulfill or plan for program requirements. Students may not understand how term-by-term course choices align or fail to align with program requirements. As a result, students may repeatedly change programs or majors or accumulate excess elective credits.24 These actions may reduce the likelihood of completion.
Proactive advising and degree mapping
One strategy to facilitate long-term academic success is proactive advising. Proactive advising, also called intrusive advising, occurs when a professional advisor regularly initiates contact with the student, as opposed to the student contacting the advisor.25 Each student is assigned a professional advisor to assist with degree program modifications, financial aid issues, and classroom-based issues. During advising sessions, the advisor helps develop the student’s problem-solving and decision making skills by working through problems together. In this centralized advising structure, full-time professional advisors can focus solely on assisting students with their academic, career and life goals.26
Many proactive advising programs use an “early alert system,” which allows advisors to identify and assist students who are at risk or failing particular courses before they withdraw from the college. An early alert system tracks a student’s attendance in all their classes, and when they use on-campus resources (e.g. tutoring centers). When alerted advisors contact students so to discuss potential difficulties or barriers and identify possible solutions.27
Proactive advising is often paired with degree mapping. Degree mapping lays out the required sequence of classes a student must complete to obtain a given certificate or degree. It details the classes required for each semester. In return, the institution may commit to offering those planned classes for all students enrolled in a specified program. Based on the selected degree plan, a student can see how many semesters are needed to complete and what future courses will be offered. If a student withdraws, fails a course or decides to change programs, their plan is updated. Students can also see how their program plan would change with different decisions, allowing them to play with hypothetical scenarios in the system before finalizing their choices.28
Examples
North Hennepin Community College (NHCC) has an Early Alert system, which allows advisors to identify and assist students who are missing classes or failing particular courses before they withdraw from the
23 Lotkowski, V., S. Robbins, and R. Noeth. (2004). The Role of Academic and Non-Academic Factors in Improving College Retention. ACT Inc. 24 Complete College America. (Winter 2012). Guided Pathways to Success (GPS): Boosting College Completion. Report retrieved from http://completecollege.org/docs/GPS_Summary_FINAL.pdf. 25 Earl, W. R. (1988). Intrusive advising of freshmen in academic difficulty. NACADA Journal, 8, 27-33. 26 King, M. C. (2005). Developmental academic advising. NACADA Clearinghouse of Academic Advising 27 Hudson, W. (2005). Can an Early Alert Excessive Absenteeism Warning System Be Effective in Retaining Freshman Students? Journal of College Student Retention. 7(3). 28 Complete College America.(2012) Guided Pathways to Success: Boosting College Completion.

Minnesota Office of Higher Education 23
college. The Early Alert system tracks attendance in all classes, as well as when students use on-campus resources (e.g. tutoring centers and the fitness center). When students are identified by an early alert, they are contacted by their advisor so they can meet with them about their progress.29
Minnesota State University—Mankato also utilizes customized degree plans and Early Alert, plus its own system called MavCARES. MavCARES is a comprehensive student success program. MavCARES intentionally reaches out to students and families at key points during the semester. For example, current students call new students to ask them how their year is going.
Best-Practice Strategy: Alternative delivery models for developmental education
Target population: first-generation college students, high school graduates that are not “college-ready,” low-income students
According to the Office of Higher Education’s Getting Prepared 2016 report, 26 percent of 2013 public high school graduates in Minnesota enrolled in one or more developmental courses within two years of graduating high school.30 These students are disproportionately students of color and low-income students. Studies have shown that enrollment in developmental education courses may negatively impact student completion as these courses require additional time, may lessen the student’s confidence in their academic abilities, and increases the costs of higher education.31 Alternative models of structuring developmental education include paired courses, mainstreaming with support, and co-curricular programming. These models augment standard instruction with additional academic supports allowing the student to complete developmental education faster and without additional costs.
In the paired course model, institutions connect a developmental course to a college-level course in a complementary subject area. Students learn content in the college-level course (history, for example), while developing basic skills in the developmental course (writing). This method of instruction allows students to receive college credit while still getting extra support from a non-credit course.32
The mainstreaming model allows developmental students to enroll in college-level courses by adding supplemental academic supports. Supplemental support can come in the form of mandatory companion classes, lab sessions, integrated tutorial support or additional class sessions.33
29 North Hennepin Community College. 2016. AgileGrad. http://www.nhcc.edu/student-resources/academic-advising/agilegrad 30 Minnesota Office of Higher Education. (2016). Getting Prepared: Recent high school graduates and developmental courses. St. Paul, MN. 31 Bailey, T., Jeong, D. W., & Cho, S. (2008). Referral, enrollment and completion in developmental education sequences in community colleges. New York, NY: Community College Research Ctr. Completion by Design. (2012). Student voices on the higher education pathway: Preliminary insights & stakeholder engagement considerations. San Francisco, CA: WestEd. 32 Bragg, D. D. (2009). Community College of Denver: Breaking Through outcomes report. Denver, CO: Community College of Denver. 33 Adams, P., Gerhart, S., Miller, R., & Roberts, A. (2009). The accelerated learning program: Throwing open the gates. Journal of Basic Writing, 28(2), 50–69.

24 Minnesota Office of Higher Education
Co-curricular programing is a model of acceleration that requires students to take fewer developmental courses overall. This can involve collapsing multiple developmental courses into a one-semester course or developing a single remediation course for a specific academic program.34
Examples
Campuses within the Minnesota State system have increasingly implemented alternative models of developmental education in recent years. Alternatively-structured developmental courses in reading, writing, and mathematics are each currently in place in at least 80 percent of Minnesota State campuses, respectively. Evidence shows that from 2012 to 2016, the percentage of students enrolled in developmental courses across the Minnesota State system has steadily declined.35
Tutors Linked to Classes (TLC) at Century College places experienced students in classes to provide tutoring and supplementary instruction.36
Minneapolis Community and Technical College, North Hennepin Community College, Normandale Community College and Ridgewater College have implemented the Quantway or Statway mathematics curriculum that was developed by the Carnegie Foundation for Teaching. The redesigned sequence enables students to complete a single developmental course and a college‐level math course in two semesters.
North Hennepin Community College redesigned its English course sequence to incorporate two credits of supplemental developmental instruction with the four credit college composition course so students could complete the sequence in one semester.
Best-Practice Strategy: Emergency assistance
Target population: low-income students, first-generation college students
Emergency needs such as housing and food insecurity pose barriers to college completion. The lack of permanent and adequate housing, inconsistent access to food, and inability to access reliable transportation places enormous pressure on students. When combined with educational costs, many Minnesota low-income students may be one small financial crisis away from dropping out of school. Exacerbating this problem is that students experiencing emergency needs may be reluctant to disclose their situation to school officials, resulting in underreporting and an inability to access additional resources. Minneapolis Community and Technical College found that 10 percent of students were experiencing homelessness.37 According to the 2015 College Student Health Survey of students at 17 Minnesota postsecondary institutions, 16 percent experienced a food shortage.38
34 Hern, K. (with Snell, M.) (2010). Exponential attrition and the promise of acceleration in developmental English and math. Hayward, CA: Chabot College. 35 Minnesota State Board of Trustees Academic and Student Affairs Committee. (October 18, 2016). 36 Rystrom, A. (2013). Tutors Linked to Classes: An Innovative Supplemental Instruction Model Modified to Meet the Needs of Community College Students. Achieving the Dream meeting. 37 Kohl, L. (Ed.). (2011, Spring). The faces of homelessness. Minnesota State Colleges and Universities Magazine, 6(2), 26-27. Retrieved from http://www.mnscu.edu/media/publications/pdf/mnstate-magazine-spring2011.pdf. 38 Lust, K. (2015). 2015 College Student Health Survey Report: Health and Health-Related Behaviors. Minneapolis, MN: Boynton Health Service, University of Minnesota. Retrieved from: http://www.bhs.umn.edu/surveys/survey-results/2015/MNPostsecondaryStudents_CSHSReport_2015.pdf.
Minnesota Office of Higher Education 25
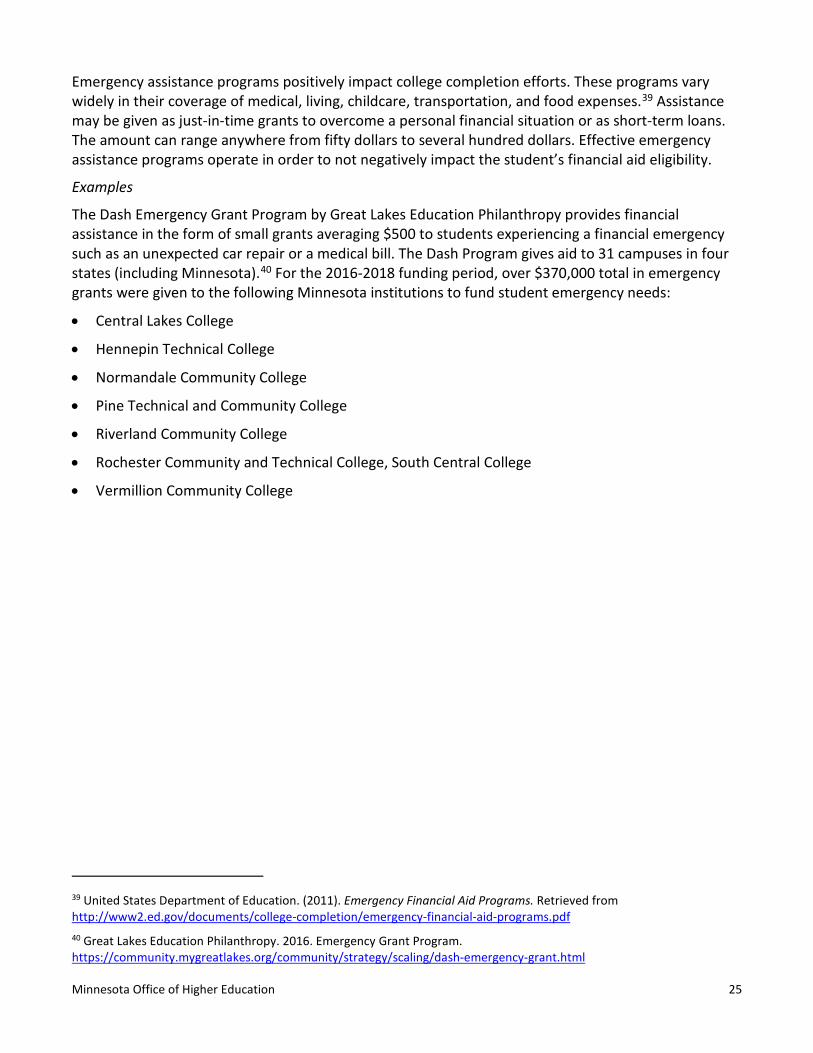
Emergency assistance programs positively impact college completion efforts. These programs vary widely in their coverage of medical, living, childcare, transportation, and food expenses.39 Assistance may be given as just-in-time grants to overcome a personal financial situation or as short-term loans. The amount can range anywhere from fifty dollars to several hundred dollars. Effective emergency assistance programs operate in order to not negatively impact the student’s financial aid eligibility.
Examples
The Dash Emergency Grant Program by Great Lakes Education Philanthropy provides financial assistance in the form of small grants averaging $500 to students experiencing a financial emergency such as an unexpected car repair or a medical bill. The Dash Program gives aid to 31 campuses in four states (including Minnesota).40 For the 2016-2018 funding period, over $370,000 total in emergency grants were given to the following Minnesota institutions to fund student emergency needs:
• Central Lakes College
• Hennepin Technical College
• Normandale Community College
• Pine Technical and Community College
• Riverland Community College
• Rochester Community and Technical College, South Central College
• Vermillion Community College
39 United States Department of Education. (2011). Emergency Financial Aid Programs. Retrieved from http://www2.ed.gov/documents/college-completion/emergency-financial-aid-programs.pdf 40 Great Lakes Education Philanthropy. 2016. Emergency Grant Program. https://community.mygreatlakes.org/community/strategy/scaling/dash-emergency-grant.html

26 Minnesota Office of Higher Education
2016 Legislation: Equity in Education and Job Connection Grants Minnesota Laws 2016 Chapter 189 provided the Minnesota Office of Higher Education $480,000 to support equity in higher education by creating Equity in Education and Job Connection Grants. Funded institutions must focus on increasing attendance, retention, and graduation rates for historically underrepresented students. The grant is to help the state reach the 70 percent postsecondary attainment goal and close gaps in attainment by race/ethncity.
OHE accepted proposals from institutions in September 2016, leading to three grants being awarded to Minnesota State institutions. All three institutions are using grant (and matching) funds to support expansion of proactive advising services. As such, payments of grant funds will occur on a recurring basis, parallel to progress at each institution. Each of the grant recipients must submit interim (January) and final reports (June) to OHE identifying their services, along with the student goals, activities, and outcomes associated with the services. OHE must report progress yearly to the Legislature each January. The funding period for the grants is between December 1, 2016 and June 30, 2019. Funded proposals are listed below.
• Saint Paul College $163,825
Saint Paul College plans to improve its retention and completion rates for students of color enrolled in one or more developmental courses through the development of a comprehensive and proactive pathways advising model.
• Riverland Community College $190,602
Riverland Community College plans a multi-year Completion and Retention Initiative (CRI) using interventions that have a disproportionately positive affect on racially/ethnically diverse students. These interventions include add additional full time advisors and full integration of assigned, proactive advising; provide training for all 30 enrollment advisors, multicultural advisors, counselors and other designated staff on cultural competency; pilot and implement a student management technology platform that will enable the college to plan and track appropriate interventions to support student retention and completion, and provide tutoring a support services
• Minnesota State University, Mankato $125,573
Minnesota State University, Mankato plans to implement the Guided Pathways to Success (GPS) program. GPS will assist in the increase of graduation rates for these students through six elements: targeted recruitment process, summer bridge program, proactive advising, supplemental instruction, common first-year experience courses, and the creation of a registered student organization on campus for the students participating.
Minnesota Office of Higher Education 27
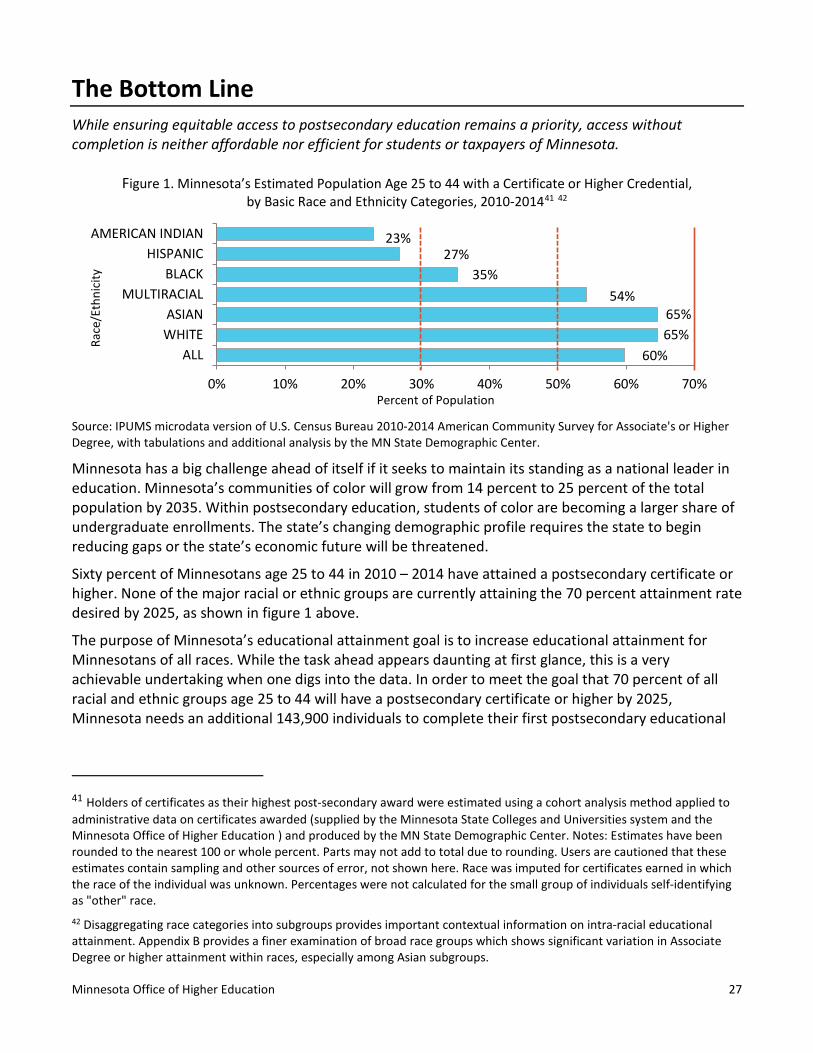
The Bottom Line While ensuring equitable access to postsecondary education remains a priority, access without completion is neither affordable nor efficient for students or taxpayers of Minnesota.
Figure 1. Minnesota’s Estimated Population Age 25 to 44 with a Certificate or Higher Credential,
by Basic Race and Ethnicity Categories, 2010-201441 42
Source: IPUMS microdata version of U.S. Census Bureau 2010-2014 American Community Survey for Associate's or Higher Degree, with tabulations and additional analysis by the MN State Demographic Center.
Minnesota has a big challenge ahead of itself if it seeks to maintain its standing as a national leader in education. Minnesota’s communities of color will grow from 14 percent to 25 percent of the total population by 2035. Within postsecondary education, students of color are becoming a larger share of undergraduate enrollments. The state’s changing demographic profile requires the state to begin reducing gaps or the state’s economic future will be threatened.
Sixty percent of Minnesotans age 25 to 44 in 2010 – 2014 have attained a postsecondary certificate or higher. None of the major racial or ethnic groups are currently attaining the 70 percent attainment rate desired by 2025, as shown in figure 1 above.
The purpose of Minnesota’s educational attainment goal is to increase educational attainment for Minnesotans of all races. While the task ahead appears daunting at first glance, this is a very achievable undertaking when one digs into the data. In order to meet the goal that 70 percent of all racial and ethnic groups age 25 to 44 will have a postsecondary certificate or higher by 2025, Minnesota needs an additional 143,900 individuals to complete their first postsecondary educational
41 Holders of certificates as their highest post-secondary award were estimated using a cohort analysis method applied to administrative data on certificates awarded (supplied by the Minnesota State Colleges and Universities system and the Minnesota Office of Higher Education ) and produced by the MN State Demographic Center. Notes: Estimates have been rounded to the nearest 100 or whole percent. Parts may not add to total due to rounding. Users are cautioned that these estimates contain sampling and other sources of error, not shown here. Race was imputed for certificates earned in which the race of the individual was unknown. Percentages were not calculated for the small group of individuals self-identifying as "other" race. 42 Disaggregating race categories into subgroups provides important contextual information on intra-racial educational attainment. Appendix B provides a finer examination of broad race groups which shows significant variation in Associate Degree or higher attainment within races, especially among Asian subgroups.
23%27%
35%54%
65%65%
60%
0% 10% 20% 30% 40% 50% 60% 70%
AMERICAN INDIANHISPANIC
BLACKMULTIRACIAL
ASIANWHITE
ALL
Percent of Population
Race
/Eth
nici
ty
28 Minnesota Office of Higher Education
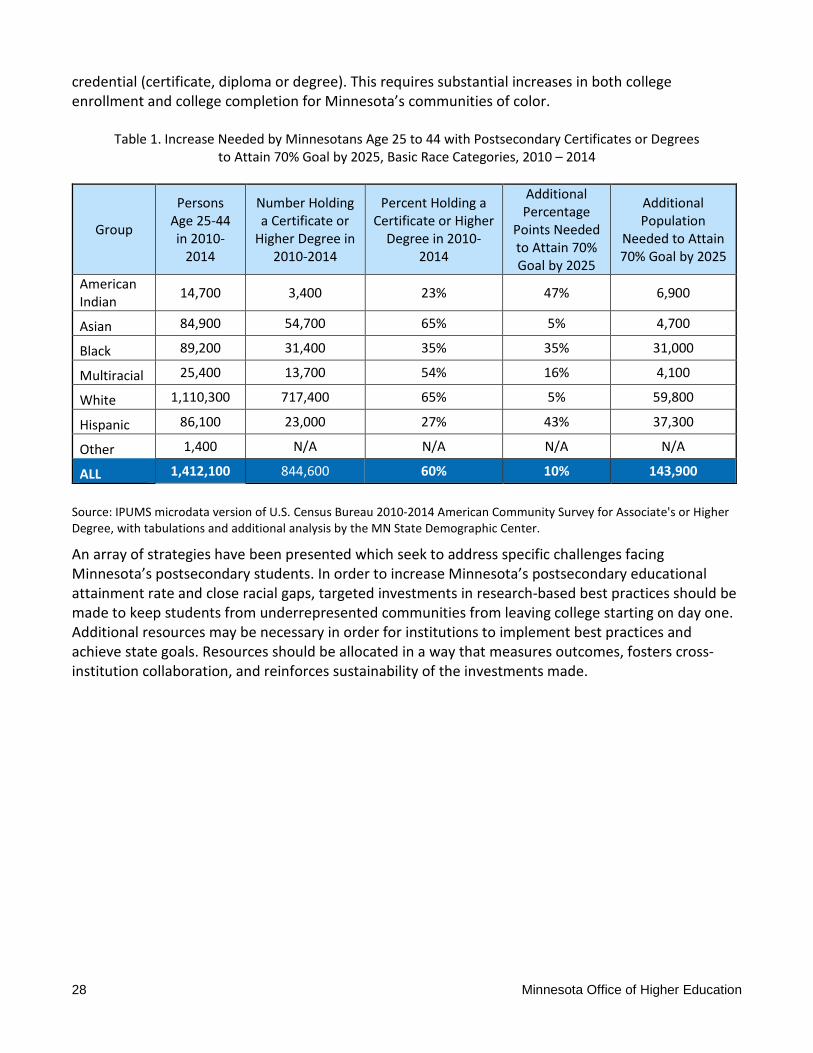
credential (certificate, diploma or degree). This requires substantial increases in both college enrollment and college completion for Minnesota’s communities of color.
Table 1. Increase Needed by Minnesotans Age 25 to 44 with Postsecondary Certificates or Degrees to Attain 70% Goal by 2025, Basic Race Categories, 2010 – 2014
Group
Persons Age 25-44 in 2010-
2014
Number Holding a Certificate or
Higher Degree in 2010-2014
Percent Holding a Certificate or Higher
Degree in 2010-2014
Additional Percentage
Points Needed to Attain 70% Goal by 2025
Additional Population
Needed to Attain 70% Goal by 2025
American Indian 14,700 3,400 23% 47% 6,900
Asian 84,900 54,700 65% 5% 4,700
Black 89,200 31,400 35% 35% 31,000
Multiracial 25,400 13,700 54% 16% 4,100
White 1,110,300 717,400 65% 5% 59,800
Hispanic 86,100 23,000 27% 43% 37,300
Other 1,400 N/A N/A N/A N/A
ALL 1,412,100 844,600 60% 10% 143,900
Source: IPUMS microdata version of U.S. Census Bureau 2010-2014 American Community Survey for Associate's or Higher Degree, with tabulations and additional analysis by the MN State Demographic Center.
An array of strategies have been presented which seek to address specific challenges facing Minnesota’s postsecondary students. In order to increase Minnesota’s postsecondary educational attainment rate and close racial gaps, targeted investments in research-based best practices should be made to keep students from underrepresented communities from leaving college starting on day one. Additional resources may be necessary in order for institutions to implement best practices and achieve state goals. Resources should be allocated in a way that measures outcomes, fosters cross-institution collaboration, and reinforces sustainability of the investments made.

Minnesota Office of Higher Education 29
Appendix A: Population Estimates by Race and Ethnicity
Figure A1. Minnesota Population Age 25 to 44 by Basic Race Groups, 2010 to 201443
Source: IPUMS microdata version of U.S. Census Bureau 2010-2014 American Community Survey for Associate's or Higher Degree, with tabulations and additional analysis by the MN State Demographic Center.
As shown in Figure A1, there are approximately 1,412,100 Minnesotans age 25 to 44 in Minnesota. Figures A1 and A2 show the size of this age group, parsed by basic race groups and detailed cultural groups, to help readers appreciate the diverse backgrounds of Minnesotan’s age 25 to 44. Non-Hispanic Whites represent about 79 percent of this age group.
Figure A2 on the next page detailed population estimates by detailed cultural subgroups. Subgroups are displayed if there were at least 50 respondents from that subgroup in the ACS survey data for Minnesotans age 25 to 44. Due to this threshold, the “Asian, Japanese” subgroup that appeared in the 2015 report is no longer available. However, two new detailed cultural groups are featured that exceed this threshold: “White, Russian” and “Hispanic, Salvadoran.”
43 Notes: Estimates have been rounded to the nearest 100 or whole percent. Parts may not add to total due to rounding. Users are cautioned that these estimates contain sampling and other sources of error, not shown here. All groups are non-Hispanic, except for groups labeled Hispanic.
14,700 (1%)
84,900 (6%)
89,200 (6%)
25,400 (2%)
86,100 (6%)
1,400 (<1%)
1,110,300 (79%)
1,412,100 (100%)
AMERICAN INDIAN
ASIAN
BLACK
MULTIRACIAL
HISPANIC
OTHER
WHITE
ALL
Number of Persons (% of Total)
Race
/Eth
nici
ty

30 Minnesota Office of Higher Education
Figure A2. Minnesota Population Age 25 to 44 by Detailed Race Groups, 2010 to 201444
Source: IPUMS microdata version of U.S. Census Bureau 2010-2014 American Community Survey for Associate's or Higher Degree, with tabulations by the MN State Demographic Center.
44 Notes: Estimates have been rounded to the nearest 100 or whole percent. Parts may not add to total due to rounding. Users are cautioned that these estimates contain sampling and other sources of error, not shown here.
14,700 (1.0%)
2,200 (0.2%)
9,300 (0.7%)
3,700 (0.3%)
19,700 (1.4%)
20,400 (1.4%)
7,400 (0.5%)
3,900 (0.3%)
8,800 (0.6%)
9,500 (0.7%)
4,300 (0.3%)
3,500 (0.2%)
10,900 (0.2%)
70,600 (5.0%)
25,400 (1.8%)
6,300 (0.4%)
1,104,000 (78.2%)
60,200 (4.3%)
4,200 (0.3%)
2,700 (0.2%)
19,000 (1.3%)
AMERICAN INDIAN
Asian, Cambodian
Asian, Chinese
Asian, Filipino
Asian, Hmong
Asian, Indian
Asian, Korean
Asian, Lao
Asian, Vietnamese
Asian, all other subgroups
Black, Ethiopian
Black, Liberian
Black, Somali
Black, all other subgroups
MULTIRACIAL
White, Russian
White, all other subgroups
Hispanic, Mexican
Hispanic, Puerto Rican
Hispanic, Salvadoran
Hispanic, all other subgroups
Number of Persons (% of Total)
Race
/ Et
hnic
ity

Minnesota Office of Higher Education 31
Appendix B: Estimates of Associate Degree Attainment by Race and Ethnicity
Figure B1. Percent of Population Age 25 to 44 with an Associate or Higher Degree by Basic Race Categories, Minnesota, 2010 - 201445
Source: IPUMS microdata version of U.S. Census Bureau 2010-2014 American Community Survey for Associate's or Higher Degree, with tabulations by the MN State Demographic Center.
As shown in Figure B1, Minnesota’s population age 25 to 44 who were Asians were most likely to hold an associate degree or higher (about 60 percent), followed by White (56 percent). American Indians (about 14 percent) and Hispanics (22 percent) were least likely to hold an associate degree or higher As shown in Figure B2 on the next page, a finer examination of these broad race categories shows significant variation, especially among Asian subgroups. Among detailed cultural groups, Asian Japanese (91 percent), Asian Indian (90 percent), and Asian Chinese (82 percent) showed the greatest likelihood of holding at least an associate degree—all have exceeded the goal of 70 percent postsecondary attainment by group. Among Asian Lao, Cambodian, and Hmong populations, the likelihood of holding an associate degree or higher was closer to 30 percent. American Indians (about 14 percent), Black Somalis (about 15 percent), and Hispanic Mexicans (about 15 percent) were least likely to hold at least an associate degree.
45 Notes: Estimates have been rounded to the nearest 100 or whole percent. Parts may not add to total due to rounding. Users are cautioned that these estimates contain sampling and other sources of error, not shown here.
13.9% (± 2.2%)
22.1% (1.5%)
27.9% (± 1.6%)
46.5% (±2.8%)
55.7% (±0.4%)
59.9% (± 1.7%)
51.6% (0.4%)
AMERICAN INDIAN
HISPANIC
BLACK
MULTIRACIAL
WHITE
ASIAN
ALL
Percent Attaining (Bar indicates Margin of Error)
Race
/Eth
nici
ty
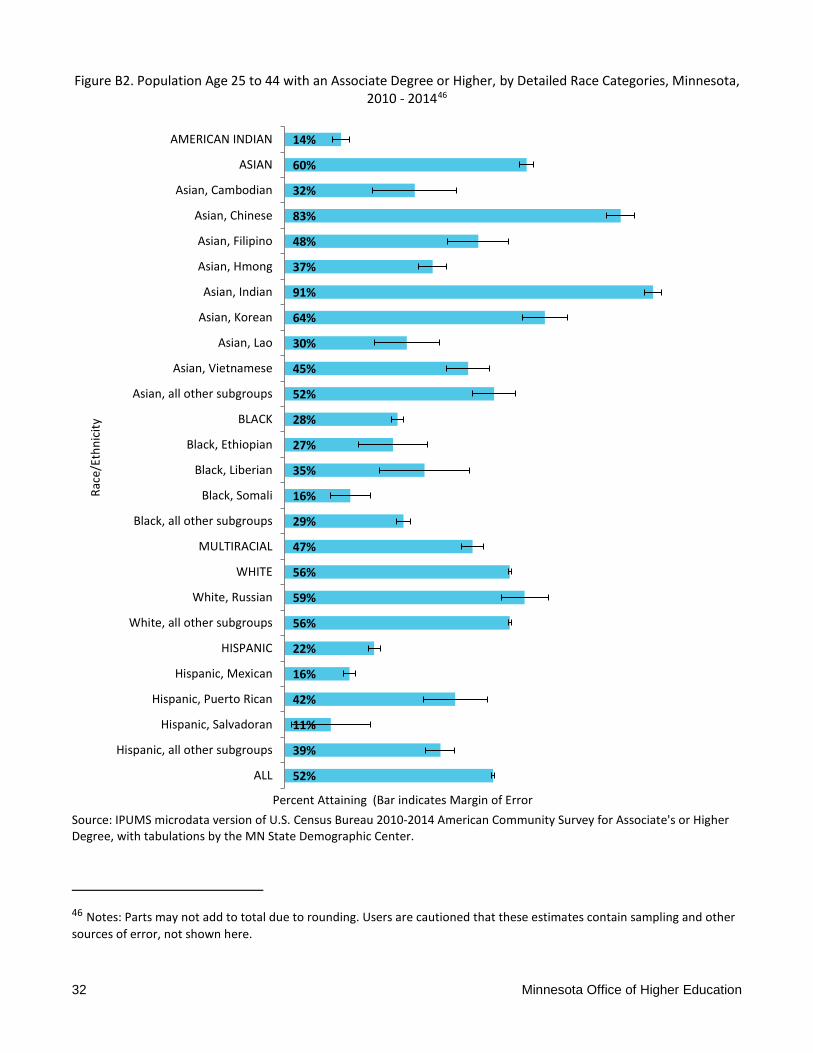
32 Minnesota Office of Higher Education
Figure B2. Population Age 25 to 44 with an Associate Degree or Higher, by Detailed Race Categories, Minnesota, 2010 - 201446
Source: IPUMS microdata version of U.S. Census Bureau 2010-2014 American Community Survey for Associate's or Higher Degree, with tabulations by the MN State Demographic Center.
46 Notes: Parts may not add to total due to rounding. Users are cautioned that these estimates contain sampling and other sources of error, not shown here.
14%
60%
32%
83%
48%
37%
91%
64%
30%
45%
52%
28%
27%
35%
16%
29%
47%
56%
59%
56%
22%
16%
42%
11%
39%
52%
AMERICAN INDIAN
ASIAN
Asian, Cambodian
Asian, Chinese
Asian, Filipino
Asian, Hmong
Asian, Indian
Asian, Korean
Asian, Lao
Asian, Vietnamese
Asian, all other subgroups
BLACK
Black, Ethiopian
Black, Liberian
Black, Somali
Black, all other subgroups
MULTIRACIAL
WHITE
White, Russian
White, all other subgroups
HISPANIC
Hispanic, Mexican
Hispanic, Puerto Rican
Hispanic, Salvadoran
Hispanic, all other subgroups
ALL
Percent Attaining (Bar indicates Margin of Error
Race
/Eth
nici
ty

Minnesota Office of Higher Education 33
Appendix C: Best Practice Strategy Cost Estimates Using cost data from currently-implemented services around the state, the Office has created cost estimates of three best practice strategies: summer bridge programs, proactive advising, and redeveloped remedial education. The costs are contingent on the type of institutions, along with the makeup of their student bodies, which would be implementing the service. Using enrollment and tuition data, estimated costs have been calculated for different profiles of hypothetical institutions
Summer Bridge Programs
Below is an estimate of the annual cost of running a summer bridge program at institutions with different profiles. The number of students participating is one-fourth of the total number of enrolled students of color at the institution (making the assumption that a fourth of the enrolled students of color are freshmen). The actual costs to the institution might be lower, as only a portion of those students will be entering freshmen. It should be noted as well that these estimates do not include indirect costs that will arise, such as (but not limited to):
• Staff to assist with the bridge program
• Faculty to teach summer courses for participants
• The cost of room/board at the school (some institutions work out internal arrangements with student housing to get lower rates)
• Costs to use space for service
• Length of bridge program
Table 2. Summer Bridge Program Cost Estimate
Number of Students Participating
Number of Courses Taken by Students During Program
Cost of Tuition Per Credit
Cost of Students' Tuition During Bridge Program
Initial Development of Data Reporting Total Cost
2-Year Minnesota State College (urban) 125 2 $180 $135,000 $23,520 $158,700
2-Year Minnesota State College (rural) 20 2 $180 $21,600 $23,520 $45,300
4-Year Minnesota State University (urban)
500 2 $250 $750,000 $23,520 $773,770
4-Year Minnesota State University (rural)
75 2 $280 $126,000 $23,520 $149,800
University of Minnesota (Twin Cities)
1,250 2 $461 $3,457,500 $23,520 $3,481,481
4-Year Private University 88 2 $1,200 $633,600 $23,520 $658,320
Source: Minnesota Office of Higher Education
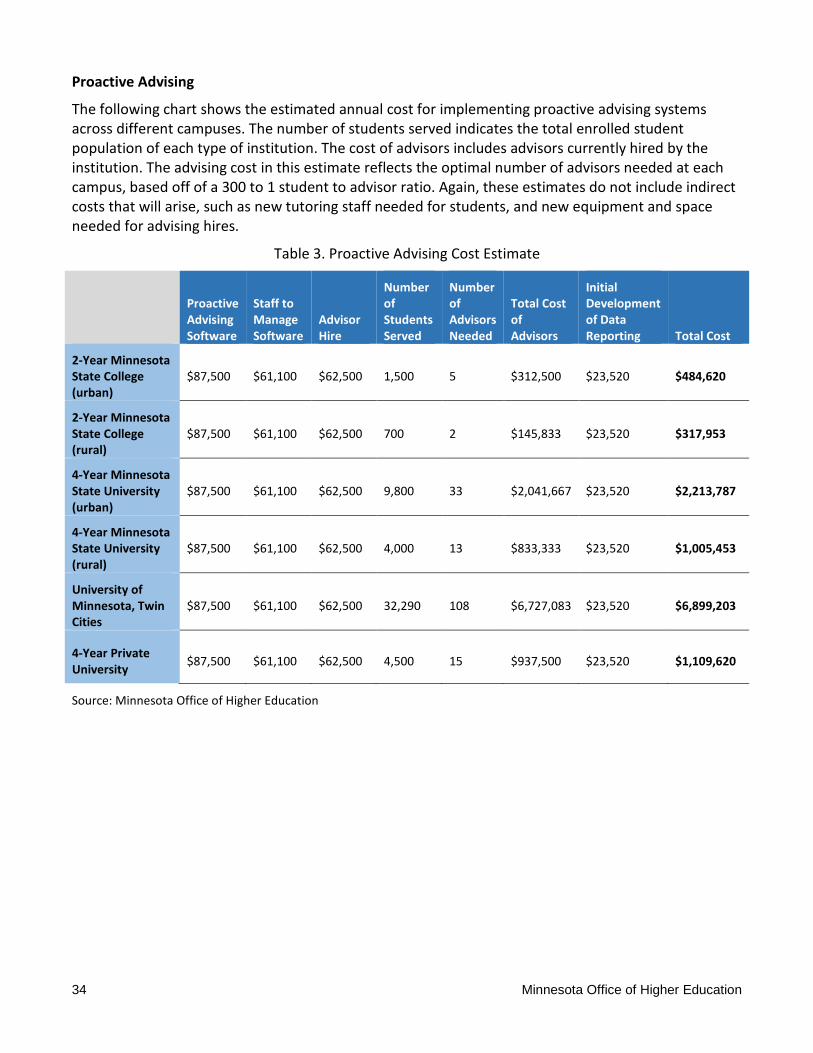
34 Minnesota Office of Higher Education
Proactive Advising
The following chart shows the estimated annual cost for implementing proactive advising systems across different campuses. The number of students served indicates the total enrolled student population of each type of institution. The cost of advisors includes advisors currently hired by the institution. The advising cost in this estimate reflects the optimal number of advisors needed at each campus, based off of a 300 to 1 student to advisor ratio. Again, these estimates do not include indirect costs that will arise, such as new tutoring staff needed for students, and new equipment and space needed for advising hires.
Table 3. Proactive Advising Cost Estimate
Proactive Advising Software
Staff to Manage Software
Advisor Hire
Number of Students Served
Number of Advisors Needed
Total Cost of Advisors
Initial Development of Data Reporting Total Cost
2-Year Minnesota State College (urban)
$87,500 $61,100 $62,500 1,500 5 $312,500 $23,520 $484,620
2-Year Minnesota State College (rural)
$87,500 $61,100 $62,500 700 2 $145,833 $23,520 $317,953
4-Year Minnesota State University (urban)
$87,500 $61,100 $62,500 9,800 33 $2,041,667 $23,520 $2,213,787
4-Year Minnesota State University (rural)
$87,500 $61,100 $62,500 4,000 13 $833,333 $23,520 $1,005,453
University of Minnesota, Twin Cities
$87,500 $61,100 $62,500 32,290 108 $6,727,083 $23,520 $6,899,203
4-Year Private University $87,500 $61,100 $62,500 4,500 15 $937,500 $23,520 $1,109,620
Source: Minnesota Office of Higher Education

Minnesota Office of Higher Education 35
Developmental Education
Below is the cost of redeveloping developmental education courses at two-year Minnesota State colleges. Costs include the FTE salary for teaching one developmental education course ($27,500). It also takes into account the costs of hiring supplemental instructors for each class (at a rate of $9.00 per hour times 15 hours per week times 15 weeks per semesters times the number of sections per year)
This estimate assumes each student enrolled in at least one developmental education course is taking a little over an average of two developmental education courses a semester (which was the average for 2013 high school graduates enrolled at two-year Minnesota State institutions). Actual costs will most likely vary at each specific institution, so this estimate merely provides a starting point for institutions. The estimates also include the cost of already-existing faculty at institutions. Again, these estimates do not include indirect costs that may incur from restructuring developmental education sequences.
Table 4. Redeveloping Developmental Education Cost Estimate
Estimated Number of Remedial Enrollments
Number of Restructured Remedial Courses Taught by FTE Faculty
Supplies and Materials
Cost of FTE Faculty Teaching Corequisite Courses
Cost of Supplemental Instructors for Corequisite Courses
Initial Development of Data Reporting Total Cost
2-Year Minnesota State College (urban)
3,500 66 $5,000 $1,822,917 $89,489 $23,520 $3,853,331
2-Year Minnesota State College (rural)
500 9 $5,000 $260,417 $12,784 $23,520 $574,922
Source: Minnesota Office of Higher Education

36 Minnesota Office of Higher Education