effect of groundwater level toward slope stability
TRANSCRIPT
Effect of Groundwater Level toward Slope Stability
by
Mohd ArifBin Ahmad
Dissertation submitted in partial fulfilment of
the requirements for the
Bachelor of Engineering (Hons)
(Civil Engineering)
JAN2008
Universiti Teknologi PETRONAS Bandar Seri Iskandar 31750 Tronoh Perak: Darul Ridzuan
CERTIFICATION OF ORIGINALITY
This is to certifY that I am responsible for the work submitted in this project, that the original
work is my own except as specified in the references and acknowledgements, and that the
original work contained herein have not been undertaken or done by unspecified sources or
persons.
Jc· MOHD ARIF BIN AHMAD
3
Abstract
It is well recognized that groundwater has important role on the slope failure. Slope failures are one of the serious hazards to the community. For example, the collapse of block ofluxury condominium in Kuala Lumpur, the Genting Highland and Pos Dipang landslides tragedies as well as other landslides disaster have caused substantial loss oflife and damage to property and infrastructure.
The purpose of this project is to examine the influence of rising groundwater on the engineering properties of soil. This study was base of laboratory model that allow control of groundwater by adding and releasing water into/from the model. The influence of the groundwater on man-made slope with a gradient of 34° was observed by determining the engineering properties of the soil at various depth and observing the slope behavior.
It was found that the slope was stable as long as the groundwater is lower than the toe of the slope. As the groundwater became higher than the toe, the moisture of the soil increase to level that can cause slope failure. Slope failure occur when the moisture in the soil reaching 40%.
ACKNOWLEDGEMENT
We would like to thank numerous individuals for their great support in executing this project.
Deepest gratitude goes to my supervisor; Assoc. Prof. Dr Nasiman Sapari for his tremendous
support and technical guidance throughout the entire whole year of my project progress and
preparation of this report.
Special thanks to the lecturers of Civil Engineering Program ofUTP, who have been very helpful
and resourceful while guiding us. Especially to the Final Year Project Coordinators, the lecture
series conducted were useful to us in manage the time to make the project finish successfully in
time and preparing this report. Heartfelt appreciation also to all technicians from Civil
Engineering Department and others who has provided us with helpful information and guidance
regarding the preparation of the sample.
Finally yet importantly, we would like to thank all of our family and friends who have help us in
their own way.
TABLE OF CONTENTS
CHAPTER 1.0 : INTRODUCTION
1.1 Background of Study............................................................. 4
1.2 Problem Statement................................................................ 5
1.3 Objective............................................................................ 5
1.4 Scope of Study..................................................................... 5
CHAPTER 2.0: THEORY & LITERATURE REVIEW
2.1
2.2
Slope Stability .................................................................... .
Groundwater ..................................................................... .
6
7
2.3 Shear Strength..................................................................... 8
CHAPTER 3.0 : METHODOLOGY/ PROJECT WORKS
3.1
3.2
3.3
3.4
3.5
3.6
3.7
3.8
Particle Distribution .............................................................. .
Permeability Test. ................................................................ .
Plastic Limit Test ................................................................. .
Liquid Limit Test. ................................................................ .
Moisture Content ................................................................. .
Shear Strength ..................................................................... .
Slope Model. ...................................................................... .
Draft of Slope at Different Water Level.. .................................... .
CHAPTER 4.0 : RESULTS AND DISCUSSION
4.1
4.2
4.3
Experiment Results .............................................................. .
Slope Failure ...................................................................... .
Compare Soil Layer at Different Water Level.. ............................ .
CHAPTER 5.0: CONCLUSION AND RECOMMENDATION
5.1
5.2
Reference
Appendix
Conclusion ....................................................................... .
Recommendation ............................................................... .
11
12
13
14
15
16
17
18
19
29
29
32
32
33
31
Figures
3.1
3.2
3.3
3.4
3.5
3.6
3.7
3.8
4.1
4.2
4.3
4.4
4.5
4.6
4.7
4.8
4.9
4.10
4.11
4.12
LIST OF FIGURES
Description
Slope Model. ............................................................... .
Inflow Section .............................................................. .
Water Level Section ........................................................ .
Slope Section ................................................................ .
Outflow Section ............................................................ .
Draft of 1st Water Level.. .................................................. .
Draft of 2nd Water Level.. ................................................. .
Draft of 3'd Water Level.. ................................................. .
Penetration V s Moisture Content ........................................ .
Force Vs Displacement for 1st Water Level.. ........................... .
Vertical V s Horizontal for 1 '1 Water Level.. ............................. .
Force Vs Displacement for 2nd Water Level.. ........................... .
Vertical Vs Horizontal for 2nd Water Level.. ........................... .
Force Vs Displacement for 3'd Water Level.. ........................... .
Vertical V s Horizontal for 3'd Water Level. ............................. .
Slope Failure ................................................................. .
Slope Failure ................................................................. .
Force V s Displacement for 1 '1 Soil Layer ................................ .
Force Vs Displacement for 2nd Soil Layer ............................... .
Force Vs Displacement for 3'd Soil Layer ................................ .
Page
17
17
17
17
17
18
18
18
24
26
26
27
27
28
28
29
29
30
30
31
Tables
3.0
4.0
4.1
4.2
4.3
4.4
LIST OF TABLE
Description
Parameters and Methods ................................................... .
Particle Size Distribution ................................................... .
Flow rate at Different Water Level.. ..................................... .
Plastic Limit Test ........................................................... .
Liquid Limit Test ........................................................... .
Moisture Content ........................................................... .
Page
10
19
22
23
24
25
CHAPTER I
INTRODUCTION
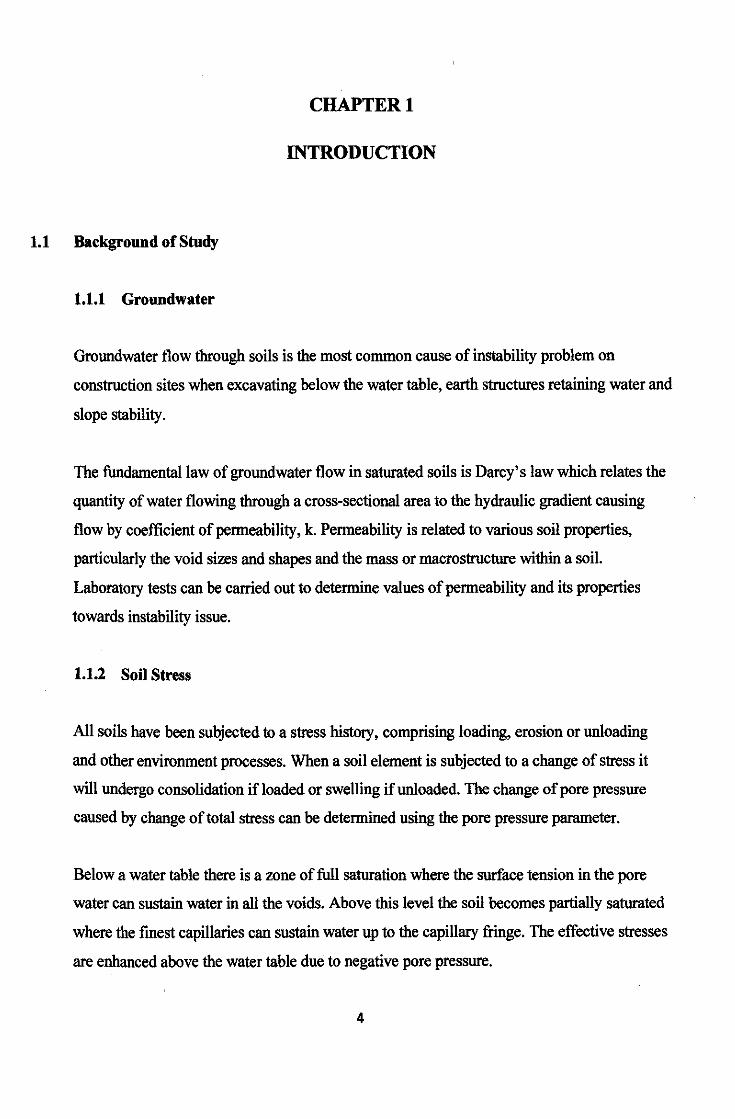
1.1 Background of Study
1.1.1 Groundwater
Groundwater flow through soils is the most common cause of instability problem on
construction sites when excavating below the water table, earth structures retaining water and
slope stability.
The fundamental law of groundwater flow in saturated soils is Darcy's law which relates the
quantity of water flowing through a cross-sectional area to the hydraulic gradient causing
flow by coefficient of permeability, k. Permeability is related to various soil properties,
particularly the void sizes and shapes and the mass or macrostructure within a soil.
Laboratory tests can be carried out to determine values of permeability and its properties
towards instability issue.
1.1.2 Soil Stress
All soils have been subjected to a stress history, comprising loading, erosion or unloading
and other environment processes. When a soil element is subjected to a change of stress it
will undergo consolidation if loaded or swelling if unloaded. The change of pore pressure
caused by change of total stress can be determined using the pore pressure parameter.
Below a water table there is a zone of full saturation where the surface tension in the pore
water can sustain water in all the voids. Above this level the soil becomes partially saturated
where the fmest capillaries can sustain water up to the capillary fringe. The effective stresses
are enhanced above the water table due to negative pore pressure.
4
CHAPTER2
LITERATURE RIVIEW
2.1 Slope Stability
2.1.1 Slope Types and Failure Theories
Natural and man-made slopes are generally classified as either finite or infinite. The
stability of a finite slope can be analyzed by considering the equilibrium of force acting
on potential slope failure surface. The degree of complexity of the stability analysis of a
finite slope depends on nature of the materials comprising the slope and the loading
conditions associated with potential failure surface. An infinite slope is one with constant
slope and with relatively shallow depth. In most cases the soil is assumed to be
homogeneous, but an infmite slope may consist of non-homogeneous material.
There are several theories used to determine the stability of a slope, all of which assume
that the soil mass is in a state of plastic equilibrium at failure. That is, once failure has
occurred along a surface in the slope, the shear and normal stresses on this surface will
not increase or decrease.
2.1.2 Cause oflnstability
Failures of natural and man-made slopes are generally attributable to any activity that
results in either an increase in soil stress or a decrease in soil strength. The specific
causes of slope instability are varied and depend on the nature of the soil, pore water
pressure, climate, and stress within the soil mass (static and dynamic). Specific examples
that cause a net increase in stresses include an increase in the unit weight of the soil
through rainfall, load imposed by fills or structures at the top of a slope or excavation at
the toe of slope , movement of water levels, earthquakes and water pressure in crack
within the slope.
6
2.2 Groundwater
2.2.1 Concentrated Water Sources
One of the most common causes of slope failure is water entering the ground from a
concentrated water source during a storm. Some examples:
• Overflowing ditch on a highway that allows flood water to cross at a low point,
causing failure of the outside slope.
• Broken culvert under fill causing internal erosion.
• Blocked culvert at the upstream end, causing ponding of water and blow out.
• Broken water pipes and storm sewers.
• Discharge of surface water.
2.2.2 Factor influencing Storage and Movement of Groundwater
Water soaks into the ground because bedrock, sediment, and soil contain countless voids,
or openings. These opening are similar to those of a sponge and are often called pore
spaces. The quantity of groundwater that can be stored depends on the porosity of the
material, which is the percentage of total volume of rock or sediment that consists of pore
spaces. Void most often are spaces between sedimentary particles, but also common are
joints, faults, cavities formed by dissolving of soluble rocks such as limestone, and
vesicles (voids left by gases escaping from lava).
Variation in porosity can be great. Sediment is commonly quite porous, and open spaces
may occupy 10 to 50 percent of sediments total volume. Pore space depends on the size
and shape of the grains, how they are packed together, the degree of sorting, and in
sedimentary rocks, the amount of cementing material.
Where sediments of various sizes are mixed, the porosity is reduced because the fmer
particles tent to fill the opening among larger grains. Most igneous and metamorphic
7
rocks, as well as some sedimentary rocks are composed of tightly interlocking crystals, so
the voids between the grains may be negligible.
Porosity along cannot measure a material's capacity to yield groundwater. Rock or
sediment might be very porous yet still not allow water to move through it. The pores
must be connected to allow water flow, and they must be large enough to allow flow.
Thus, the permeability of material, its ability to transmit a fluid, is also very important.
Groundwater moves by twisting and turning through interconnected small openings. The
smaller the pore space, the slower the water moves. For example clay's ability to store
water is great, owing to its high porosity, but its pore spaces are so small that water is
unable to move through it. Thus, clay's porosity is high but permeability is poor.
2.3 Shear Strength of Soil
2.3.1 Introduction
The application ofload or stress on soil below a foundation, or in a slope, until
deformations become unacceptably large is describe as failure. For this reason the
limiting value of shear stress is often based on a maximum allowable strain or
deformation. Shear strength may be defined as the ability of a soil to sustain load without
undue distortion or failure in the soil mass. The allowable deformation will often control
the design of structures, because the usual factors of safety result in shear stresses much
less than those that would cause collapse or failure.
2.3.2 Direct Shear
A number of stress-strain tests are available for measuring the shear strength of soils.
Laboratory tests are designed to permit application of stress to a soil sampling with
measurement of the resulting deformation and pore water pressures. The most common
methods is direct shear.
8
The direct shear test is applied a normal load to the soil sample in the shear box through a
rigid loading cap. Next a shear load is applied while the horizontal displacement of the
upper soil container and the vertical movement ofloading cap are measured. The rate of
shear displacement is about one percent per minutes except for drained test on cohesive
soils, which require much slower rates. Shear resistance develops along the
predetermined surface through the mechanism of internal friction within the soil.
9
CHAPTER3
METHODOLOGY I PROJECT WORK
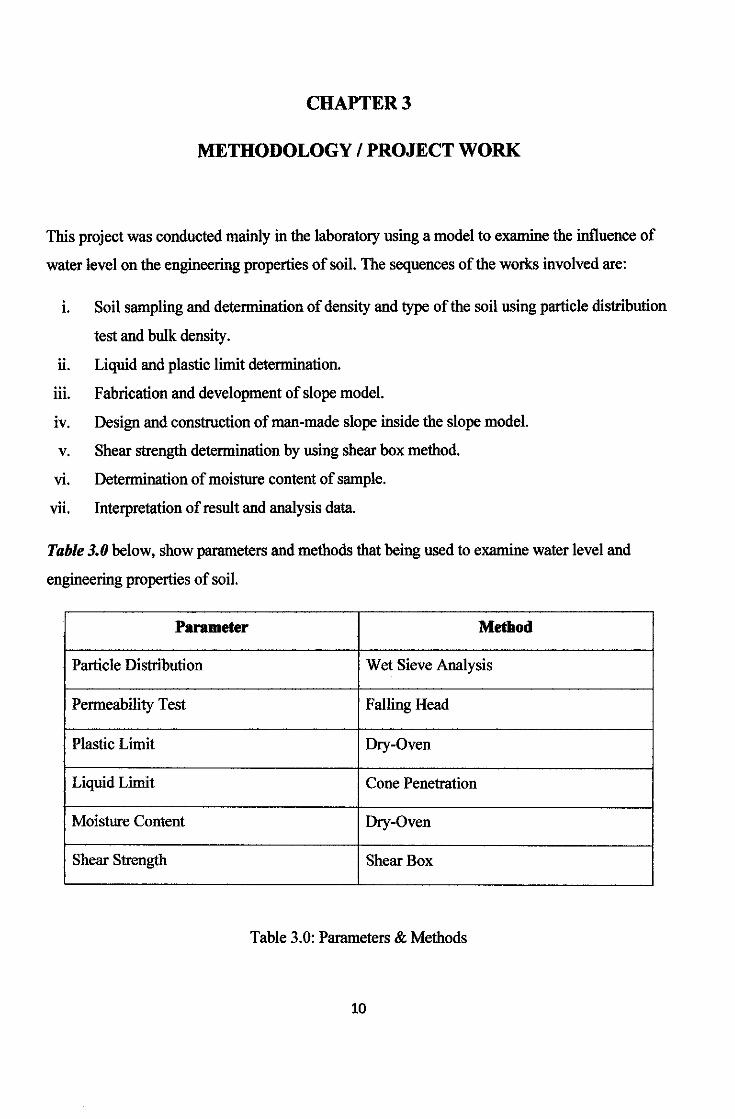
This project was conducted mainly in the laboratory using a model to examine the influence of
water level on the engineering properties of soil. The sequences of the works involved are:
i. Soil sampling and determination of density and type of the soil using particle distribution
test and bulk density.
ii. Liquid and plastic limit determination.
iii. Fabrication and development of slope model.
iv. Design and construction of man-made slope inside the slope model.
v. Shear strength determination by using shear box method.
vi. Determination of moisture content of sample.
vii. Interpretation of result and analysis data.
Table 3.0 below, show parameters and methods that being used to examine water level and
engineering properties of soil.
Parameter Method
Particle Distribution Wet Sieve Analysis
Permeability Test Falling Head
Plastic Limit Dry-Oven
Liquid Limit Cone Penetration
Moisture Content Dry-Oven
Shear Strength Shear Box
Table 3.0: Parameters & Methods
10
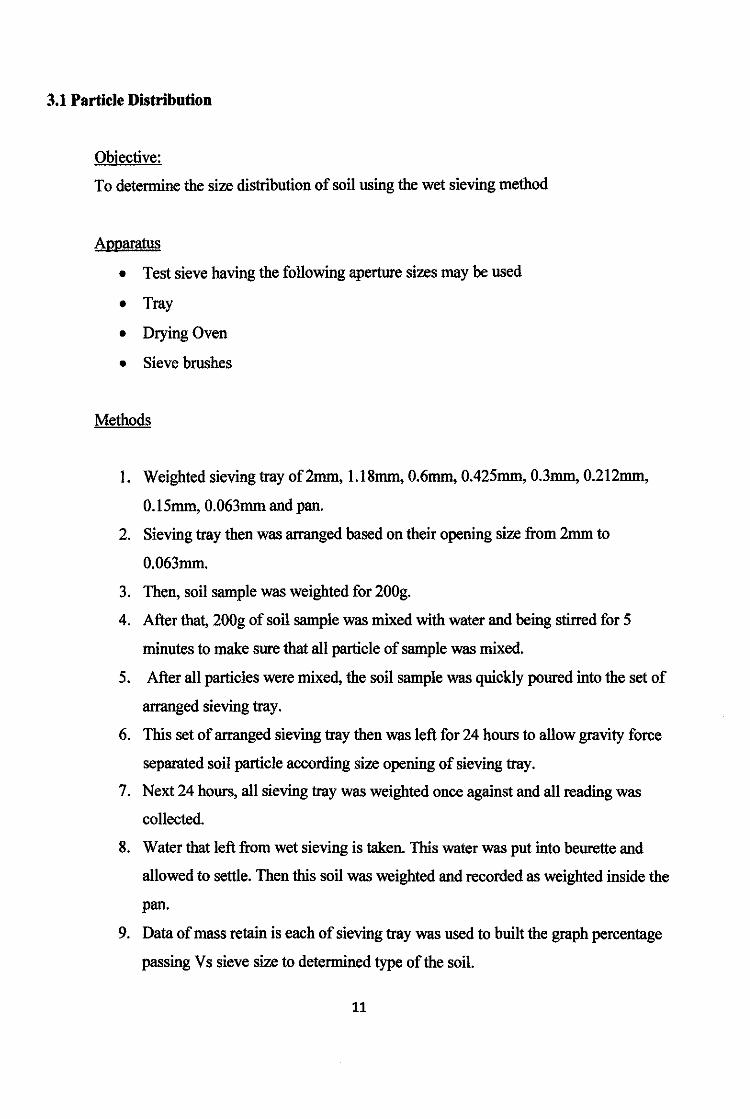
3.1 Particle Distribution
Objective:
To determine the size distribution of soil using the wet sieving method
Apparatus
• Test sieve having the following aperture sizes may be used
• Tray
• Drying Oven
• Sieve brushes
Methods
1. Weighted sieving tray of2mm, 1.18mm, 0.6mm, 0.425mm, 0.3mm, 0.212mm,
0.15mm, 0.063mm and pan.
2. Sieving tray then was arranged based on their opening size from 2mm to
0.063mm.
3. Then, soil sample was weighted for 200g.
4. After that, 200g of soil sample was mixed with water and being stirred for 5
minutes to make sure that all particle of sample was mixed.
5. After all particles were mixed, the soil sample was quickly poured into the set of
arranged sieving tray.
6. This set of arranged sieving tray then was left for 24 hours to allow gravity force
separated soil particle according size opening of sieving tray.
7. Next 24 hours, all sieving tray was weighted once against and all reading was
collected.
8. Water that left from wet sieving is taken. This water was put into beurette and
allowed to settle. Then this soil was weighted and recorded as weighted inside the
pan.
9. Data of mass retain is each of sieving tray was used to built the graph percentage
passing V s sieve size to determined type of the soil.
11
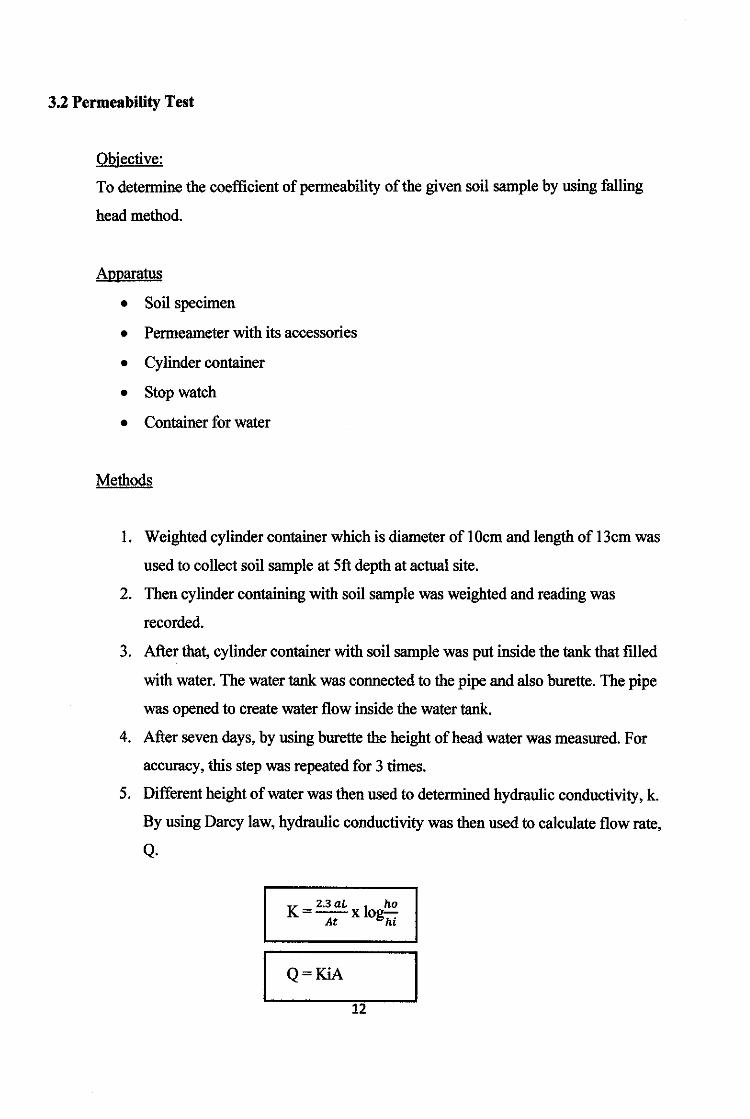
3.2 Permeability Test
Objective:
To determine the coefficient of permeability of the given soil sample by using falling
head method.
Apparatus
• Soil specimen
• Permeameter with its accessories
• Cylinder container
• Stopwatch
• Container for water
Methods
l. Weighted cylinder container which is diameter of lOcm and length of l3cm was
used to collect soil sample at Sft depth at actual site.
2. Then cylinder containing with soil sample was weighted and reading was
recorded.
3. After that, cylinder container with soil sample was put inside the tank that filled
with water. The water tank was connected to the pipe and also burette. The pipe
was opened to create water flow inside the water tank.
4. After seven days, by using burette the height of head water was measured. For
accuracy, this step was repeated for 3 times.
5. Different height of water was then used to determined hydraulic conductivity, k.
By using Darcy law, hydraulic conductivity was then used to calculate flow rate,
Q.
K 2.3aL l ho =--x ogAt hi
Q=KiA
12
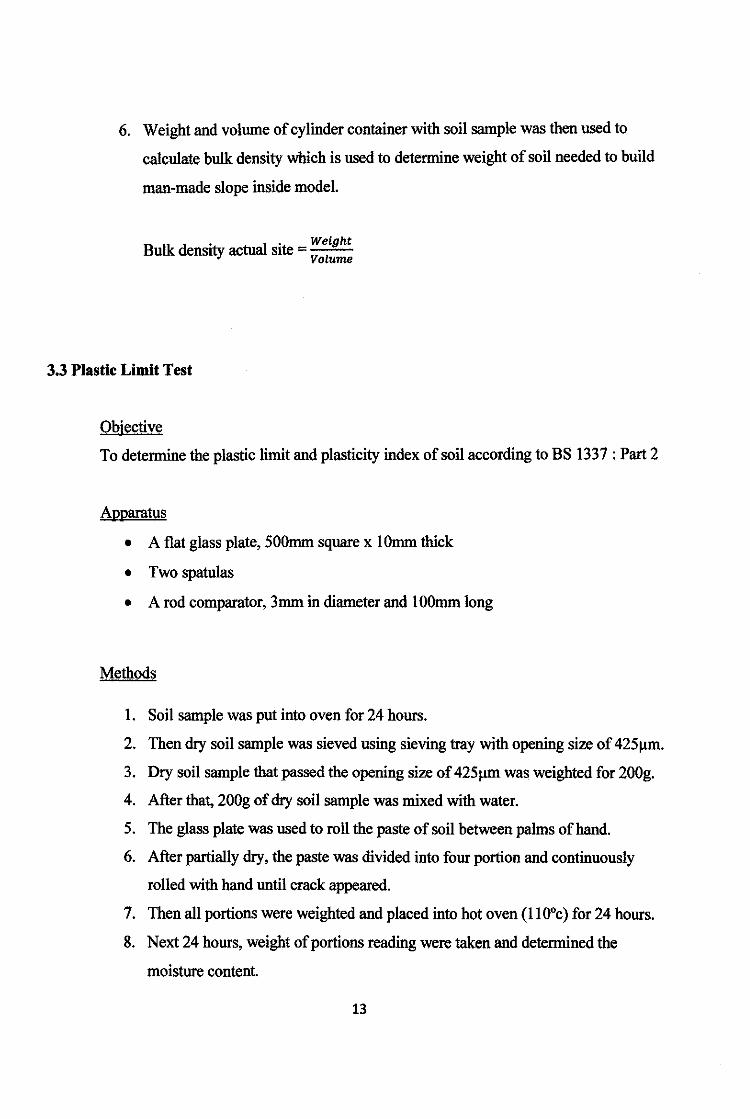
6. Weight and volume of cylinder container with soil sample was then used to
calculate bulk density which is used to determine weight of soil needed to build
man-made slope inside model.
ulk d . I . Weight B enstty actua stte = .;.;.v ::.,;.
1 =
oume
3.3 Plastie Limit Test
Objective
To determine the plastic limit and plasticity index of soil according to BS 1337 : Part 2
APParatus
• A flat glass plate, SOOmm square x lOmm thick
• Two spatulas
• A rod comparator, 3mm in diameter and lOOmm long
Methods
l. Soil sample was put into oven for 24 hours.
2. Then dry soil sample was sieved using sieving tray with opening size of 425J.tm.
3. Dry soil sample that passed the opening size of 425J.!ffi was weighted for 200g.
4. After that, 200g of dry soil sample was mixed with water.
5. The glass plate was used to roll the paste of soil between palms of hand.
6. After partially dry, the paste was divided into four portion and continuously
rolled with hand until crack appeared.
7. Then all portions were weighted and placed into hot oven (11 0°c) for 24 hours.
8. Next 24 hours, weight of portions reading were taken and determined the
moisture content.
13
3.4 Liquid Limit Test
Objective
To detennine the liquid limit of soil using cone penetration according to BS 1337 Part 2
Apparatus
• A flat glass plate 500mm square x 10mm thick
• Two spatulas
• A straightedge
• A cone penetration
• One metal cup not less 55mm diameter x 40mm deep
• An evaporating dish, of about 150mm diameter
• A wash bottle
• Automatic controller which release the plunger head and ensures free falling of
the penetration device during the test.
Methods
1. The soil sample was put into dry oven ( 11 O"c) for 24 hours.
2. Dry soil sample was then sieve using sieving tray with opening of 425J.UI1.
3. Then soil sample that passed 425!lm opening size was weighted for 300g.
4. 300g of dry soil sample then was placed on glass plate and mixed with water.
5. Then cone penetration was used to detennine depth of soil sample penetration
through the soil within 5 sec.
6. The step was repeated until the depth of soil penetrated within range of 15mm -
28mm.
7. Then moisture content of the soil sample was measured by using dry-oven
method.
8. Step 5, 6 and 7 was repeated twice by adding more water to the soil sample.
9. Data of moisture content was then used to build the graph.
14
3.5 Moisture Content
Objective:
To determine the moisture content in soil using the oven- drying method
Apparatus
• Drying oven
• Moisture content container
• Electronic balance
Methods
1. Three moisture containers were labeled and then weighted.
2. Then soil sample was put inside the moisture container and again weighted. The
reading was taken.
3. Moisture containers with soil sample were then put into hot oven (ll0°c) for 24
hours.
4. After 24 hours, moisture container was weighted and reading was taken.
5. Dry and wet of soil reading was then used to calculated percentage of moisture
content.
%MoistureContent= {W2 -W3}x100 W3-W!
15
3.6 Shear Strength
Objective
To determine the shear strength of soil by using the shear box test.
APParatus
• Direct shear box apparatus
• Loading frame
• Dial gauge
• Proving ring
• Tamper
• Straight edge
• Balance to weight
Methods
1. The inner of the shear box was measured.
2. Then the container volume and its weight were also measured.
3. After that, wet soil sample was put into the shear box container. Then the shear
box container was placed in the machine.
4. The weight of 1 Okg was applied as vertical force.
5. The vertical and horizontal displacement gauge was set at 0.
6. After that, test was started and reading of force, vertical and displacement vs
taken once the soil was fail.
7. The data was then used to build the graph.
16
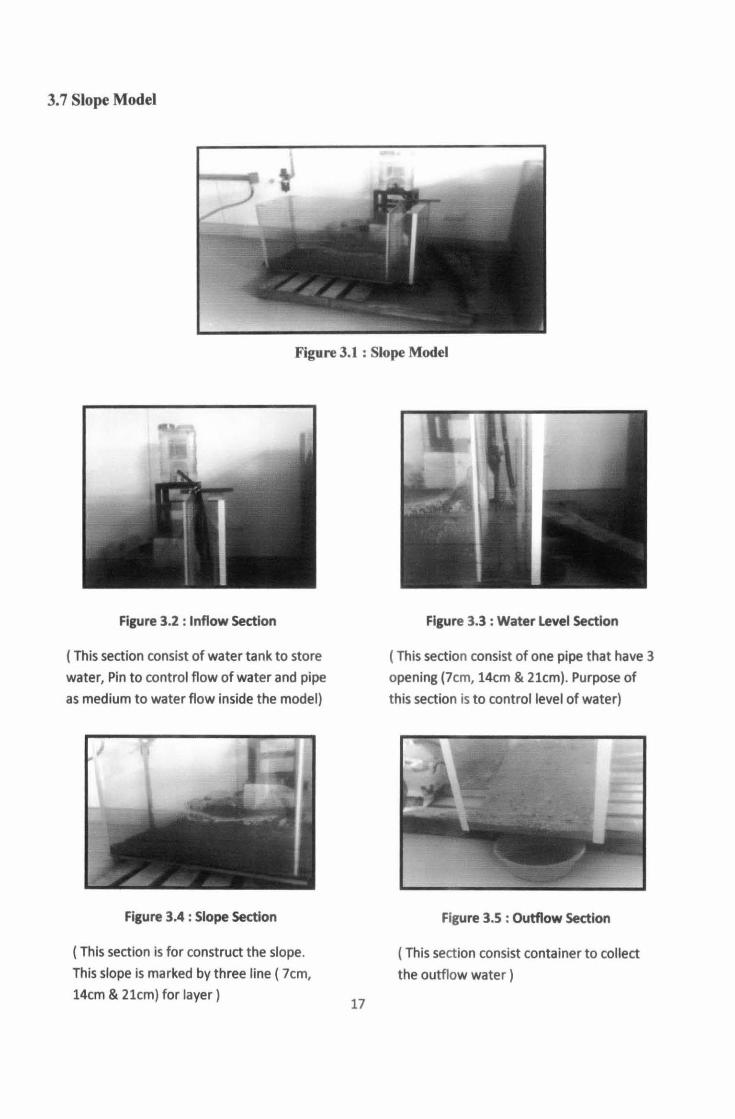
3.7 Slope Model
Figure 3.1 : Slope Model
Figure 3.2 : Inflow Section
( This section consist of water tank to store
water, Pin to control flow of water and pipe
as medium to water flow inside the model)
Figure 3.4 : Slope Section
(This section is for construct the slope.
This slope is marked by three line ( 7cm,
14cm & 21cm) for layer) 17
Figure 3.3 : Water Level Section
( This section consist of one pipe that have 3
opening (7cm, 14cm & 21cm). Purpose of
this section is to control level of water)
Figure 3.5 : Outflow Section
( This section consist container to collect
the outflow water )
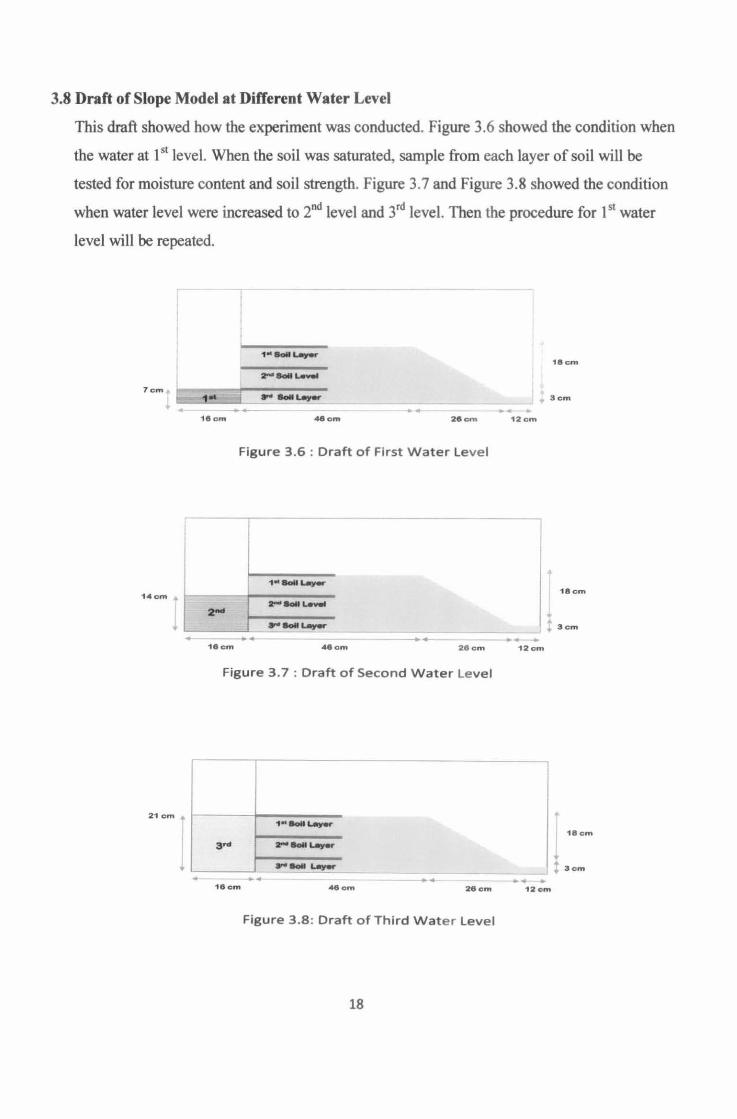
3.8 Draft of Slope Model at Different Water Level
This draft showed how the experiment was conducted. Figure 3.6 showed the condition when
the water at 1st level. When the soil was saturated, sample from each layer of soil will be
tested for moisture content and soil strength. Figure 3.7 and Figure 3.8 showed the condition
when water level were increased to 2"d level and 3rd level. Then the procedure for 1st water
level will be repeated.
7cm
1"-~
18 c m 4&om 28om
Figure 3 .6 : Draft of First Water leve l
-18om 48 o m -- 28cm
Figure 3 . 7 : Draft of Second Water level
Figure 3 .8 : Draft of Third Water level
18
18cm
3 cm
12 c m
18cm
3cm
12 c m
CHAPTER4
RESULTS AND DISCUSSIONS
4.1 Experiment Results
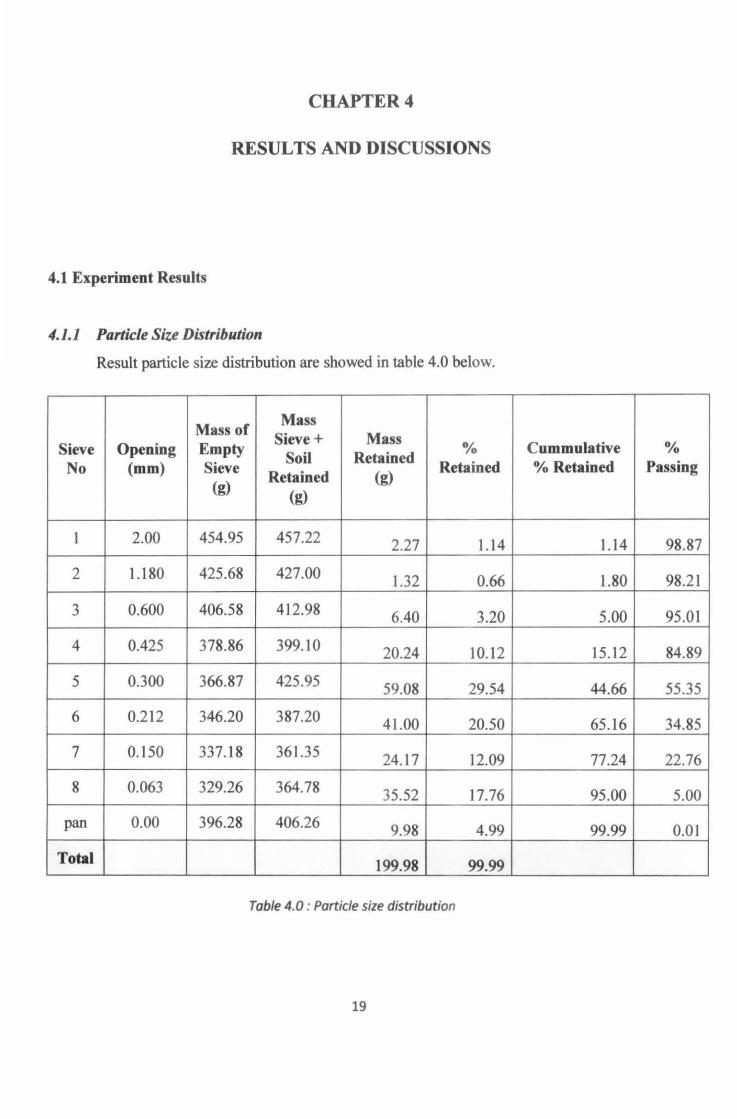
4.1.1 Particle Size Distribution
Result particle size distribution are showed in table 4.0 below.
Mass of Mass
Sieve+ Mass % Cum mutative % Sieve Opening Empty Soil Retained Retained %Retained Passing No (mm) Sieve
Retained (g) (g) (g)
I 2.00 454.95 457.22 2.27 1.14 1.14 98.87
2 1.180 425.68 427.00 1.32 0.66 1.80 98.21
3 0.600 406.58 412.98 6.40 3.20 5.00 95.01
4 0.425 378.86 399.10 20.24 10.12 15.12 84.89
5 0.300 366.87 425.95 59.08 29.54 44.66 55.35
6 0.212 346.20 387.20 41.00 20.50 65.16 34.85
7 0.150 337.18 361.35 24.17 12.09 77.24 22.76
8 0.063 329.26 364.78 35.52 17.76 95.00 5.00
pan 0.00 396.28 406.26 9.98 4.99 99.99 0.01
Total 199.98 99.99
Table 4.0 : Particle size distribution
19
Discussion
From the graph of particle distribution, we can see that the curve is well-graded soil. Also
from the graph, the soil sample was determined as fine sand.
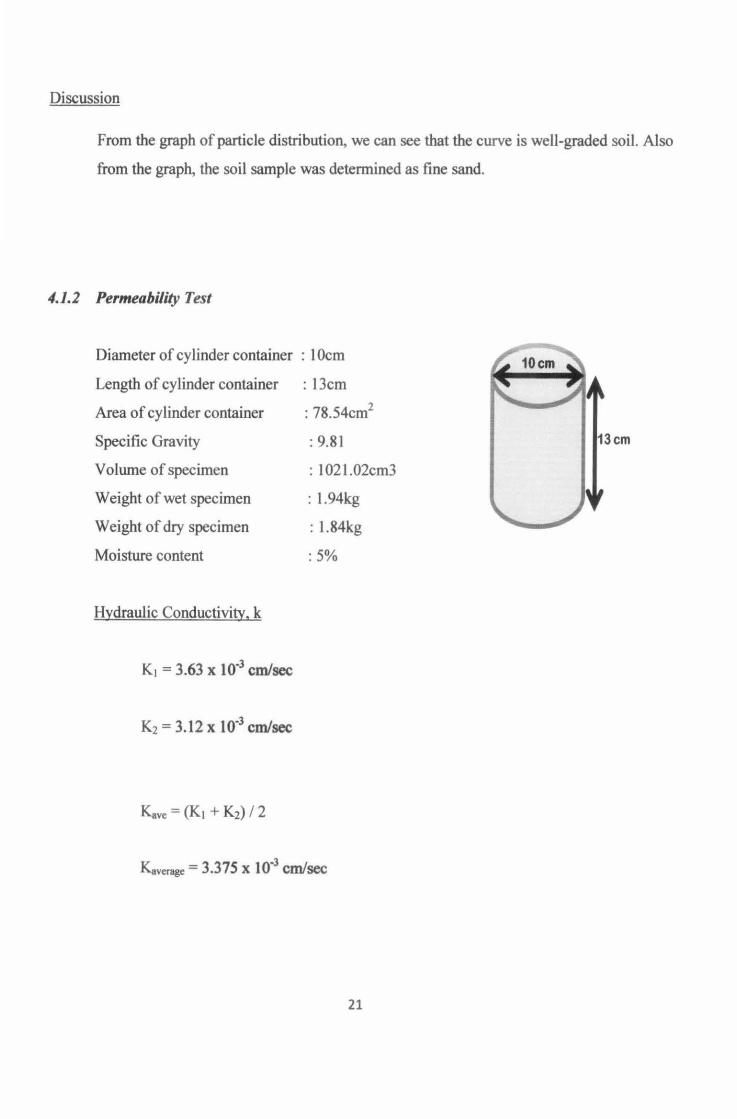
4.1.2 Permeability Test
Diameter of cylinder container : lOcm
Length of cylinder container : 13cm
Area of cylinder container
Specific Gravity
Volume of specimen
Weight of wet specimen
Weight of dry specimen
Moisture content
Hydraulic Conductivity, k
K1 = 3.63 x 10"3 em/sec
K2 = 3.12 x 10"3 em/sec
: 78.54cm2
: 9.81
: 1021.02em3
: 1.94kg
: 1.84kg
:5%
Kaverage = 3.375 X 10"3 em/sec
21
13cm
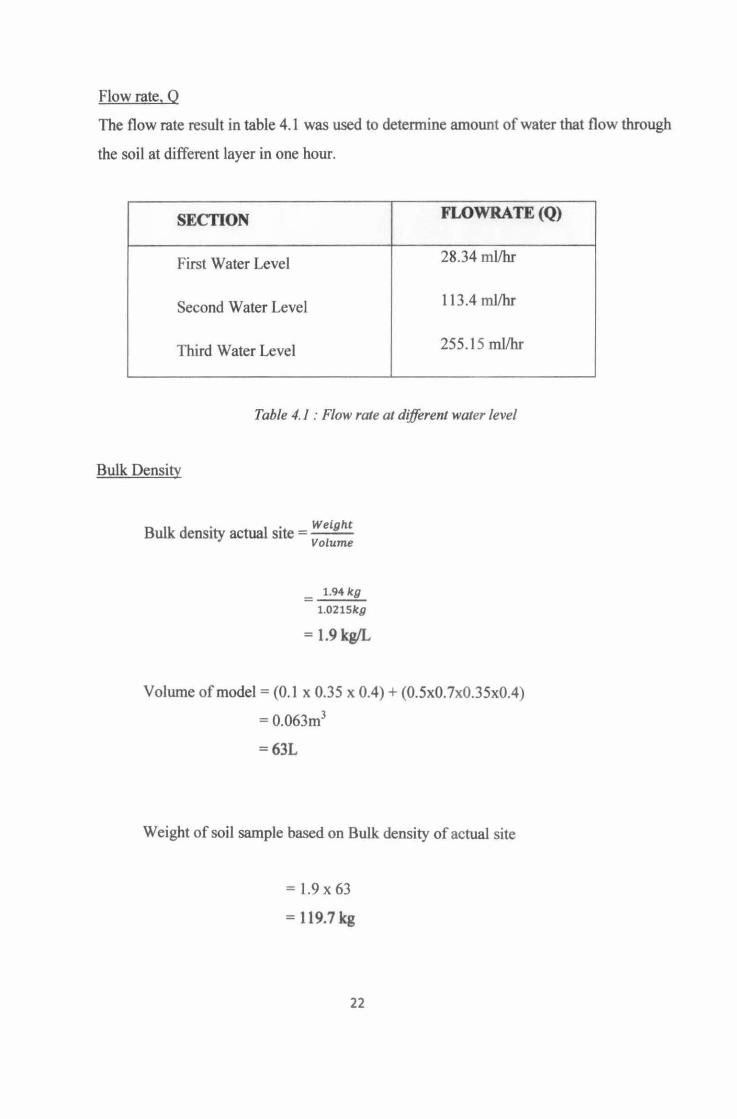
Flow rate, 0
The flow rate result in table 4.1 was used to detennine amount of water that flow through
the soil at different layer in one hour.
SECI'ION FLOWRATE (Q)
First Water Level 28.34 mllhr
Second Water Level 113.4 mllhr
Third Water Level 255.15 mllhr
Table 4. 1 : Flow rate at different water level
Bulk Density
Bulk d . tual . Weight ens1ty ac s1te = -vo-lu~me-
= 1.94kg
1.021Skg
= 1.9 kgiL
Volume of model= (0.1 x 0.35 x 0.4) + (0.5x0.7x0.35x0.4)
= 0.063m3
= 63L
Weight of soil sample based on Bulk density of actual site
= 1.9 X 63
= 119.7 kg
22
Discussion
From Falling Head Permeability Test, the hydraulic conductivity, k, from hydraulic
conductivity, the flow rate of groundwater was determined.
The bulk density was used to determine weight of soil sample needed for the slope model
so that the compaction of the slope model similar to the actual site.
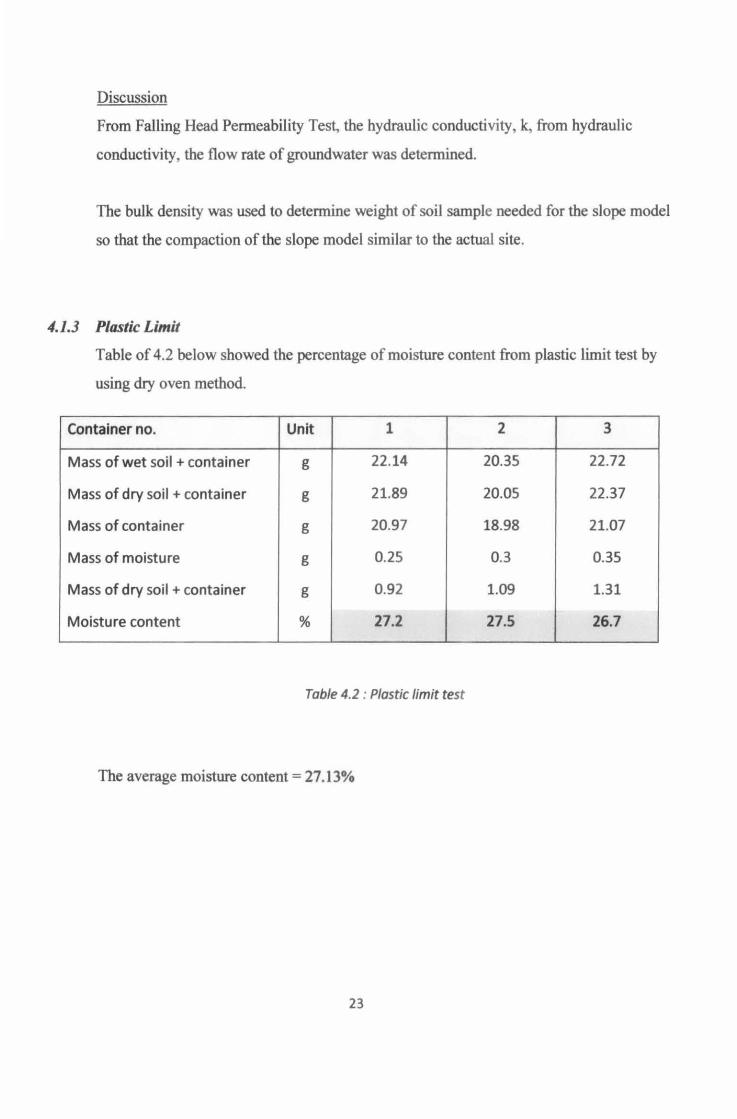
4.1.3 Plastic Limit
Table of 4.2 below showed the percentage of moisture content from plastic limit test by
using dry oven method.
Container no. Unit 1 2 3
Mass of wet soil + container g 22.14 20.35 22.72
Mass of dry soil+ container g 21.89 20.05 22.37
Mass of container g 20.97 18.98 21.07
Mass of moisture g 0.25 0.3 0.35
Mass of dry soil +container g 0.92 1.09 1.31
Moisture content % 27.2 27.5 26.7
Table 4.2 : Plastic limit test
The average moisture content= 27.13%
23
Discussion
From table of 4.2, the percentage of moisture content was determined for soil sample at
the time crack appeared. The average of moisture content was 27.13%.
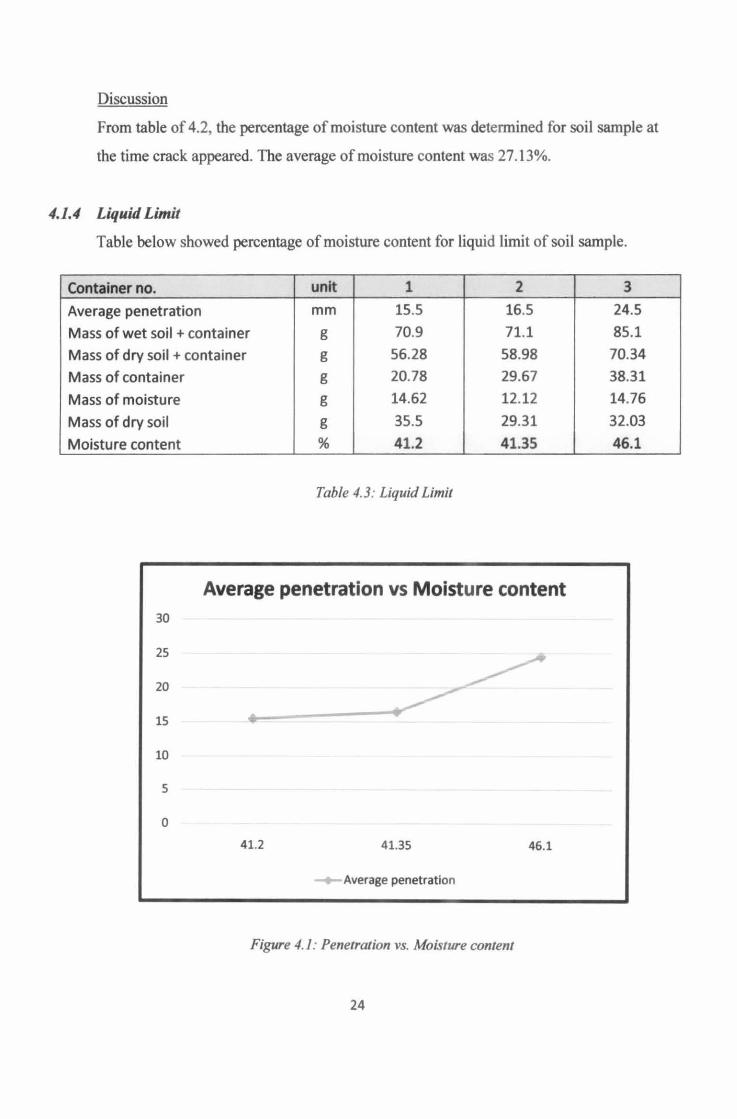
4.1.4 Liquid Limit
Table below showed percentage of moisture content for liquid limit of soil sample.
Container no. unit 1 2 3
Average penetration mm 15.5 16.5 24.5
Mass of wet soil +container g 70.9 71.1 85.1
Mass of dry soil + container g 56.28 58.98 70.34
Mass of container g 20.78 29.67 38.31
Mass of moisture g 14.62 12.12 14.76
Mass of dry soil g 35.5 29.31 32.03
Moisture content % 41.2 41.35 46.1
Table 4.3: Liquid Limit
Average penetration vs Moisture content 30
25
20
15
10
5
0
41.2 41.35 46.1
Average penetration
Figure 4.1: Penetration vs. Moisture content
24
Discussion
From the table of 4.3, the average of liquid limit of soil sample was found to be 42%.
From the graph of penetration vs. moisture content, it was found that as moisture content
increase the penetration depth also will increase.
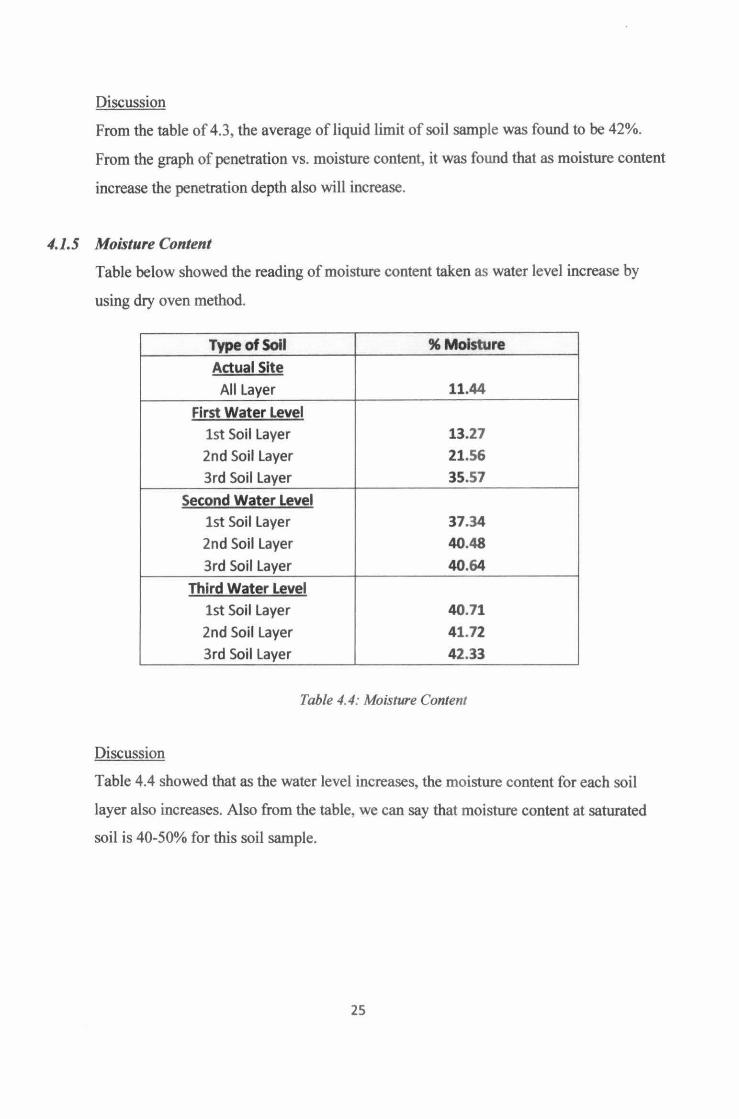
4.1.5 Moisture Content
Table below showed the reading of moisture content taken as water level increase by
using dry oven method.
Type of Soil %Moisture
Actual Site
All layer 11.44
First Water Level
1st Soil layer 13.27
2nd Soil layer 21.56
3rd Soil layer 35.57
Second Water Level
1st Soil layer 37.34 2nd Soil layer 40.48
3rd Soil layer 40.64
Third Water Level
1st Soil layer 40.71 2nd Soil layer 41.72 3rd Soil layer 42.33
Table 4.4: Moisture Content
Discussion
Table 4.4 showed that as the water level increases, the moisture content for each soil
layer also increases. Also from the table, we can say that moisture content at saturated
soil is 40-50% for this soil sample.
25
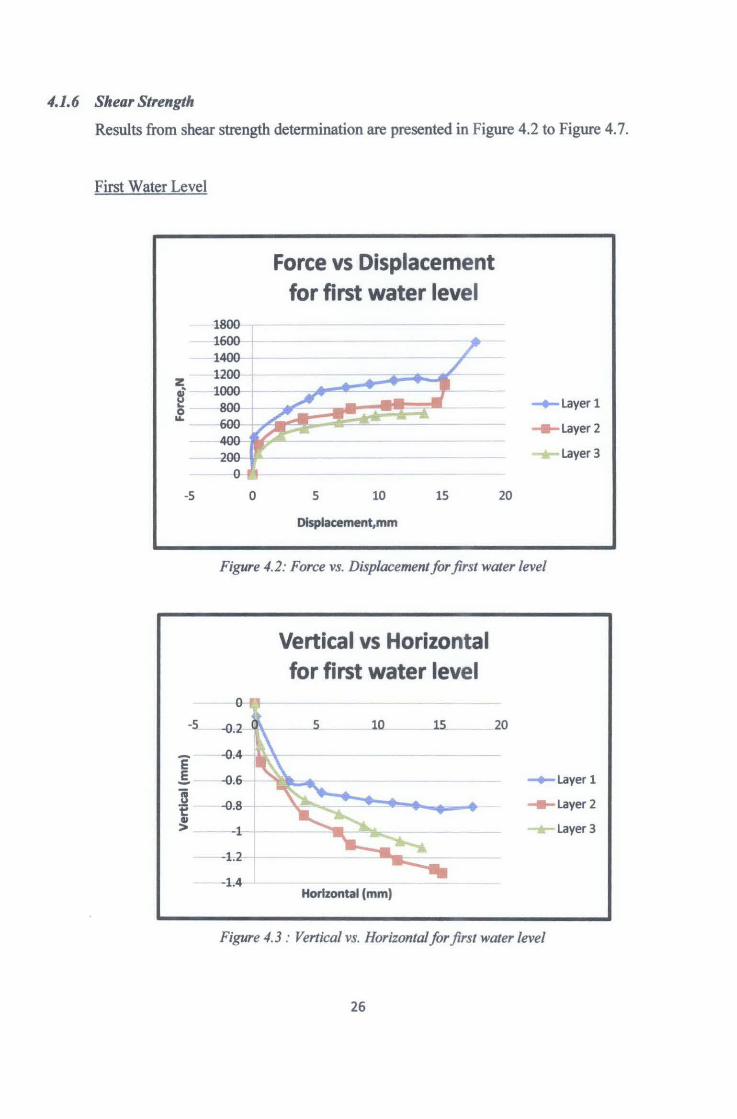
4.1.6 Shear Strength
Results from shear strength determination are presented in Figure 4.2 to Figure 4.7.
First Water Level
z ~ 0
""
-5
-5
'E .§.
~ ~ II >
1800 1600 1400 1200 1000
800 600 400 200
0
0
Force vs Displacement for first water level
5 10 15
Olsplacement,mm
20
Figure 4.2: Force vs. Displacement for first water level
Vertical vs Horizontal for first water level
0
-o.2 20
-0.4
-o.6 -o.s
-1
-1.2
-1.4 Horizontal (mm)
Figure 4.3 : Vertical vs. Horizontal for first water level
26
layer 1
layer 2
layer 3
layer 1
layer 2
layer 3
Second Water Level
1600 1400 1200
z 1000 u 800 u ... :1. 600
400 200
0
0
-0.2 -E -0.4 E -"B -0.6
-e II >
-0.8
-1
-1.2
Force vs Displacement for second water level
Layer 1
Layer 2
Layer 3
---0 5 10 15 20
Displacement, mm
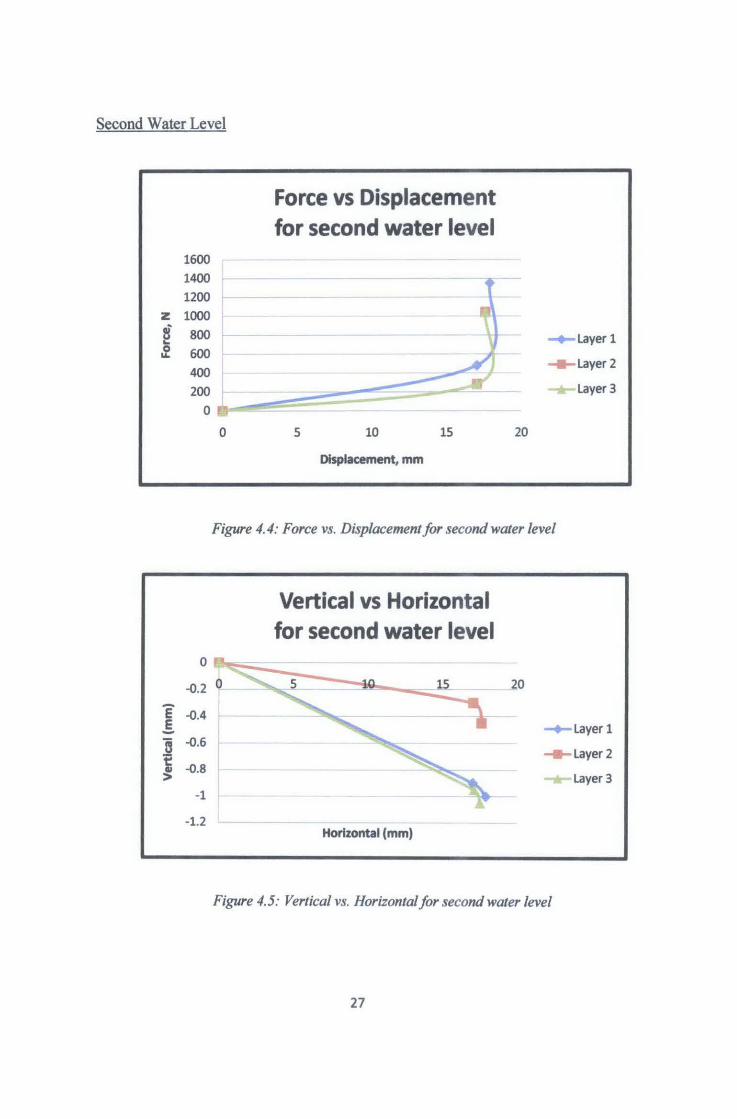
Figure 4. 4: Force vs. Displacement for second water level
0
Vertical vs Horizontal for second water level
5 --
Horizontal (mm)
20
-t Layer 1
Layer 2
Layer 3
Figure 4. 5: Vertical vs. Horizontal for second water level
27
Third Water Level
1200
1000
z 800
~ ... 600 0 ~ 400
200
0 _,
Force vs Displacement for Third Water Level
0 5 10 15 20
Displacement, mm
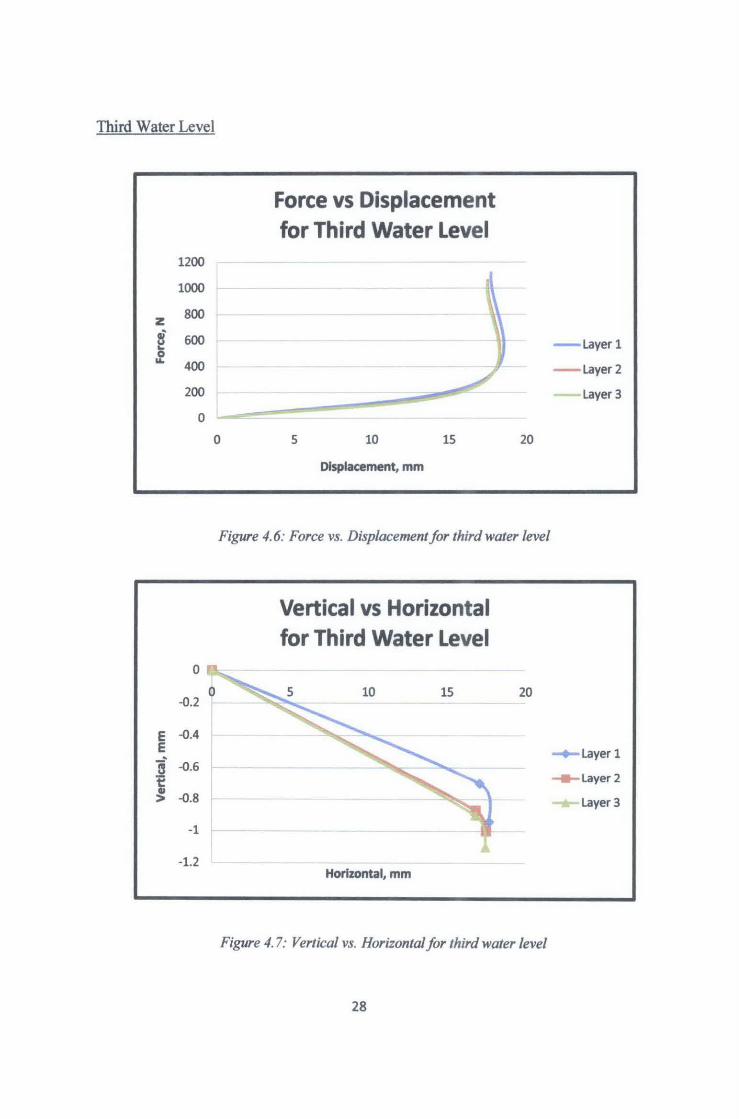
Figure 4.6: Force vs. Displacement for third water level
Vertical vs Horizontal for Third Water Level
0
0 20 -0.2
E -0.4 E
~ ~.6 ~ ~ -0.8
-1 ~
-1.2 Horizontal, mm
Figure 4. 7: Vertical vs. Horizontal for third water level
28
Layer 1
Layer 2
Layer 3
Layer 1
Layer 2
Layer 3
Discussion
From graph of Force vs. Displacement, it was clear that less force is taken to displace the
soil when the moisture content of the soil increasing. That why as the water level
increase, the force to displace the soil was decreasing.
From graph of Vertical vs. Horizontal, the condition of soil was determined whether it
dense or loose in the soil box. From the graph above, the condition of soil found to be
loose because the line was in negative value.
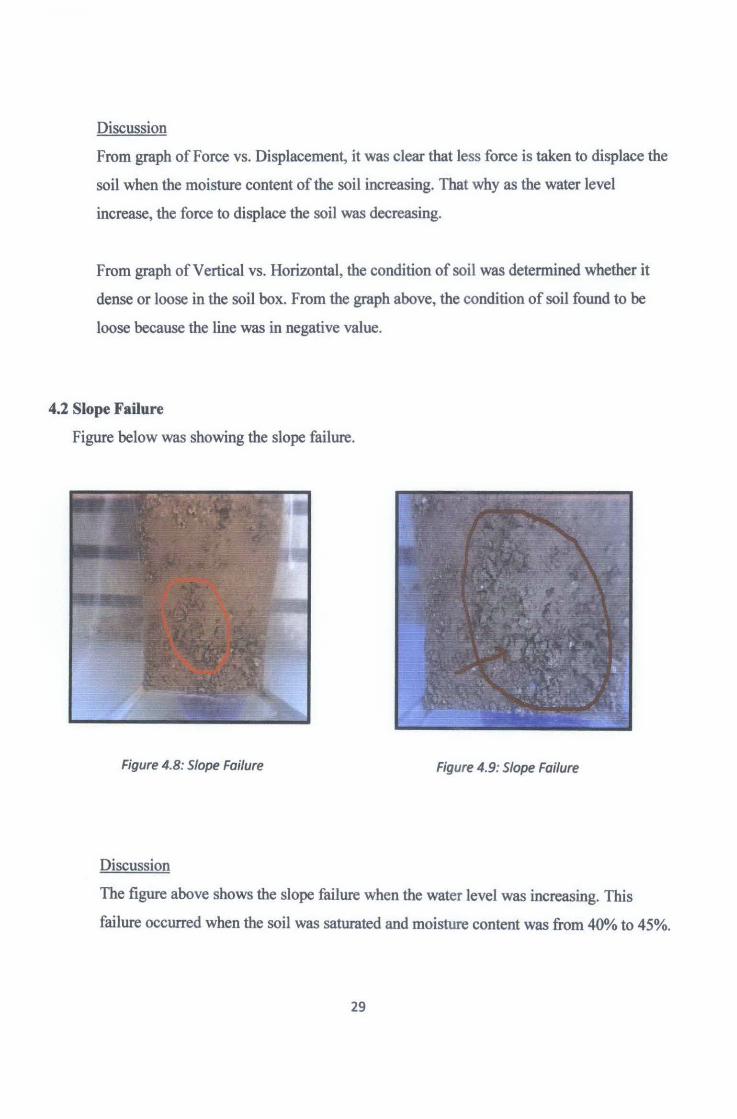
4.2 Slope Failure
Figure below was showing the slope failure.
Figure 4.8: Slope Failure Figure 4.9: Slope Failure
Discussion
The figure above shows the slope failure when the water level was increasing. This
failure occurred when the soil was saturated and moisture content was from 40% to 45%.
29
4.3 Comparing Soil Layer at Different Water Level
1st Soil Layer
2000
1500
~ 1000 .. 0 u.
500
0
-5
2nd Soil Layer
1200 1000
~ 800
... 600 0 u. 400 200
0
0
Force vs Displacement for Ieveil
Actual site
First Water Level
Second Water Level
~ Third Water Level 5 10 15 20
Displacement
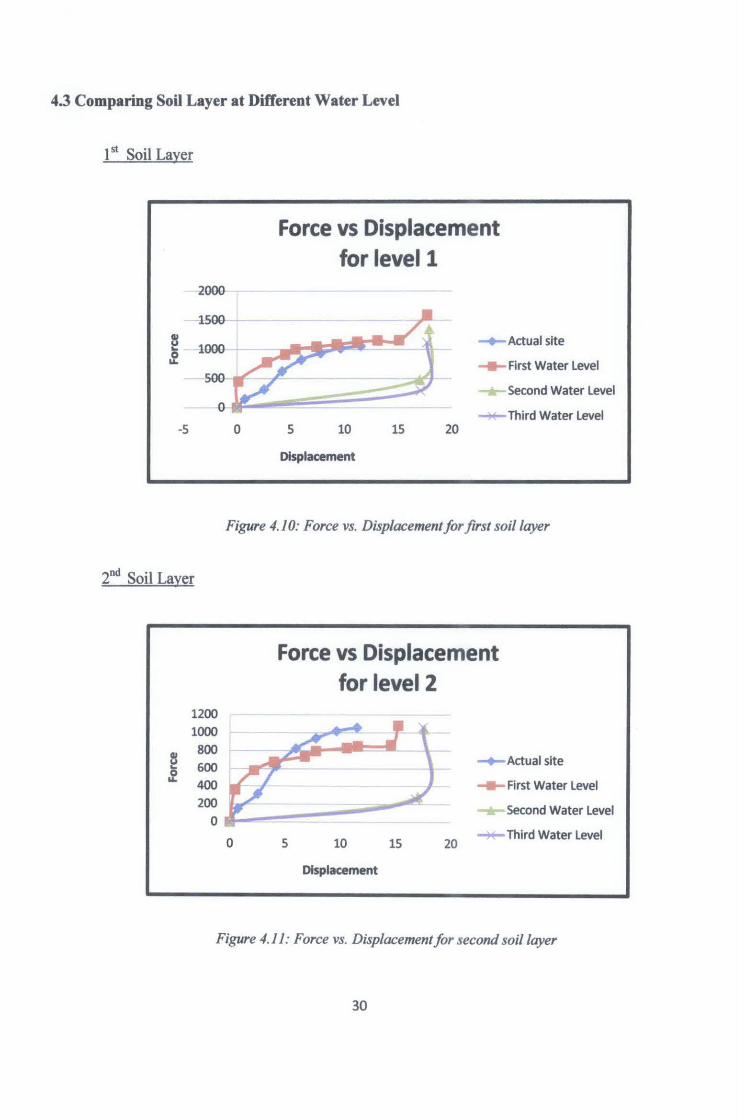
Figure 4.10: Force vs. Displacement for first soil layer
0
Force vs Displacement for level2
5 10
Displacement
15 20
-+-Actual site
First Water Level
Second Water Level
~Third Water Level
Figure 4.11: Force vs. Displacement for second soil layer
30
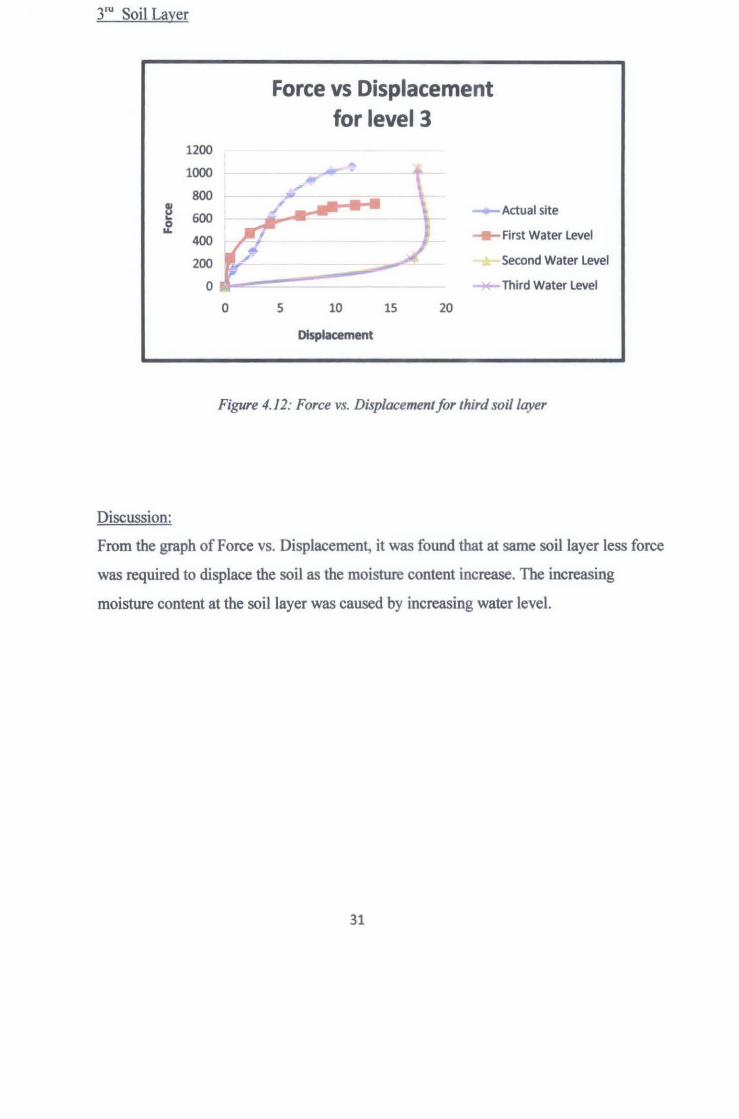
3 ru Soil Layer
1200
1000
800 ~ 0 ... 600
400
200
0
Discussion:
0
Force vs Displacement for level3
__.,- ... AI" ,
/" ... r~ ··
Actual site
First Water Level
Second Water Level
~ Third Water Level
5 10 15 20
Displacement
Figure 4.12: Force vs. Displacement for third soil layer
From the graph of Force vs. Displacement, it was found that at same soil layer less force
was required to displace the soil as the moisture content increase. The increasing
moisture content at the soil layer was caused by increasing water level.
31
CHAPTERS
CONCLUSION & RECCOMENDATION
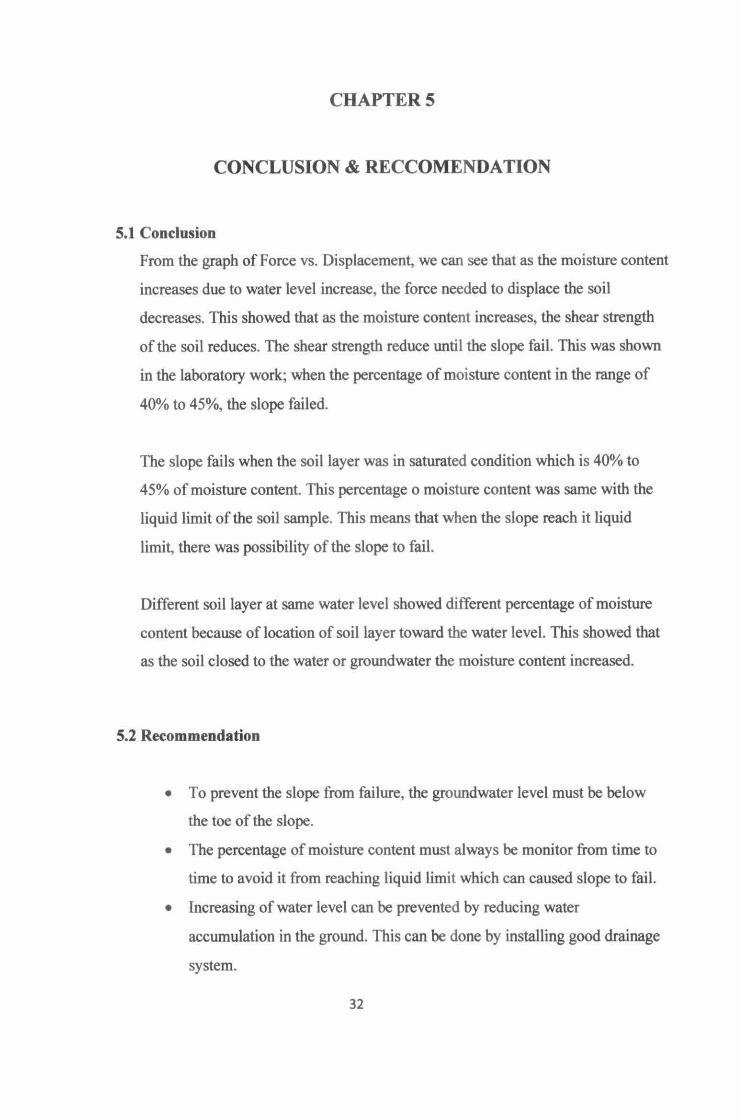
5.1 Conclusion
From the graph of Force vs. Displacement, we can see that as the moisture content
increases due to water level increase, the force needed to displace the soil
decreases. This showed that as the moisture content increases, the shear strength
of the soil reduces. The shear strength reduce until the slope fail. This was shown
in the laboratory work; when the percentage of moisture content in the range of
40% to 45%, the slope failed.
The slope fails when the soil layer was in saturated condition which is 40% to
45% of moisture content. This percentage o moisture content was same with the
liquid limit of the soil sample. This means that when the slope reach it liquid
limit, there was possibility of the slope to fail.
Different soil layer at same water level showed different percentage of moisture
content because of location of soil layer toward the water level. This showed that
as the soil closed to the water or groundwater the moisture content increased.
5.2 Recommendation
• To prevent the slope from failure, the groundwater level must be below
the toe of the slope.
• The percentage of moisture content must always be monitor from time to
time to avoid it from reaching liquid limit which can caused slope to fail.
• Increasing of water level can be prevented by reducing water
accumulation in the ground. This can be done by installing good drainage
system.
32
REFERENCES
Braja M.Das. 2003. Principles of Geotechnical engineering. 5th Edition.
Duncan~ J.M. 1996. Soil Slope Stability Analysis. Landslides: Investigation and Mitigatio~ Transportation Reseach Board National Academy Press Washinton~ D.C.
Fraser, A.M. 1957. The Influence of Stress Ratio on Compressibility and Pore Pressure Coefficients in Compacted Soils. Ph.D. thesis~ University of London.
Frederick K. Lutgens & Edward J.Tarbuck. 2003. Essential of geology. Eight
editions.
GE Barnes. Soil mechanics principles and practice. 2nd edition.
Hafiz, M.A.A. 1950. Strength Characteristics of Sands and Gravels in Direct Shear. Ph.D. thesis, University of London.
Head, K.H. 1992. Manual of Soil Laboratory Testing~ Volume I: Soil Classification and Compaction Tests. 2nd editions.
J. Michael Duncan and Stephen G. Wright. 2005. Soil strength and Slope stability.
K.S.Li~ J.N. Kay and K.K.S.Ho. May 1997. Slope engineering in Hong Kong.
Lambe, T.W., and Whitm~ R.V. 1969. Soil Mechanics. John Wiley and Sons, New York.
Lunne~ T., Robertso~ P.K.~ and Powell~ J.J.M. 1997. Cone Penetration Testing in Geotechnical Practice. Blackie Academic Publishers~ London.
Michalowski~ R.L.2002. Stability Charts for Uniform Slopes. Journal of Geotechnical and Geoenvironmental Engineering, ASCE vol.128~ pp.3 51-3 55.
Sarm~ S.K. 1979. Stability Analysis of Embankment and Slopes Geotechnique~ Vol.23~ pp.423-433.
Skempto~ A.W. 1964. Long-term Stability of Clay Slopes. Fourth Rankine Lecture. Geotechnique. Vol. 14~ No.2, pp 75-102.
V.N.S. Murthy. 2002. Geotechnical engineering: principles and practices of soil
mechanics and foundation engineering.
33

APPENDIX
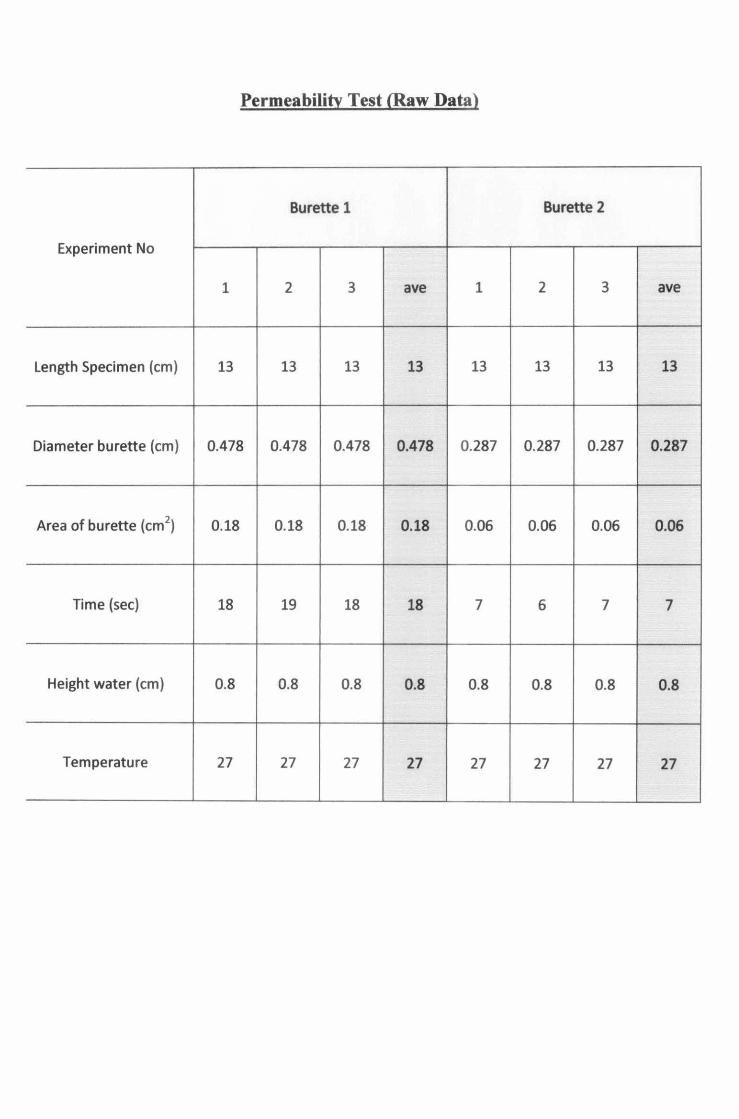
Permeability Test (Raw Data)
Burette 1 Burette 2
Experiment No
1 2 3 ave 1 2 3 ave
length Specimen (em) 13 13 13 13 13 13 13 13
Diameter burette (em) 0.478 0.478 0.478 0.478 0.287 0.287 0.287 0.287
Area of burette (cm2) 0.18 0.18 0.18 0.18 0.06 0.06 0.06 0.06
Time (sec) 18 19 18 18 7 6 7 7
Height water (em) 0.8 0.8 0.8 0.8 0.8 0.8 0.8 0.8
Temperature 27 27 27 27 27 27 27 27
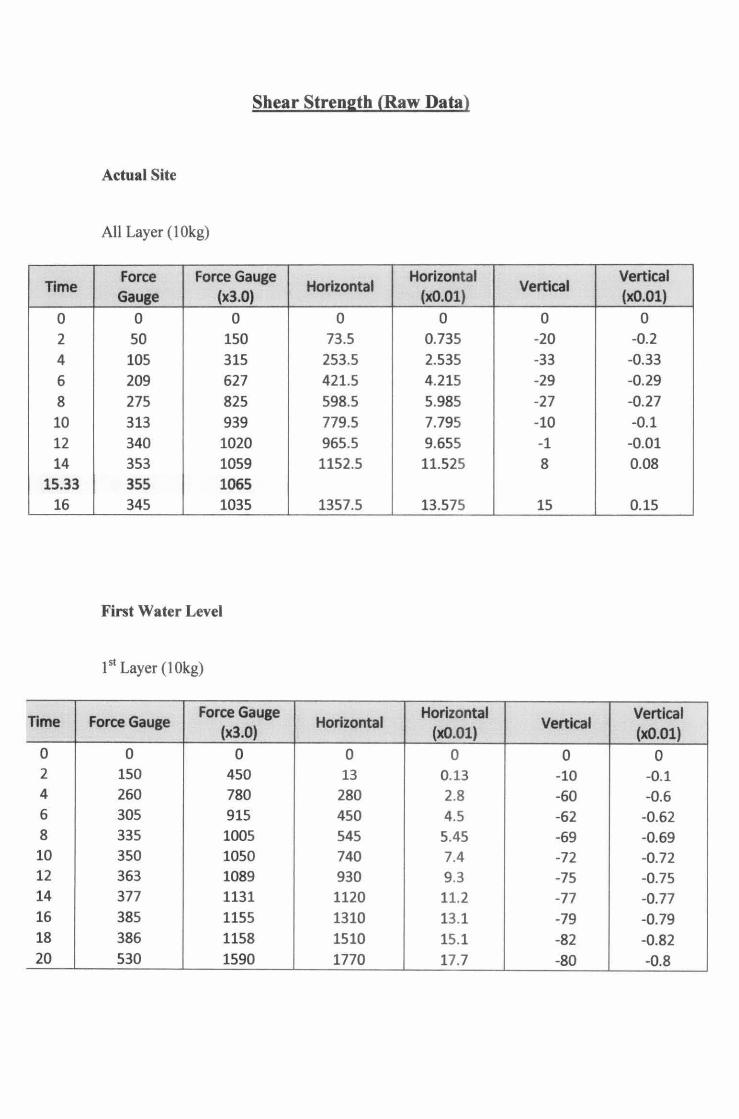
Shear Strene;th (Raw Data)
Actual Site
All Layer (1 Okg)
Force Force Gauge Horizontal
Horizontal Vertical
Vertical Time
Gauge (x3.0) (x0.01) (x0.01)
0 0 0 0 0 0 0 2 50 150 73.5 0.735 -20 -0.2 4 105 315 253.5 2.535 -33 -0.33 6 209 627 421.5 4.215 -29 -0.29 8 275 825 598.5 5.985 -27 -0.27
10 313 939 779.5 7.795 -10 -0.1 12 340 1020 965.5 9.655 -1 -0.01 14 353 1059 1152.5 11.525 8 0.08
15.33 355 1065 16 345 1035 1357.5 13.575 15 0.15
First Water Level
1st Layer ( 1 Okg)
Time Force Gauge Force Gauge
Horizontal Horizontal
Vertical Vertical
(x3.0} (x0.01) (x0.01} 0 0 0 0 0 0 0 2 150 450 13 0.13 -10 -0.1 4 260 780 280 2.8 -60 -0.6 6 305 915 450 4.5 -62 -0.62 8 335 1005 545 5.45 -69 -0.69 10 350 1050 740 7.4 -72 -0.72 12 363 1089 930 9.3 -75 -0.75 14 377 1131 1120 11.2 -77 -0.77 16 385 1155 1310 13.1 -79 -0.79 18 386 1158 1510 15.1 -82 -0.82 20 530 1590 1770 17.7 -80 -0.8
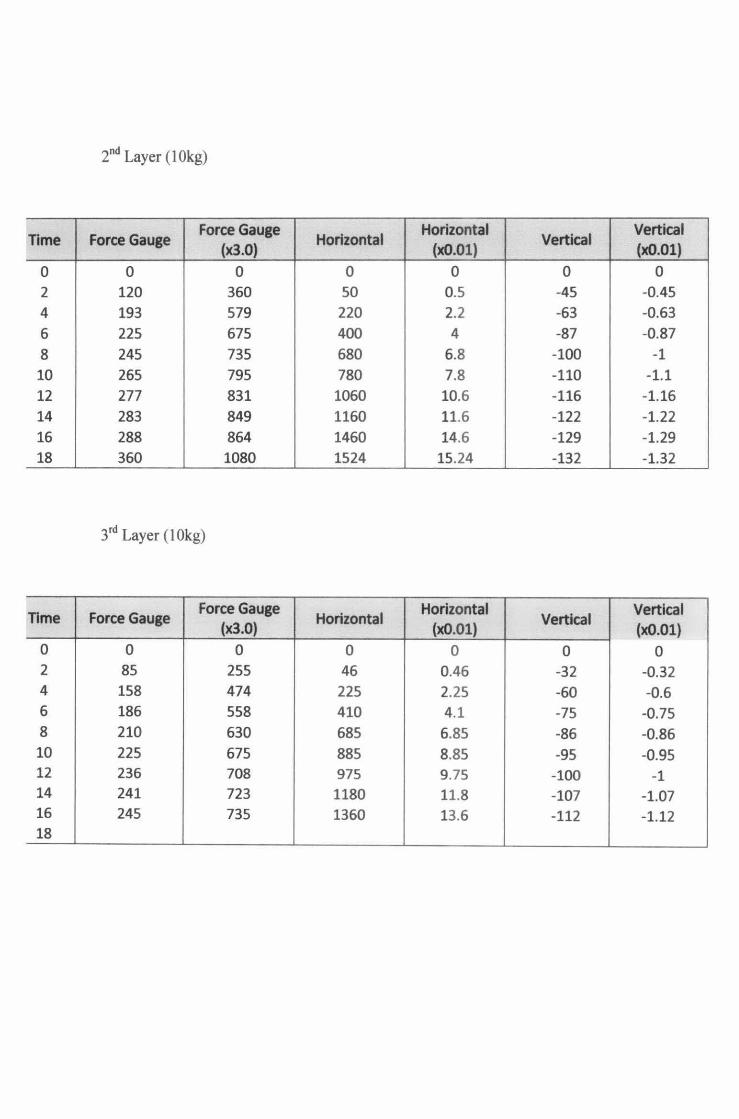
2"d Layer (I Okg)
Time Force Gauge Force Gauge
Horizontal Horizontal
Vertical Vertical
(x3.0} (xO.Ol} (xO.Ol)
0 0 0 0 0 0 0 2 120 360 50 0.5 -45 -0.45 4 193 579 220 2.2 -63 -0.63 6 225 675 400 4 -87 -0.87 8 245 735 680 6.8 -100 -1 10 265 795 780 7.8 -110 -1.1 12 277 831 1060 10.6 -116 -1.16 14 283 849 1160 11.6 -122 -1.22 16 288 864 1460 14.6 -129 -1.29 18 360 1080 1524 15.24 -132 -1.32
3rd Layer (I Okg)
Time Force Gauge Force Gauge
Horizontal Horizontal
Vertical Vertical
(x3.0} (x0.01} (x0.01} 0 0 0 0 0 0 0 2 85 255 46 0.46 -32 -0.32 4 158 474 225 2.25 -60 -0.6 6 186 558 410 4.1 -75 -0.75 8 210 630 685 6.85 -86 -0.86 10 225 675 885 8.85 -95 -0.95 12 236 708 975 9.75 -100 -1 14 241 723 1180 11.8 -107 -1.07 16 245 735 1360 13.6 -112 -1.12 18
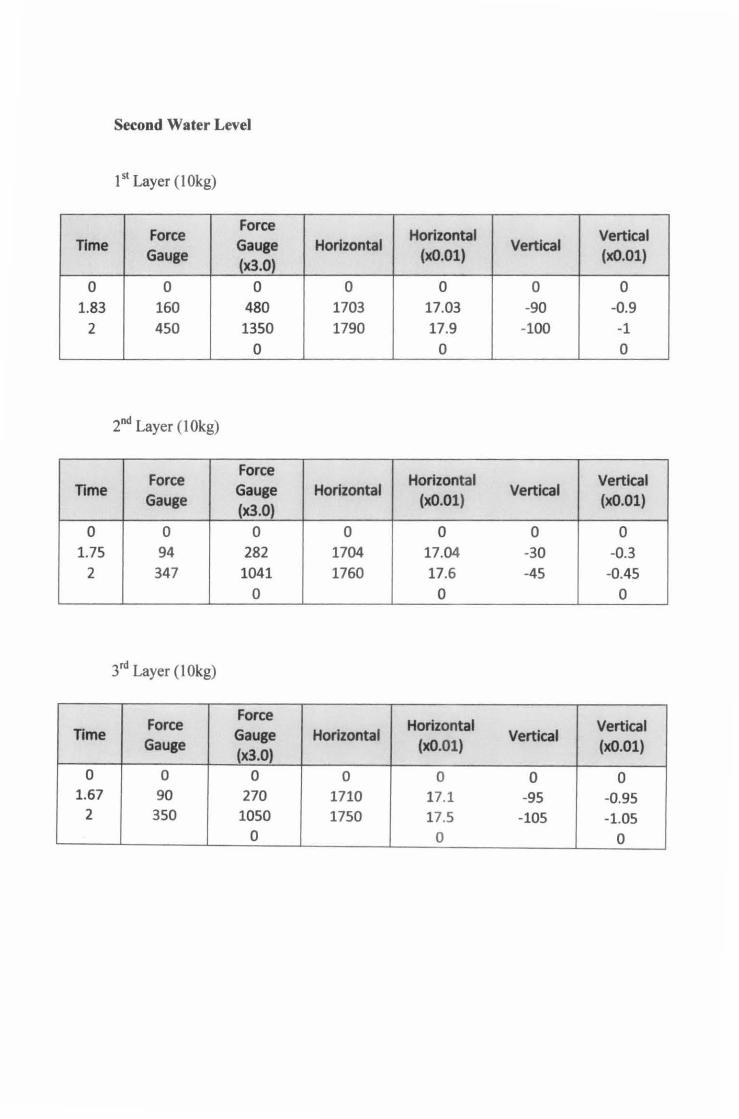
Second Water Level
1st Layer ( 1 Okg)
Force Force
Horizontal Vertical Time
Gauge Gauge Horizontal
(xO.Ol) Vertical
(xO.Ol) (x3.0)
0 0 0 0 0 0 0 1.83 160 480 1703 17.03 -90 -0.9
2 450 1350 1790 17.9 -100 -1 0 0 0
2"d Layer (1 Okg)
Force Force
Horizontal Vertical Time Gauge Horizontal Vertical
Gauge (xO.Ol) (xO.Ol) (x3.0)
0 0 0 0 0 0 0 1.75 94 282 1704 17.04 -30 -0.3
2 347 1041 1760 17.6 -45 -0.45 0 0 0
3rd Layer (1 Okg)
Force Force
Horizontal Vertical Time Gauge Horizontal Vertical Gauge (xO.Ol) (xO.Ol)
(x3.0) 0 0 0 0 0 0 0
1.67 90 270 1710 17.1 -95 -0.95 2 350 1050 1750 17.5 -105 -1.05
0 0 0
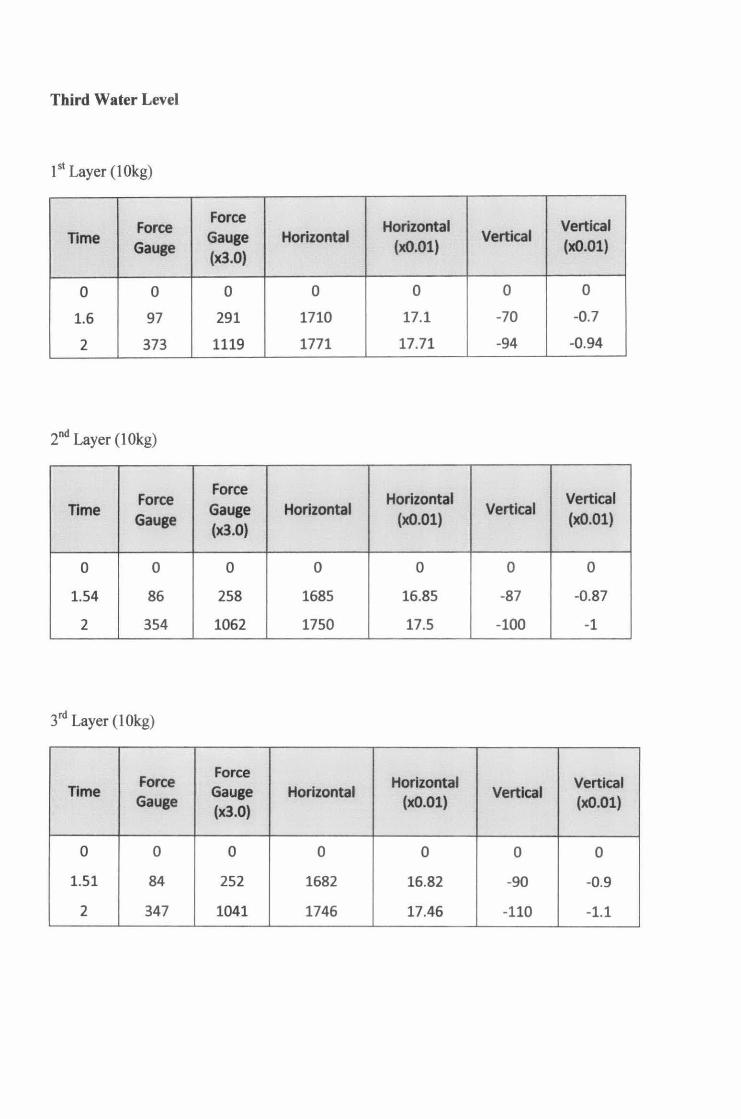
Third Water Level
I st Layer (I Okg)
Force Force
Horizontal Vertical Time
Gauge Gauge Horizontal
(xO.Ol) Vertical
(xO.Ol) (x3.0)
0 0 0 0 0 0 0
1.6 97 291 1710 17.1 -70 -0.7
2 373 1119 1771 17.71 -94 -0.94
2"d Layer (1 Okg)
Force Force
Horizontal Vertical Time Gauge Horizontal Vertical
Gauge (xO.Ol) (xO.Ol) (x3.0)
0 0 0 0 0 0 0
1.54 86 258 1685 16.85 -87 -0.87
2 354 1062 1750 17.5 -100 -1
3 rd Layer ( 1 Okg)
Force Force
Horizontal Time Gauge Horizontal Vertical
Vertical Gauge (xO.Ol) (xO.Ol)
(x3.0)
0 0 0 0 0 0 0
1.51 84 252 1682 16.82 -90 -0.9
2 347 1041 1746 17.46 -110 -1.1