effect of lime and fly ash on cation exchange capacity ... · capacity (cec) and unconfined...
TRANSCRIPT
Effect of Lime and Fly ash on Cation Exchange
Capacity (CEC) and Unconfined Compressive
Strength (UCS) of Soils
A THESIS SUBMITTED IN PARTIAL FULFILMENT
OF THE REQUIREMENTS FOR THE DEGREE OF
Master of Technology
in
Civil Engineering
By
KHAN MOHAMMEDALI ASGARALI
(Roll No. 213CE1038)
Under the guidance of
Dr. RABI NARAYAN BEHERA
DEPARTMENT OF CIVIL ENGINEERING
NATIONAL INSTITUTE OF TECHNOLOGY ROURKELA
ODISHA-769008
MAY 2015

Page | i
Department of Civil Engineering
NIT Rourkela
Rourkela – 769008
Odisha, India
www.nitrkl.ac.in
CERTIFICATE
This is to certify that the thesis entitled "Effect of lime and fly ash on Cation Exchange
Capacity (CEC) and Unconfined Compressive Strength (UCS) of Soils" being submitted
by Khan Mohammedali Asgarali bearing Roll No. 213CE1038 towards partial fulfilment of
the requirement to award the degree of Master of Technology in Geotechnical Engineering at
Department of Civil Engineering, National Institute of Technology Rourkela is a record of
bonafide work carried out by him under my guidance and supervision. It is further certified that
the contents presented in this thesis has not been submitted elsewhere for the award of any
degree or diploma.
Dr. Rabi Narayan Behera
Place: Rourkela Department of Civil Engineering
Date: NIT Rourkela
Odisha 769008

Page | ii
ACKNOWLEDGEMENT
First of all I would like to express my heartfelt gratitude to my project supervisor Dr. Rabi
Narayan Behera, Department of Civil Engineering for his able guidance, encouragement,
support and suggestions during the project work.
I would like to extend my gratefulness to Dr. S. K. Sahu, Head of the Civil Engineering
Department, National Institute of Technology, Rourkela, for providing the necessary facilities
for my project work.
I am grateful to Dr. N. Roy, Dr. S. P. Singh, Dr. C. R. Patra, Dr. S. K. Das, Dr. R. Bag, and
Dr. S. Patra and all professors of Civil Engineering Department for providing me a concrete
background.
A special word of thanks to Prof. N. Panda, Head of Chemistry Department for providing the
chemicals and Prof. K. Pramnik, Head of Biotechnology and Medical engineering for
permitting to analyse the samples.
I would like to thank Mr. Manoj Kumar Sahu and other Ph. D. Scholars of Chemistry
Department for their help and support. I am also thankful to Mr. Bikram Kumar Nayak of
biotechnology and medical engineering department for his co-operation.
I would also like to thank all the staff members of Geotechnical Engineering laboratory for
their assistance and co-operation during the course of experimentation.
I thank all who in one way or another contributed in the completion of this thesis. I would like
to thank my friends for making my stay at NIT Rourkela pleasant.
I am greatly indebted to my parents and family members for their unwavering support that
helped me at every step of life. Their sincere blessings and wishes have enabled me to complete
my work successfully.
Above all thanks to God, the Almighty, for His blessings throughout my research work to
complete the thesis.
Khan Mohammedali
Roll No. 213CE1038
Page | iii
ABSTRACT
The utilization of fly ash in India varies between 50-60% and the rest are disposed in ash ponds.
The fly ash which are utilized for reclamation of low lying areas or which are used in
geotechnical engineering application has the tendency of leaching the heavy metal pollutants
and thus polluting the groundwater, surface water and surrounding soil. Also the discharge of
effluents from waste water treatment plants may lead to pollution of the ground water. If these
ground water pollution can be controlled by increasing the Cation Exchange Capacity of the
sub soil through application of any of the additives such as lime, fly ash, cement etc. which
also leads to increase in strength of the soil then that additive would be favourable in case of
geotechnical projects where ground water pollution is of great concern.
The present work aims to find the effect of additives namely Lime and Fly ash on Cation
Exchange Capacity (CEC), Compaction characteristics, and Unconfined Compressive Strength
(UCS) of two soils. The two soils used in this study are Sandy Clay (SC) and Low Plasticity
Clay (CL). First the soils were mixed individually with varying contents of lime and fly ash to
find out their effects on Cation Exchange Capacity (CEC) and for conducting Light compaction
test to find the compaction characteristics. Then the treated soil samples compacted at
Optimum Moisture Content (OMC) and Maximum Dry Density (MDD) were tested for
Unconfined Compressive Strength (UCS) at different Curing periods.
From the experimental results obtained, it is observed that for both soils, Cation Exchange
Capacity (CEC) decreases more with increase in fly ash content than with Lime content. Also
Optimum Moisture Content (OMC) increases and Maximum Dry density (MDD) decreases
with increase in Lime and Fly ash content for both the soil samples. The Unconfined
Compressive Strength (UCS) increases with lime and fly ash content up to a certain limit
beyond which further increase in lime and fly ash content does not increase the Unconfined
Compressive Strength (UCS). The Unconfined Compressive Strength (UCS) increases more
with increase in Lime content than by increase in fly ash content. The Unconfined Compressive
Strength (UCS) increases with curing time.
Page | iv
TABLE OF CONTENTS
ACKNOWLEDGEMENT ....................................................................................................... ii
ABSTRACT ............................................................................................................................ iii
TABLE OF CONTENTS ....................................................................................................... iv
LIST OF TABLES ................................................................................................................. vii
LIST OF FIGURES ............................................................................................................. viii
LIST OF ABBREVIATIONS ................................................................................................. x
1. INTRODUCTION ............................................................................................................ 1
2. LITERATURE REVIEW ................................................................................................... 3
2.1 Introduction .................................................................................................................... 3
2.2 Cation Exchange Capacity (CEC) ................................................................................ 3
2.2.1 Mineralogy and Cation Exchange Capacity (CEC) ................................................... 3
2.2.2 Atterberg limit and Cation Exchange Capacity (CEC) ............................................. 4
2.2.2.1 Liquid limit ......................................................................................................... 4
2.2.2.2 Plastic limit ......................................................................................................... 4
2.2.2.3 Shrinkage limit .................................................................................................... 5
2.2.3 Plasticity and Cation Exchange Capacity (CEC) ...................................................... 5
2.2.4 Specific surface area and Cation Exchange Capacity (CEC) .................................... 5
2.2.5 Clay Fraction and Cation Exchange Capacity (CEC) ............................................... 6
2.2.6 Organic matter and Cation Exchange Capacity (CEC) ............................................. 6
2.2.7 Activity and Cation Exchange Capacity (CEC) ........................................................ 6
2.2.8 Modified free swell index and Cation Exchange Capacity (CEC) ............................ 7
2.2.9 Hydraulic conductivity and Cation Exchange Capacity (CEC) ................................ 7
2.2.10 Compressibility and Cation Exchange Capacity (CEC) .......................................... 7
Page | v
2.2.11 Multiple linear regression equation for predicting Cation Exchange Capacity
(CEC) .................................................................................................................................. 7
2.3 Effect of lime ................................................................................................................... 9
2.3.1 Effect of lime on Cation Exchange Capacity (CEC) ................................................. 9
2.3.2 Effect of lime on Compaction characteristics and Unconfined Compressive strength
.......................................................................................................................................... 10
2.4 Effect of Fly ash ............................................................................................................ 11
2.4.1 Effect of fly ash on Cation Exchange Capacity (CEC) ........................................... 11
2.4.2 Effect of Fly ash on Compaction characteristics and Unconfined Compressive
strength ............................................................................................................................. 12
2.5 Scope of the present study ........................................................................................... 13
3. MATERIAL CHACTERISATION AND METHODOLOGY ...................................... 14
3.1 Introduction .................................................................................................................. 14
3.2 Material Characteristics and Methodology ............................................................... 14
3.2.1 Specific Gravity ....................................................................................................... 14
3.2.2 Particle size distribution .......................................................................................... 15
3.2.3 Atterberg limit test ................................................................................................... 16
3.2.4 Light Compaction test ............................................................................................. 16
3.2.5 Unconfined compressive strength ........................................................................... 18
3.2.6 Direct Shear Test ..................................................................................................... 18
3.2.7 pH test ...................................................................................................................... 19
3.2.8 XRD analysis ........................................................................................................... 19
3.3 Cation Exchange Capacity (CEC) .............................................................................. 21
4. RESULTS AND DISCUSSION ........................................................................................ 24
4.1 Introduction .................................................................................................................. 24
4.2 Cation Exchange Capacity (CEC) .............................................................................. 24
4.2.1 Effect of Lime .......................................................................................................... 24

Page | vi
4.2.2 Effect of Fly ash ...................................................................................................... 25
4.3 Compaction Characteristics ........................................................................................ 27
4.3.1 Effect of lime ........................................................................................................... 27
4.3.2 Effect of fly ash ....................................................................................................... 30
4.4 Unconfined Compressive strength .............................................................................. 33
4.4.1 Effect of lime ........................................................................................................... 33
4.4.2 Effect of Fly ash ...................................................................................................... 35
5. CONCLUSIONS & FUTURE SCOPE OF WORK ....................................................... 39
5.1 Conclusions ................................................................................................................... 39
5.2 Scope for future research work................................................................................... 39
REFERENCES ....................................................................................................................... 40
Page | vii
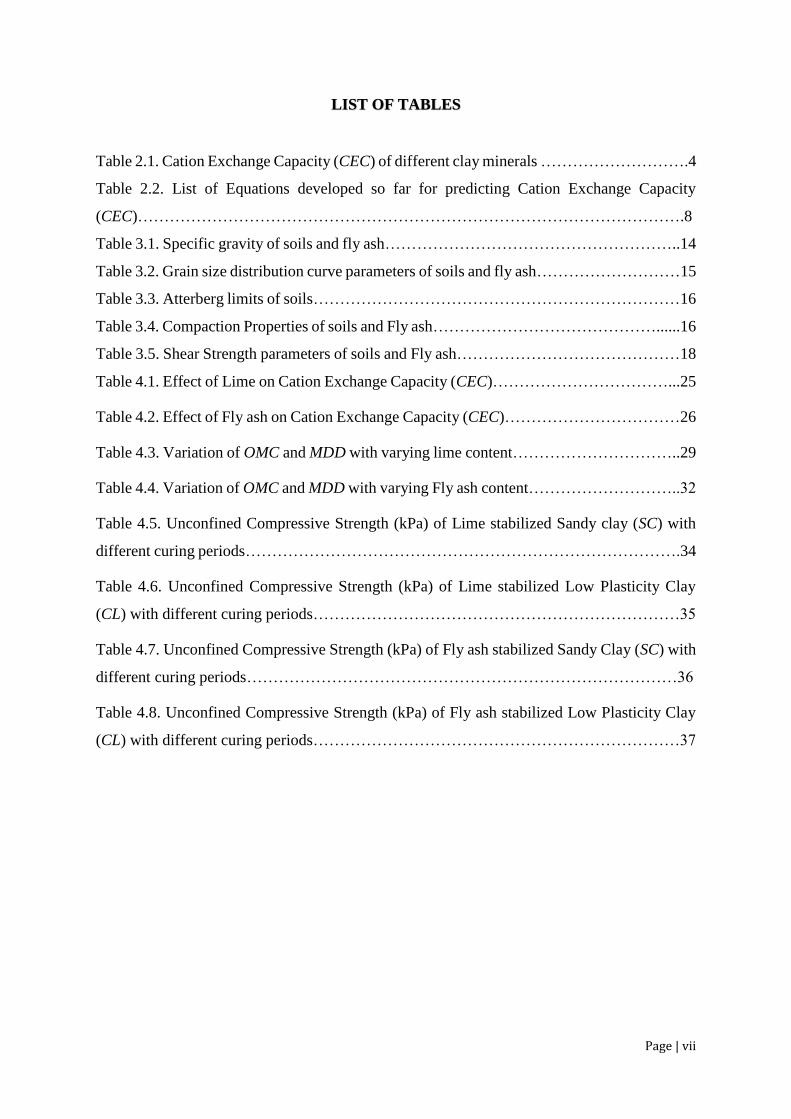
LIST OF TABLES
Table 2.1. Cation Exchange Capacity (CEC) of different clay minerals ……………………….4
Table 2.2. List of Equations developed so far for predicting Cation Exchange Capacity
(CEC)………………………………………………………………………………………….8
Table 3.1. Specific gravity of soils and fly ash………………………………………………..14
Table 3.2. Grain size distribution curve parameters of soils and fly ash………………………15
Table 3.3. Atterberg limits of soils……………………………………………………………16
Table 3.4. Compaction Properties of soils and Fly ash……………………………………......16
Table 3.5. Shear Strength parameters of soils and Fly ash……………………………………18
Table 4.1. Effect of Lime on Cation Exchange Capacity (CEC)……………………………...25
Table 4.2. Effect of Fly ash on Cation Exchange Capacity (CEC)……………………………26
Table 4.3. Variation of OMC and MDD with varying lime content…………………………..29
Table 4.4. Variation of OMC and MDD with varying Fly ash content………………………..32
Table 4.5. Unconfined Compressive Strength (kPa) of Lime stabilized Sandy clay (SC) with
different curing periods……………………………………………………………………….34
Table 4.6. Unconfined Compressive Strength (kPa) of Lime stabilized Low Plasticity Clay
(CL) with different curing periods……………………………………………………………35
Table 4.7. Unconfined Compressive Strength (kPa) of Fly ash stabilized Sandy Clay (SC) with
different curing periods………………………………………………………………………36
Table 4.8. Unconfined Compressive Strength (kPa) of Fly ash stabilized Low Plasticity Clay
(CL) with different curing periods……………………………………………………………37

Page | viii
LIST OF FIGURES
Figure 2.1. Plan view of test tank Used by Mathew and Rao (1997)………………………….9
Figure 3.1. Grain Size Distribution Curve of soils and fly ash……………………………….15
Figure 3.2. Light Compaction curve for Sandy Clay………………………………………....17
Figure 3.3. Light Compaction curve for Low Plasticity Clay……………………………........17
Figure 3.4. Light Compaction curve for fly ash……………………………………………....18
Figure 3.5. XRD Analysis of Sandy Clay…………………………………………………….19
Figure 3.6. XRD Analysis of Low plasticity clay…………………………………………….20
Figure 3.7. XRD Analysis of Fly ash………………………………………………………….20
Figure 3.8. Photographic image of Spectrophotometer……………………………………….22
Figure 3.9. Calibration curve for nitrogen concentration……………………………………..23
Figure 4.1. Variation in Cation Exchange Capacity (CEC) with lime content……………….24
Figure 4.2. Variation in Cation Exchange Capacity (CEC) with Fly ash content……………..26
Figure 4.3. Light Compaction curve for sandy clay (SC) with varying percentage of
lime…………………………………………………………………………………………...27
Figure 4.4. Light Compaction Curve for low plasticity clay (CL) with varying percentage of
lime…………………………………………………………………………………………...28
Figure 4.5. Variation of OMC with Lime Content……………………………………………28
Figure 4.6. Variation of MDD with Lime Content…………………………………………....29
Figure 4.7. Light Compaction curve for sandy clay (SC) with varying percentage of Fly
ash…….....................................................................................................................................30
Figure 4.8. Light Compaction Curve for low plasticity clay with varying percentage of fly
ash.............................................................................................................................................31
Figure 4.9. Variation of OMC with Fly ash Content………………………………………….31
Figure 4.10. Variation of MDD with Fly ash Content………………………………………...32
Page | ix
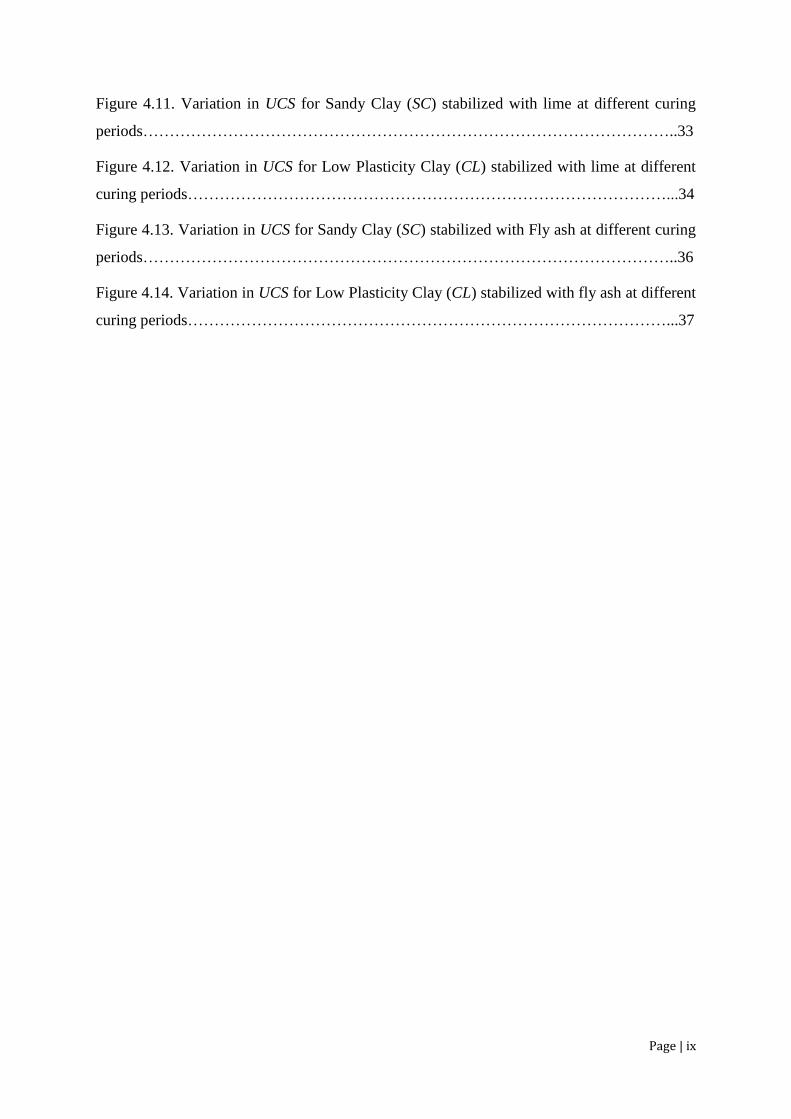
Figure 4.11. Variation in UCS for Sandy Clay (SC) stabilized with lime at different curing
periods………………………………………………………………………………………..33
Figure 4.12. Variation in UCS for Low Plasticity Clay (CL) stabilized with lime at different
curing periods………………………………………………………………………………...34
Figure 4.13. Variation in UCS for Sandy Clay (SC) stabilized with Fly ash at different curing
periods………………………………………………………………………………………..36
Figure 4.14. Variation in UCS for Low Plasticity Clay (CL) stabilized with fly ash at different
curing periods………………………………………………………………………………...37
Page | x
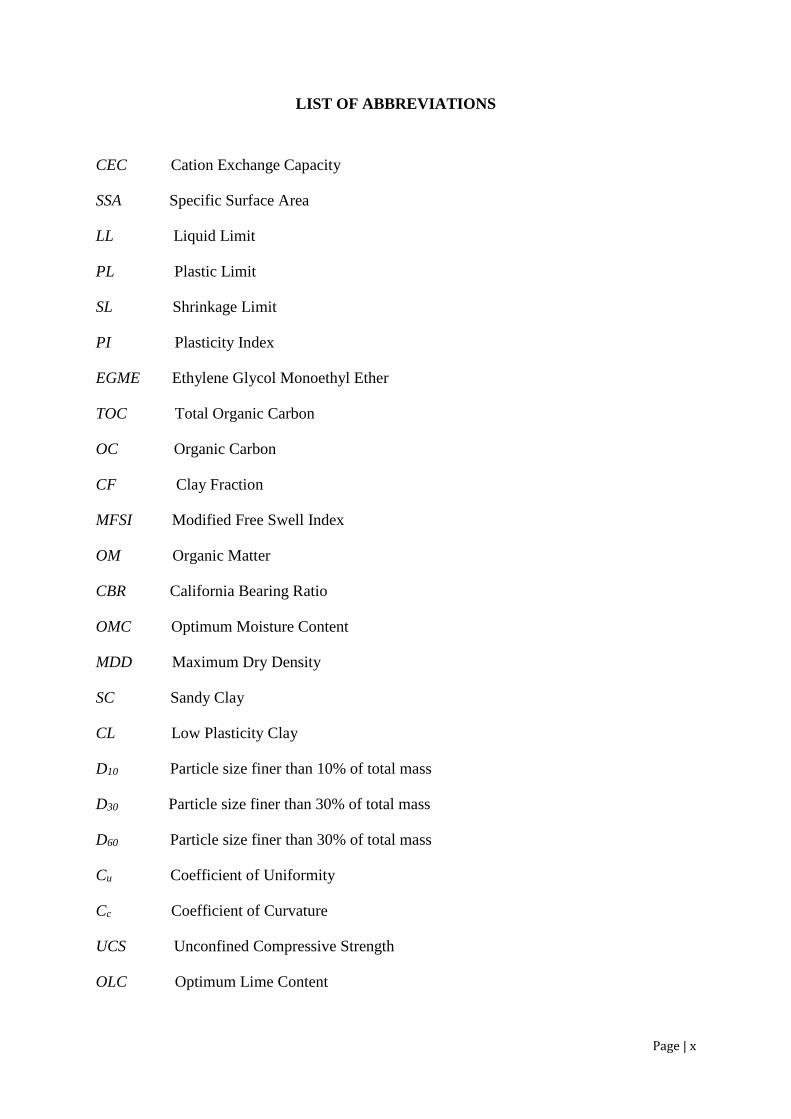
LIST OF ABBREVIATIONS
CEC Cation Exchange Capacity
SSA Specific Surface Area
LL Liquid Limit
PL Plastic Limit
SL Shrinkage Limit
PI Plasticity Index
EGME Ethylene Glycol Monoethyl Ether
TOC Total Organic Carbon
OC Organic Carbon
CF Clay Fraction
MFSI Modified Free Swell Index
OM Organic Matter
CBR California Bearing Ratio
OMC Optimum Moisture Content
MDD Maximum Dry Density
SC Sandy Clay
CL Low Plasticity Clay
D10 Particle size finer than 10% of total mass
D30 Particle size finer than 30% of total mass
D60 Particle size finer than 30% of total mass
Cu Coefficient of Uniformity
Cc Coefficient of Curvature
UCS Unconfined Compressive Strength
OLC Optimum Lime Content

Page | 1
1. INTRODUCTION
In India, there is an increase in the number and capacity of the thermal power plants because
of the increase in demand for electricity. Most of these thermal power plants use coals which
are of inferior quality. These inferior quality coals produce huge amount of fly ash. According
to the Central Electricity Authority (CEA) report on fly ash generation and utilization, 61
percent and 57.63 percent of the fly ash produced was utilized during the year 2012-2013 and
2013-2014 respectively. Thus the utilization of fly ash in India varies between 50-60% and
rests are disposed in ash ponds. These disposed fly ash and even the fly ash which are utilized
for reclamation of low lying areas has the tendency of leaching the heavy metal pollutants and
thus polluting the groundwater. This ground water pollution can be controlled by increasing
the Cation Exchange Capacity (CEC) of sub soil through application of additives such as lime,
fly ash, cement etc. so that the individual soil colloids can hold the pollutant cations at their
exchange sites.
So, if any of the additives which doesn’t affects or increases the Cation Exchange Capacity
(CEC) of the soil along with increasing the strength of the soil then the additive would be
beneficial in case of geo-environmental projects.
The surface properties of the fine grained soil may greatly influence their physical and chemical
properties. Fine grained soils differ in their surface properties like Cation Exchange Capacity
(CEC) and Specific Surface Area (SSA) mainly because of the type and amount of different
clay minerals, differences in grain size distribution. Cation Exchange Capacity (CEC) is
defined as the capacity of a soil to hold a certain amount of exchangeable ions at a given pH
value and is usually stated in milliequivalent per 100 gram of soil (meq/100 g). In SI units, it
is expressed as centimole per kilogram of soil (cmol/kg). The values presented in either
meq/100 g or cmol/kg are equivalent. Usually the Cation Exchange Capacity (CEC) is
measured at neutral pH values (pH=7). Soils differ in their Cation Exchange Capacity (CEC)
values according to grain size distribution, type and amount of different clay minerals present.
For example, approximate value of CEC for Sand is 2 meq/100 g, Kaolinite 3 meq/100 g, Illite
25 meq/100 g, Montmorillonite 100 meq/100 g. Besides these, Cation Exchange Capacity
(CEC) of soil is also influenced by presence of organic matter and pH value of soil.
Page | 2
Cation Exchange Capacity (CEC) of fine grained soils can be determined by various methods
but there are two standardised method given by International Soil Reference and Information
Centre namely (1) Extraction with Ammonium Acetate Method and (2) Silver Thiourea
Method. The various methods used for determining Cation Exchange Capacity (CEC) leads to
inconsistent results. The most frequently used method for determining Cation Exchange
Capacity (CEC) is the Ammonium Acetate method at neutral pH value. Also Silver Thiourea
is toxic in nature.
Many properties of the fine-grained soils may be clarified by the relationship between Cation
Exchange Capacity (CEC) and other geotechnical properties. By adding lime the existing
cations attached to the surface of the soil particles can be replaced with calcium ions which
leads to several improvements in the soil properties. These constructive changes are in the form
of increase in the strength, reduction in plasticity, and reduction in the compressibility. The
factors on which the replace ability of cations depend are valency, ion size and relative
abundance of different ion type. A small ion size replaces the larger ion size. If all other factors
are same the cations with high valency replaces the cations with low valency. But it is possible
to replace a high valency cations with low valency cations when there is a high concentration
of low valency cations in the soil solution. A typical replace ability series given by Mitchell
and Soga (2005) is as follows:
Na+ < Li+ < K+ < Cs+ < Mg+2 < Ca+2 < Cu+2 < Al+3 < Fe+3
It is necessary to have the knowledge of Cation Exchange Capacity (CEC) of the soil in many
areas of geotechnical engineering such as chemical stabilization, waste containment system
etc. The addition of lime to a soil provides an excess of calcium ions which leads to replacement
of all other cations with divalent calcium, Ca+2 leading to stabilization of soil. Soils with high
value of CEC have the potential to retain more cations in waste containment system (landfill)
and thereby reducing the risk of contamination of soil, subsurface soil and ground water. Also
Cation Exchange Capacity (CEC) is used in agricultural field as an indicator of fertility of soil.

Page | 3
2. LITERATURE REVIEW
2.1 Introduction
The surface properties like Cation Exchange Capacity (CEC) and specific surface area
influence the engineering properties of fine grained soils. Cation Exchange Capacity (CEC) is
defined as the capacity of a soil to hold a certain amount of exchangeable ions at a given pH
value. It is well documented in literature that adsorption capacity of soil is closely related to
Cation Exchange Capacity (CEC). In many areas of geotechnical engineering such as chemical
stabilization, waste containment system etc. It is necessary to have the knowledge of Cation
Exchange Capacity (CEC) of the soil. Addition of lime leads to stabilization of the soil as well
as can enhance the CEC of soil.
Therefore, the literature review is focused extensively in two areas i.e. Cation Exchange
Capacity (CEC) and Effect of additives on Cation Exchange Capacity (CEC), Compaction
characteristics and Unconfined Compressive Strength.
2.2 Cation Exchange Capacity (CEC)
It has been suggested that Cation Exchange Capacity (CEC) of soil correlates significantly with
engineering parameters such as specific surface area and liquid limit (Yukselen and Kaya
2006). The reactivity of the soil varies because of the differences in particle size distribution,
mineralogical and organic composition (Carter et al. 1986). Grinding of clay increases the
Cation Exchange Capacity (CEC) of clay because of the increase in surface area (Kelly et al.
1936). Cation Exchange Capacity (CEC) of fine grained soil is related to the amount and kind
of clay mineral present.
2.2.1 Mineralogy and Cation Exchange Capacity (CEC)
The Cation Exchange Capacity (CEC) of a soil is dependent on the mineralogy, size, and shape
of the constituent particles. Cation Exchange Capacity (CEC) increases with decreasing size of
constituent particles as the surface area increase. Thompson et al. (1989) suggested that
evaluation of the contribution made by organic matter to Cation Exchange Capacity (CEC) and
Specific Surface Area (SSA) of soil materials are difficult.

Page | 4
Table 2.1. Cation Exchange Capacity (CEC) of different clay minerals
(Advanced soil mechanics, B M Das) (2008)
Clay mineral Cation Exchange Capacity (CEC)
(meq/100 g)
Kaolinite 3
Illite 25
Montmorillonite 100
Vermiculite 150
2.2.2 Atterberg limit and Cation Exchange Capacity (CEC)
Atterberg limits can yield significant information about the behaviour of soils. Atterberg limits
are water contents at boundaries that show characteristic engineering behaviours. The
correlations so far have been developed at various plasticity level are mentioned below.
2.2.2.1 Liquid limit
Farrar and Coleman (1967) developed the linear regression equation between liquid limit and
Cation Exchange Capacity (CEC) given by
CEC=0.45∗LL−5 (R2=0.9) (2.1)
Similarly, Smith et al. (1985) obtained the relation between liquid limit and Cation Exchange
Capacity (CEC) using linear regression expressed as
CEC = 1.74∗LL−38.3 (R2=0.72) (2.2)
Furthermore, Yukselen and Kaya (2006) proposed the equation between liquid limit and Cation
Exchange Capacity (CEC) using linear regression given by
CEC= 0.2027∗LL+16.231 (R2=0.61) (2.3)
2.2.2.2 Plastic limit
Plastic limit (PL) is another important index property for identifying soil behaviour. The PL is
defined as the moisture content at which a thread of soil just crumbles when it is cautiously
rolled out to a diameter of 3 mm (Holtz and Kovacs (1981)).

Page | 5
Smith et al. (1985) obtained the linear regression equation between CEC and PL which is
expressed as
CEC=3.57∗PL−61.3 (R2=0.56) (2.4)
Yukselen and Kaya (2006) developed the relationship between CEC and PL using linear
regression given by
CEC=2.3067∗PL−40.3 (R2=0.46) (2.5)
2.2.2.3 Shrinkage limit
Yukselen and Kaya (2006) obtained no significant relationship between Cation Exchange
Capacity (CEC) and shrinkage limit as the correlation coefficient between shrinkage limit and
Cation Exchange Capacity (CEC) was R2=0 .2071 for the linear regression equation expressed
as
CEC= −1.7643∗SL+85.33 (R2=0.2) (2.6)
2.2.3 Plasticity and Cation Exchange Capacity (CEC)
The difference between the LL and the PL (PI =LL–PL) is defines as plasticity index. Yukselen
and Kaya (2006) obtained the relationship between CEC and PI using linear regression
equation expressed by
CEC=0.1873∗PI+33.13 (R2=0.3574) (2.7)
2.2.4 Specific surface area and Cation Exchange Capacity (CEC)
Gill and Reaves (1957) developed the correlation equations for relationships between CEC and
specific surface area as
CEC=0.15∗SSA−1.99 (R2=0.95) (2.8)
Farrar and Coleman (1967) suggested the relationship between CEC and SSA for British clay
soils using linear regression equation as
CEC=0.28∗SSA+2 (R2=0.90) (2.9)
Banin and Amiel (1970) developed the correlation equations between CEC and SSA for soils
in Israel as
CEC=0.12∗SSA+3.23 (2.10)

Page | 6
Churchman and Burke (1991) proposed linear regression equation between CEC and Specific
Surface Area (SSA) which was obtained by Ethylene Glycol Monoethyl Ether (EGME) method
expressed as
CEC=0.54∗SSA−6.1 (R2=0.86) (2.11)
Tanaka and Locat (1999) obtained the relationship between CEC and SSA using linear
regression equation given by
CEC=0.14∗SSA+3.6. (2.12)
Yukselen and Kaya (2006) developed the linear regression equation between CEC and EGME
SSA expressed as
CEC=0.1135∗SSA1.1371 (R2=0.83) (2.13)
Kumar and Sreedeep (2011) suggested the relationship between CEC and SSA expressed by
CEC=0.104∗SSA+3.09 (R2=0.96) (2.14)
2.2.5 Clay Fraction and Cation Exchange Capacity (CEC)
In general, it is expected that as the clay fraction increases, so would the CEC of the soil.
Yukselen and Kaya (2006) proposed that there is no significant relationship between clay
fraction and Cation Exchange Capacity (CEC) on the basis of their data. This is because CEC
is dependent more on the type of clay mineral than on its amount.
2.2.6 Organic matter and Cation Exchange Capacity (CEC)
Caravaca et al. (1999) proposed a relationship between Total Organic Carbon (TOC) and
Cation Exchange Capacity (CEC) based on linear regression expressed as
CEC =0.49∗TOC+9.45 (R2=0.79) (2.15)
Rashidi and Seilsepour (2008) suggested linear regression equation between Organic Carbon
(OC) and Cation Exchange Capacity (CEC) given by
CEC = 8.72∗OC+7.93 (R2=0.74) (2.16)
2.2.7 Activity and Cation Exchange Capacity (CEC)
The Skempton activity, A, relates plasticity (PI) to the clay size fraction, A = PI/CF.
Churchman and Burke (1991) and Cerato (2001) found no significant relationship between

Page | 7
CEC and activity of soil. Yukselen and Kaya also (2006) obtained no significant relationship
between the CEC and activity of the soils tested (coefficient of correlation r2=0.36).
2.2.8 Modified free swell index and Cation Exchange Capacity (CEC)
Yukselen and Kaya (2006) obtained the linear regression equation between MFSI and CEC
expressed as
CEC= 24.629∗log e (MFSI)+3.4534 (R2=0.66) (2.17)
2.2.9 Hydraulic conductivity and Cation Exchange Capacity (CEC)
Rao and Matthew (1995) suggested that hydraulic conductivity is significantly affected by the
valency and size of adsorbed cations. Rao et al. found that as valency of the adsorbed cations
increases hydraulic conductivity increases and hydraulic conductivity decreases for a constant
valency with an increase in hydrated radius of the adsorbed cations.
2.2.10 Compressibility and Cation Exchange Capacity (CEC)
Matthew (1997) suggested that an increase in valency of the adsorbed cations leads to a
decrease in compression index, and compressibility increses at a constant valency with an
increase in the hydrated radii of the adsorbed cations.
2.2.11 Multiple linear regression equation for predicting Cation Exchange Capacity (CEC)
Yukselen and Kaya (2006) evaluated the contribution of several physical and chemical
properties of soil to Cation Exchange Capacity (CEC) and obtained the following linear
regression equation as follows
CEC =−0.33∗LL+0.4∗SSA+8.8 (R2 = 0.91) (2.18)
CEC = 0.1135∗SSA1.1371 (R2 = 0.83) (2.19)
CEC = 2.12∗OM+0.19∗SSA+0.38 (R2 = 0.77) (2.20)
where SSA is Specific Surface Area obtained by Ethylene glycol mono-ethyl ether method; LL
is Liquid Limit; OM is Organic Matter; CEC is Cation Exchange Capacity (CEC).

Page | 8
Table 2.2. List of Equations developed so far for predicting Cation Exchange Capacity (CEC)
Equation R2
value
Author Soil Type
CEC=0.45∗LL−5 0.90
Farrar and
Coleman (1967)
British clay soils.
CEC = 1.74∗LL−38.3 0.72 Smith et al.
(1985)
Israel
CEC= 0.2027∗LL+16.231 0.61 Yukselen and
Kaya (2006)
Soils in Turkey
CEC=3.57∗PL−61.3 0.56 Smith et al.
(1985)
Israel
CEC=2.3067∗PL−40.3 0.46 Yukselen and
Kaya (2006)
Soils in Turkey
CEC= −1.7643∗SL+85.33 0.2071 Yukselen and
Kaya (2006)
Soils in Turkey
CEC=0.1873∗PI+33.13 0.3574 Yukselen and
Kaya (2006)
Soils in Turkey
CEC=0.15∗SSA−1.99 0.95
Gill and Reaves
(1957)
South eastern US
clay.
CEC=0.28∗SSA+2 0.90 Farrar and
Coleman (1967)
British clay soils.
CEC=0.12∗SSA+3.23 - Banin and
Amiel (1970)
Israel soils.
CEC=0.54∗ SSA−6.1 0.86 Churchman and
Burke (1991)
New Zealand and
Fiji.
CEC=0.14∗SSA+3.6 - Tanaka and
Locat (1999)
Osaka bay clay.
CEC=0.1135∗SSA1.1371 0.83 Yukselen and
Kaya (2006)
Soils in Turkey.
CEC=0.104∗SSA+3.09 0.96 Kumar and
Sreedeep (2011)
Different
proportion of
swelling soil and
soils in Guwahati
CEC =0.49∗TOC+9.45 0.79 Caravaca et al.
(1999)
Murcia, Spain
CEC = 8.72∗OC+7.93 0.74 Rashidi and
Seilsepour
(2008)
Varamin, Iran
CEC= 24.629∗log e (MFSI)+3.4534 0.66 Yukselen and
Kaya (2006)
Soils in Turkey
CEC =−0.33∗LL+0.4∗ SSA+8.8 0.91 Yukselen and
Kaya (2006)
Soils in Turkey
CEC = 0.1135∗ SSA1.1371 0.83 Yukselen and
Kaya (2006)
Soils in Turkey
CEC = 2.12∗OM+0.19∗SSA+0.38 0.77 Yukselen and
Kaya (2006)
Soils in Turkey
Page | 9
2.3 Effect of lime
Lime stabilization is one of the oldest methods that is used for improving the geotechnical
properties of the soil such as decrease in plasticity and swell potential, better workability,
improved strength and stiffness, and improved durability. One of the factors affecting the lime
stabilization process is the amount of lime used in stabilizing the soil. The percentage of lime
to be used for any modification or stabilization depends on the soil type to be stabilized. The
requirement of the quantity of lime best suitable for the soil is based on an analysis of the effect
that different lime percentages have on the increase in strength of the soil and the reduction of
plasticity.
2.3.1 Effect of lime on Cation Exchange Capacity (CEC)
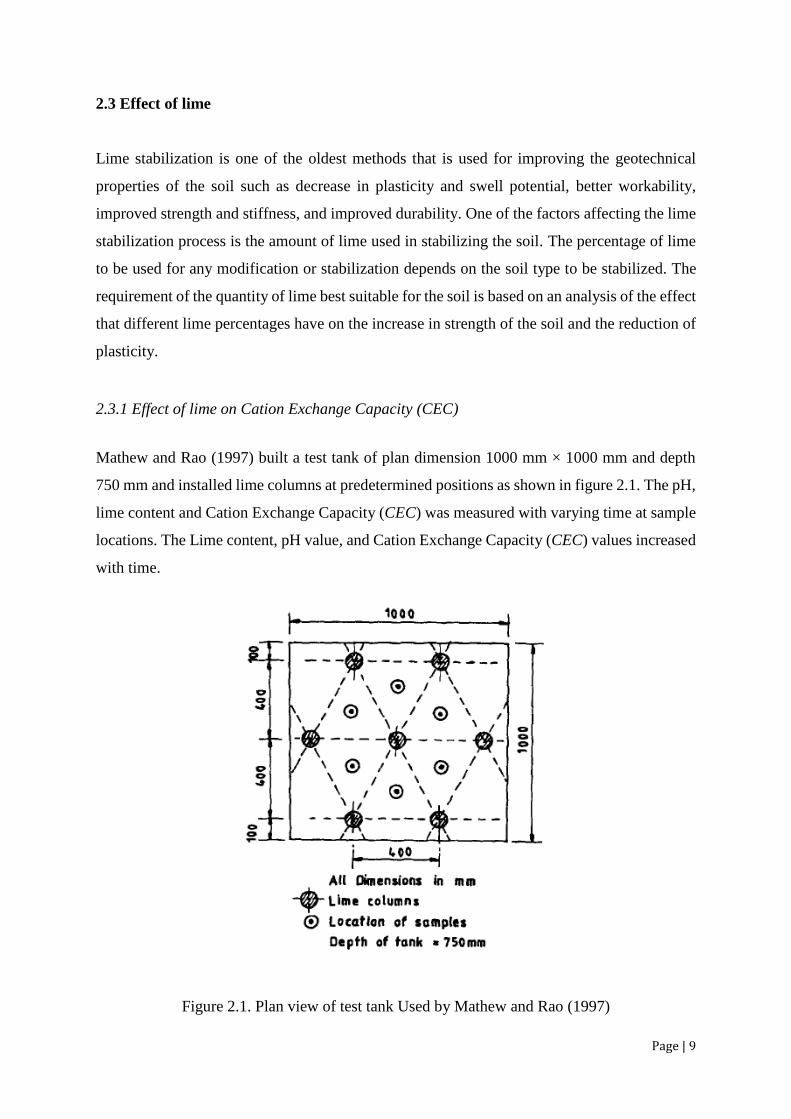
Mathew and Rao (1997) built a test tank of plan dimension 1000 mm × 1000 mm and depth
750 mm and installed lime columns at predetermined positions as shown in figure 2.1. The pH,
lime content and Cation Exchange Capacity (CEC) was measured with varying time at sample
locations. The Lime content, pH value, and Cation Exchange Capacity (CEC) values increased
with time.
Figure 2.1. Plan view of test tank Used by Mathew and Rao (1997)

Page | 10
Akbulut and Arasan (2010) studied the effect of additives such as lime, cement, fly ash, and
silica fume in expansive soils on Cation Exchange Capacity (CEC), pH and Zeta potential. The
Cation Exchange Capacity (CEC) and Zeta potential decreased with increase in lime content
while pH increased with increase in lime content.
2.3.2 Effect of lime on Compaction characteristics and Unconfined Compressive strength
Zhang and Xing (2002) studied the stabilization of expansive soil by lime and fly ash. The
Optimum Moisture Content increased and the Maximum Dry Density decreased with increase
in percentage of lime.
Kumar et al. (2007) studied the effect of fly ash, lime, and polyester fibers on compaction and
strength properties of expansive soil. With the increase in Lime content there is an increase in
optimum Moisture content and decrease in maximum dry density. The Curing time did not
increased the strength up to 4% of lime content. With the increase in the percentage of lime,
strength increases and attains a certain maximum value and after that it starts decreasing.
Sakr et al. (2008) studied the geotechnical properties of soft clay organic soil stabilized with
varying lime percentages of 1, 3, 5 and 7 percent. The unconfined compressive strength of 7
percentage lime increased nearly seven times for 60 day curing period.
Amu et al. (2011) tested the lime stabilization requirement and suitability of lime for three
lateritic soil samples. These 3 soil samples were mixed with 2, 4, 6, 8, and 10 percent of lime
and tested for compaction, CBR test, unconfined compression and undrained triaxial test. The
CBR value, unconfined compressive strength and shear strength of the composite soil samples
was improved to maximum value at 8 percent, 6 percent and 6 percent for the 3 soil samples.
Davoudi and Kabir (2011) tested a low plasticity soil for interaction with lime and sodium
chloride. They concluded that unconfined compressive strength of soil increases with increase
in lime content and curing time. However, after comparing the rate of increase in unconfined
compressive strength, they concluded the optimum lime content as 6 percent.
Siddique and Hossain (2011) studied the influence of lime stabilization on engineering
properties of expansive soil. The soil was stabilised with lime contents of 3%, 6%, 9%, 12%
Page | 11
and 15%. The Optimum moisture content increased and maximum dry density decreased with
increase in lime content. Unconfined compressive strength of the sample increased with
increase in lime content. There was large increase in unconfined compressive strength with
increase in curing period of upto 16 weeks.
Dash and Hussain (2012) studied the influence of lime on a silica rich non expansive soil and
expansive soil. They concluded that beyond certain limits, the addition of lime reduces the
improvement in strength predominantly in silica rich soil because of the formation of excess
silica gel which is a highly porous structure.
Kaur and Singh (2012) found that the Optimum Moisture Content increased and the Maximum
Dry Density decreased with the addition of lime. The soil gains compressive strength on
addition of lime, but it continues only upto a certain percentage of lime and then it starts
decreasing with the increase in lime content.
Muhmed and Wanatowski (2013) obtained the initial consumption of lime by the pH test given
by Eades and Grim as 5 percent. The unconfined compressive strength was conducted on the
composite soil sample at Optimum Moisture Content (OMC), wet side of OMC and dry side of
OMC. They found that the maximum unconfined compressive strength developed at the
Optimum Moisture Content (OMC).
Bairwa et al. (2013) studied the effect of lime and fly ash on geotechnical properties of Black
cotton soil. At first, the Optimum Moisture content decreased and the Maximum Dry Density
increased with the addition of 3% lime. Then a further increase in lime content resulted n
increase of the Optimum Moisture content and the decrease of Maximum Dry Density.
2.4 Effect of Fly ash
2.4.1 Effect of fly ash on Cation Exchange Capacity (CEC)
Nalbantoglu (2004) observed the effect of fly ash for stabilizing expansive soil. He studied the
effect of Fly ash on plasticity characteristics, swelling and Cation Exchange Capacity (CEC)
of two soils. The Cation Exchange Capacity (CEC) of both the soils decreased with increase in
fly ash content.

Page | 12
Akbulut and Arasan (2010) studied the variation of Electro-kinetic properties such as Cation
Exchange Capacity (CEC), pH and Zeta potential in expansive soils treated with additives such
as lime, cement, fly ash, and silica fume. With increase in fly ash content, the Cation Exchange
Capacity (CEC) values decreased.
2.4.2 Effect of Fly ash on Compaction characteristics and Unconfined Compressive strength
Zhang and Xing (2002) studied the stabilization of expansive soil by lime and fly ash. The
increase in fly ash content leads to decrease in Maximum Dry Density and increase in Optimum
Moisture Content.
Kolias et al. (2005) stabilised three soils predominantly clayey with fly ash and cement. The
soil was tested with 5, 10 and 20 percent fly ash. The maximum dry density decreased and
Optimum moisture content increased with increase in fly ash. For all the soils, with increase in
fly ash content the Unconfined Compressive Strength increased.
Sezer et al. (2006) studied the utilization of a fly ash for improvement in clay properties. They
observed the effect of fly ash on compaction characteristics, unconfined compressive strength
and shear strength parameters of soil. The maximum dry density decreased and the optimum
moisture content increased with increase in fly ash content. The unconfined compressive
strength of the soil increased with the addition of fly ash. There was no appreciable increase in
unconfined compressive strength after 28 days. At later stages a considerable increase in
cohesion intercept was observed in samples containing high percent of fly ash.
Kumar et al. (2007) studied the effect of fly ash, lime, and polyester fibers on compaction and
strength properties of expansive soil. With the increase in fly ash content there is an increase
in optimum Moisture content and decrease in maximum dry density.
Bairwa et al. (2013) studied the influence of lime and fly ash on engineering properties of Black
cotton soil. With the increase in fly ash content, the Optimum Moisture Content increased and
the Maximum Dry Density decreased.

Page | 13
2.5 Scope of the present study
Based on the review of the existing literature on the Cation Exchange Capacity (CEC) of soils,
it appears that various relationship for predicting Cation Exchange Capacity (CEC) of soil from
geotechnical properties with varying degree of accuracy have been proposed.
A large number of studies have been done on the geotechnical properties of the soil but the
studies on electro-kinetic properties of the soil such as Cation Exchange Capacity (CEC) are
limited in literature.
As the knowledge of the Cation Exchange Capacity (CEC) is essential in waste containment
system, the objective of the thesis is to study the effect of adding additives like lime and fly
ash on the Cation Exchange Capacity (CEC) of treated soil for better holding of pollutant
cations in waste containment system.
The objective of the present study is as follows
Effect of lime and fly ash on Cation Exchange Capacity (CEC) of composite soil
sample.
To obtain the optimum lime content for maximum Unconfined Compressive
Strength (UCS) of treated soil sample with varying lime content for a certain curing
period.
To obtain the optimum fly ash content for maximum Unconfined Compressive
Strength (UCS) of treated soil sample with varying fly ash content for a certain
curing period.

Page | 14
3. MATERIAL CHACTERISATION AND METHODOLOGY
3.1 Introduction
This chapter presents the investigation methods to be used to determine geotechnical
characteristics of the soil samples. The laboratory testing program consists of geotechnical tests
such as Atterberg limit test, grain size analysis, specific gravity test, compaction test,
unconfined compressive strength and direct shear test. The other test to be performed are Cation
Exchange Capacity (CEC) test and pH test.
3.2 Material Characteristics and Methodology
Soil sample was collected from two sites in Odisha. One from the periphery of ash pond area
of Sesa Sterlite limited, Jharsuguda, Odisha and the other soil was collected from NTPC
Darlipalli, Suratgarh, Odisha. Both the soil sample was collected from 2 m below the ground
level. Fly ash was collected from NSPCL Rourkela. Laboratory lime used for experimentation
was taken from Fisher scientific.
3.2.1 Specific Gravity
The specific gravity of both the soil sample and fly ash was determined as per IS: 2720-Part 3
(1980) and the results are presented in Table 3.1.
Table 3.1. Specific gravity of soils and fly ash
Sample Values
Sesa Sterlite soil sample (Sandy Clay) 2.62
NTPC Darlipalli soil sample (Low Plastic Clay) 2.66
Fly ash 2.30
Page | 15
3.2.2 Particle size distribution
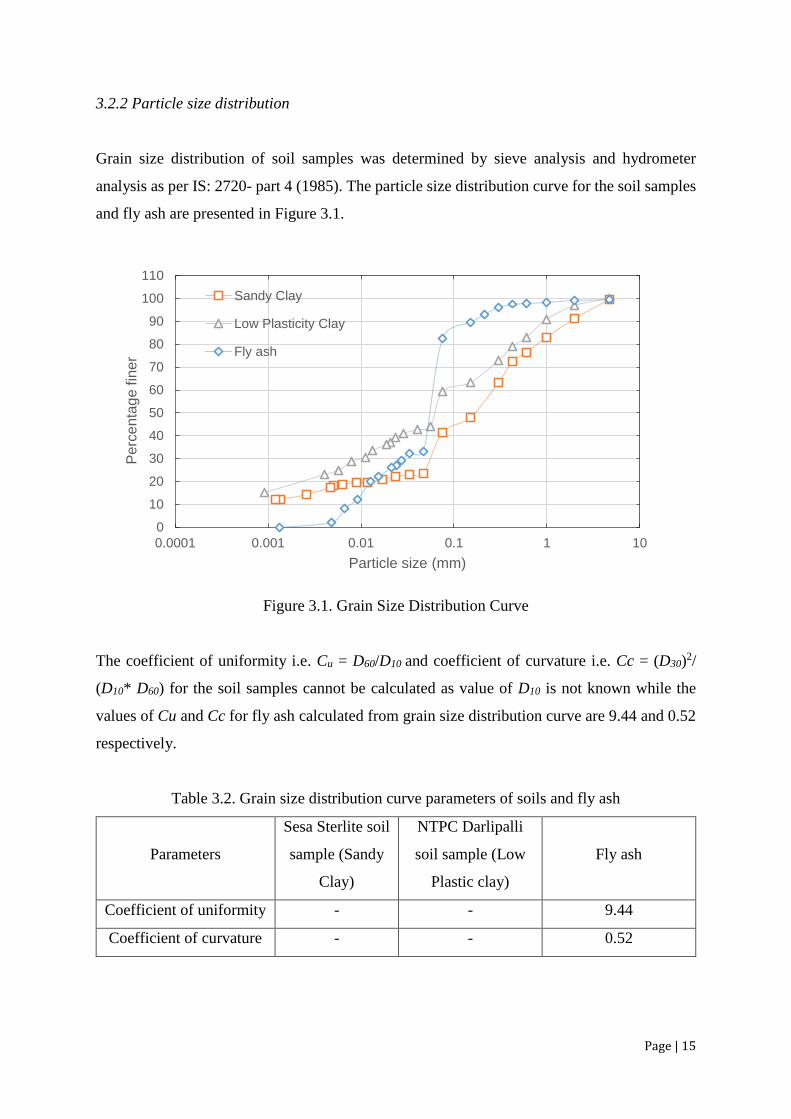
Grain size distribution of soil samples was determined by sieve analysis and hydrometer
analysis as per IS: 2720- part 4 (1985). The particle size distribution curve for the soil samples
and fly ash are presented in Figure 3.1.
Figure 3.1. Grain Size Distribution Curve
The coefficient of uniformity i.e. Cu = D60/D10 and coefficient of curvature i.e. Cc = (D30)2/
(D10* D60) for the soil samples cannot be calculated as value of D10 is not known while the
values of Cu and Cc for fly ash calculated from grain size distribution curve are 9.44 and 0.52
respectively.
Table 3.2. Grain size distribution curve parameters of soils and fly ash
Parameters
Sesa Sterlite soil
sample (Sandy
Clay)
NTPC Darlipalli
soil sample (Low
Plastic clay)
Fly ash
Coefficient of uniformity - - 9.44
Coefficient of curvature - - 0.52
0
10
20
30
40
50
60
70
80
90
100
110
0.0001 0.001 0.01 0.1 1 10
Pe
rce
nta
ge
fin
er
Particle size (mm)
Sandy Clay
Low Plasticity Clay
Fly ash
Page | 16
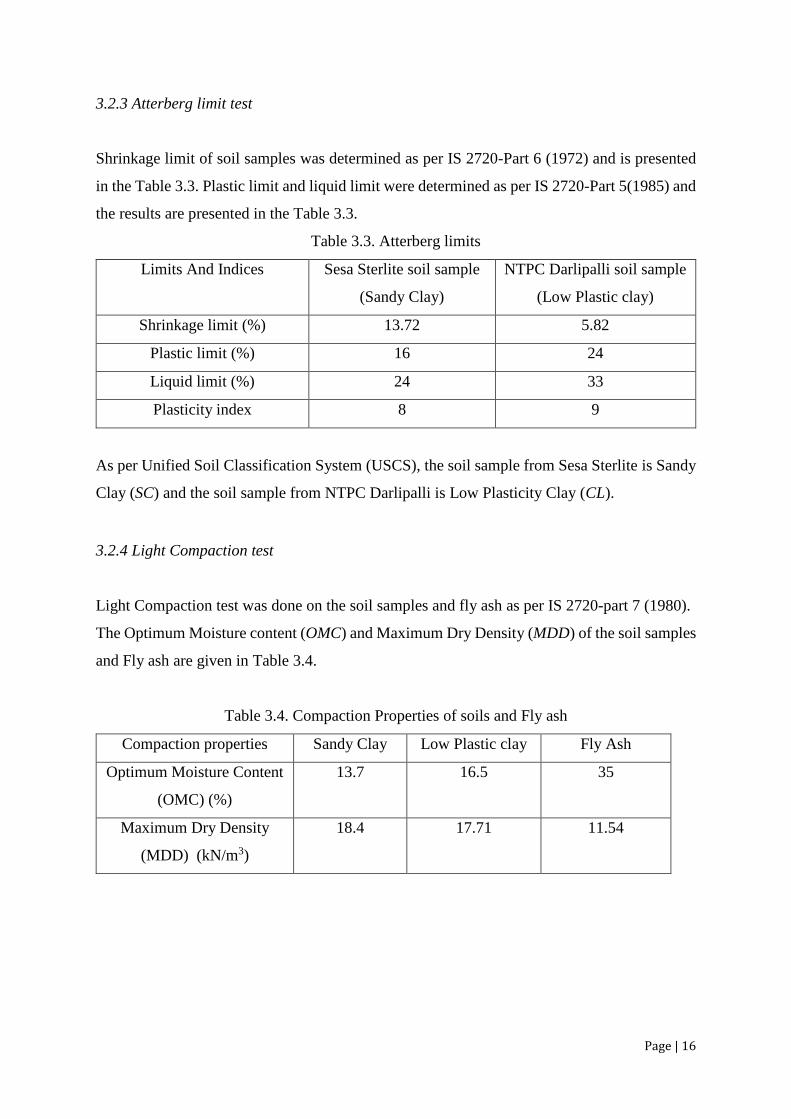
3.2.3 Atterberg limit test
Shrinkage limit of soil samples was determined as per IS 2720-Part 6 (1972) and is presented
in the Table 3.3. Plastic limit and liquid limit were determined as per IS 2720-Part 5(1985) and
the results are presented in the Table 3.3.
Table 3.3. Atterberg limits
Limits And Indices Sesa Sterlite soil sample
(Sandy Clay)
NTPC Darlipalli soil sample
(Low Plastic clay)
Shrinkage limit (%) 13.72 5.82
Plastic limit (%) 16 24
Liquid limit (%) 24 33
Plasticity index 8 9
As per Unified Soil Classification System (USCS), the soil sample from Sesa Sterlite is Sandy
Clay (SC) and the soil sample from NTPC Darlipalli is Low Plasticity Clay (CL).
3.2.4 Light Compaction test
Light Compaction test was done on the soil samples and fly ash as per IS 2720-part 7 (1980).
The Optimum Moisture content (OMC) and Maximum Dry Density (MDD) of the soil samples
and Fly ash are given in Table 3.4.
Table 3.4. Compaction Properties of soils and Fly ash
Compaction properties Sandy Clay Low Plastic clay Fly Ash
Optimum Moisture Content
(OMC) (%)
13.7
16.5 35
Maximum Dry Density
(MDD) (kN/m3)
18.4 17.71 11.54

Page | 17
Figure 3.2. Light Compaction curve for Sandy Clay (SC)
Figure 3.3. Light Compaction curve for Low Plasticity Clay (CL)
15
16
17
18
19
20
21
8 10 12 14 16 18 20
Dry
De
nsity (
kN
/m3
)
Moisture Content (%)
compaction curve
Zero air void line
15
16
17
18
19
20
10 12 14 16 18 20 22
Dry
De
nsity (
kN
/m3
)
Moisture Content (%)
Compaction curve
Zero air void line

Page | 18
Figure 3.4. Light Compaction curve for Fly ash
3.2.5 Unconfined compressive strength
The unconfined compressive strength test was done as per IS 2720-Part 10 (1991) on the soil
samples and the unconfined compressive strength of the sandy clay and low plasticity clay are
is 157.36 kN/m2 and 178.34 kN/m2.
3.2.6 Direct Shear Test
The direct shear test was done in accordance with IS 2720-Part 13 (1986). The undrained
cohesion value and angle of shear resistance for the soil samples and fly ash are presented in
Table 3.5.
Table 3.5. Shear Strength parameters of soils and Fly ash
Shear Strength parameters Sandy Clay Low Plastic clay Fly Ash
Cohesion (C) in (kPa) 24.14 43.16 0.3
Angle of shear resistance (º) 23.47 7.91 39.29
10.0
10.5
11.0
11.5
12.0
12.5
13.0
13.5
14.0
29 31 33 35 37 39
Dry
Density
(kN
/m3)
Moisture Content (%)
Compaction Curve
Zero air void line

Page | 19
3.2.7 pH test
The pH test performed on the soil samples as per IS: 2720 (Part 26) (1987) showed the pH
value for sandy clay and low plasticity clay as 7.4 and 7.3 respectively.
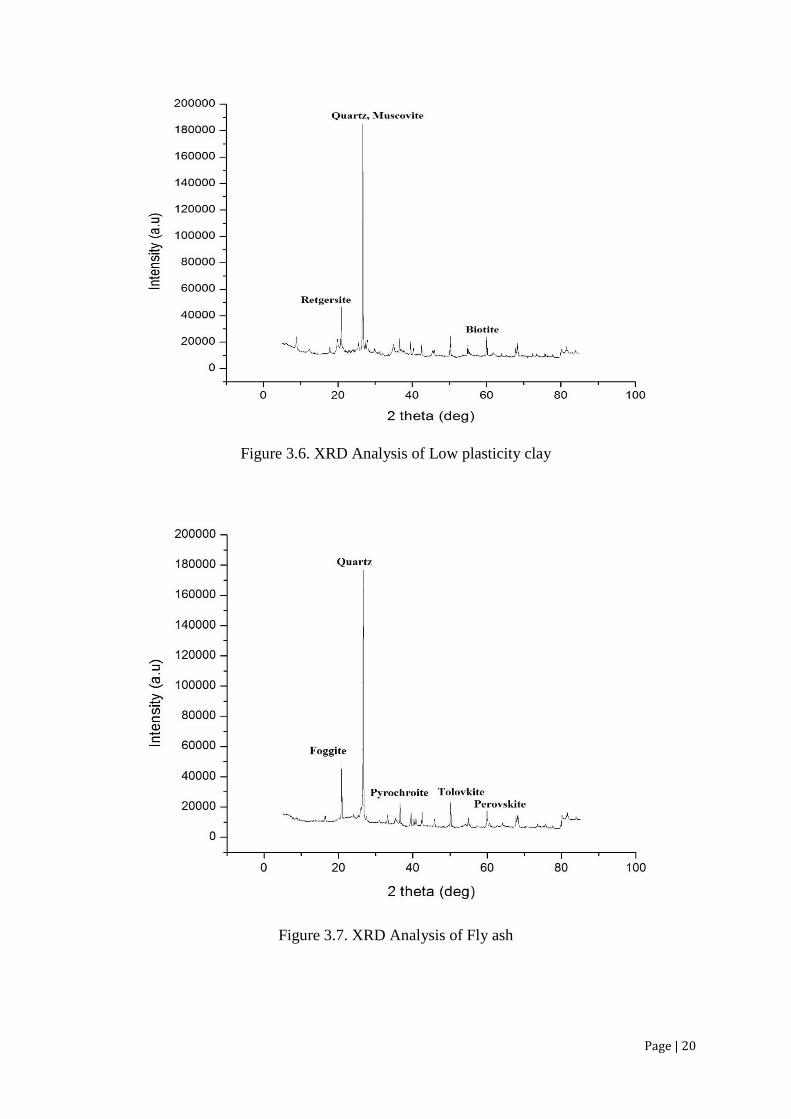
3.2.8 XRD analysis
The mineralogical analysis of the materials has been done by XRD analysis using X-ray
diffraction-meter which is based on the principle that beams of X-rays diffracted from crystals
are characteristics for each clay mineral group. The XRD analysis was done by Xpert high
score software package and the minerals present in the soil samples and fly ash are as shown
in Figures 3.5 to 3.7.
Figure 3.5. XRD Analysis of Sandy Clay
Page | 20
Figure 3.6. XRD Analysis of Low plasticity clay
Figure 3.7. XRD Analysis of Fly ash

Page | 21
3.3 Cation Exchange Capacity (CEC)
There are two standardised method given by International Soil Reference and Information
Centre namely 1) Extraction with ammonium acetate method. 2) Silver thiourea method. The
Ammonium acetate method at neutral pH value is the most commonly used method for
determining Cation exchange capacity (CEC). The ASTM D7503 – 10 method was used to
determine Cation exchange capacity (CEC) of soil sample.
The Cation Exchange Capacity (CEC) of the soil sample and soil mixtures was found as per
ASTM D7503 – 10 method.
Procedure:
1. 2.5 to 10 gm of soil in a 100-ml centrifuge tube was taken and 40 ml of 1 M ammonium
acetate of pH 7 was added.
2. The centrifuge tube was shaken for 5 min and kept overnight.
3. Next morning it was again shaken for 15 minutes.
4. The sample was then transferred through Buchner funnel with filter paper into the
vacuum flask.
5. The excess soil from centrifuge tube was rinsed.
6. The soil was washed 4 more times with 30 ml of ammonium acetate solution and the
solution from vacuum flask was discarded.
7. Then the soil sample was washed 3 times with 40 ml isopropanol and the solution was
discarded.
8. After that the soil was washed with potassium chloride solution 4 times with 50 ml
each.
9. The solution was poured from vacuum flask into volumetric flask and extra potassium
chloride solution was used to fill upto the line mark in volumetric flask (250ml).
10. 60 ml of the solution was taken to find nitrogen concentration by spectrophotometer.
The Nitrogen concentration was determined as per modified Parsons et al. (1984) by using the
spectrophotometric method.

Page | 22
Figure 3.8. Photographic image of Spectrophotometer
Standard solution was prepared using ammonium chloride of 0.2, 0.4, 0.6, 0.8, and 0.10 ppm
concentration. 5 ml of blank or standard or sample was mixed with 0.2 ml phenol and swirled.
After that in sequence 0.2 ml of sodium nitroprusside and 0.5 ml of oxidizing solution was
added. Then it was swirled and allowed to stand for 1 hour. The colour was stable for 24 hours.
The absorbance of the solution was determined at 640 nanometre. From the blank and standard
solution, the calibration curve for nitrogen determination was found. Then from the absorbance
of the sample, nitrogen content of the sample can be determined.
The concentration of nitrogen was determined through the graph obtained by the absorbance
of the standard solution of known concentration. The graph obtained is given in the Figure 3.9.

Page | 23
Figure 3.9. Calibration curve for nitrogen concentration
The CEC of the sample is calculated after knowing the nitrogen concentration by the equation
𝐶𝐸𝐶 (𝑐𝑚𝑜𝑙
𝑘𝑔) =
𝑁 × 1 × 0.25
140 × 𝑚𝑎𝑠𝑠 𝑜𝑓 𝑠𝑜𝑖𝑙 𝑡𝑎𝑘𝑒𝑛× 1000
where N = nitrogen concentration in mg/L.
The Cation Exchange Capacity (CEC) of sandy clay and low plasticity clay are 20.16 cmol/kg
and 43.43 cmol/kg.
y = 1.0866x - 0.0102R² = 0.9774
0
0.2
0.4
0.6
0.8
1
1.2
0 0.2 0.4 0.6 0.8 1
Nitro
ge
n C
once
ntr
ation
(m
g/l)
Absorbance

Page | 24
4. RESULTS AND DISCUSSION
4.1 Introduction
A large number of studies have been done on the geotechnical properties of the soil but the
studies on electro kinetic properties of the soil such as Cation Exchange Capacity (CEC) are
limited in literature. In this Chapter, a series of experiments have been done to study the effect
of the additives such as lime and fly ash on the electro kinetic properties like Cation Exchange
Capacity (CEC) and geotechnical properties such as Compaction Characteristics and
Unconfined compressive strength.
4.2 Cation Exchange Capacity (CEC)
4.2.1 Effect of Lime
The Cation Exchange Capacity (CEC) values decreased with the increase in lime content for
both the soil samples as can be seen in Figure 4.1. The decrease in Cation Exchange Capacity
(CEC) obtained are similar to that obtained by Akbulut and Arasan (2010).
Figure 4.1. Variation in Cation Exchange Capacity (CEC) with lime content
0
10
20
30
40
50
0 2 4 6 8 10
CE
C (
cm
ol/kg
)
Lime Content ( % )
Sandy Clay (SC)
Low Plasticity Clay (CL)

Page | 25
Table 4.1. Effect of Lime on Cation Exchange Capacity (CEC)
Sample
Cation Exchange Capacity (CEC) (cmol/kg)
Sandy Clay (SC) Low Plasticity Clay (CL)
Soil + 0% lime 20.16 43.44
Soil + 2% lime 19.70 40.56
Soil + 4% lime 17.68 39.32
Soil + 6% lime 16.00 37.06
Soil + 8% lime 15.38 35.20
Soil + 10% lime 14.53 34.24
The decrease in CEC values can be explained by the mineralogical changes occuring in the
treated soils. The decrease in CEC can also be explained due to the formation of coarser
particles with lime treatment which reduces the specific surface area.
4.2.2 Effect of Fly ash
As can be seen from Figure 4.2, with the increase of fly ash content in soil, the Cation Exchange
Capacity (CEC) values decreased for both sandy clay (SC) and Low Plasticity clay (CL). It was
observed that increase in fly ash content decreases Cation Exchange Capacity (CEC) values
more rapidly when compared with increase in lime content. Similarly Akbulut and Arasan
(2010) reported that fly ash is more effective in decreasing the Cation Exchange Capacity
(CEC) values. Also, Nalbantoglu (2004) reported decrease in Cation Exchange Capacity (CEC)
values with increase in fly ash content.

Page | 26
Figure 4.2.Variation in Cation Exchange Capacity (CEC) with Fly ash content
Table 4.2. Effect of Fly ash on Cation Exchange Capacity (CEC)
Sample
Cation Exchange Capacity (CEC) (cmol/kg)
Sandy Clay (SC) Low Plasticity Clay (CL)
Soil + 0% Fly ash 20.16 43.44
Soil + 2% Fly ash 17.52 33.69
Soil + 4% Fly ash 15.77 24.32
Soil + 6% Fly ash 14.91 19.39
Soil + 8% Fly ash 13.59 17.52
Soil + 10% Fly ash 11.65 16.39
Soil + 20% Fly ash 10.13 9.63
The rapid decrease in CEC values with addition of fly ash content as compared to addition of
lime content may be because of the higher value of pH of lime. The higher pH of lime
somewhat compensates the decrease in CEC as with increase in pH the CEC value increases.
0
10
20
30
40
50
0 2 4 6 8 10 12 14 16 18 20 22
CE
C (
cm
ol/
kg
)
Fly ash Content ( % )
Sandy Clay (SC)
Low Plasticity Clay (CL)

Page | 27
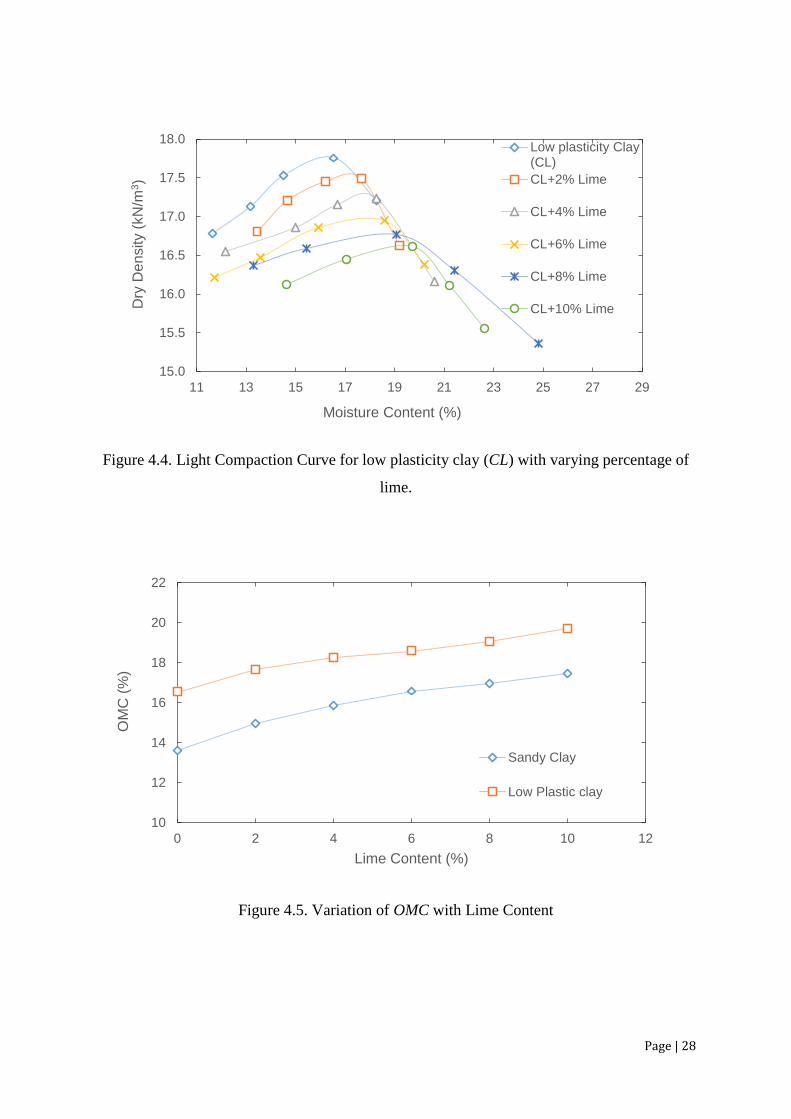
4.3 Compaction Characteristics
4.3.1 Effect of lime
The addition of lime in sandy clay and low plasticity clay results in decrease in maximum dry
density and increase in optimum moisture content as can be seen from the compaction curve
shown in Figures 4.3 and 4.4. Most of the researchers reported that with increase in lime content
the maximum dry density decreases and optimum moisture content increases.
Figure 4.3. Light Compaction curve for sandy clay (SC) with varying percentage of lime
15.0
15.5
16.0
16.5
17.0
17.5
18.0
18.5
19.0
9 11 13 15 17 19 21 23 25 27
Dry
De
nsity (
kN
/m3)
Moisture content (%)
Sandy Clay (SC)
SC+2% Lime
SC+4% Lime
SC+6% Lime
SC+8% Lime
SC+10% Lime
Page | 28
Figure 4.4. Light Compaction Curve for low plasticity clay (CL) with varying percentage of
lime.
Figure 4.5. Variation of OMC with Lime Content
15.0
15.5
16.0
16.5
17.0
17.5
18.0
11 13 15 17 19 21 23 25 27 29
Dry
De
nsity (
kN
/m3)
Moisture Content (%)
Low plasticity Clay(CL)
CL+2% Lime
CL+4% Lime
CL+6% Lime
CL+8% Lime
CL+10% Lime
10
12
14
16
18
20
22
0 2 4 6 8 10 12
OM
C (
%)
Lime Content (%)
Sandy Clay
Low Plastic clay

Page | 29
Figure 4.6. Variation of MDD with Lime Content
Table 4.3. Variation of OMC and MDD with varying lime content
Sample
Sand Clay (SC) Low Plasticity Clay (CL)
OMC (%) MDD (kN/m3) OMC (%) MDD (kN/m3)
Soil + 0% Lime 13.61 18.40 16.53 17.71
Soil + 2% Lime 14.98 18.12 17.64 17.49
Soil + 4% Lime 15.85 17.71 18.26 17.23
Soil + 6% Lime 16.58 17.54 18.58 16.94
Soil + 8% Lime 16.98 17.39 19.07 16.77
Soil + 10% Lime 17.47 17.16 19.71 16.61
With the addition of lime, the clay particles get flocculated and agglomerated to have larger
void ratio which leads to decrease in maximum dry density. The water retained in these void
spaces and the water required for pozzolonic reaction leads to an increase in optimum moisture
content.
15.0
15.5
16.0
16.5
17.0
17.5
18.0
18.5
19.0
0 2 4 6 8 10
MD
D (
kN
/m3)
Lime Content (%)
Sandy Clay
Low Plastic clay

Page | 30
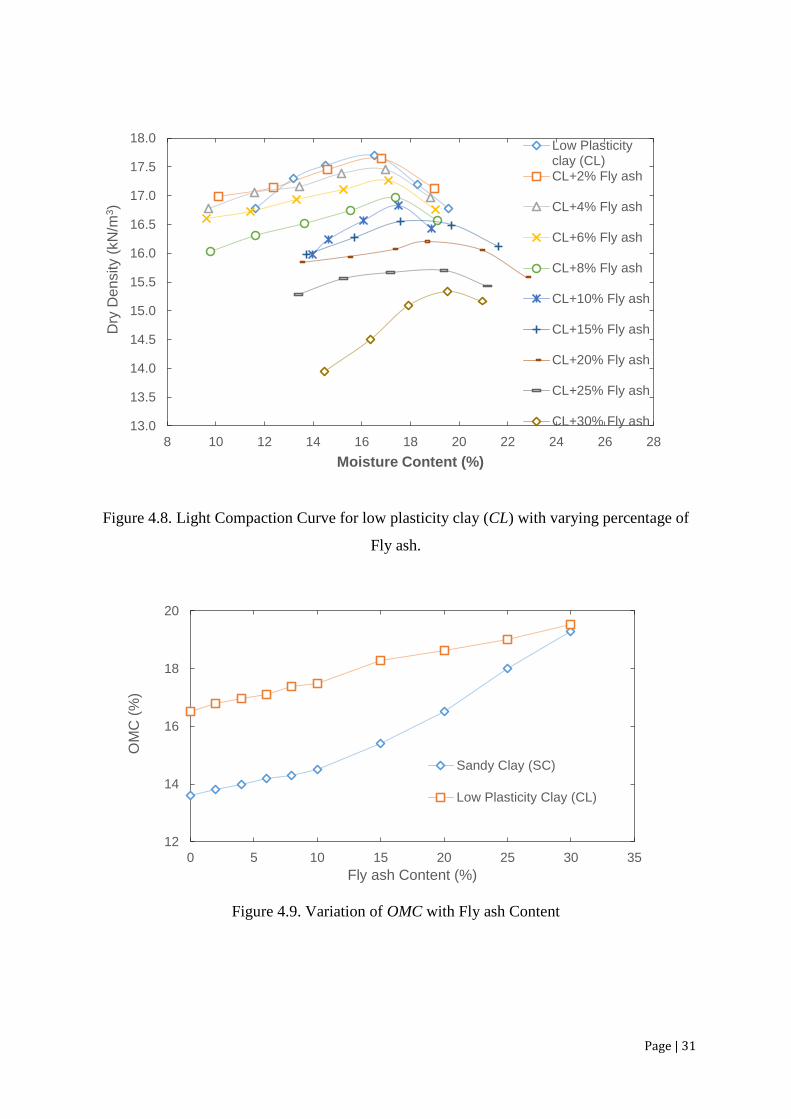
4.3.2 Effect of fly ash
The increase in fly ash content leads to the decrease in maximum dry density and increase in
optimum moisture content for both sandy clay and low plasticity clay as can be seen from the
compaction curve shown in Figures 4.7 and 4.8. Similarly, Most of the researchers reported
decrease in maximum dry density and increase in optimum moisture content with the increase
in fly ash content.
Figure 4.7. Light Compaction curve for sandy clay (SC) with varying percentage of Fly ash
14.0
14.5
15.0
15.5
16.0
16.5
17.0
17.5
18.0
18.5
19.0
8 10 12 14 16 18 20 22 24 26 28
Dry
De
nsity
(kN
/m3
)
Moisture Content (%)
Sandy Clay (SC)
SC+2 % Fly ash
SC+4% Fly ash
SC+6% Fly ash
SC+8% Fly ash
SC+10% Fly ash
SC+15% Fly ash
SC+20% Fly ash
SC+25% Fly ash
SC+30% Fly ash
Page | 31
Figure 4.8. Light Compaction Curve for low plasticity clay (CL) with varying percentage of
Fly ash.
Figure 4.9. Variation of OMC with Fly ash Content
13.0
13.5
14.0
14.5
15.0
15.5
16.0
16.5
17.0
17.5
18.0
8 10 12 14 16 18 20 22 24 26 28
Dry
De
nsity (
kN
/m3)
Moisture Content (%)
Low Plasticityclay (CL)CL+2% Fly ash
CL+4% Fly ash
CL+6% Fly ash
CL+8% Fly ash
CL+10% Fly ash
CL+15% Fly ash
CL+20% Fly ash
CL+25% Fly ash
CL+30% Fly ash
12
14
16
18
20
0 5 10 15 20 25 30 35
OM
C (
%)
Fly ash Content (%)
Sandy Clay (SC)
Low Plasticity Clay (CL)
Page | 32
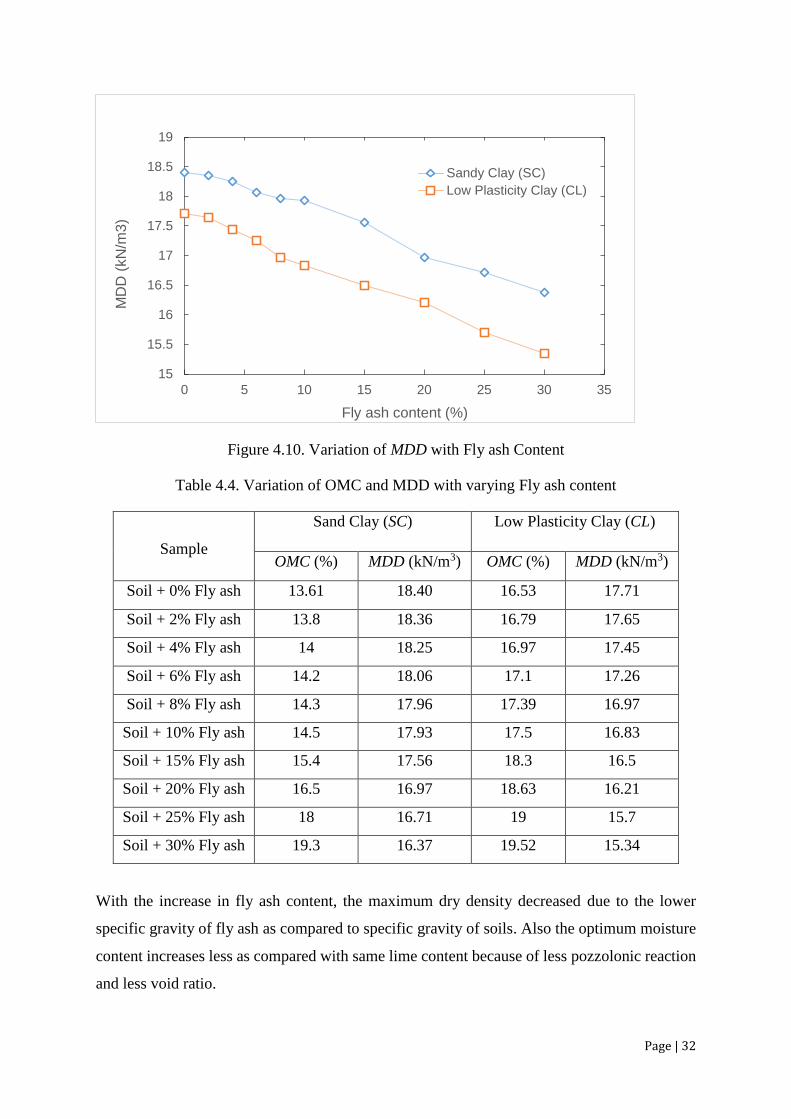
Figure 4.10. Variation of MDD with Fly ash Content
Table 4.4. Variation of OMC and MDD with varying Fly ash content
Sample
Sand Clay (SC) Low Plasticity Clay (CL)
OMC (%) MDD (kN/m3) OMC (%) MDD (kN/m3)
Soil + 0% Fly ash 13.61 18.40 16.53 17.71
Soil + 2% Fly ash 13.8 18.36 16.79 17.65
Soil + 4% Fly ash 14 18.25 16.97 17.45
Soil + 6% Fly ash 14.2 18.06 17.1 17.26
Soil + 8% Fly ash 14.3 17.96 17.39 16.97
Soil + 10% Fly ash 14.5 17.93 17.5 16.83
Soil + 15% Fly ash 15.4 17.56 18.3 16.5
Soil + 20% Fly ash 16.5 16.97 18.63 16.21
Soil + 25% Fly ash 18 16.71 19 15.7
Soil + 30% Fly ash 19.3 16.37 19.52 15.34
With the increase in fly ash content, the maximum dry density decreased due to the lower
specific gravity of fly ash as compared to specific gravity of soils. Also the optimum moisture
content increases less as compared with same lime content because of less pozzolonic reaction
and less void ratio.
15
15.5
16
16.5
17
17.5
18
18.5
19
0 5 10 15 20 25 30 35
MD
D (
kN
/m3
)
Fly ash content (%)
Sandy Clay (SC)
Low Plasticity Clay (CL)

Page | 33
4.4 Unconfined Compressive strength
4.4.1 Effect of lime
The unconfined compressive strength of soil increases significantly with increase in lime
content upto a certain percentage after which there is a decrease in unconfined compressive
strength. The unconfined compressive strength of sandy clay (SC) and low plasticity clay (CL)
increased with varying lime content for different curing periods as can be seen in Figures 4.11
and 4.12.
Figure 4.11. Variation in UCS for Sandy Clay (SC) stabilized with lime at different curing
periods
0
200
400
600
800
1000
1200
0 2 4 6 8 10 12 14
UC
S (
kP
a)
Lime Content (%)
0 Day
3 Days
7 Days
14 Days
28 Days
56 Days

Page | 34
Table 4.5. Unconfined Compressive Strength (kPa) of Lime stabilized Sandy clay (SC) with
different curing periods
Sample Curing Period (days)
0 3 7 14 28 56
SC + 0% lime 156.96 158.92 159.90 161.87 166.57 166.13
SC + 2% lime 277.62 327.65 435.56 465.97 499.32 668.06
SC + 4% lime 281.54 369.83 474.80 513.06 736.73 809.32
SC + 6% lime 293.31 410.05 516.98 650.40 943.72 1001.60
SC + 8% lime 304.11 426.73 497.36 622.93 896.63 951.57
SC + 10% lime 294.30 338.44 425.75 458.12 519.93 771.06
Figure 4.12. Variation in UCS for Low Plasticity Clay (CL) stabilized with lime at different
curing periods
0
500
1000
1500
2000
2500
3000
3500
0 2 4 6 8 10 12 14
UC
S (
kP
a)
Lime content (%)
0 Day
3 Days
7 Days
14 Days
28 Days
Page | 35
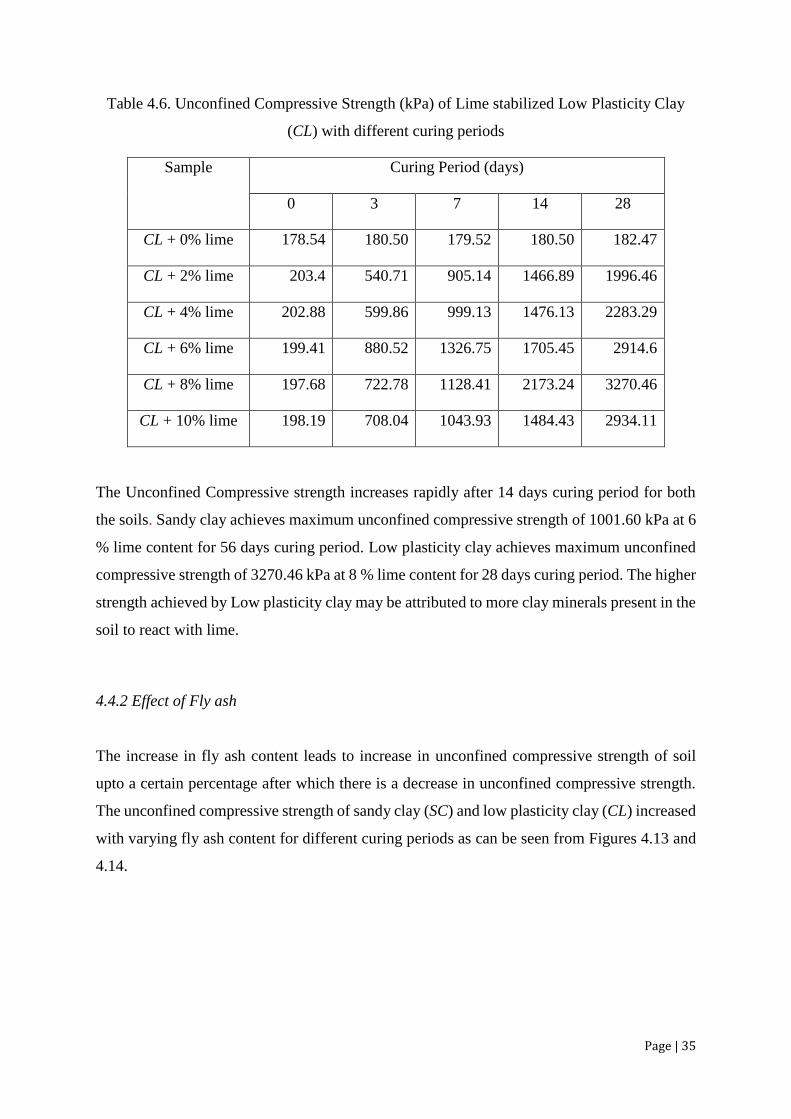
Table 4.6. Unconfined Compressive Strength (kPa) of Lime stabilized Low Plasticity Clay
(CL) with different curing periods
Sample Curing Period (days)
0 3 7 14 28
CL + 0% lime 178.54 180.50 179.52 180.50 182.47
CL + 2% lime 203.4 540.71 905.14 1466.89 1996.46
CL + 4% lime 202.88 599.86 999.13 1476.13 2283.29
CL + 6% lime 199.41 880.52 1326.75 1705.45 2914.6
CL + 8% lime 197.68 722.78 1128.41 2173.24 3270.46
CL + 10% lime 198.19 708.04 1043.93 1484.43 2934.11
The Unconfined Compressive strength increases rapidly after 14 days curing period for both
the soils. Sandy clay achieves maximum unconfined compressive strength of 1001.60 kPa at 6
% lime content for 56 days curing period. Low plasticity clay achieves maximum unconfined
compressive strength of 3270.46 kPa at 8 % lime content for 28 days curing period. The higher
strength achieved by Low plasticity clay may be attributed to more clay minerals present in the
soil to react with lime.
4.4.2 Effect of Fly ash
The increase in fly ash content leads to increase in unconfined compressive strength of soil
upto a certain percentage after which there is a decrease in unconfined compressive strength.
The unconfined compressive strength of sandy clay (SC) and low plasticity clay (CL) increased
with varying fly ash content for different curing periods as can be seen from Figures 4.13 and
4.14.
Page | 36
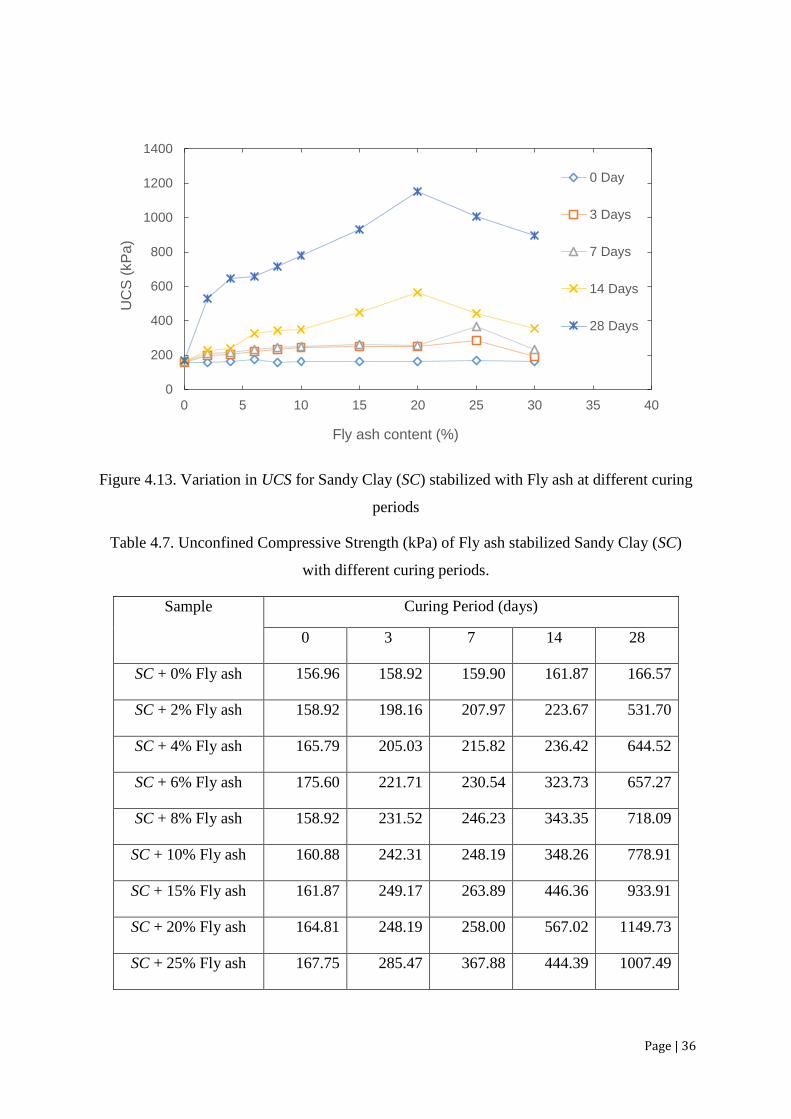
Figure 4.13. Variation in UCS for Sandy Clay (SC) stabilized with Fly ash at different curing
periods
Table 4.7. Unconfined Compressive Strength (kPa) of Fly ash stabilized Sandy Clay (SC)
with different curing periods.
Sample Curing Period (days)
0 3 7 14 28
SC + 0% Fly ash 156.96 158.92 159.90 161.87 166.57
SC + 2% Fly ash 158.92 198.16 207.97 223.67 531.70
SC + 4% Fly ash 165.79 205.03 215.82 236.42 644.52
SC + 6% Fly ash 175.60 221.71 230.54 323.73 657.27
SC + 8% Fly ash 158.92 231.52 246.23 343.35 718.09
SC + 10% Fly ash 160.88 242.31 248.19 348.26 778.91
SC + 15% Fly ash 161.87 249.17 263.89 446.36 933.91
SC + 20% Fly ash 164.81 248.19 258.00 567.02 1149.73
SC + 25% Fly ash 167.75 285.47 367.88 444.39 1007.49
0
200
400
600
800
1000
1200
1400
0 5 10 15 20 25 30 35 40
UC
S (
kP
a)
Fly ash content (%)
0 Day
3 Days
7 Days
14 Days
28 Days

Page | 37
Sample Curing Period (days)
0 3 7 14 28
SC + 30% Fly ash 164.81 193.26 234.46 354.14 894.67
Figure 4.14. Variation in UCS for Low Plasticity Clay (CL) stabilized with fly ash at different
curing period
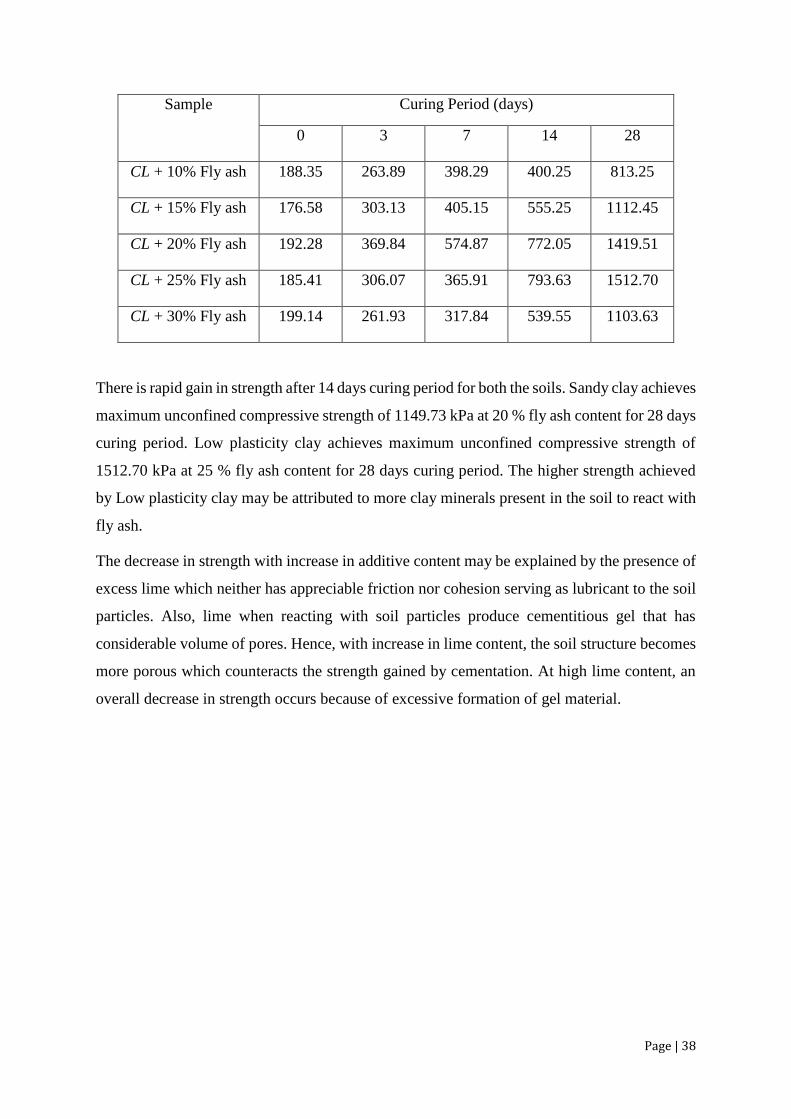
Table 4.8. Unconfined Compressive Strength (kPa) of Fly ash stabilized Low Plasticity Clay
(CL) with different curing periods
Sample Curing Period (days)
0 3 7 14 28
CL + 0% Fly ash 178.54 180.50 179.52 180.50 182.47
CL + 2% Fly ash 177.56 210.92 247.21 306.07 591.54
CL + 4% Fly ash 180.50 225.63 259.97 321.77 636.67
CL + 6% Fly ash 180.50 232.50 273.70 332.56 698.47
CL + 8% Fly ash 186.39 251.14 322.75 369.84 767.14
0
200
400
600
800
1000
1200
1400
1600
0 5 10 15 20 25 30 35 40
UC
S (
kP
a)
Fly ash Content (%)
0 Day
3 Days
7 Days
14 Days
28 Days
Page | 38
Sample Curing Period (days)
0 3 7 14 28
CL + 10% Fly ash 188.35 263.89 398.29 400.25 813.25
CL + 15% Fly ash 176.58 303.13 405.15 555.25 1112.45
CL + 20% Fly ash 192.28 369.84 574.87 772.05 1419.51
CL + 25% Fly ash 185.41 306.07 365.91 793.63 1512.70
CL + 30% Fly ash 199.14 261.93 317.84 539.55 1103.63
There is rapid gain in strength after 14 days curing period for both the soils. Sandy clay achieves
maximum unconfined compressive strength of 1149.73 kPa at 20 % fly ash content for 28 days
curing period. Low plasticity clay achieves maximum unconfined compressive strength of
1512.70 kPa at 25 % fly ash content for 28 days curing period. The higher strength achieved
by Low plasticity clay may be attributed to more clay minerals present in the soil to react with
fly ash.
The decrease in strength with increase in additive content may be explained by the presence of
excess lime which neither has appreciable friction nor cohesion serving as lubricant to the soil
particles. Also, lime when reacting with soil particles produce cementitious gel that has
considerable volume of pores. Hence, with increase in lime content, the soil structure becomes
more porous which counteracts the strength gained by cementation. At high lime content, an
overall decrease in strength occurs because of excessive formation of gel material.
Page | 39
5. CONCLUSIONS & FUTURE SCOPE OF WORK
An extensive Experimental program was undertaken to achieve the objectives of the present
study. Two type of soils were mixed with varying quantities of lime and fly ash. The effect of
these additives have been studied on Cation Exchange Capacity (CEC), Compaction
characteristics and Unconfined Compressive Strength (UCS) of both the soil samples. The
conclusions drawn from the experimental results obtained are presented in section 5.1.
5.1 Conclusions
The Cation Exchange Capacity (CEC) values decreased more with increase in fly ash
content than with increase in lime content.
The optimum moisture content (OMC) increases and maximum dry density (MDD)
decreases with increased lime content and fly ash content for both sandy clay and low
plasticity clay.
The Optimum Lime Content (OLC) for Sandy Clay (SC) and low plasticity clay (CL)
is 6 % and 8 % respectively based on Unconfined Compressive Strength (UCS) test.
Similarly, the optimum fly ash content for Sandy Clay (SC) and low plasticity clay (CL)
is 20 % and 25 % respectively.
The Unconfined Compressive strength increases with increase in curing period for both
soils treated with lime and fly ash.
5.2 Scope for future research work
1. Effect of other additives such as cement, silica fume etc. on Cation Exchange
Capacity (CEC) and unconfined compressive strength of soils.
2. Effect of additives on Cation Exchange Capacity (CEC), Specific Surface Area
(SSA) and Permeability and their interrelationship.

Page | 40
REFERENCES
Akbulut S. and Arasan S. (2010). “The Variations of Cation Exchange Capacity (CEC), pH,
and Zeta Potential in Expansive Soils Treated by Additives.” International Journal of Civil and
Structural Engineering, 1 (2), 139-154.
Amu O.O., Bamisaye O.F., and Komolafe I.A. (2011). “The Suitability and Lime Stabilization
Requirement of Some Lateritic Soil Samples as Pavement.” International Journal of Pure and
Applied Sciences and Technology, 2(1), 29-46.
ASTM D6276 − 99a. (Reapproved 2006). Standard Test Method for using pH to Estimate the
Soil-Lime Proportion Requirement for Soil Stabilization.
ASTM D7503 – 10. (July 1, 2010). Standard Test Method for Measuring the Exchange
Complex and Cation Exchange Capacity (CEC) of Inorganic Fine-Grained Soils.
Bairwa R., Saxena A.K. and Arora T.R. (2013). “Effect of lime and fly ash on Engineering
Properties of Black Cotton soil.” International Journal of Emerging Technology and Advanced
Engineering, 3 (11), 535-541.
Banin A. and Amiel A. (1970). “A Correlative Study of the Chemical and Physical Properties
of a Group of Natural Soils of Israel.” Geoderma, 3, 185-197.
Caravaca F., Lax A. and Albaladejo J. (1999). “Organic matter, nutrient contents and Cation
Exchange Capacity (CEC) in fine fractions from semiarid calcareous soils.” Geoderma, 93,
1999, 161–176.
Carter D.L., Mortland M.M. and Kemper W.D. (1986). “Specific Surface, Methods of Soil
Analysis.” 2nd edition, American Society of Agronomy, 413-423.
Churchman G.J. and Burke C.M. (1991). “Properties of sub-soils in relation to various
measures of surface area and water content.” Journal of Soil Science, 42, 463-478.
Das B.M. (2008). Advanced soil mechanics 3rd edition, New York, Taylor and Francis.

Page | 41
Dash S.K. and Hussain M. (2012). “Lime Stabilization of Soils: Reappraisal.” Journal of
Materials in Civil Engineering, 24 (6), 707–714.
Davoudi M.H. and Kabir E. (2011). “Interaction of lime and sodium chloride in a low plasticity
fine grain soils.” Journal of Applied sciences, 11 (2), 330-335.
Farrar D.M. and Coleman J.D. (1967). “The correlation of surface area with other properties
of nineteen British clay soils.” Journal of Soil Science. 18 (1), 118-124.
Gill, W.R. and Reaves, C.A. (1957). “Relationship of Atterberg Limits and Cation Exchange
Capacity (CEC) to Some Physical Properties of Soil.” Soil Science Society of America
Proceedings, 21, 491-497.
Holtz R.D. & Kovacs W.D. (1981). An introduction to geotechnical engineering, London,
Prentice hall International (UK).
International Soil Reference and Information Centre. Sixth edition (2002). Procedure for soil
analysis. 9.1-10.4.
Kaur P. and Singh G. (2012). “Soil improvement with lime.” International Organisation of
Scientific Research Journal of Mechanical and Civil Engineering, 1 (1), 51-53.
Kelley, W.P., and Jenny, H. (1936). “The Relation of Crystal Structure to Base Exchange and
its Bearing on Base Exchange in Soils.” Soil Science, 41, pp. 367-381.
Kolias S., Kasselouri-Rigopoulou V., Karahalios A. (2005). “Stabilisation of clayey soils with
high calcium fly ash and cement.” Cement & Concrete Composites, 27, 301–313.
Kumar A., Walia B.S. and Bajaj A. (2007). “Influence of Fly Ash, Lime, and Polyester Fibers
on Compaction and Strength Properties of Expansive Soil.” Journal of Materials in civil
engineering, 19 (3), 242–248.
Page | 42
Kumar V.J. and Sreedeep S. (2011). “Development of CEC Estimation Procedure Based on
Specific Surface Area of Soil.” Pan-Am CGS Geotechnical conference.
Mathew P.K., and Rao S.N. (1997). “Effect of lime on Cation Exchange Capacity (CEC) of
marina clay.” Journal of Geotechnical and Geoenviromental Engineering, ASCE, 123(2), 183-
185.
Mitchell. J.K. and Soga. K. (2005). Fundamentals of Soil Behaviour 3rd Edition, John Wiley
and Sons Inc., New York.
Muhmed A. and Wanatowski D. (2013). “Effect of Lime Stabilisation on the Strength and
Microstructure of Clay.” International Organisation of Scientific Research Journal of
Mechanical and Civil Engineering, 6 (3), 87-94.
Manasseh J. and Olufemi A. (2008). “Effect of Lime on Some Geotechnical Properties of
Igumale Shale.” Electronic Journal of Geotechnical Engineering, 13, 1-12.
Mathew P.K. and Rao S.N. (1997). “Influence of cations on compressibility behaviour of a
marine clay.” Journal of Geotechnical and Geoenvironmental Engineering, 123 (11), 1071-
1073.
Nalbantoglu Z. (2004). “Effectiveness of Class C fly ash as an expansive soil stabilizer.”
Construction and Building Materials, 18, 377–381.
Rao S.N. and Matthew P.K. (1995). “Effects of exchangeable cations on hydraulic conductivity
of a marine clay.” Clays and Clay Minerals, 43 (4), 433-437.
Rashidi M. and Seilsepour M. (2008). “Modelling of soil Cation Exchange Capacity (CEC)
based on soil organic carbon.” Asian Research Publishing Network Journal of Agricultural and
Biological Science, 3 (4), 40-45.
Sakr M.A., Shahin M.A., and Metwally Y.M. (2009). “Utilization of Lime for Stabilizing Soft
Clay Soil of High Organic Content.” Geotechnical and Geological Engineering, 27, 105–113.
Page | 43
Sezer A., Inan G., Yılmaz H. R., Ramyar K. (2004). “Utilization of a very high lime fly ash for
improvement of Izmir clay.” Building and Environment, 41, 150–155.
Siddique A. and Hossain M.A. (2012). “Effects of Lime stabilization on engineering properties
of an expansive soil for use in road construction.” Journal of Society for Transportation and
Traffic Studies, 2(4), 1-9.
Smith C.W., Hadas A., Dan J. and Koyumdjisky H. (1985). “Shrinkage and Atterberg limit in
relation to other properties of principal soil types in Israel.” Geoderma, 35, 47-65.
Tanaka H. and Locat J. (1999). “A microstructural investigation of Osaka Bay clay: the impact
of microfossils on its mechanical behaviour.” Canadian Geotechnical Journal, 36, 493–508.
Thompson M.L., Zhang H., Kazemi M. and Sandor J.A. (1989). “Contribution of Organic
Matter to Cation Exchange Capacity (CEC) and Specific Surface Area of Fractionated Soil
Materials.” Soil Science, 148 (4), 250-257.
Yukselen Y. and Kaya A. (2006). “Prediction of Cation Exchange Capacity (CEC) from soil
index properties.” Clay Minerals (2006), 41, 827 –837.
Zhang J. and Xing C. (2002). “Stabilization of Expansive Soil by Lime and Fly ash.” Journal
of Wuhan University of Technology, 17 (4), 73-77.