effect of pretreatment on the intermetallics in aluminum alloy - jku
TRANSCRIPT
Z. Phys. Chem.219 (2005) 1505–1518 by Oldenbourg Wissenschaftsverlag, München
Effect of Pretreatment on the Intermetallicsin Aluminum Alloy 2024-T3
By Jana Vander Kloet, Achim Walter Hassel∗, and Martin Stratmann
Max-Planck-Institut für Eisenforschung GmbH, Max-Planck-Str. 1, 40237 Düsseldorf,Germany
Dedicated to Prof. Dr. Hans-Jürgen Engell on the occasion of his 80th birthday
(Received May 15, 2005; accepted in revised form August 15, 2005)
Aluminum Alloy AA2024-T3 / Pretreatment / Filiform Corrosion /Intermetallic Particles / Scanning Kelvin Probe Force Microscopy
The effect of surface treatments on the surface characteristics of aluminium alloy 2024-T3 before the appearance of filiform corrosion (FFC) is investigated. The nature of thesurface prior to coating and initiation of FFC, with particular respect to the intermetallicsis investigated in this work.
The SKPFM (Scanning Kelvin Probe Force Microscopy), ToF-SIMS (Time of FlightSecondary Ion Mass Spectroscopy), XPS (X-Ray Photo Electron Spectroscopy) and SEM(Scanning Electron Microscopy) surface analysis techniques were used to characterizepolished AA2024-T3 before and after etching or after etching with subsequent chromatingtreatments. The etching pretreatment is intended to remove surface intermetallics andincrease the oxide layer thickness. In these respects, the treatment was partially successful:some, not all, of the particles were eliminated from the surface and the oxide thicknessincreased by about 25%. In addition, XPS depth profiling showed a copper and ironenrichment at the oxide–metal interface from this treatment.
The oxide thickness is drastically increased following the application of the chromateconversion coating. Furthermore, XPS and ToF-SIMS analysis revealed that Cu and Fewere enriched on the oxide surface indicating that either Cu is complexed into the Cr-Allayer following chromating or that the chromating coating is insufficiently formed onthe Cu-containing intermetallics. SKPFM analysis provided further information on thedistribution of these complexes on seen by distinct points of high potential on the treatedalloy surface.
1. IntroductionThis work is part of a study on the surface characteristics of aluminum alloy2024-T3 before and after the appearance of filiform corrosion (FFC). This
* Corresponding author. E-mail: [email protected]
1506 J. Vander Kloetet al.
paper concentrates on the nature of the surface prior to coating and the initi-ation of FFC, while another publication [1] examined alloy samples on whichcorrosion has taken place.
As a light-weight alloy of increased strength, the aluminum alloy 2024-T3 is commonly used in the aircraft industry [2]. Copper, iron and magnesiumadditions to the alloy provide this increased strength. However, the metal inclu-sions also provide sites on the substrate surface where oxygen reduction cantake place (this leads to aluminium dissolution) or pitting. One of the well-documented forms of corrosion which can appear under coatings on aluminiumalloys is filiform corrosion [3]. This corrosion type appears as filaments under-neath the coating and arises due to a differential aeration cell consisting of ananodic head and a cathodic tail [4].
Alloy surfaces are often pretreated in order to eliminate, or at least di-minish the extent of corrosion. Although environmentally undesirable, oneof the most common pretreatments is chromating. Surface characterization,prior to and following pretreatments, is necessary in order to further un-derstand the role surface components play in corrosion advancement. Nu-merous studies have already investigated AA2024-T3 surface characteris-tics including AES, XPS, Raman andToF-SIMS spectroscopies, SEM andSKPFM [5–14].
Many of these investigations have examined the interactions betweenchromate and intermetallic particles (IMPs). Several interesting points havecome out of these works. SEM and SKPFM measurements have been usedto identify differences in composition and potential of intermetallic particleson a polished, unchromated AA2024-T3 surface [10–12]. Different chro-mium concentrations have been identified on Cu-rich and Fe-rich particlesand the aluminum matrix, with the lowest Cr concentration occurring on theCu-rich intermetallics [5]. Dynamic and static ToF-SIMS measurements [6],as well as X-ray analysis [14] were also used to illustrate the low concen-tration of Cr on IMPs. AFM topographical studies also demonstrated thatCCC develops much slower and results in thinner coatings on alloy inter-metallics [13]. XANES spectroscopy showed that the Cr(VI)/Cr(III) ratiowas much lower on intermetallic particles than on the Al matrix, suggest-ing that possible Cr(VI) reservoirs for ‘healing’ mechanisms are absent onthese particles [6]. Raman spectroscopy results indicate that Fe(CN)6
3−, anaccelerator for CCC formation [7], maypreferentially chemisorb on certainCu-containing IMPs. This chemisorbed layer appeared to interfere with CCCdevelopment [8]. Furthermore, XPS and AES spectroscopy studies have shownthat ferricyanide may complex Cr and Cu as salts present which were foundin the CCC [5, 9].
These work is continued here, not only to look at chromating as a pre-treatment, but also the effect of the Sanchem etching pretreatment designed toremove intermetallics prior to chromating.
Effect of Pretreatment on the Intermetallics in Aluminum Alloy 2024-T3 1507
Table 1. Composition (in weight percent) of aluminum alloy 2024-T3.
Cu Mg Fe Si Zn Ti Cr Other
AA2024-T3 4.35 1.50 0.50 0.50 0.25 0.15 0.10 0.20
Table 2. Contents of pre-treatment solutions.
Solution Contents
Sanchem 500 Phosphate cleaner with no silicate
Sanchem 1000 Sodium bromate in nitric acid
Alodine CCC Chromic acid ∼50–60%Sodium fluoride ∼5–10%Potassium zirconate ∼5–10%Potassium fluoroborate ∼20–30%Potassium ferrocyanide ∼10–15%
2. Experimental
The aluminum alloy samples usedthroughout this research were AA2024-T3. The alloy composition is given in Table 1. The AA2024-T3 samples wereground and polished to 1µm using an ethanol-based diamond paste. Thesesamples, along with unpolished specimens, were then treated with Sanchem500/1000 or with Sanchem 500/1000 and Alodine 1200S solutions [15]. TheSanchem 500/1000 is an acidic phosphate solution intended to remove the in-termetallic particles from the alloy surface. Alodine 1200S is a chromatingsolution which leads to chromate conversion coatings on aluminium surfaces.The contents of these solutions are given in Table 2. Detailed application de-scriptions can be found elsewhere [15].
Aluminum alloy 2024-T3 samples used forfiliform investigations are listedin Table 3 along with the pre-treatments. Duplicates of each sample were alsoinvestigated and the difference in results was found to be negligible.
The techniques used in the analysis of the samples mentioned in Table 3were Scanning Electron Microscopy (SEM), X-Ray Photoelectron Spec-troscopy (XPS), Time-of-Flight Secondary Ion Mass Spectroscopy (ToF-SIMS), and Scanning Kelvin Probe Force Microscopy (SKPFM). With theexception of the optical images recorded, nearly all other measurements pre-sented here were those determined forpolished samples. The decreased surfaceroughness of these samples enables easier analysis with the aforementionedtechniques.
1508 J. Vander Kloetet al.
Table 3. Samples used in the investigation of AA2024-T3.
Sample Polished Sanchem Alodine
12 ×3 × ×4 ×5 × ×6 × × ×
SEM (CamScan 4, Elektronenoptik, Germany) provided detailed images ofthe surface morphology and, through Energy Dispersive X-Ray (EDX) analy-sis, chemical compositions of intermetallic particles and the aluminum matrix.Depth profiles were obtained with XPS (Quantum 2000, PHI, USA). Thesource used was monochromated Al. The sputter rate used was 2.5 nm/min(based on SiO2). ToF-SIMS (Trift II, PHI, USA) was used to determine elem-ent distributions on the sample surfaces. The primary ion source was a galliumgun operated at 25 kV. All samples were pre-sputtered to remove atmosphericdepositions and the image acquisition time was 6 min. Sample topography andsurface potential differences were recorded using SKPFM (Dimension 3100,Digital Instruments, Veeco, USA).
3. Results
In the following sections, the results and discussion will be focused onsamples 4–6. Although all of the aforementioned analyses were also performedfor unpolished samples (1–3), the roughsurface topography created measure-ment difficulties, especially for SKPFM.
3.1 SEM
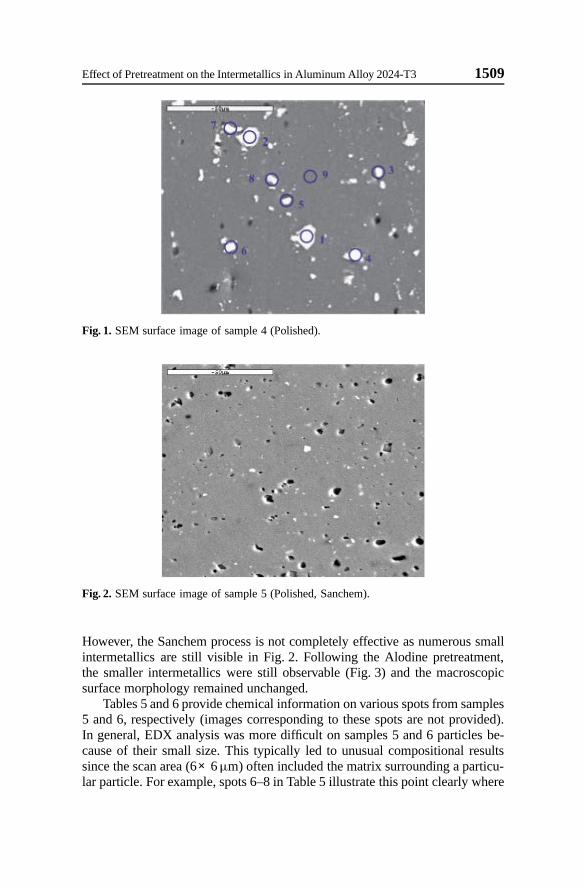
The surface morphology of samples 4–6 can be seen in Figs. 1–3. In Fig. 1,at least two types of intermetallics, those with or without well defined edges,can be seen. Upon comparison of these intermetallics with the EDX analysisgiven in Table 4, it is obvious that those intermetallics with sharp edges andcorners correspond to Cu-Mn-Fe particles (spots 1, 2, 4, 6) while more roundedparticles contained Cu-Mg (spots 3, 5, 7). This is in agreement with previouswork [10, 11]. Also seen in Fig. 1 are holes in the surface where intermetallicshave fallen away from the bulk aluminum.
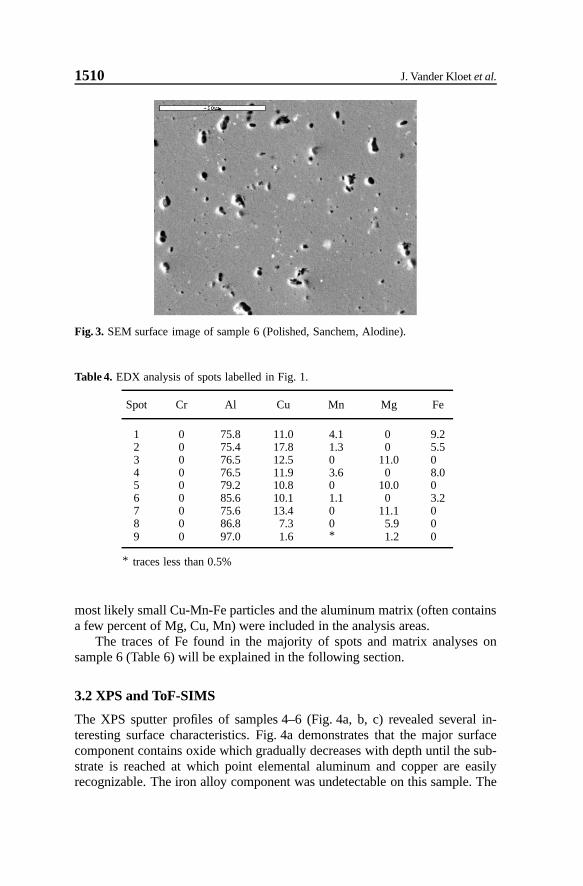
Once the alloy surface has been etched using the Sanchem solutions, thenumber of surface holes increases, indicating that a large number of the big-ger particles have been removed through this treatment process (see Fig. 2).
Effect of Pretreatment on the Intermetallics in Aluminum Alloy 2024-T3 1509
Fig. 1. SEM surface image of sample 4 (Polished).
Fig. 2. SEM surface image of sample 5 (Polished, Sanchem).
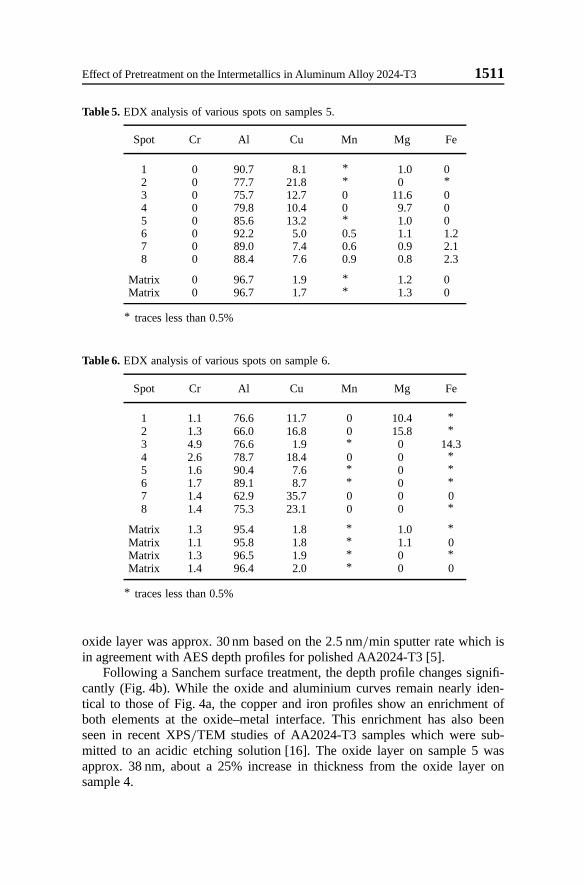
However, the Sanchem process is not completely effective as numerous smallintermetallics are still visible in Fig. 2. Following the Alodine pretreatment,the smaller intermetallics were still observable (Fig. 3) and the macroscopicsurface morphology remained unchanged.
Tables 5 and 6 provide chemical information on various spots from samples5 and 6, respectively (images corresponding to these spots are not provided).In general, EDX analysis was more difficult on samples 5 and 6 particles be-cause of their small size. This typically led to unusual compositional resultssince the scan area (6×6µm) often included the matrix surrounding a particu-lar particle. For example, spots 6–8 in Table 5 illustrate this point clearly where
1510 J. Vander Kloetet al.
Fig. 3. SEM surface image of sample 6 (Polished, Sanchem, Alodine).
Table 4. EDX analysis of spots labelled in Fig. 1.
Spot Cr Al Cu Mn Mg Fe
1 0 75.8 11.0 4.1 0 9.22 0 75.4 17.8 1.3 0 5.53 0 76.5 12.5 0 11.0 04 0 76.5 11.9 3.6 0 8.05 0 79.2 10.8 0 10.0 06 0 85.6 10.1 1.1 0 3.27 0 75.6 13.4 0 11.1 08 0 86.8 7.3 0 5.9 09 0 97.0 1.6 * 1.2 0
* traces less than 0.5%
most likely small Cu-Mn-Fe particles and the aluminum matrix (often containsa few percent of Mg, Cu, Mn) were included in the analysis areas.
The traces of Fe found in the majority of spots and matrix analyses onsample 6 (Table 6) will be explained in the following section.
3.2 XPS and ToF-SIMS
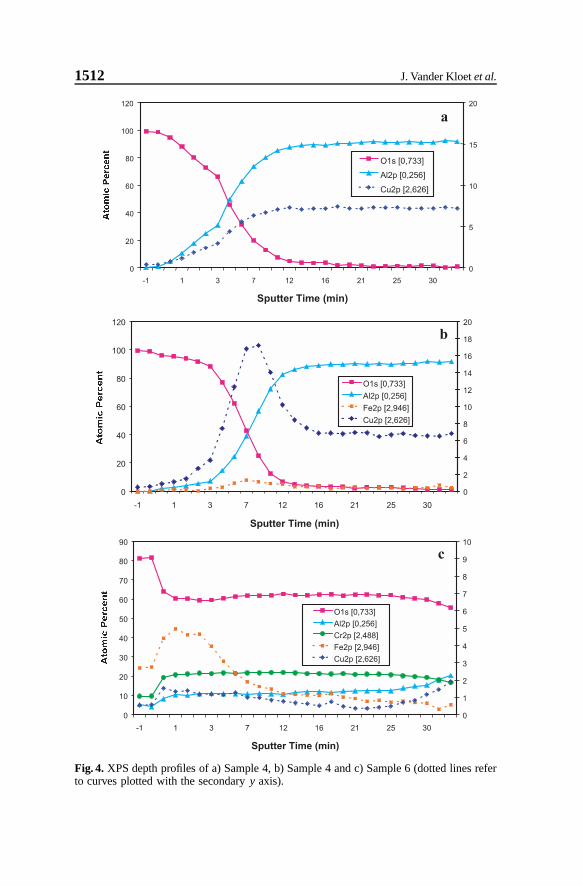
The XPS sputter profiles of samples 4–6 (Fig. 4a, b, c) revealed several in-teresting surface characteristics. Fig. 4a demonstrates that the major surfacecomponent contains oxide which gradually decreases with depth until the sub-strate is reached at which point elemental aluminum and copper are easilyrecognizable. The iron alloy component was undetectable on this sample. The
Effect of Pretreatment on the Intermetallics in Aluminum Alloy 2024-T3 1511
Table 5. EDX analysis of various spots on samples 5.
Spot Cr Al Cu Mn Mg Fe
1 0 90.7 8.1 * 1.0 02 0 77.7 21.8 * 0 *3 0 75.7 12.7 0 11.6 04 0 79.8 10.4 0 9.7 05 0 85.6 13.2 * 1.0 06 0 92.2 5.0 0.5 1.1 1.27 0 89.0 7.4 0.6 0.9 2.18 0 88.4 7.6 0.9 0.8 2.3
Matrix 0 96.7 1.9 * 1.2 0Matrix 0 96.7 1.7 * 1.3 0
* traces less than 0.5%
Table 6. EDX analysis of various spots on sample 6.
Spot Cr Al Cu Mn Mg Fe
1 1.1 76.6 11.7 0 10.4 *2 1.3 66.0 16.8 0 15.8 *3 4.9 76.6 1.9 * 0 14.34 2.6 78.7 18.4 0 0 *5 1.6 90.4 7.6 * 0 *6 1.7 89.1 8.7 * 0 *7 1.4 62.9 35.7 0 0 08 1.4 75.3 23.1 0 0 *
Matrix 1.3 95.4 1.8 * 1.0 *Matrix 1.1 95.8 1.8 * 1.1 0Matrix 1.3 96.5 1.9 * 0 *Matrix 1.4 96.4 2.0 * 0 0
* traces less than 0.5%
oxide layer was approx. 30 nm based on the 2.5 nm/min sputter rate which isin agreement with AES depth profiles for polished AA2024-T3 [5].
Following a Sanchem surface treatment, the depth profile changes signifi-cantly (Fig. 4b). While the oxide and aluminium curves remain nearly iden-tical to those of Fig. 4a, the copper and iron profiles show an enrichment ofboth elements at the oxide–metal interface. This enrichment has also beenseen in recent XPS/TEM studies of AA2024-T3 samples which were sub-mitted to an acidic etching solution [16]. The oxide layer on sample 5 wasapprox. 38 nm, about a 25% increase in thickness from the oxide layer onsample 4.
1512 J. Vander Kloetet al.
Fig. 4. XPS depth profiles of a) Sample 4, b) Sample 4 and c) Sample 6 (dotted lines referto curves plotted with the secondaryy axis).
Effect of Pretreatment on the Intermetallics in Aluminum Alloy 2024-T3 1513
Fig. 4c shows the influence of chromating on the oxide composition. Theslight increases/decreases at low sputter times in the curves of Fig. 4c indi-cate the removal of atmospheric depositions from the surface. Upon exam-ination of this graph, iron and copper were both enriched at the oxide sur-face. Iron surface enrichments explain the Fe traces found in EDX matrixanalysis of sample 6 (see Table 6). Aluminum and chromium concentra-tions remained relatively constant throughout the oxide, indicating the littlechemical change of the mixed oxide with respect to these elements. Theoxide thickness also increased drastically (> 80 nm) following chromating.Oxide thicknesses of 77–84 nm and 85 nm have previously been reported forAA2024-T3 samples exposed to a similar chromating solution as that used inthis work [5, 16].
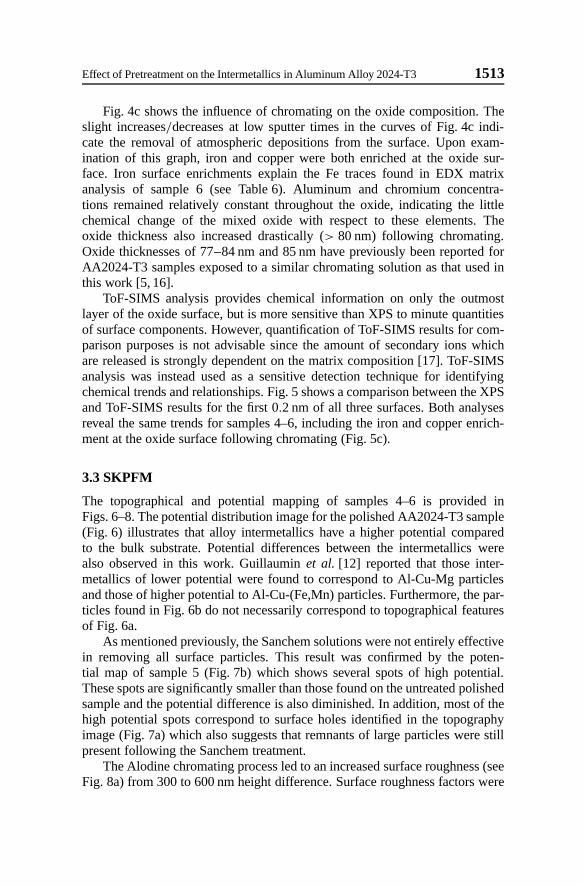
ToF-SIMS analysis provides chemical information on only the outmostlayer of the oxide surface, but is more sensitive than XPS to minute quantitiesof surface components. However, quantification of ToF-SIMS results for com-parison purposes is not advisable since the amount of secondary ions whichare released is strongly dependent on the matrix composition [17]. ToF-SIMSanalysis was instead used as a sensitive detection technique for identifyingchemical trends and relationships. Fig. 5 shows a comparison between the XPSand ToF-SIMS results for the first 0.2 nm of all three surfaces. Both analysesreveal the same trends for samples 4–6, including the iron and copper enrich-ment at the oxide surface following chromating (Fig. 5c).
3.3 SKPFM
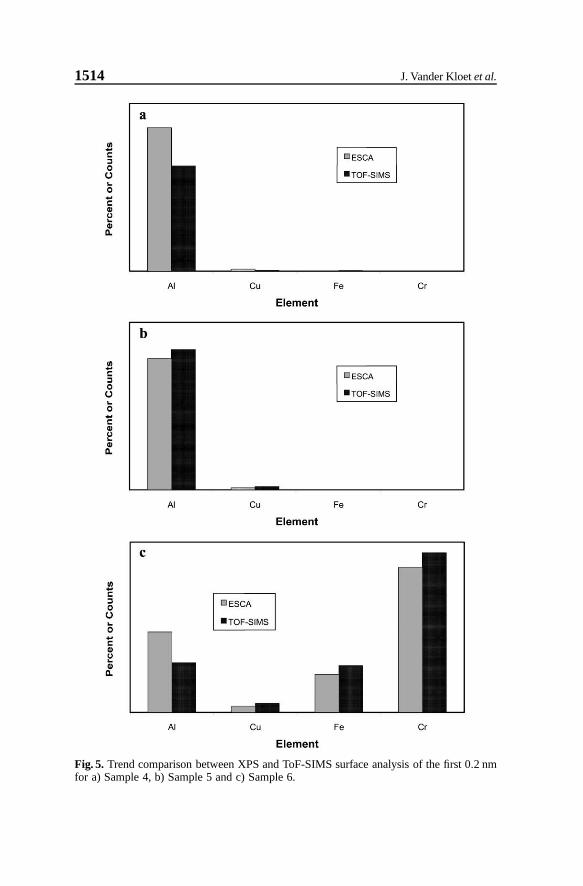
The topographical and potential mapping of samples 4–6 is provided inFigs. 6–8. The potential distribution image for the polished AA2024-T3 sample(Fig. 6) illustrates that alloy intermetallics have a higher potential comparedto the bulk substrate. Potential differences between the intermetallics werealso observed in this work. Guillauminet al. [12] reported that those inter-metallics of lower potential were found to correspond to Al-Cu-Mg particlesand those of higher potential to Al-Cu-(Fe,Mn) particles. Furthermore, the par-ticles found in Fig. 6b do not necessarily correspond to topographical featuresof Fig. 6a.
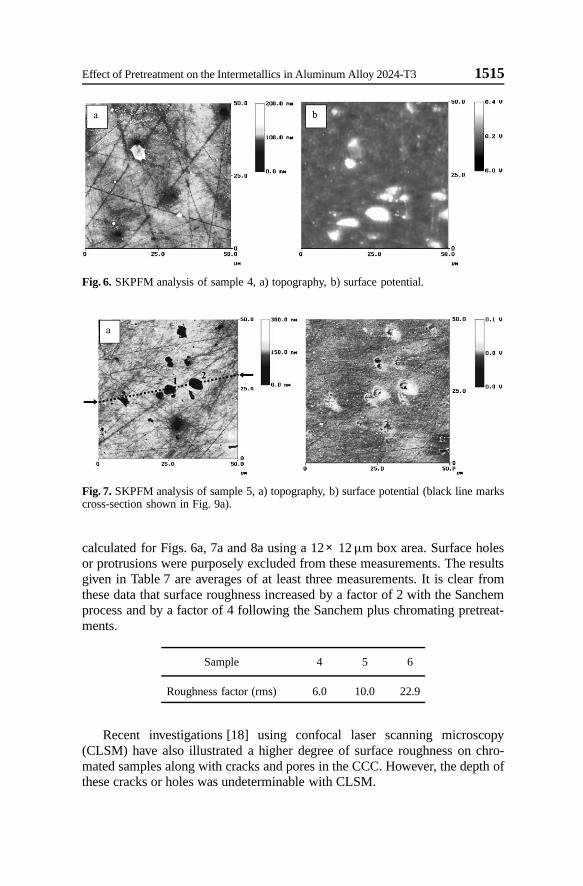
As mentioned previously, the Sanchem solutions were not entirely effectivein removing all surface particles. This result was confirmed by the poten-tial map of sample 5 (Fig. 7b) which shows several spots of high potential.These spots are significantly smaller than those found on the untreated polishedsample and the potential difference is also diminished. In addition, most of thehigh potential spots correspond to surface holes identified in the topographyimage (Fig. 7a) which also suggests that remnants of large particles were stillpresent following the Sanchem treatment.
The Alodine chromating process ledto an increased surface roughness (seeFig. 8a) from 300 to 600 nm height difference. Surface roughness factors were
1514 J. Vander Kloetet al.
Fig. 5. Trend comparison between XPS and ToF-SIMS surface analysis of the first 0.2 nmfor a) Sample 4, b) Sample 5 and c) Sample 6.
Effect of Pretreatment on the Intermetallics in Aluminum Alloy 2024-T3 1515
Fig. 6. SKPFM analysis of sample 4, a) topography, b) surface potential.
Fig. 7. SKPFM analysis of sample 5, a) topography, b) surface potential (black line markscross-section shown in Fig. 9a).
calculated for Figs. 6a, 7a and 8a using a 12×12µm box area. Surface holesor protrusions were purposely excludedfrom these measurements. The resultsgiven in Table 7 are averages of at least three measurements. It is clear fromthese data that surface roughness increased by a factor of 2 with the Sanchemprocess and by a factor of 4 following the Sanchem plus chromating pretreat-ments.
Sample 4 5 6
Roughness factor (rms) 6.0 10.0 22.9
Recent investigations [18] using confocal laser scanning microscopy(CLSM) have also illustrated a higher degree of surface roughness on chro-mated samples along with cracks and pores in the CCC. However, the depth ofthese cracks or holes was undeterminable with CLSM.
1516 J. Vander Kloetet al.
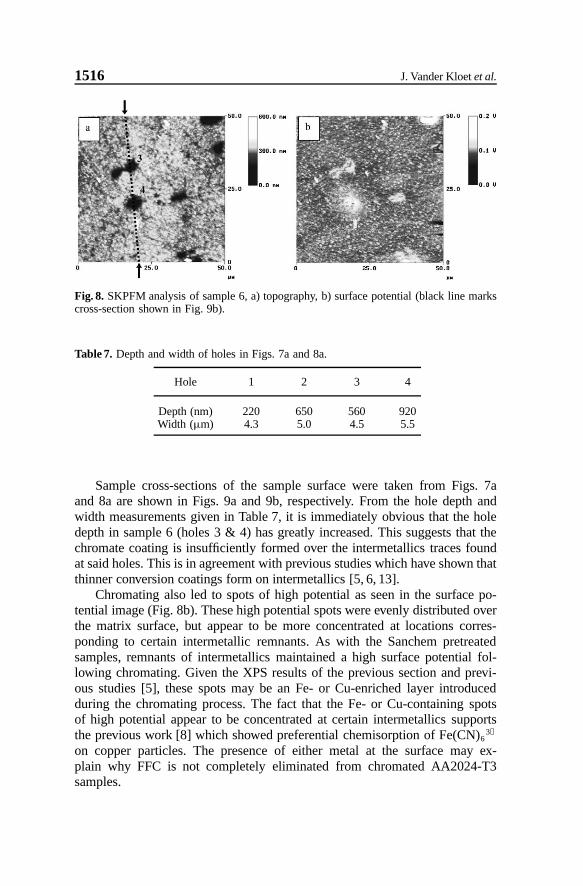
Fig. 8. SKPFM analysis of sample 6, a) topography, b) surface potential (black line markscross-section shown in Fig. 9b).
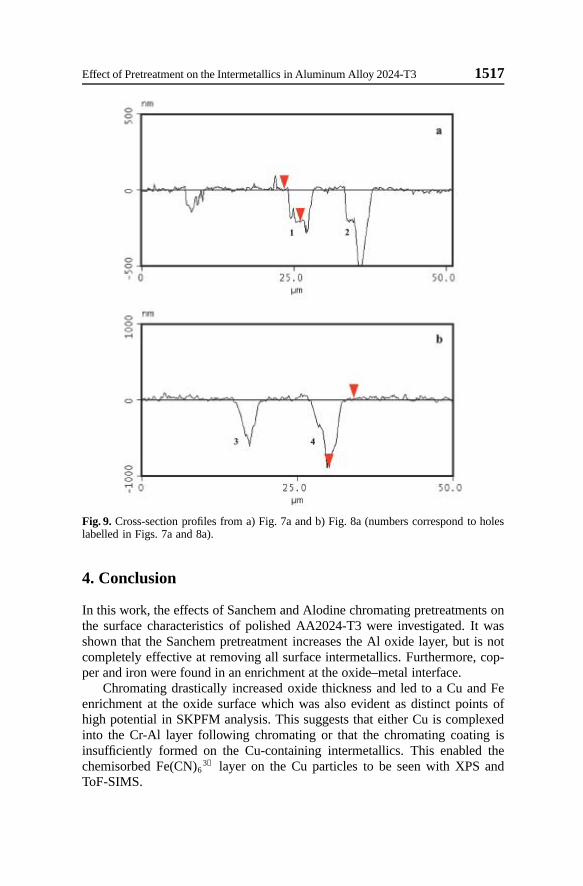
Table 7. Depth and width of holes in Figs. 7a and 8a.
Hole 1 2 3 4
Depth (nm) 220 650 560 920Width (µm) 4.3 5.0 4.5 5.5
Sample cross-sections of the sample surface were taken from Figs. 7aand 8a are shown in Figs. 9a and 9b, respectively. From the hole depth andwidth measurements given in Table 7, it is immediately obvious that the holedepth in sample 6 (holes 3 & 4) has greatly increased. This suggests that thechromate coating is insufficiently formed over the intermetallics traces foundat said holes. This is in agreement with previous studies which have shown thatthinner conversion coatings form on intermetallics [5, 6, 13].
Chromating also led to spots of high potential as seen in the surface po-tential image (Fig. 8b). These high potential spots were evenly distributed overthe matrix surface, but appear to be more concentrated at locations corres-ponding to certain intermetallic remnants. As with the Sanchem pretreatedsamples, remnants of intermetallics maintained a high surface potential fol-lowing chromating. Given the XPS results of the previous section and previ-ous studies [5], these spots may be an Fe- or Cu-enriched layer introducedduring the chromating process. The fact that the Fe- or Cu-containing spotsof high potential appear to be concentrated at certain intermetallics supportsthe previous work [8] which showed preferential chemisorption of Fe(CN)6
3−
on copper particles. The presence of either metal at the surface may ex-plain why FFC is not completely eliminated from chromated AA2024-T3samples.
Effect of Pretreatment on the Intermetallics in Aluminum Alloy 2024-T3 1517
Fig. 9. Cross-section profiles from a) Fig. 7a and b) Fig. 8a (numbers correspond to holeslabelled in Figs. 7a and 8a).
4. Conclusion
In this work, the effects of Sanchem and Alodine chromating pretreatments onthe surface characteristics of polished AA2024-T3 were investigated. It wasshown that the Sanchem pretreatment increases the Al oxide layer, but is notcompletely effective at removing all surface intermetallics. Furthermore, cop-per and iron were found in an enrichment at the oxide–metal interface.
Chromating drastically increased oxide thickness and led to a Cu and Feenrichment at the oxide surface which was also evident as distinct points ofhigh potential in SKPFM analysis. This suggests that either Cu is complexedinto the Cr-Al layer following chromating or that the chromating coating isinsufficiently formed on the Cu-containing intermetallics. This enabled thechemisorbed Fe(CN)6
3− layer on the Cu particles to be seen with XPS andToF-SIMS.
1518 J. Vander Kloetet al.
Acknowledgement
The authors wish to acknowledge G. Frankel (Ohio State University) for hisorganization and coordination of the MURI project of which this work isa part. Special thanks are extended to R. Granata of Florida Atlantic University(Seatech) for sample preparation.
References
1. J. Vander Kloet, A. W. Hassel, and M. Stratmann, Electrochim. Acta48 (2003)1211.
2. T. Lyman and W. Schmidt (Eds.),Metals Handbook, 8th edn., Vol. 1, AmericanSociety for Metals, Ohio (1961).
3. A. Bautista, Prog. Org. Coat.28 (1996) 49.4. R. T. Ruggeri and T. R. Beck, Corrosion-Nace39 (1983) 452.5. P. L. Hagans and C. M. Haas, Surf. Interf. Anal.21 (1994) 65.6. G. P. Halada, C. R. Clayton, M. J. Vasquez, and J. R. Kearns, Proc. Electrochem.
Soc.98 (1999) 139.7. L. Xia and R. L. McCreery, J. Electrochem. Soc.146 (1999) 3696.8. W. R. McGovern, P. Schmutz, R. G. Buchheit, and R. L. McCreery, J. Electrochem.
Soc.147 (2000) 4494.9. A. E. Hughes, R. J. Taylor, and B. W. R. Hinton, Surf. Interf. Anal.25 (1997) 223.
10. P. Schmutz and G. S. Frankel, J. Electrochem. Soc.145 (1998) 2285.11. P. Schmutz and G. S. Frankel, J. Electrochem. Soc.145 (1998) 2295.12. V. Guillaumin, P. Schmutz, and G. S. Frankel, J. Electrochem. Soc. B148 (2001)
163.13. J. R. Waldrop and M. W. Kendig, J. Electrochem. Soc.145 (1998) L11.14. L. Juffs, A. E. Hughes, and P. J. K. Paterson, Micron32 (2001) 777.15. R. R. Miron, M. M. Madani, and R. D. Granata, Specimen Preparation: CCC and
Polymer Coating of Al Substrates, inMechanism of Al Alloy Corrosion and theRole of Chromate Inhibitors, 2nd Ann. Rep., AFOSR Multidisciplinary UniversityResearch Initiative, Contract No. F49620-96-1-0479 (1998).
16. X. Sun, R. Li, K. C. Wong, and K. A. R. Mitchell, J. Mater. Sci.36 (2001) 3215.17. J. C. Newman, B. A. Carlson, R. S. Michael, and J. F. Moulder,Static SIMS Hand-
book of Polymer Analysis, T. A. Hohlt (Ed.), Perkin-Elmer Corporation, PhysicalElectronics Division, Eden Prairie, MN (1991).
18. G. O. Ilevbare and J. R. Scully, J. Electrochem. Soc. B148 (2001) 196.