effects analysis of awas adoption - bureau of … summary deloitte access economics: effects...
TRANSCRIPT

Effects analysis of AWAS adoption Bureau of Meteorology
17 February 2012
FINAL REPORT

Member of Deloitte Touche Tohmatsu Limited
Deloitte Access Economics Pty Ltd
ACN 149 633 116
550 Bourke Street
Melbourne VIC 3000
GPO Box 78
Melbourne VIC 3001 Australia
Tel: +61 (0) 3 9671 7000
Fax: +61 (0)3 9671 7700
www.deloitte.com.au
Mr Andrew Terracini
Bureau of Meteorology Level 13
14 Childers Street
Canberra ACT 2600
Via email: [email protected]
17 February 2012
Dear Mr Terracini
Effects analysis of AWAS adoption
I am pleased to present you with our analysis of the impact of the introduction of the Australian Water Accounting
Standards.
Yours sincerely
Paul Liggins
Director
Deloitte Access Economics Pty Ltd

Deloitte refers to one or more of Deloitte Touche Tohmatsu Limited, a UK private company limited by guarantee, and its network of member firms, each of which is a legally separate and independent entity. Please see www.deloitte.com/au/about for a detailed description of the legal structure of Deloitte Touche Tohmatsu Limited and its member firms.
© 2012 Deloitte Access Economics Pty Ltd
Contents
1 Introduction 1
1.1 Development of the Australian Water Accounting Standard 1
1.2 Purpose of this report 2
1.3 Structure of this report 2
2 Affected parties 3
2.1 Report preparers 3
2.1 Report users 5
3 Types of costs and benefits 6
3.1 Costs 6
3.2 Benefits 7
4 Impact of AWAS adoption 12
4.1 State and Territory Governments 12
4.2 Urban and rural water utilities 13
4.3 Environmental water rights holders 15
4.4 Major water users 17
4.5 Summary 18
5 Cumulative impact 19
5.1 Estimated costs 19
5.2 Breakeven analysis 20
5.3 Sensitivity analysis 21
5.4 Next steps 22
Appendix A 23
Appendix B 30

Executive Summary
Deloitte Access Economics: Effects analysis of AWAS adoption
i
Executive Summary
The Bureau of Meteorology (the Bureau) has appointed an independent board, the Water Accounting
Standards Board to develop the Australian Water Accounting Standards (AWAS). The latest
development was the release of an exposure draft in October 2010 of AWAS 1 for voluntary adoption
and comment.
This report provides a preliminary assessment of the costs and benefits of the voluntary introduction
of the AWAS. The analysis identifies the first order costs and benefits for the preparers and users of a
General Purpose Water Accounting Report (which includes government, industry and the community)
over a period of ten years. It is based on a series of case studies with organisations likely to be
affected by AWAS conducted by the Bureau.
Organisations likely to be affected by AWAS
Organisations likely to be affected by the AWAS fall into two categories: ‘report preparers’ and
‘report users’. Table E.1 below summaries the number of potential report preparers and water report
entities that the Bureau estimate are likely to participate in the AWAS.
Table E.1: Number of potential report preparers and water report entities
Types of report preparers
Report preparers Number of report preparers
Total number of water report entities
State and Territory governments 8 88
Urban and rural water utilities
Urban water utilities 79a 79
Rural water utilities and major irrigation companies
13b 104
Subtotal 92 183
Major water users Mining companies 44c 44
Large thermal electricity generators (greater than 100MWh)
34 34
Major industrial users 9c 9
Subtotal 87 87
Environmental water rights holders 3 3
Total 90 361
Notes: (a) Based on the number of urban water utilities with 10,000 connections or greater. Source: National
Performance Report 2009-10: Urban water utilities. (b) Based on rural water service providers represented in the
National Performance Report 2009-10: rural water service providers. (c) Based on the number of mining
companies and industrial companies listed in the S&P/ASX 200 at 23/01/2012.
Given that the voluntary adoption of AWAS is very much in its infancy; it is not possible to estimate
the types or number of report users, as this will depend on the number and type of potential water
report entities that participate.
Estimated costs
As part of the case studies, potential report preparers were asked to identify and quantify the likely
cost burden of developing a General Purpose Water Accounting Report (GPWAR) for a water report
entity. Organisations identified the following four categories of costs:

Executive Summary
Deloitte Access Economics: Effects analysis of AWAS adoption
ii
Education: the cost of training staff to compile a GPWAR;
Purchasing: the cost of acquiring and maintaining additional software to support the development
of a GPWAR;
Assurance: the cost of independent assurance services for a GPWAR; and
Publication and documentation: the cost of developing and publishing a GPWAR.
The magnitude of estimated costs to develop a GPWAR ranged widely depending on the type of water
report entity and the complexity of their operations. Figure E.1 illustrates the estimated range of costs
different report preparers will incur (less than $15,000 to more than $60,000), with the individual
ranges representing the difference in the anticipated costs between the first year and subsequent years
as a result of familiarity with the process.
Figure E.1: Estimated range of costs to produce a GPWAR by water report entity
Assuming a GPWAR is produced for each of these potential water report entities and AWAS is taken
up over a four year period, the cumulative estimated cost to report preparers over a ten year period at a
7% discount rate will be $49.0 million.
Benefits
We have identified three key categories of benefits resulting from AWAS adoption.
Reduced reporting – where the current reporting burden of water report entities is reduced
through the AWAS replacing other reports (where information is duplicated);
Informed decision making – The availability of information that is contextual, consistent,
comparable and independently assured results in improved confidence from information users
such as central agencies, water utilities, investors, academics, lobbyists and the general public;
and
Stewardship of a publicly owned natural resource – where it is demonstrated through a nationally
consistent standard that water is being managed and defined consistently across state borders.
As with many areas of water management, the development of the AWAS represents a world first.
Given the innovative nature of this approach and the formative stage of development of AWAS it is
not currently possible to directly value these benefits. However, given the voluntary nature of the
AWAS, report preparers will only develop GPWAR for water report entities where the benefits are at
least equivalent to the costs.
Given the uncertainty surrounding the costs and particularly the benefits, a break-even analysis has
been undertaken. The objective of a break-even analysis is to identify the minimum quantum of
benefits needed for a proposal to at least cover its total costs. A break-even analysis is attractive in this
instance because it does not seek to directly value benefits (which cannot be quantified), instead it
provides an indication as to the level of benefit that needs to be achieved to offset costs. It should not
however be seen as a measure of expected benefit or a target of success.
$0
$10,000
$20,000
$30,000
$40,000
$50,000
$60,000
$70,000
$80,000
Water catchments Urban water systems
Irrigation companies
Environmental water rights
holders
Major water users
Co
st
to p
rod
uce a
GP
WA
R

Executive Summary
Deloitte Access Economics: Effects analysis of AWAS adoption
iii
For the purposes of this assessment it has been assumed that the first benefits of the introduction of the
AWAS are first realised two years after its introduction and the full suite of benefits is not realised
until the AWAS has been in practice for eight years. In order for the introduction of the AWAS to
break-even, assuming this benefits trajectory, it must generate $15 million worth of benefit for the
community by the eighth year.
Figure E.2: Break even analysis
Next steps
As part of the further development of a comprehensive and robust Cost Benefit Analysis for AWAS
adoption we recommend the following:
A willingness-to-pay study for water information in Australia be conducted – to collect
information on the population of report users and to more accurately estimate the value of
GPWAR to report users; and
That voluntary completion of GPWAR be actively promoted and supported – to ensure the
development of reliable data regarding the costs and benefits of AWAS adoption.
These steps should enable a more rigorous understanding of the costs and benefits in the coming years
to be developed.
-15
-10
-5
0
5
10
15
20
Year 1 Year 2 Year 3 Year 4 Year 5 Year 6 Year 7 Year 8 Year 9 Year 10
($ m
illi
on
)
Costs Benefits

Introduction
Deloitte Access Economics: Effects analysis of AWAS adoption
1
1 Introduction
Water availability is a major issue for Australia. As competition for water increases so does the need
to fully and consistently understand how water resources are being allocated and used.1 Without this
information decision makers cannot ensure that the water is allocated in the most efficient and
effective manner, or ensure that policy decisions are based on reliable and timely data.
Through the National Water Initiative (NWI), Commonwealth and state and territory governments
have committed to the provision of consistent and comparable information on water resources across
Australia.
Water accounting has been identified as one element of this improved level of information provision.
Water accounting is defined as a systematic process of identifying, recognising, quantifying,
reporting, and assuring: information about water, the rights and other claims to that water, and the
obligations against that water.2
The water industry currently has systems in place to account for water availability, water rights and
obligations, however, the ad hoc and inconsistent development of these systems has the potential to
lead to divergent definitions, misunderstandings and information gaps. The development of a
consistent standard and format for water reporting is essential for enabling evaluation of
accountability and compliance and include independent assurance.
It is envisaged that just as general purpose financial reports assist financial and business decision-
making, General Purpose Water Accounting Reports (GPWAR) will assist users making and
evaluating decisions about the allocation of water resources.3 The key objective of water accounting is
to establish a set of standardised practices across Australia. By doing so, consistent and comparable
information on water resources will be available for decision makers and will support:
Policy development at the national level;
Water resource planning and monitoring at the jurisdictional level;
Water resource management at the water organisation level;
On-site water management at the site level; and
Decision making about the allocation of resources at the individual level.
1.1 Development of the Australian Water
Accounting Standard
Since the NWI was signed by states and territories in 2004, a significant body of work has been
undertaken to develop water accounting standards. The first major piece of work was a stock-take on
Australia’s water accounting practices completed by SKM in 2006.
In 2007, the introduction of the Water Act 2004 (Cwth) (the Act) provided the legislative basis for the
Australian Water Accounting Standard (AWAS). Under the Act, the Bureau of Meteorology (the
Bureau) has two specific responsibilities with respect to water accounting which are:
Issuing water information standards; and
Compiling and maintaining water accounts for Australia, including a set of water accounts to be
known as the National Water Account.
1 Bureau of Meteorology 2011, Information Sheet 8: Accounting for Australia’s Water. 2 Water Accounting Conceptual Framework (WACF), page 13. 3 Water Accounting Conceptual Framework (WACF), page 22.

Introduction
Deloitte Access Economics: Effects analysis of AWAS adoption
2
The Water Accounting Standards Board (WASB), an independent expert advisory board to the
Bureau, was established to develop the Water Accounting Conceptual Framework (WACF) and the
Preliminary Australian Water Accounting Standard in 2009. These were accompanied by capacity
building in water accounting through a targeted practical pilot testing program that obtained detailed
feedback from a diverse range of water industry stakeholders.
Exposure Draft of AWAS 1
A key development was the release of an exposure draft of AWAS 1 (ED AWAS 1) in October 2010
for voluntary adoption and comment. The content of the ED AWAS 1 includes:
Definitions of water accounting elements (water assets, water liabilities, changes in water assets,
changes in water liabilities and net water assets);
Recognition criteria for those elements;
Quantification attributes and units for those elements; and
Disclosure requirements.
The WASB intends to expose the draft for up to two years, inviting comments from stakeholders. It is
anticipated that voluntary adoption of ED AWAS 1 and further testing and feedback will contribute to
the development of a final AWAS, scheduled for release at the end of 2012. Concurrently, the Bureau
is also working with the Auditing and Assurance Standards Board (AUASB) to develop an assurance
standard for GPWAR.
The approach taken to the development of water accounting standards in Australia is unique. Nowhere
else in the world have water accounting standards borrowed from the financial accounting standards-
setting experience, as the WASB has done in developing both the Water Accounting Conceptual
Framework (WACF) and the ED AWAS 1.
1.2 Purpose of this report
The purpose of this report is to provide a preliminary assessment of impacts of the introduction of the
AWAS. The analysis identifies the first order impacts for the preparers and users of a GPWAR
(which includes government, industry and the community). It is based on a series of case studies that
were conducted by the Bureau with organisations that were identified as potential report preparers or
report users. Appendix A provides the templates that were used to guide the case studies and collect
information from the report preparers and the report users.
1.3 Structure of this report The remainder of this report is structured as follows:
Chapter 2:sets out the parties that are likely to be involved in developing or using a GPWAR;
Chapter 3: provides a description of the types of costs and benefits generated by the development
and adoption of AWAS;
Chapter 4: provides an analysis of the impact of choosing to develop a GPWAR for different
types of organisations ; and
Chapter 5: summarises the aggregate costs and benefits of the introduction of GPWAR.

Affected parties
Deloitte Access Economics: Effects analysis of AWAS adoption
3
2 Affected parties Parties affected by the AWAS fall within two categories; ‘report preparers’ being the organisations
which will choose to produce a GPWAR on behalf of one or more of their water entities; and ‘report
users’ being those parties that will utilise the information of GPWAR. It is anticipated that some of the
report preparers will also be report users.
2.1 Report preparers
Report preparers are organisation that will choose to develop GPWAR for one or more of their water
entities. The AWAS defines a water entity as an entity, that:
a) Holds or transfers water;
b) Has inflows and/or outflows of water; or
c) Has rights or other direct or indirect claims to water.
As such, a water entity (geographic region, water system, organisation or individual) is a broad
concept that encompasses any entity that interacts with water. Not all water entities are also water
report entities. A water report entity is a water entity for which a GPWAR is produced.4 The level of
interest in each entity (based on its financial, social and/or environmental significance) will determine
if a GPWAR is produced. For example a State or Territory Government (a report preparer) managing
multiple water catchments may choose to produce a GPWAR for a large water catchment (water
report entity) but decided that it is not warranted for a must small and more isolated water catchment
(water entity).
It is anticipated that both government organisations and large business will identify an area or areas of
their operation that are water report entities. The motivating factors for voluntarily identifying a water
entity as a water report entity are likely to differ depending on the nature of the government
organisation or business involved. These factors are discussed in more detail in the following chapter.
It is anticipated that report preparers are likely to include:
State and Territory Governments through their role managing water catchments. The water
catchments would be considered the water report entities. As such, State and Territory
Governments may produce multiple GPWAR, as many as one for each of the jurisdiction’s
catchments;
Urban and rural water utilities as bulk water holders and through their role managing regulated
water systems. Where rural water utilities operate over larger spatial areas and defined irrigation
schemes, they are likely to produce more than one GPWAR, as many as one for each discrete
irrigation scheme or catchment area under their control;
Major water users as bulk water holders. Businesses in this category will include large mining
companies, large thermal electricity generators (greater than 100MWh) and large industrial users.
Based on the CDP Water Disclosure Global Report 2011 the types of industries that may choose
to produce a GPWAR are likely to include companies that manufacture chemicals, construction
materials, paper and forest products, containers and packaging. Box 2.1 below provides further
information on the breadth of global corporate interest in reporting water consumption and
managing water risk; and
4 A water report entity is defined in the AWAS as a water entity in respect of which it is reasonable to
expect the existence of users that depend on General Purpose Water Accounting Reports for
information about water, or rights or other claims to water, which shall be useful to them for making
and evaluating decisions about the allocation of resources.

Affected parties
Deloitte Access Economics: Effects analysis of AWAS adoption
4
Environmental water holders as holders of large volumes of water entitlements for environmental
purposes and through their role managing environmental watering activities.
Table 2.1 provides an estimate of the number of potential report preparers and water report entities.
The majority of potential report preparers are either urban and rural water utilities or major water
users.
Table 1: Number of potential report preparers and water report entities
Types of report preparers
Report preparers Number of report preparers
Total number of water report entities
State and Territory governments 8 88
Urban and rural water utilities
Urban water utilities 79a 79
Rural water utilities and major irrigation companies
13b 104
Subtotal 92 183
Major water users Mining companies 44c 44
Large thermal electricity generators (greater than 100MWh)
34 34
Major industrial users 9c 9
Subtotal 87 87
Environmental water rights holders 3 3
Total 90 361
Notes: (a) Based on the number of urban water utilities with 10,000 connections or greater. Source:
National Performance Report 2009-10: Urban water utilities. (b) Based on rural water service
providers represented in the National Performance Report 2009-10: rural water service providers. (c)
Based on the number of mining companies and industrial companies listed in the S&P/ASX 200 at
23/01/2012.
Box 2.1: Global corporate interest in reporting water consumption and managing water risk
A recent survey conducted with assistance from Deloitte on behalf of the Carbon Disclosure Project
assessed the level of awareness of the world’s largest companies to their water risk in 2011. In
particularly it reported that:
There is increasing emphasis by companies to understand and manage their water risk;
An increasing number of the world’s largest companies are disclosing water-related information;
The ability to measure and report water data is essential for better management of water
resources. 95% of survey respondents able to report on water usage in 2011 compared with only
86% in 2010 demonstrating an increased emphasis on the value of water reporting; and
Most Australian survey respondents are reporting actions to manage water resources in their
direct operations.
This survey demonstrates the appetite amongst large corporate entities to understand and account for
water usage as part of their operations. The following table provides a breakdown by industry sector
and by the capacity of survey respondents in 2010 to report water information. It demonstrates the
breadth of industries that are currently placing emphasis on developing the capacity to report at least
some level of water information.

Affected parties
Deloitte Access Economics: Effects analysis of AWAS adoption
5
Industry sector Provided figures for total water usage
Water usage figure broken down by geography etc.
Provided figure for recycling/ reuse
Chemicals 88% 88% 38%
Construction, infrastructure & real estate
100% 100% 33%
Food, beverage & tobacco 92% 58% 33%
Industrial & manufacturing 93% 64% 36%
Metals & mining 100% 86% 79%
Oil & gas 50% 42% 33%
Pharmaceuticals & biotechnology
100% 71% 50%
Retail, consumer discretionary & consumer staples
81% 63% 25%
Technology & communications 100% 69% 58%
Utilities 62% 23% 23%
Totals 86% 64% 42%
Sources: Carbon Disclosure Project (2011) CDP Water Disclosure Global Report 2011 and Carbon
Disclosure Project (2010) CDP Water Disclosure Global Report 2010.
2.1 Report users
There are likely to be many diverse users of GPWAR given the scarcity and importance of water to
the livelihoods of all Australians and the increased emphasis being placed on community consultation
and public participation in decisions about water resources. According to the WACF (p10) some of
the categories of users include:
Water users (environmental, agricultural, urban, industrial and commercial);
Investors in water-dependent enterprises and related parties, such as lenders, creditors, suppliers,
insurers and water traders and water brokers;
Government representatives and their advisors, including water-related economic, environmental
and social policy makers;
Water industry regulators;
Water managers, including environmental water managers and water service providers, that may
be interested in water entities other than themselves;
Groups and associations with water-related interests, for example environmental or recreational
groups;
Water industry consultants;
Academics; and
Interested citizens.
Although voluntary adoption of the ED AWAS 1 has already been initiated for several water report
entities; there are many other potential water report entities yet to adopt the AWAS. It is, therefore,
difficult to estimate the range or types of report users and how stakeholders will use the GPWAR from
different water report entities. The above list is indicative only. It is advisable that, as adoption of the
AWAS matures, studies be conducted to collect information on who is using GPWAR and how they
are being used.

Types of costs and benefits
Deloitte Access Economics: Effects analysis of AWAS adoption
6
3 Types of costs and benefits 3.1 Costs
Table 3.1 lists the cost categories that should be considered when identifying the costs to business of
the introduction of a new regulation. There are nine cost categories. While adoption of the AWAS is
voluntary and therefore not subject to regulatory requirements, this framework has been used to
consider the categories of costs for report preparers (both government and business) as it provides a
comprehensive approach.
Table 2: Business cost calculator cost categories
Compliance cost categories Examples
Notification: businesses face costs when they have to report certain events to a regulatory authority, either before or after the event has taken place.
A business needs to notify a public authority before they are permitted to sell food.
Education: businesses face costs when keeping up to date with regulatory requirements.
A business needs to get the details of new legislation and communicate the new requirements to staff.
Permission: businesses face costs when applying for and maintaining permission to conduct an activity.
A business needs to do a police check before employing staff legally.
Purchasing: businesses face costs when having to purchase a service (advice) or a product (materials or equipment) to comply with a regulation.
A business needs to get legal advice (service) or have a fire extinguisher onsite (product).
Record keeping: businesses face costs to keep statutory documents up to date.
A business needs to keep records of accidents that happen at their workplace.
Enforcement: businesses face costs when cooperating with audits, inspections and regulatory enforcement activities.
A business needs to supervise a government inspector when the inspector checks whether a business meets non-smoking laws.
Publication and documentation: businesses face costs when having to produce documents for third parties.
A business needs to display warning signs around dangerous equipment, or a sign at the entrance to home-based business premises.
Procedural: businesses face non-administrative costs imposed by some regulations.
A business needs to conduct a fire safety drill several times a year.
Other: any other compliance cost faced by business that doesn't fit into one of the above categories.
Source: Office of Best Practice Regulation (OBPR) 2012.
Based on consultations with the Bureau and the case studies conducted by the Bureau, we believe the
following types of costs will be borne by report preparers on behalf of water report entities where they
choose to adopt the AWAS.
Education: report preparers will need to provide training for staff, particularly for the preparation of
the first GPWAR, either internally or through an external provider, to ensure staff are aware of the
requirements for compiling a report. The number of staff requiring training will depend upon the size
of the organisation and the number of water report entities identified by the report preparer.
Purchasing: report preparers may need to acquire and maintain some additional software to support
the development of the GPWAR. It is not anticipated that this will constitute a major cost burden

Types of costs and benefits
Deloitte Access Economics: Effects analysis of AWAS adoption
7
above the current software costs incurred by businesses and government as part of business as usual
operating costs.
Assurance: AWAS requires that each GPWAR be subject to an independent assurance process.5
Publication and documentation: the cost of producing and publishing a GPWAR for each water
report entity for the report preparer. These costs will vary depending on the size and complexity of the
water report entity. For example the cost of publication and documentation associated with producing
a GPWAR for a major catchment such as the Murrumbidgee will be significantly greater than the cost
of producing a GPWAR in a relatively small irrigation company such as Harvey Water.
One of the purposes of the case studies conducted by the Bureau was to collect information on the
likely magnitude of the costs for the different categories of report preparers. The cost impact of
preparing a GPWAR is discussed in more detail in Chapter 4.
3.2 Benefits We have identified three key categories of benefits resulting from AWAS adoption.
1. Reduced reporting – where the current reporting burden of water report entities is reduced
through the AWAS replacing other reports (where information is duplicated);
2. Informed decision making – The availability of information that is contextual, consistent,
comparable and independently assured will result in improved confidence from report users and
enable better decision making to occur; and
3. Stewardship of a publicly owned natural resource – where it is demonstrated through a nationally
consistent standard that water is being managed and defined consistently across state borders.
The benefits of AWAS adoption for report preparers will differ from the benefits for report users,
except where a report preparer is also a report user. Understanding what the types of benefits are for
each group is important because the voluntary nature of the standard means that report preparers are
likely to choose to develop GPWAR for those water entities where the perceived benefits of doing so
are at least equivalent to the costs.
In the case of government or government-owned report preparers these perceived benefits may
include both benefits to the public as well as the entity itself. In the case of private report preparers
(e.g. private water trusts) it is likely that only private benefits will be considered.
The following discussion presents the benefits of AWAS adoption to report preparers and report users.
3.2.1 Report preparers
The benefits of developing GPWAR and the emphasis placed on those benefits by report preparers
will vary depending on the type of organisation. For example, mining companies may place more
emphasis on the benefits of improving investor confidence and managing reputational risk regarding
the impact of mining activities on water quality. Ultimately these benefits will transfer into such
things as lower cost of capital, higher sales or reduced compliance expenditure. State and Territory
Governments, on the other hand, may place greater emphasis on demonstrating stewardship of a
publically owned natural resource or informing their own policy decisions.
The level of benefit generated by developing GPWAR will in part be dependent on their popularity as
a reporting mechanism. If GPWAR are produced for most water report entities the impact of the
reports on stakeholder confidence and as part of improved decision making processes will be greater.
5 Given the voluntary nature of AWAS, ‘assurance’ has been used instead of ‘enforcement’ for this
category of costs.

Types of costs and benefits
Deloitte Access Economics: Effects analysis of AWAS adoption
8
Reduced reporting
GPWAR prepared in accordance with the AWAS have the potential to replace a wide range of
statutory reporting. Should this be the case, there is likely to be reduction in compliance costs and ad-
hoc requests for information from stakeholders of report preparers and water report entities.
From the survey of report preparers, roughly half of the survey respondents believed that it is possible
that GPWAR may replace reports but not necessarily reduce or eliminate reports. Some key factors
influencing the streamlining of reports include:
The extent of the focus on the context section, future prospects and sector reports;
The degree to which audiences are educated about the water accounting standards; and
The community’s acceptance of the report format.
It was also noted in the survey that Commonwealth agencies such as the Australian Bureau of
Statistics (ABS) and the Bureau would realise benefits from having data readily available in a
standardised format to produce current national reports such as the National Water Account. Other
Commonwealth agencies such as the National Water Commission (NWC) the Department of
Sustainability, Environment, Water, Population and Communities (DSEWPaC) and the Murray
Darling Basin Authority (MDBA) are also likely to benefit from the standardisation of information.
Case study respondents that did not believe that GPWAR would replace or eliminate current reports
cited the following key reasons:
Current reports are prepared in accordance with legislative and regulatory requirements;
There is not a straight duplication of information from current reports to a GPWAR; and
The purpose of current reporting differs from the purpose of a GPWAR.
It should be noted that some of the case study respondents have yet to develop a GPWAR and
therefore may not have a clear idea of what may be possible in terms of reducing duplication.
Informed decision making
Report preparers and their stakeholders are likely to value GPWAR because they make available
information that is independently assured and promotes investor confidence.
Independent assurance
The key benefit of independent assurance is that it provides confidence to report readers that data
being reported can be relied upon. Confidence in data is critical, particularly where information is
used for the purposes of business decision making and government policy and planning decisions.
Assured data is more reliable as assurance practitioners are required to express an opinion on the
veracity of the systems and processes that generated the data. These engagements highlight
inaccuracies and discrepancies in reported data and, depending on the assurance framework, can
ensure that erroneous or misleading data is minimised or eliminated entirely.
Assurance engagements are also free from bias and conflicts of interest. Before appointment,
assurance practitioners must demonstrate that they have no real or perceived conflict of interest in the
organisation being investigated so that impartiality can be shown in their judgement of the
organisation’s systems. In addition, the standards surrounding assurance practitioners in relation to
independence and audit quality controls are stringent; therefore the end user of reports can be
confident that there is strong accountability in place across the whole engagement.
Assurance engagements are also particularly valuable in the early stages of a new reporting
framework (such as the AWAS adoption), as they enable a critical review of systems and processes
and provide recommendations on improvements. Recommendations can include for example; system
replacement (for critical issues), better documentation of policies, practices and procedures for
generating reported data, steps to correct misalignment of interpretation of definition, and
improvement of training regimes (such as frequency and content). As assurance practitioners are privy

Types of costs and benefits
Deloitte Access Economics: Effects analysis of AWAS adoption
9
to the systems and processes of many different organisations they are able to provide
recommendations that are industry best practice.
Lastly, assurance practitioners are able to ensure consistency of interpretation of definitions and
standards across multiple organisations, so that data is comparable through time and across
organisations.
Investor confidence
GPWAR prepared in accordance with the AWAS will enable report preparers to provide a stronger
financial representation of their water resource. This leads to a greater knowledge and confidence
regarding investments that require water resources and enable more informed business decisions in
areas that rely on water resources. In addition case study responses suggest that some entitlement
holders presently use their water entitlements as collateral for bank loans. GPWAR could support the
reliability of the claim to water.
This link between improved water reporting and investor confidence was highlighted by a report at the
2nd International Conference on Corporate Governance by Ahulu et. al. which considered the
relationship between increasing disclosure of environmental information and company profitability for
environmentally sensitive industries. The analysis found that there were significant positive
association between increases in disclosures for water and assets and profitability (Ahulu et. al. 2010).
The report also highlighted the importance of stakeholder and community management through water
information disclosure for environmentally sensitive industries. This position is supported by the
Minerals Council of Australia, which has been undertaking work concurrent to the WASB developing
a water accounting framework for the mining industry. The Minerals Council’s business case for
water accounting standards notes the importance of promoting the industry as a responsible user of
water and educating surrounding water users about a mining operation’s water use.
The value of managing reputational risks for individual companies and for industries as a whole is
significant. A recent report by the World Resources Institute noted that major mining-related impacts
on water resource have damaged companies’ reputations, disrupting operations and losing access to
further reserves. The reputational risk may also extend beyond a single company. For example there is
currently considerable concern in Queensland and New South Wales regarding the impact of coal
seam gas mining activities on water quality and to a lesser extent water availability.
Some respondents to the case study noted that in the early days of the AWAS adoption, the benefit of
improved investor confidence was unlikely to increase above what it currently is, but that this would
increase slowly over time. This relates to stakeholders becoming familiar with the content and
structure of the reports.
Stewardship of a natural resource
By preparing water GPWAR, report preparers can demonstrate that their water report entities satisfy
stewardship obligations for managing a public good. Producing GPWAR is likely to result in
increased transparency of how much water is used, the way it is used and from what sources by the
participants of the Australian water industry.
Transparency in reporting for managing public resource is essential. Whilst the water industry
discloses information in various forms, a uniform approach to water accounting will make
demonstration of transparency across report preparers much easier. Several survey respondents also
noted that transparency translates into improved stakeholder confidence.
3.2.2 Report users
The benefits of GPWAR being developed for report users are heavily centred on the provision of more
accessible information.
Informed decision making
GPWAR prepared in accordance with the AWAS will provide report users with information that is
available, contextual, consistent and comparable.

Types of costs and benefits
Deloitte Access Economics: Effects analysis of AWAS adoption
10
Availability of information
It is anticipated that the various GPWAR will be publicly available at one location. Much time and
effort is currently expended by potential report users compiling water information that is either in
different locations or difficult to obtain. Several survey respondents noted that having information in
the one place will reduce time in collation of information.
In addition, the publication of GPWAR will enable parties that currently cannot command information
about water the ability to access the information. This is likely to lead to greater quality of public
understanding and therefore consultation, particularly around water resource planning. As mentioned
by survey respondents, GPWAR will enable water resource planning decisions to be made based on
robust records of water storages, water availability and water ownership. More effective community
consultation is generally held to improve public confidence and deliver more cooperative and
effective management of water resources. With greater and better informed public participation in the
water resources planning processes, the resulting plan should have a greater public acceptance. The
increase in knowledge should translate into realistic and achievable expectations of performance by
the public.
Context
The ED AWAS 1 proposes that a contextual statement is provided for every GPWAR that is prepared.
A contextual statement will enable report users to understand the physical and administrative aspects
of the water report entity including conditions that may affect the entity’s water assets and water
liabilities.
Contextual statements are sometimes not included in public reports, particularly those that provide
consolidated information of water resources. Several survey respondents mentioned that while much
data is currently available the story behind the data is not.
Although not all contextual information provided in the individual GPWAR can be presented in the
national water account summary, the requirement for all GPWAR to have a contextual statement
means that, at any point, if detail behind the summary is needed then the context is available. Context
is critical in decision making as decisions inevitably involve interpreting and applying particular
information to a particular circumstance.
Consistency and comparability
The intention is that GPWAR will be prepared using consistent terminology and definitions and on a
consistent basis through time. This enables the various GPWAR to be compared at a point in time and
across time. Currently many reports are subtly different in the information they are reporting, and this
can result in misinterpretations and misuse of information. Comparability allows report users to
compare water report entities through time, against the competition, the market or against similar
businesses in terms of water availability.
All survey respondents in the user survey and many of the respondents in the preparer survey
mentioned the increased usefulness that information comparability brings to the data in terms of
decision making. It has the potential to highlight areas for water efficiency and enable water outcomes
to be compared across jurisdictions.
The Commonwealth Government will also benefit greatly from being able to gather water data from
different jurisdictions in the same format.
It is noted however, that comparisons are enhanced through time with the benefit of historical data and
trends, and therefore the comparability benefit will increase over time.
Stewardship of a natural resource
The GPWAR will give report users a clear representation of the water used for social and cultural
purposes. It is likely also to provide government a clear resource for identification of cultural and
social water requirements and provide greater confidence that environmental benefits would be
delivered through better understanding of activities. All organisations that participated in the report

Types of costs and benefits
Deloitte Access Economics: Effects analysis of AWAS adoption
11
user case studies said that disclosure of water used for social and cultural, environmental and
economic purposes would be beneficial to their organisation.
All organisations that participated in the report user case studies also reported that improved
transparency, particularly regarding volumetric water information across Australia, would be
beneficial to their organisation.

Impact of AWAS adoption
Deloitte Access Economics: Effects analysis of AWAS adoption
12
4 Impact of AWAS adoption
To estimate the impacts of AWAS adoption, a case studies were conducted by the Bureau (see
Appendix A for the case study templates) for a range of potential report preparers and users.
Case study participants were asked to estimate the cost impacts for their organisation based on the
four categories of costs identified in the previous chapter. Case study participants, both report users
and report preparers were also asked to estimate the level of benefit generated by the GPWAR.
However, respondents struggled to provide a quantitative measure of the benefits. As noted
previously, it is reasonable to assume that because AWAS is voluntary, report preparers will only
develop GPWAR for water report entities where the benefits are at least equivalent to the costs. Once
the value of AWAS adoption to report users is also accounted for the total benefits of the AWAS are
anticipated to outweigh the costs.
The following provides an estimation of the costs to report preparers of developing GPWAR for
various water report entities, where it has been possible to present the costs for that particular type of
water report entity, and a qualitative discussion of the benefits.
The costs in this chapter are based on the information collected by the Bureau from case study
participants. Where information gaps or significant inconsistencies arose we have supplemented this
information with additional research and, where necessary, assumptions based on our previous
experience. No attempt has been made to standardise the reported impacts across the different water
report entities or report prepares. For more information on the estimates and assumptions that have
been used to develop these costs refer to Appendix B.
4.1 State and Territory Governments
4.1.1 Water report entity: a water catchment
Estimated costs
On average State and Territory Governments that participated in the case studies estimated that
compiling a GPWAR for a water catchment would cost $54,000 in the first year. As a result of
efficiency gains the cost is anticipated to drop to $42,000 by the fourth year. No further efficiency
gains are anticipated beyond year four. These costs are based on the estimates and assumptions
summarised in Table 4.1.
Table 3: Estimated cost of preparing a GPWAR for a major water catchment by a State or
Territory Government agency
Cost category Estimates and assumptions
Education Two days training for three employees in the first year and one day of training for three employees per year thereafter.
Purchasing Every three years participating report preparers will incur $30,000 worth of expenses for incidentals such as software. Where report preparers develop multiple GPWAR efficiencies of scale are anticipated. Therefore, this is considered an upper-bound estimate.
Assurance It will cost $10,000 per assurance engagement. Where report preparers develop multiple GPWAR efficiencies of scale are anticipated. Therefore, this is considered an upper-bound estimate.
6
6 Independent assurance of a GPWAR is likely to be undertaken as a component of a larger audit
process, rather than as a standalone engagement. As such the cost of undertaking the assurance

Impact of AWAS adoption
Deloitte Access Economics: Effects analysis of AWAS adoption
13
Cost category Estimates and assumptions
Publication and documentation
It will take 387 hours per GPWAR in the first year. Familiarity with the process of producing the reports will result in time efficiencies of 20 per cent in the second year, 10 per cent in the third year and five per cent in the fourth year.
Note: The hourly rate applied for salaried costs, including on-costs and overheads, was $79 per employee.
Figure 4.1 illustrates the impact of the different cost categories on the total average cost of preparing a
GPWAR for a water catchment managed by a State or Territory Government. It also demonstrates
how efficiency gains impact on the costs in the first four years. The total net present value costs of
preparing a GPWAR for a water catchment is estimated to be $309,000 applying a 7% discount rate
over ten years
Figure 4.1: Estimated cost of developing a GPWAR for a water catchment
Benefits
Where a State or Territory Government chooses to develop a GPWAR for a water catchment on
average the value of the perceived benefits generated for the community will be equivalent to or
greater than the cost of producing the GPWAR. These benefits are likely to be dominated by the value
of demonstrating appropriate stewardship of a publically owned natural resource. Being more
transparent about how water is being managed State and Territory Governments will build credibility
with community stakeholders. This is likely to result in greater community understanding and support
for water management decisions.
In addition there will be benefits to report users through the provision of more accessible information.
This will also benefit State and Territory agencies because they will no longer have to respond to as
many ad hoc requests for data which is expensive and time consuming.
4.2 Urban and rural water utilities
4.2.1 Water report entity: an urban water system
Estimated costs
On average urban water utilities that participated in the case studies estimated that compiling a
GPWAR for a water catchment would cost $32,000 in the first year. As a result of efficiency gains the
engagement represents the incremental increase in the cost of an existing audit and assurance
engagement.
$0
$10,000
$20,000
$30,000
$40,000
$50,000
$60,000
1 2 3 4 5 6 7 8 9 10
Co
st
per
wate
r catc
hm
en
t
Year
Education Purchasing Assurance Publication and documentation

Impact of AWAS adoption
Deloitte Access Economics: Effects analysis of AWAS adoption
14
cost is anticipated to drop to $25,000 by the fourth year. No further efficiency gains are anticipated
beyond year four. These costs are based on the estimates and assumptions summarised in Table 4.2.
Table 4: Estimated cost of preparing a GPWAR for an urban water system
Cost category Estimates and assumptions
Education Two days training for an employee in the first year and four hours of training for an employee per year thereafter.
Purchasing Every three years participating report preparers will incur $10,000 worth of expenses for incidentals such as software.
Assurance It will cost $10,000 per assurance engagement.7
Publication and documentation
It will take 240 hours per GPWAR in the first year. Familiarity with the process of producing the reports will result in time efficiencies of 20 per cent in the second year, 10 per cent in the third year and five per cent in the fourth year.
Note: The hourly rate applied for salaried costs, including on-costs and overheads, was $74 per employee.
Figure 4.2 illustrates the impact of the different cost categories on the total average cost of preparing a
GPWAR for an urban water system. It also demonstrates how efficiency gains impact on the costs in
the first four years. The total net present value costs of preparing a GPWAR for an urban water system
is estimated to be $186,000 applying a 7% discount rate over ten years
Figure 4.2: Estimated cost of developing a GPWAR for an urban water system
Benefits
Where an urban water utility chooses to develop a GPWAR for a urban water system on average the
value of the benefits generated for the utility are likely to be equivalent to or greater than the cost of
producing the GPWAR. These benefits are likely to be generated by demonstration of stewardship of
an important natural resource. Being more transparent about the management of water resources will
provide the community with assurance about value for money and provide a basis for water price rises
and differential water prices. This is currently of particular importance because urban customers have
seen significant increases in the cost of water in the last decade and this trend is likely to continue.
7 Independent assurance of a GPWAR is likely to be undertaken as a component of a larger audit
process, rather than as a standalone engagement. As such the cost of undertaking the assurance
engagement represents the incremental increase in the cost of an existing audit and assurance
engagement.
$0
$5,000
$10,000
$15,000
$20,000
$25,000
$30,000
$35,000
1 2 3 4 5 6 7 8 9 10
Co
st
per
urb
an
wate
r syste
m
Year
Education Purchasing Assurance Publication and documentation

Impact of AWAS adoption
Deloitte Access Economics: Effects analysis of AWAS adoption
15
In addition there will be benefits to report users through the provision of more accessible information.
This will also benefit urban water utilities because they will no longer have to respond to as many ad
hoc requests for data which is expensive and time consuming.
4.2.2 Water report entity: an irrigation company
Estimated costs
On average irrigation companies that participated in the case studies estimated that compiling a
GPWAR for an irrigation company would cost $13,000 per year. These costs are based on the
estimates and assumptions summarised in Table 4.3. When case study responses were reviewed it was
found that there was relatively little difference in the estimated cost of developing a GPWAR for a
large irrigation company in comparison with a small irrigation company.
Table 5: Estimated cost of preparing a GPWAR for an irrigation company
Cost category Estimates and assumptions
Education One day of training for an employee in the first year.
Purchasing Nil.
Assurance It will cost $10,000 per assurance engagement.8
Publication and documentation
It will take 38 hours per GPWAR. No efficiencies were identified for by case study participants for subsequent years.
Note: The hourly rate applied for salaried costs, including on-costs and overheads, was $74 per employee.
The total net present value costs of preparing a GPWAR for an irrigation company is estimated to be
$91,000 applying a 7% discount rate over ten years. The cost of producing a GPWAR for an irrigation
company is likely to be dominated by the cost of the independent assurance engagement (representing
78% of the total annual cost).
Benefits
Where an irrigation company chooses to develop a GPWAR on average the value of the benefits
generated for the irrigation company are likely to be equivalent to or greater than the cost of
producing the GPWAR. These benefits are likely to be dominated by the value of providing
independent assurance and improved investor confidence. Through the development of a GPWAR
irrigators will be able to demonstrate capacity as water managers and to sustainably support new
irrigation. This may assist in attracting new investment in their district and reduce the cost of capital
for the irrigation company.
In addition there will be benefits to report users through the provision of more accessible information.
This will also benefit the irrigation companies as they will no longer have to respond to as many ad
hoc requests for data. We are aware that this has become an increasingly burdensome aspect of doing
business for irrigation companies.
4.3 Environmental water rights holders
Estimated costs
On average, environmental water rights holders that participated in the case studies estimated that
compiling a GPWAR would cost $67,000 in the first year. As a result of efficiency gains the cost is
anticipated to drop to $57,000 by the fourth year. No further efficiency gains are anticipated beyond
year four. These costs are based on the estimates and assumptions summarised in Table 4.4.
8 Independent assurance of a GPWAR is likely to be undertaken as a component of a larger audit
process, rather than as a standalone engagement. As such the cost of undertaking the assurance
engagement represents the incremental increase in the cost of an existing audit and assurance
engagement.

Impact of AWAS adoption
Deloitte Access Economics: Effects analysis of AWAS adoption
16
Table 6: Estimated cost of preparing a GPWAR for an environmental water rights holder
Cost category Estimates and assumptions
Education Two days training for an employee in the first year and four hours of training for an employee per year thereafter.
Purchasing Every three years participating report preparers will incur $10,000 worth of expenses for incidentals such as software.
Assurance It will cost $35,000 per assurance engagement.9
Publication and documentation
It will take 376 hours per GPWAR in the first year. Familiarity with the process of producing the reports will result in time efficiencies of 20 per cent in the second year, 10 per cent in the third year and five per cent in the fourth year.
Note: The hourly rate applied for salaried costs, including on-costs and overheads, was $74 per employee.
Figure 4.3 illustrates the impact of the different cost categories on the total average cost of preparing a
GPWAR for an environmental water rights holder. It also demonstrates how efficiency gains impact
on the costs in the first four years. The overall impact of efficiency gains is less for this group given
the assurance costs estimated by case study participants. The total net present value costs of preparing
a GPWAR for an environmental water rights holder is estimated to be $413,000 applying a 7%
discount rate over ten years
Figure 4.3: Estimated cost of developing a GPWAR for an environmental water rights holder
Benefits
Where an environmental water rights holder chooses to develop a GPWAR the value of the benefits
generated are likely to be equivalent to or greater than the cost of producing the GPWAR. These
benefits are likely to be generated by demonstration of stewardship of an important natural resource.
Environmental water rights holders are becoming significant water market participants. The
emergence of these new market participants has generated some uncertainty and suspicion concerning
the impact of this new activity on the marketplace. There is also some scepticism regarding the
capacity of environmental water rights holders to deliver efficient environmental watering outcomes.
Through the development of GPWAR environmental water rights holders may be able to allay
community concerns and build understanding and support for environmental water management
decisions.
9 The estimated costs reported by case study participants for the independent assurance for
environmental water rights holder is significantly larger than for the other types of report preparers.
This is likely to be reflection of the small population of report preparers and the relatively immaturity
of the regulatory framework impacting on this group.
$0
$10,000
$20,000
$30,000
$40,000
$50,000
$60,000
$70,000
$80,000
1 2 3 4 5 6 7 8 9 10
Co
st
per
en
vir
on
men
tal
wate
r ri
gh
ts h
old
er
Year
Education Purchasing Assurance Publication and documentation

Impact of AWAS adoption
Deloitte Access Economics: Effects analysis of AWAS adoption
17
In addition there will be benefits to report users particularly with respect to a greater level of
confidence that environmental benefits would be delivered through better understanding of activities.
4.4 Major water users
Unfortunately, the information available meant that it was not possible to break down the major water
users into the different types of water report entities. As noted earlier, major water users are likely to
include large mining companies, large thermal electricity generators (greater than 100MWh) and large
industrial users (companies that manufacture chemicals, construction materials, paper and forest
products, containers and packaging). The volume of water used, sources of water available and size
of operations will vary considerably. Given the necessity to aggregate these disparate groups for this
analysis, the following cost estimates should be taken as indicative only.
Estimated costs
On average, major water users that participated in the case studies estimated that compiling a GPWAR
would cost $28,000 in the first year. As a result of efficiency gains the cost is anticipated to drop to
$22,000 by the fourth year. No further efficiency gains are anticipated beyond year four. These costs
are based on the estimates and assumptions summarised in Table 4.5.
Table 7: Estimated cost of preparing a GPWAR for a major water user
Cost category Estimates and assumptions
Education Two days training for an employee in the first year and four hours of training for an employee per year thereafter.
Purchasing Every three years participating report preparers will incur $10,000 worth of expenses for incidentals such as software.
Assurance It will cost $10,000 per assurance engagement.10
Publication and documentation
It will take 181 hours per GPWAR in the first year. Familiarity with the process of producing the reports will result in time efficiencies of 20 per cent in the second year, 10 per cent in the third year and five per cent in the fourth year.
Note: The hourly rate applied for salaried costs, including on-costs and overheads, was $74 per employee.
Figure 4.4 illustrates the impact of the different cost categories on the total average cost of preparing a
GPWAR for major water user. It also demonstrates how efficiency gains impact on the costs in the
first four years. The total net present value costs of preparing a GPWAR for a major water user is
estimated to be $164,000 applying a 7% discount rate over ten years
10 Independent assurance of a GPWAR is likely to be undertaken as a component of a larger audit
process, rather than as a standalone engagement. As such the cost of undertaking the assurance
engagement represents the incremental increase in the cost of an existing audit and assurance
engagement.

Impact of AWAS adoption
Deloitte Access Economics: Effects analysis of AWAS adoption
18
Figure 4.4: Cost of developing a GPWAR for a major water user
Benefits
Where a major water user chooses to develop a GPWAR the value of the benefits generated are likely
to be equivalent to or greater than the cost of producing the GPWAR. These benefits are likely to be
generated by improved investor confidence and the provision of independently assured information.
Through the development of a GPWAR major water users will be able to demonstrate their credentials
as a responsible water user and to sustainably support current activity and growth from a water
availability perspective. This may attract new investment or support the capacity of the report preparer
expand their market to specific interest groups and thus reduce their cost of capital.
In addition there will be benefits to report users particularly with respect to transparency and
comparability of performance – particularly for regulators.
4.5 Summary
The estimated cost of generating a GPWAR ranges widely depending on the type of water report
entity and the complexity of their operations. Figure 4.5 illustrates the estimated range of costs
different report preparers will incur, with the individual ranges representing the difference in the
anticipated costs between the first and fourth years of production.
Figure 4.5: Range of estimated costs to produce a GPWAR by water report entity
$0
$5,000
$10,000
$15,000
$20,000
$25,000
$30,000
1 2 3 4 5 6 7 8 9 10
Co
st
per
majo
r w
ate
r u
ser
Year
Education Purchasing Assurance Publication and documentation
$0
$10,000
$20,000
$30,000
$40,000
$50,000
$60,000
$70,000
$80,000
Water catchments Urban water systems
Irrigation companies
Environmental water rights
holders
Major water users
Co
st
to p
rod
uce a
GP
WA
R
Cumulative impact
Deloitte Access Economics: Effects analysis of AWAS adoption
19
5 Cumulative impact 5.1 Estimated costs
Based on the cost information described in Chapters 3 and 4 the estimated cost to Australia from the
introduction of AWAS over the next 10 years, at a 7% discount rate, is $49 million if it is assumed
that:
A GPWAR is produced for each water report entity identified in Table 2.1;
It takes four years to achieve a 100% take up rate (25% in year 1, 50% in year 2, 75% in year 3
and 100% in year 4);
Economies of scale are achieved reducing the cost of the independent assurance where multiple
GPWAR are produced by the one reporting entity (report 1: $10,000, reports 2-5: $5,000 each,
reports 6+ $2,000 each); and
The cost of maintaining the AWAS is $255,000 per year.
For other assumptions and estimates used to generate the cumulative impact refer to Chapter 4 and
Appendix B.
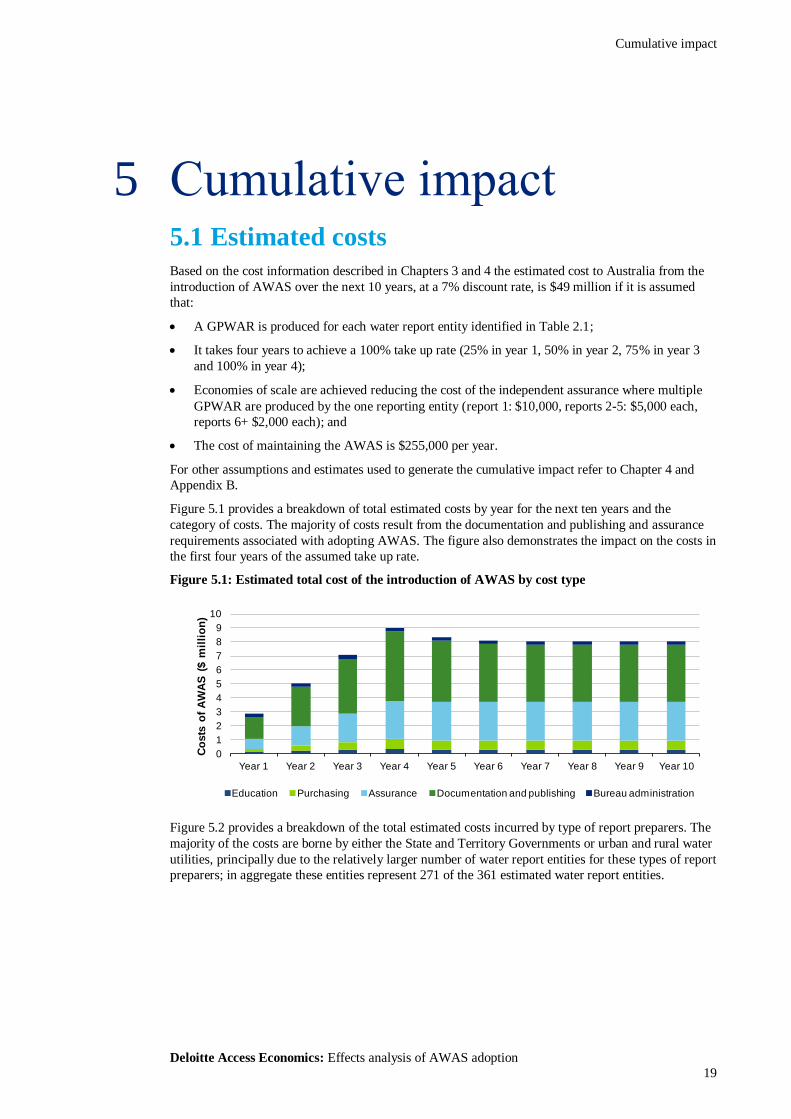
Figure 5.1 provides a breakdown of total estimated costs by year for the next ten years and the
category of costs. The majority of costs result from the documentation and publishing and assurance
requirements associated with adopting AWAS. The figure also demonstrates the impact on the costs in
the first four years of the assumed take up rate.
Figure 5.1: Estimated total cost of the introduction of AWAS by cost type
Figure 5.2 provides a breakdown of the total estimated costs incurred by type of report preparers. The
majority of the costs are borne by either the State and Territory Governments or urban and rural water
utilities, principally due to the relatively larger number of water report entities for these types of report
preparers; in aggregate these entities represent 271 of the 361 estimated water report entities.
0
1
2
3
4
5
6
7
8
9
10
Year 1 Year 2 Year 3 Year 4 Year 5 Year 6 Year 7 Year 8 Year 9 Year 10
Co
sts
of
AW
AS
($ m
illi
on
)
Education Purchasing Assurance Documentation and publishing Bureau administration

Cumulative impact
Deloitte Access Economics: Effects analysis of AWAS adoption
20
Figure 5.2: Estimated total cost of the introduction of AWAS by type of report preparer
5.2 Breakeven analysis
The analysis presented in this section is in the form of a break-even analysis. So far in this report we
have been able to quantify costs of AWAS adoption but only provided a qualitative description of the
benefits. Once the AWAS has been adopted by a critical mass of organisations, it may be possible to
analyse and quantify benefits of the AWAS. This would be the subject of a further study.
A break even analysis identifies the level of benefits (in dollar terms) that would be required to cover
the total costs of the proposal, or make the proposal ‘cost neutral’. It is important however to note in
this analysis that the break-even target is not:
The expected total benefit of the AWAS; or
The target benefit for government to be satisfied that the AWAS is a ‘success’.
The objective is simply to identify the amount needed to cover costs if report preparers chose to
develop GPWAR for each of the potential water report entities identified in Table 2.1. The analysis
does not suggest whether this level of voluntary adoption of the AWAS is likely or reasonable.
As discussed in Chapter 3, some of the key benefits of AWAS adoption may be:
Reduced reporting requirements resulting from a reduction or elimination of other reports where
information is duplicated;
Increased investor confidence resulting from improved management of reputational risk and
enhanced communication with stakeholders;
Availability of nationally comparable water information; and
Satisfying stewardship obligations.
Figure 5.3 below shows one scenario of a trajectory of benefits (above the line) against the costs
(below the line) over 10 years.
0
2
4
6
8
10
Year 1 Year 2 Year 3 Year 4 Year 5 Year 6 Year 7 Year 8 Year 9 Year 10
Co
st
of
AW
AS
($ m
illi
on
)
State and Territory Governments Water utilties Water users Environmental water rights holders Bureau
Cumulative impact
Deloitte Access Economics: Effects analysis of AWAS adoption
21
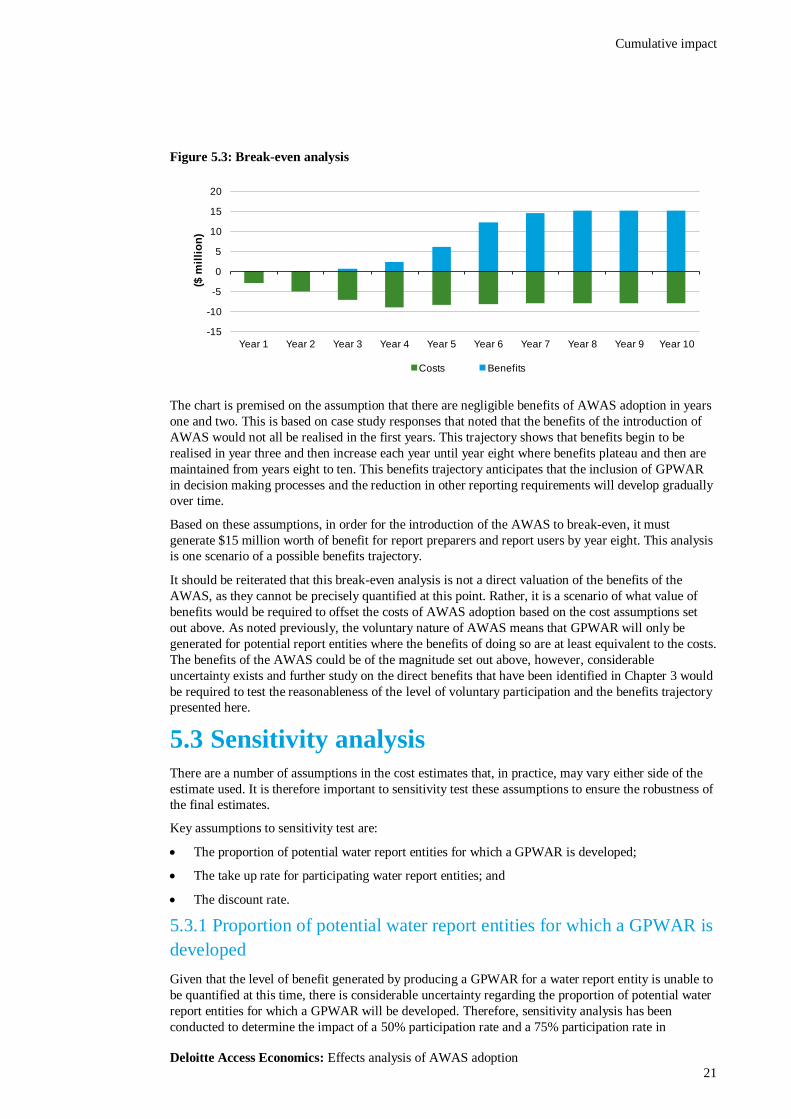
Figure 5.3: Break-even analysis
The chart is premised on the assumption that there are negligible benefits of AWAS adoption in years
one and two. This is based on case study responses that noted that the benefits of the introduction of
AWAS would not all be realised in the first years. This trajectory shows that benefits begin to be
realised in year three and then increase each year until year eight where benefits plateau and then are
maintained from years eight to ten. This benefits trajectory anticipates that the inclusion of GPWAR
in decision making processes and the reduction in other reporting requirements will develop gradually
over time.
Based on these assumptions, in order for the introduction of the AWAS to break-even, it must
generate $15 million worth of benefit for report preparers and report users by year eight. This analysis
is one scenario of a possible benefits trajectory.
It should be reiterated that this break-even analysis is not a direct valuation of the benefits of the
AWAS, as they cannot be precisely quantified at this point. Rather, it is a scenario of what value of
benefits would be required to offset the costs of AWAS adoption based on the cost assumptions set
out above. As noted previously, the voluntary nature of AWAS means that GPWAR will only be
generated for potential report entities where the benefits of doing so are at least equivalent to the costs.
The benefits of the AWAS could be of the magnitude set out above, however, considerable
uncertainty exists and further study on the direct benefits that have been identified in Chapter 3 would
be required to test the reasonableness of the level of voluntary participation and the benefits trajectory
presented here.
5.3 Sensitivity analysis
There are a number of assumptions in the cost estimates that, in practice, may vary either side of the
estimate used. It is therefore important to sensitivity test these assumptions to ensure the robustness of
the final estimates.
Key assumptions to sensitivity test are:
The proportion of potential water report entities for which a GPWAR is developed;
The take up rate for participating water report entities; and
The discount rate.
5.3.1 Proportion of potential water report entities for which a GPWAR is
developed
Given that the level of benefit generated by producing a GPWAR for a water report entity is unable to
be quantified at this time, there is considerable uncertainty regarding the proportion of potential water
report entities for which a GPWAR will be developed. Therefore, sensitivity analysis has been
conducted to determine the impact of a 50% participation rate and a 75% participation rate in
-15
-10
-5
0
5
10
15
20
Year 1 Year 2 Year 3 Year 4 Year 5 Year 6 Year 7 Year 8 Year 9 Year 10
($ m
illi
on
)
Costs Benefits

Cumulative impact
Deloitte Access Economics: Effects analysis of AWAS adoption
22
comparison with the 100% participation rate assumed above. The sensitivity of the results to the
number of participating water report entities is provided in Table 5.1.
Table 8: Impact on the costs and breakeven point of varying the participation rate
50% participation 75% participation 100% participation
Cost of AWAS $25.3 million $37.2 million $49.0 million
Annual benefit required to break even
$7.9 million $11.6 million $15.3 million
5.3.2 Take up rate for participating water report entities
Due to the lack of available data, there is considerable uncertainty regarding the rate at which
participating water report entities take up the AWAS. Therefore, sensitivity analysis has been
conducted to determine the impact of a three year linear take up rate and a five year linear take up rate
in comparison with the four year linear take up rate assumed above. The sensitivity of the results to
the take up rate is provided in Table 5.2.
Table 9: Impact on the costs and breakeven point of alternative take up rates
3 year take up rate 4 year take up rate 5 year take up rate
Cost of AWAS $52.4 million $49.0 million $45.7 million
Annual benefit required to break even
$16.4 million $15.3 million $14.3 million
5.3.3 Discount rates
Given that there is uncertainty regarding the alternative uses of capital and the returns from that
capital the OBPR requires an annual real discount rate of 7%. In addition to the 7% ‘central’ discount
rate, the net present values should also be calculated with real discount rates of 3% and 10%. The
sensitivity to the results of the discount rate is provided in Table 5.3.
Table 10: Impact on the costs and breakeven point of varying the discount rate
3% 7% 10%
Cost of AWAS $60.7 million $49.0 million $42.2 million
Annual benefit required to break even
$14.2 million $15.3 million $16.2 million
5.4 Next steps
As demonstrated by this analysis, there is still considerable uncertainty around the magnitude of the
costs and benefits associated with the introduction of the AWAS. As part of the further development
of a comprehensive Cost Benefit Analysis for AWAS adoption we recommend the following:
A willingness-to-pay study for water information in Australia be conducted – to collect
information on the population of report users and to more accurately estimate the value of
GPWAR to report users; and
That voluntary completion of GPWAR be actively promoted and supported – to ensure the
development of reliable data regarding the costs and benefits of AWAS adoption.
These steps should enable a more rigorous understanding of the costs and benefits in the coming years
to be developed.

Deloitte Access Economics: Effects analysis of AWAS adoption
23
Appendix A Case study template for report preparers
Costs
Current reporting burden
1. In order to assess the impact of the adoption of GPWAR, it is important to understand your
organisation’s current water accounting reporting requirements. Please provide information on all
reports that your organisation currently produces for water accounting purposes in the table
below. The first line of the table has been used to provide an example of how to fill in the table.
Report Name Mandatory/
Voluntary
External/
Internal
Users Number of
hours spent
on reporting
1
2
3
4
5
6
7
2. What is the approximate hourly rate (including salary, on-costs and overheads) of the person or
persons responsible for the reporting in your organisation?
3. Please provide an estimate of other costs incurred by your organisation as a result of your current
reporting requirements? Additional costs might include paying for external advice or purchasing
and maintaining computer hardware and software for data collection.
Cost category Once-off/Recurring Cost*
External advice
Independent assurance
and auditing
Training
Computer hardware
Maintenance of
computer hardware
Computer software
Other (please specify)

Deloitte Access Economics: Effects analysis of AWAS adoption
24
*Where costs are recurring report the estimated annual cost.
4. Is there duplication in your current reporting requirements, i.e. are you reporting the same, or very
similar information to multiple parties?
YES / NO
If the answer to the above question is yes, please identify where (which reports and what information)
is currently subject to duplicate reporting requirements.
Report
numbers*
Duplicate information
*Numbers assigned to the reports in the table above.
Change in reporting burden anticipated under the ED AWAS 1
5. Please describe the level of involvement has your organisation had in the development of the ED
AWAS 1.
6. How would you rate your understanding of the ED AWAS 1? 1(never thought about it) –
5(expert).
1 2 3 4 5
7. How many GPWAR do you anticipate your organisation might produce? Will the number of
reports change over the next ten years? If so, how?
8. What information would your organisation be required to collect to produce a GPWAR that is not
currently being collected?

Deloitte Access Economics: Effects analysis of AWAS adoption
25
9. What information would your organisation be required to report in a GPWAR that is not currently
being reported?
10. How much time do you anticipate would your organisation be required to devote to developing a
GPWAR?
11. What time efficiencies through learning and repetition will be generated as a result of producing
multiple GPWAR either within a given year or over multiple years?
12. Would a GPWAR result in duplication/additional duplication in your reporting requirements?
YES / NO
If the answer to the above question is yes, please identify where (which reports and what information)
duplicate reporting requirements would occur.
Report
numbers*
Duplicate information
*Numbers assigned to the reports in the table above.
Other costs
13. What other costs do you anticipate your organisation would incur to produce a GPWAR/ or
GPWAR?
Cost category Once-off/Recurring Cost*
External advice
Independent assurance
Training
Computer hardware
Maintenance of computer
hardware

Deloitte Access Economics: Effects analysis of AWAS adoption
26
Computer software
Other (please specify)
*Where costs are recurring report the estimated annual cost.
14. Would your total additional reporting burden necessitate hiring another staff member? If so, what
would be the cost of recruitment for your organisation?
Benefits
Reporting efficiencies
15. If your organisation was to state developing GPWAR or multiple GPWAR, would there be any
immediate elimination of other reports due to duplication of information? If so, which reports?
16. If your organisation was to start completing GPWAR, would there be an elimination of other
reports in the future after this type of reporting became more common and was supported more
broadly? If so, which reports?
17. Where could the GPWAR format be changed to lead to a decrease in reporting at your
organisation (i.e. addition of information X could lead to elimination of report Y)?
Potential for ED AWAS 1 to improve investor confidence
18. How would your organisation benefit from improved confidence by potential investors in the
water sector?
19. Do you think the adoption of ED AWAS 1 will improve investor confidence?
YES / NO
If so, by how much? (e.g. increase in investment over 12 months) If not, why not?

Deloitte Access Economics: Effects analysis of AWAS adoption
27
Impact of improved public availability of information
20. Do you think ED AWAS 1 will improve public availability of information? If so, how?
21. How would your organisation benefit from improved public availability of information?
22. How would other organisation, community groups or government agencies that benefit from
improved public availability of information?

Deloitte Access Economics: Effects analysis of AWAS adoption
28
Case study template for report users
1. What water information does your organisation currently use?
2. How does your organisation currently obtain information in regards water for decision making?
3. What additional water information would your organisation like to have ready access to?
4. What changes to the way water information is presented would benefit your organisation?
5. If all water organisations were generating standardised reports in line with ED AWAS 1, how
would this benefit your organisation? Would the availability of consistent and comparable
national water information result in any time efficiencies for your organisation? If so, please
provide approximate hourly rate (including salary, on-costs and overheads).
6. Similarly, if all water organisations were generating standardised reports in line with ED AWAS
1, do you anticipate any negative impacts?
7. How would greater transparency of volumetric water information across Australia benefit your
organisation?

Deloitte Access Economics: Effects analysis of AWAS adoption
29
8. How would the disclosure of water used for social and cultural, environmental and/or economic
purposes be beneficial to your organisation?
9. Would you see any additional costs to your organisation in receiving and understanding the
information in a report prepared in compliance to the ED AWAS 1? Please indicate if these costs
are one off costs in training or would be ongoing.
10. How would you rate your understanding of the ED AWAS 1? 1(never thought about it) –
5(expert).
1 2 3 4 5

Deloitte Access Economics: Effects analysis of AWAS adoption
30
Appendix B Estimates and assumptions
Description
Case study question
Type of report preparer
Number (Year 1)
Number (Years 2-10) Basis
Costs to administer BoM
Bureau of Meteorology $255,000 $255,000
This is calculated from a figure of $255,000 per year and is on the basis the standard has been completed and issued and WASB office employs 2 staff members and there are 2 to 3 WASB meetings a year.
Number of hours per report
Q10 & 11
State and Territory Governments 387 310 – 252
Average of State and Territory Government respondents (all years) with respondents that had actual experience from pilot study reports being weighted more heavily than those that had not.
In terms of efficiency in producing a report over time, some respondents indicated (in question 11) the level of efficiency clearly. Other respondents however indicated there would be efficiency but did not provide a timeline. On average we have applied a 20% efficiency gain in the first year, 10% in second year and 5% in the third year. This is based on the case study responses and our own experience in producing client’s water reports.
Water utilities 173 138 – 112
Average of water utility respondents (all years) The same approach for efficiency improvements that was applied to State and Territory Governments was applied to water utilities, except where it was explicitly stated that there would be no efficiency gains i.e. Irrigation companies.
Water users 181 145 – 118
Average of major water user respondents (all years) The same approach for efficiency improvements that was applied to State and Territory Governments was applied to water users.
Environmental water rights holders 376 301 – 244
Average of environmental water holder respondents (all years) The same approach for efficiency improvements that was applied to State and Territory Governments was applied to environmental water rights holders

Deloitte Access Economics: Effects analysis of AWAS adoption
31
Description
Case study question
Type of report preparer
Number (Year 1)
Number (Years 2-10) Basis
Cost per hour ($)
Q2
State and Territory Governments $79 $79
Average of State and Territory Government respondents (all years) Note: To confirm the reasonableness of the average hourly rate from survey respondents, we used the ABS average weekly earnings
11 for ‘Professional, Scientific
and Technical Services’ (which was $1579 per week or $42.10 per hour assuming a 37.5 hour working week) and applied the VCEC
12 on-cost and overhead loading factor
of 1.75*. This calculation results in an average cost per hour of $74.
To ensure all costs were captured, where the case study hourly rates were lower than this estimate, $74 was applied, where they were higher, the higher rate was applied.
*The loading factor includes on-costs of: superannuation, payroll tax, workers compensation and fringe benefit tax costs; and overheads of building costs (floor space, fixtures & fittings maintenance, services, etc.), equipment, consumables, IT & other support services, administrative support and corporate overheads (senior management, corporate finance, HR, legal services, etc.).
Water utilities $74 $74
Our estimate based on ABS data.
See also note above (for central agencies)
Water users $74 $74 Average of major water user respondents (all years)
Environmental water holders $74 $74
Our estimate based on ABS data.
See also note above (for central agencies)
Independent assurance costs ($) per report
Q13 State and Territory Governments
Report 1 =$10,000
Reports 2-5 =
$5,000
Reports 6+ =
$2,000
Report 1 =$10,000
Reports 2-5 = $5,000
Reports 6+ = $2,000
Based on Deloitte experience for providing independent assurance this type of report as part of a larger regulatory audit.
Water utilities $10,000 $10,000 Based on Deloitte experience for providing independent assurance this type of report as part of a larger regulatory audit.
Water users $10,000 $10,000 Based on Deloitte experience for providing independent assurance this type of report as part of a larger regulatory audit.
11 ABS 2011, Average Weekly Earnings, Australia, May 2011 (Cat no. 6302.0) 12 Victorian Competition and Efficiency Commission (VCEC) 2007, Suggested default methodology and values for staff time in BIA/RIS analysis, Melbourne

Deloitte Access Economics: Effects analysis of AWAS adoption
32
Description
Case study question
Type of report preparer
Number (Year 1)
Number (Years 2-10) Basis
Environmental water holders $35,000 $35,000 Average of environmental water holder respondents (all years)
Training hours per organisation
Q13
State and Territory Governments 45 3
Assumed training of 2 days training for 3 FTE upfront, then 1 day training for 3 FTE thereafter
Water utilities 15 4 Assumed training of 1 day training for 2 FTE upfront, then 4 hours training for 1 FTE thereafter
Water users 15 4 Assumed training of 1 day training for 2 FTE upfront, then 4 hours training for 1 FTE thereafter
Environmental water holders 15 4
Assumed training of 1 day training for 2 FTE upfront, then 4 hours training for 1 FTE thereafter
Other costs Q14
Central agency
Assumed $30k every three years for hardware, software, upgrades, maintenance and other general expenses
Water utilities
Assumed $10k every year hardware, software, upgrades, maintenance and other general expenses
Water users
Assumed $10k every year hardware, software, upgrades, maintenance and other general expenses
Environmental water holders
Assumed $10k every year hardware, software, upgrades, maintenance and other general expenses

Deloitte Access Economics: Effects analysis of AWAS adoption
33
Limitation of our work
General use restriction
This report is prepared solely for the internal use of the Bureau of Meteorology. This report is not
intended to and should not be used or relied upon by anyone else and we accept no duty of care to any
other person or entity. The report has been prepared for the purpose set out in our engagement letter
dated 4 April 2011. You should not refer to or use our name or the advice for any other purpose.
This Report was prepared for the Bureau of Meteorology for the purposes of assisting the Bureau to
make an assessment of benefits and costs of introducing the AWAS.
In preparing this Report we have relied on information provided to us by the Bureau and in survey
results. We have not audited or otherwise verified the accuracy or completeness of the information.
We have not contemplated the requirements or circumstances of anyone other than the Bureau.
The information contained in this Report is general in nature and is not intended to be applied to
anyone‘s particular circumstances. This Report may not be sufficient or appropriate for your purposes.
It may not address or reflect matters in which you may be interested or which may be material to you.
Events may have occurred since we prepared this Report which may impact on it and its conclusions.
No one else, apart from the Bureau, is entitled to rely on this Report for any purpose. We do not
accept or assume any responsibility to anyone other than Bureau in respect of our work or this Report.
About Deloitte
Deloitte provides audit, tax, consulting, and financial advisory services to public and private clients
spanning multiple industries. With a globally connected network of member firms in more than 140
countries, Deloitte brings world-class capabilities and deep local expertise to help clients succeed
wherever they operate. Deloitte's approximately 169,000 professionals are committed to becoming the
standard of excellence.
Deloitte's professionals are unified by a collaborative culture that fosters integrity, outstanding value
to markets and clients, commitment to each other, and strength from cultural diversity. They enjoy an
environment of continuous learning, challenging experiences, and enriching career opportunities.
Deloitte's professionals are dedicated to strengthening corporate responsibility, building public trust,
and making a positive impact in their communities.
Deloitte refers to one or more of Deloitte Touche Tohmatsu Limited, a UK private company limited
by guarantee, and its network of member firms, each of which is a legally separate and independent
entity. Please see www.deloitte.com/about for a detailed description of the legal structure of Deloitte
Touche Tohmatsu Limited and its member firms.
About Deloitte Australia In Australia, Deloitte has 12 offices and over 5,700 people and provides audit, tax, consulting, and
financial advisory services to public and private clients across the country. Known as an employer of
choice for innovative human resources programs, we are committed to helping our clients and our
people excel. Deloitte's professionals are dedicated to strengthening corporate responsibility, building
public trust, and making a positive impact in their communities. For more information, please visit
Deloitte‘s web site at www.deloitte.com.au.
Member of Deloitte Touche Tohmatsu Limited
Liability limited by a scheme approved under Professional Standards Legislation.

Deloitte Access Economics: Effects analysis of AWAS adoption
34
Confidential - this document and the information contained in it are confidential and should not be
used or disclosed in any way without our prior consent.
© 2012 Deloitte Touche Tohmatsu. All rights reserved.