effects of growth hormone and insulin-like growth …
TRANSCRIPT

EFFECTS OF GROWTH HORMONE AND INSULIN-LIKE GROWTH FACTOR-I ON MILK PROTEIN GENE
EXPRESSION AND NUTRIENT UPTAKE AND CELL PROLIFERATION IN CLONAL BOVINE MAMMARY
EPITHELIAL CELLS
YINLI ZHOU
Dissertation submitted to the Faculty of the Virginia Polytechnic Institute and State University in partial fulfillment of the requirements for the degree of
DOCTOR OF PHILOSOPHY
in Animal and Poultry Sciences
Dr. Honglin Jiang, Chairman
Dr. R. Michael Akers
Dr. Edward J. Smith
Dr. Kenneth E. Webb, Jr.
Dr. Eric A. Wong
August 23, 2007
Blacksburg, Virginia
Key Words: Growth hormone, Insulin-like growth factor-I, Mammary epithelial cells, Milk production
Copyright 2007, YINLI ZHOU

EFFECTS OF GROWTH HORMONE AND INSULIN-LIKE GROWTH FACTOR-I ON MILK PROTEIN GENE
EXPRESSION AND NUTRIENT UPTAKE AND CELL PROLIFERATION IN CLONAL BOVINE MAMMARY
EPITHELIAL CELLS By
Yinli Zhou
Dr. Honglin Jiang, Chairman
Department of Animal and Poultry Sciences
ABSTRACT
The overall objective of this research was to further understand the mechanism by which
growth hormone (GH) stimulates milk production in cattle. Three studies were conducted toward
this objective. In the first study, the effects of GH and insulin-like growth factor-I (IGF-I), a
major mediator of GH action in vivo, on cell proliferation, nutrient transport, and milk protein
gene expression in bovine mammary epithelial cell line MAC-T cells were determined. GH
increased (P < 0.01) expression of four major milk protein genes in MAC-T cells transfected
with GHR expression plasmid. Cotransfection analyses indicated that GH also stimulated (P <
0.01) luciferase reporter gene expression from the promoters of the four milk protein genes in
MAC-T cells. These findings together with the fact that GHR mRNA and protein are expressed
in the epithelial cells of the bovine mammary gland suggest that GH may directly stimulate milk
protein gene expression in the mammary gland. This study also showed that IGF-I increased the
proliferation (P < 0.01) and amino acid transport (P < 0.05) in MAC-T cells. Because GH is
known to stimulate IGF-I production in animals, IGF-I-mediated mammary epithelial cell
proliferation and amino acid uptake may be additional mechanisms by which GH increases milk

iii
production in cattle. In the second study, the role of connective tissue growth factor (CTGF) on
IGF-I-stimulated proliferation of MAC-T cells was investigated. A microarray analysis revealed
that IGF-I decreased CTGF mRNA expression in MAC-T cells (P < 0.01). This effect of IGF-I
was further found to be mediated through the PI-3 kinase/Akt signaling pathway from the IGF-I
receptor (IGF-IR). CTGF alone stimulated MAC-T cell proliferation (P < 0.01). However,
together with IGF-I, CTGF attenuated the proliferating effect of IGF-I on MAC-T cells, and this
attenuation was reversed by additional IGF-I. Therefore, IGF-I inhibition of CTGF expression
may benefit IGF-I stimulation of MAC-T cell proliferation. CTGF had no effect on IGF-I-
induced phosphorylation of IGF-IR or total IGF-IR expression in MAC-T cells, suggesting that
CTGF may attenuate IGF-I stimulation of MAC-T cell proliferation through a postreceptor
inhibition of the IGF-IR signaling pathway. In the third study, whether a milk yield-associated
T/A polymorphism in exon 8 of the bovine GHR gene affected GHR signaling was determined.
It was found that the two corresponding GHR variants did not differ in mediating GH induction
of gene expression, suggesting that the two GHR variants are not functionally different and
hence are unlikely to mediate different effects of GH on milk production. In summary, the results
of this dissertation research suggest that GH may directly stimulate milk protein gene expression
and indirectly stimulate mammary epithelial cell proliferation and amino acid uptake through
IGF-I, thereby stimulating milk production in cattle. The results also suggest that IGF-I
stimulation of mammary epithelia cell proliferation may involve an inhibition of CTGF
expression in the cells.
Key Words: Growth hormone, Insulin-like growth factor I, Mammary epithelial cells,
Milk production, Proliferation

iv
ACKNOWLEDGEMENTS
I would like to give my sincere gratitude to Dr. Honglin Jiang, for providing me with the
opportunity of being his student, which always makes me feel lucky. Your extensive knowledge,
broad vision and creative thinking have been a source of inspiration for me through all my study
and research work. I wish to express my special thanks to my academic committee members, Dr.
Michael Akers, Dr. Edward Smith, Dr. Kenny Webb and Dr. Eric Wong for your valuable
discussions, encouragement, comments on my research, and support throughout my graduate
study.
Many thanks go to Sarah Price, Bettina Heid and Lee Johnson for the daily support and
help. I would like to thank Sarah Frazier, Pat Williams, Pat Boyle, and Wendy Wark for sharing
with me their skills and permitting me to use the facilities.
Thank you to all my friends for your support, friendship and encouragement, especially
my husband - Chen Chen, you are here all the time with me, holding my hands, wiping my tears,
cheering me up in the darkness. I could not go this far without your love. Thank you, with all my
heart. The deepest thanks go to my father Jiangan Zhou and my mother Hong Li. Although you
are more than 10 thousand kilometers away from me, your love and support always encourages
me to make progress.
I also would like to thank the John Lee Pratt Fellowship program and USDA CSREES
National Research Institute Grant 2001-35205-11732 for providing the financial support. Thank
you Virginia Tech, I am proud of the education I have obtained here and I am proud as always, a
Hokie.

v
TABLE OF CONTENTS
ABSTRACT................................................................................................................................... ii
ACKNOWLEDGEMENTS ........................................................................................................ iv
TABLE OF CONTENTS ............................................................................................................. v
List of Tables ............................................................................................................................... vii
List of Figures............................................................................................................................. viii
Introduction................................................................................................................................... 1
Chapter I Review of Literature ................................................................................................... 2 Introduction ................................................................................................................................ 2 The GH-IGF axis........................................................................................................................ 2
GH and GHR ......................................................................................................................... 3 JAK2 ...................................................................................................................................... 5 STAT5 .................................................................................................................................... 7 IGF-I...................................................................................................................................... 8
Roles of GH-IGF axis .............................................................................................................. 11 GH-IGF axis and cell proliferation and apoptosis ............................................................. 11 GH-IGF axis and nutrient transport and metabolism......................................................... 13 GH-IGF axis and mammary development and lactation .................................................... 18
Milk components and biosynthesis ................................................................................ 22 Process of milk production............................................................................................. 25 Role of GH-IGF in mammary development................................................................... 26 Role of GH-IGF in milk production............................................................................... 29 GH-IGF and milk protein gene expression .................................................................... 31
Roles of other hormones in mammary gland development and milk production .................... 32 Prolactin .............................................................................................................................. 32 Insulin.................................................................................................................................. 33 Transforming Growth Factor (TGF)................................................................................... 34 Fibroblast Growth Factors (FGF) ...................................................................................... 34 Leptin................................................................................................................................... 35
Chapter II Effects of Growth Hormone and Insulin-Like Growth Factor-I on Milk Protein Gene Expression, Nutrient Uptake and Proliferation in Bovine Mammary Epithelial Cell Line MAC-T ................................................................................................................................ 36
Abstract .................................................................................................................................... 36 Introduction .............................................................................................................................. 38 Materials and Methods............................................................................................................. 40 Results ...................................................................................................................................... 49 Discussion ................................................................................................................................ 52

vi
Chapter III Role of Connective Tissue Growth Factor (CTGF) in IGF-I Induced Proliferation of Bovine Mammary Epithelial Cells ................................................................. 67
Abstract .................................................................................................................................... 67 Introduction .............................................................................................................................. 69 Materials and Methods............................................................................................................. 70 Results ...................................................................................................................................... 73 Discussion ................................................................................................................................ 75
Chapter IV A Milk Trait-Associated Polymorphism in the Bovine Growth Hormone Receptor Gene Does Not Affect Receptor Signaling................................................................ 87
Abstract .................................................................................................................................... 87 Introduction .............................................................................................................................. 89 Materials and Methods............................................................................................................. 90 Results and Discussion............................................................................................................. 93
Conclusions .................................................................................................................................. 97
Literature Cited .......................................................................................................................... 98
Vita ............................................................................................................................................. 116

vii
List of Tables
Table 2.1. Primers used in this study. ........................................................................................... 57 Table 3.1. Primers used in this study. ........................................................................................... 78 Table 3.2. Top 10 IGF-I upregulated genes in MAC-T cells........................................................ 79 Table 3.3. Top 10 IGF-I downregulated genes in MAC-T cells................................................... 80 Table 3.4. Validation of microarray data by real-time PCR of 10 mRNAs.................................. 81

viii
List of Figures
Figure 1.1. Intracellular signaling cascade for the GHR. ............................................................... 4 Figure 1.2. Hypothalamic-pituitary GH-IGF-I axis........................................................................ 6 Figure 1.3. Summary of signaling pathway activated by the IGF-IR........................................... 10 Figure 1.4. Diagram of milk components synthesis. .................................................................... 22 Figure 2.1. Making MAC-T cells GH-responsive by transient transfection of GHR and STAT5
expression plasmids. ................................................................................................... 58 Figure 2.2. Effects of GH and IGF-I on proliferation of MAC-T-GHR and MAC-T cells,
respectively. ................................................................................................................ 59 Figure 2.3. Time-course study of nutrient uptake assay. .............................................................. 60 Figure 2.4. Effects of GH on nutrient uptake in MAC-T-GHR cells. .......................................... 61 Figure 2.5. Effects of IGF-I on nutrients uptake in MAC-T cells. ............................................... 62 Figure 2.6. Effects of GH on milk protein, IGF and IGFBPs mRNA expression in MAC-T-GHR
cells. ............................................................................................................................ 63 Figure 2.7. Effect of IGF-I on milk protein and IGFBPs gene expression in MAC-T cells......... 64 Figure 2.8. Transfection analysis of bovine milk protein gene promoters in MAC-T cells. ........ 65 Figure 2.9. Effect of GH administration on milk protein gene expression in bovine mammary
gland............................................................................................................................ 66 Figure 3.1. Effect of CTGF on IGF-I induced cell proliferation. ................................................. 82 Figure 3.2. Effect of CTGF on IGF-I activation of IGF-I receptor (IGF-IR)............................... 83 Figure 3.3. Identification of signaling pathways mediating IGF-I inhibition of CTGF expression........................................................................................................................................................ 84 Figure 3.4. Effects of GH administration on mammary gland expression of CTGF mRNA in
cows. ........................................................................................................................... 85 Figure 3.5. Effect of GH on CTGF mRNA expression in MAC-T cells. ..................................... 86 Figure 4.1. Schematic representation of the milk trait-associated single nucleotide in exon 8 (E8)
of the bovine GHR gene and the corresponding changes in the GHR protein. .......... 95 Figure 4.2. Comparison of the abilities of GHR279F and GHR279Y to mediate growth hormone-
induced STAT5 activation of reporter gene expression. ............................................ 96

1
Introduction Growth hormone (GH or somatotropin) plays a key role in postnatal development and
growth in animals. GH exerts its actions by direct effects on target organs and by stimulating the
production of insulin-like growth factor I (IGF-I). Many of the effects of GH are believed to be
mediated by IGF-1. One of the important effects of GH in cattle is on milk production.
Administration of GH to lactating cows increases milk yield without changing milk composition.
Theoretically, GH may stimulate lactation by either direct action or by stimulating IGF-I
production. The direct effect of GH on mammary gland can be mediated by two possible
mechanisms: GH directly acts on the milk-producing epithelial cells, or GH acts on the stromal
tissue from which factors including IGF-I cause the epithelial cells to secrete more milk. The
studies reported in this dissertation were conducted to further understand the contributions of
direct actions of GH and IGF-I-mediated actions of GH on bovine mammary epithelial cells to
increase milk production. The research was started with determining the effects of GH and IGF-I
on cell proliferation, nutrient uptake, and milk protein gene expression in clonal bovine
mammary epithelial cells. The second part of this research was conducted to determine the
mechanism by which IGF-I stimulates bovine mammary epithelial cell proliferation, in particular,
the role of connective tissue growth fator (CTGF) in this process. The last portion of this
research was conducted to understand whether a milk yield-associated single nucleotide
polymorphism in the GHR gene mediates different effects of GH on milk production.

2
Chapter I Review of Literature
Introduction
Growth hormone (GH), also called somatotropin, is a polypeptide hormone synthesized
and secreted by the anterior pituitary. It plays a key role in the control of postnatal development
and growth in mammals (Butler and Le Roith, 2001). One well-established biological action of
GH is stimulation of insulin-like growth factor I (IGF-I) production (Argetsinger and Carter-Su,
1996). It is believed that many of the effects of GH are mediated by IGF-I.
One of the important effects of GH and IGF-I in ruminants is on mammary gland
development and lactation. During mammary gland development, GH plays important roles in
ductal elongation and differentiation of ductal epithelia into terminal end buds (Coleman et al.,
1988). Administration of GH increases milk production in cows by about 15% (Knight, 1992),
but it does not alter the gross composition of milk (i.e., milk fat, protein, and lactose
concentrations; Bauman, 1992). In this review, I will attempt to summarize current
understanding of the mechanism by which GH and IGF-I regulate mammary gland development
and lactation. The potential of the mammary gland to synthesize milk is determined by many
hormones in addition to GH and IGF-I. Therefore, this review will also touch on the roles of
other hormones in regulation of milk production.
The GH-IGF axis
The GH-IGF axis is intimately involved in the integration of a lot of signals that regulate
systemic growth and metabolism throughout fetal and postnatal development. The GH-IGF axis
includes GH, the GH receptor (GHR), the GH binding proteins (GHBP), IGF-I, IGF-II, IGF
receptors and the six IGF binding proteins (IGFBP). Although GH is produced mainly by the

3
anterior pituitary, its receptor is expressed in many tissues (Mertani and Morel, 1995), indicating
this hormone has widespread effects. IGF are produced by many tissues during both fetal and
postnatal life, and IGF-I receptor (IGF-IR) is also expressed in most tissues during at least one
period of development (Schuller et al., 1993). So both GH and IGF-I have important effects on
the development and physiology of the organism. The actions of GH are initiated by binding to
GHR on the cell membrane of various target tissues. Many of these receptors activate tyrosine
kinases of the Janus Kinase (JAK) family, in particular JAK2. Upon GH binding to its receptor,
JAK2 associates with the receptor, leading to autophosphorylation of the kinase and
phosphorylation of the intracellular domain of the receptor. Then members of the signal
transducer and activator of transcription (STAT) family, in particular STAT5, become
phosphorylated. The phosphorylated STAT5 in turn activates gene expression, including
production of IGF-I (Argetsinger et al., 1993). Besides STAT, activated JAK2 can also interact
with other signaling molecules, such as the insulin receptor substrate (IRS)-1 and IRS-2, which
initiate the PI-3 kinase pathway, and the Ras/Raf/MAPK pathway (Carter-Su and Smit, 1998).
The GH-GHR signaling pathway is shown in Figure 1.1.
GH and GHR
GH is a polypeptide hormone synthesized and secreted by acidophilic or somatotropic
cells of the anterior pituitary gland. It was first discovered by Evans and Long in 1921 in the
extracts of the anterior pituitary which can promote growth and maturation (Evans and Long,
1921). The bovine GH gene contains approximately 1,793 nucleotides and consists of 5 exons
(Gordon et al., 1983). The bovine GH protein has a molecular mass of about 22,000 Daltons.
Bovine GH has four variants, generated by differential cleavage of the signal peptide. These

4
variants have either a leucine or valine substitution at position 127 and an alanine (191-amino
acid sequence) or a phenylalanine (190-amino acid sequence) at the NH2 terminus (Wood et al.,
1989). GH binds two GHR molecules and induces signal transduction through receptor
dimerization (Sundstrom et al., 1996).
GH
GHR
JAKS
P
PP
P
PP
STAT
P
P
STA
T
STA
T
Changes in Gene ExpressionCell Cycle Progression
DNA Synthesis etc.
PShc
Grb2
Sos Ras
Raf
MEK
PERK/MAPK
P
PIRS-1
PKB
P85P110
PI3K
Figure 1.1. Intracellular signaling cascade for the GHR. Dimerization of GHR following GH binding initiates phosphorylation and activation of Janus Kinase (JAKs). Activated JAKs catalyze the following three primary tyrosine phosphorylation events: (1) Signal transducer and activator of transcription (STAT) pathway lead to a direct stimulation of target gene transcription; (2) Activation of insulin receptor substrate PI-3K, including P85 and P110, by tyrosine phosphorylation of insulin receptor substrate (IRS)-1, and the following activation of PI-3K-protein kinase B (PKB) may be important for the metabolic, differentiative, and proliferative effect of GH; (3) Activation of the SHC-Grb2-Ras-Raf-MEK-ERK pathway resultes in the activation of mitogen-activated protein kinase (MAPK), which contributes to cell proliferation. (Adopted from Carter-Su and Smit, 1998).
5
GH releasing hormone (GHRH) from the arcuate nucleus of the hypothalamus and ghrelin from
stomach can promote the release of GH, and somatostatin from the periventricular nucleus of the
hypothalamus can inhibit it (Pombo et al., 2001). GH plays a key role in the control of postnatal
development and growth in mammals, either directly or indirectly via IGF-I. The hypothalamus-
pituitary GH-IGF-I axis is shown in Figure 1.2.
The GHR gene has 9 exons that encode the receptor and several additional exons that
form the 5’ untranslated region (Godowski et al., 1989). The GHR protein consists of an
extracellular domain, a single transmembrane domain, and a cytoplasmic domain (Godowski et
al., 1989).
JAK2
The Janus tyrosine kinases (JAK) are the predominant non-receptor tyrosine kinases
required for the initiation of GH signal transduction (Herrington and Carter-Su, 2001; Schwartz
et al., 2002) Among the four known JAK family tyrosine kinases, JAK2 is the most predominant
tyrosine kinase that is activated and phosphorylated in GH stimulated cells (Herrington and
Carter-Su, 2001; Zhu et al., 2001). Human JAK2 gene encodes a 1,132-amino acid protein that
shares 95% sequence similarity to rat and pig JAK2 (Saltzman et al., 1998). Highest expression
of JAK2 was found in spleen, peripheral blood leukocytes, and testis (Saltzman et al., 1998).
JAK2 is suggested to mediate signals through a variety of single-chain receptors for ligands such
as prolactin (PRL), GH, erythropoietin (EPO), and thrombopoietin as well as to the multichain
interleukin 3 receptor family (e.g., interleukin 3 receptor and granulocyte-macrophage colony-
stimulating factor receptor) and members of the gp130 receptor family (Kisseleva et al., 2002).

6
Pituitary
GH
Muscle, Bone
IGF-I Growth
Mammary gland
Development and milk production
Liver Fat
Lipolysis
HypothalamusSomatostatin GHRH
+-
?
Figure 1.2. Hypothalamic-pituitary GH-IGF-I axis. Pituitary GH production and secretion is regulated by the hypothalamic hormones somatostatin and GH releasing hormone (GHRH). GH has direct effect on muscle, bone, fat, and mammary gland for growth, lipolysis, mammary gland development and milk production. GH also has indirect effect on those organs by stimulating liver to secrete IGF-I.
JAK2 interacts with the membrane proximal proline-rich Box 1 region of GHR (Herrington and
Carter-Su, 2001). JAK2 phosphorylates STAT1, STAT2, STAT3, STAT4, and STAT5, but not
STAT6 (Saltzman et al., 1998).
JAK2-deficient mammary epithelial cells showed a reduced proliferation index in
animals treated with estrogen and progesterone, and the lack of JAK2 impaired the specification
of secretory epithelial cells (Shillingford et al., 2002). JAK2-deficient females were unable to

7
lactate as a result of impaired alveolar formation, and JAK2 deficiency also impaired pregnancy-
induced branching morphogenesis (Wagner et al., 2004). Using a conditional knockout approach,
signaling through JAK2 was suggested to control not only the expression of the Cyclin D1
mRNA but also the accumulation of Cyclin D1 protein in the nucleus by inhibiting signal
transducers that mediate the phosphorylation and nuclear export of Cyclin D1 in proliferating
mammary epithelial cells (Sakamoto et al., 2007).
STAT5
STAT5 was firstly identified as mammary gland factor (MGF) in nuclear extracts from
lactating mice (Wakao et al., 1994; Wakao et al., 1992). It is essential for mammary gland
development and milk protein gene expression (Miyoshi et al., 2001; Shillingford et al., 2002).
Expression, activation by phosphorylation, and nuclear translocation of STAT5 are tightly linked
to mammary differentiation (Kazansky et al., 1995; Liu et al., 1996). STAT5 is expressed at all
stages of mammary development, with a minor induction during the final stages of gestation and
the onset of lactation (Kazansky et al., 1995; Liu et al., 1995). During pregnancy, a marked
induction in STAT5 phosphorylation occurs, peaking in late pregnancy and early lactation and
declining through involution (Liu et al., 1995).
STAT5 has two variants, STAT5a and STAT5b, which have 96% similarity in peptide
sequence. The difference between STAT5a and STAT5b is within their carboxyl termini (Liu et
al., 1995). Both of them are required for normal milk gene expression and lactation at parturition,
(Liu et al., 1996; Teglund et al., 1998), but targeted gene disruption in mice yields distinctive
phenotypes. STAT5a is essential for prolactin-induced terminal differentiation of the mammary
gland during pregnancy and lactation (Kazansky et al., 1995; Liu et al., 1997). STAT5a-deficient
mice exhibited decreased lobuloalveolar development but developed normally and were unable

8
to lactate after their first gestation period (Liu et al., 1997). STAT5b is an important molecule
involved in GH-signaling and disruption of STAT5b results in severe growth retardation of male
mice (Udy et al., 1997; Horvath, 2000). STAT5b null mice also demonstrated decreased
lobuloalveolar development, which was less severe than that of the STAT5a null mice (Teglund
et al., 1998). Overexpressing STAT5a in the mammary glands of transgenic mice stimulated
lobuloalveolar development and delayed apoptosis (Liu et al., 1995; Iavnilovitch et al., 2002).
STAT5 can be activated by PRL, GH, and EGF in mammary gland. PRL activates
STAT5 only in the epithelium; GH and EGF activate STAT5 preferentially in the stroma
(Gallego et al., 2001). STAT5 activity is increased during pregnancy and lactation but rapidly
decreased after initiation of involution (Groner and Hennighausen, 2000).
IGF-I
IGF-I is an endocrine factor, which belongs to a growth factor family involved in the
regulation of normal and malignant cell growth, differentiation and development (Martin and
Stoica, 2002). IGF-I is a polypeptide hormone with similar molecule structure to insulin. The
molecular weight of human IGF-I is 7649 Daltons and consists of 70 amino acids in a single
chain with three disulfide bridges (Rinderknecht and Humbel, 1978). IGF-I is produced primarily
by the liver as an endocrine hormone (Combes et al., 1997). IGF-I is also produced by many
other tissues and functions in a paracrine/autocrine fashion to stimulate cell growth (Yee, 1994).
The production of IGF-I is stimulated by GH and can be retarded by undernutrition (Gautsch et
al., 1998). Approximately 98% of IGF-I is bound to one of the six IGFBPs (Yakar et al., 1999).
IGF-I plays an important role in prepubertal growth and continues to have anabolic effects in
adults by binding to specific receptors expressed on many cell types in many tissues.

9
Most of the biological activities of IGF-I are mediated through IGF-IR which can bind
both IGF-I and IGF-II with high affinity (Zhu and Kahn, 1997). IGF-IR is a transmembrane
tyrosine kinase with similar structure to the insulin receptor (Ullrich et al., 1986). IGF-IR is
composed of two extracellular α subunits and two intracellular β subunits. The α subunits bind
IGF-IR ligands, while the β subunits transmit ligand-induced signals (Mauro et al., 2003).
The binding of IGF-I to the receptor induces its intrinsic tyrosine kinase activity,
resulting in the recruitment and phosphorylation of multiple substrates, such as insulin receptor
substrate 1 (IRS-1) and src- and collagen-homology (SHC) protein (Chow et al., 1998). The two
main transduction pathways are the phosphatidylinositol 3-kinase (PI-3K) pathway and the
mitogen-activated protein kinase (MAPK) pathway (Cheatham et al., 1994). IRS-1 stimulates PI-
3K, which then transmits signal to the serine/threonine kinase Akt. Activated Akt phosphorylates
and blocks a variety of pro-apoptotic proteins, including Bcl-2-associated death promoter (BAD),
Caspase 9, forkhead transcription factors, and the glycogen synthase kinase-3 β (GSK-3β) kinase.
Furthermore, Akt induces the expression of antiapoptotic proteins, such as Bcl-2 (Brazil et al.,
2002). Atk also activates mTOR and p70S6 kinase, which controls cell cycle and protein
synthesis (Harada et al., 2001). Other mitogenic/survival IGF-IR pathways involve STATs that
are phosphorylated and activated by IGF-I through JAK1/2 and PI-3K/Akt pathways (Zong et al.,
1998; Zong et al., 2000). IGF-IR can also induce proliferation or prevent cell death via the
SHC/Ras/Raf/ERK/MAPK pathway (Prisco et al., 1999). The MAPK pathway is involved in
proliferation and differentiation, while the PI3K pathway plays a major role in metabolic
functions, mainly via the activation of the Akt cascade (O'Connor, 2003). Activation of Akt
stimulates glycogen synthesis, protein synthesis, cell survival, inhibition of lipolysis, and glucose

10
uptake. This pathway is also considered to be important for adipogenesis (Damm and Turner,
1958). IGF-I activated signaling pathways via IGF-IR are shown in Figure 1.3.
α
IGF-IRβ
α
P
P
P
P
β
P85
P70S6K
IRSP110
Akt
mTOR
PI3K
BAD
Apoptosis
Protein synthesis
Changes in gene expressioncell cycle progressionDNA synthesis, etc.
MEK
Raf1
Ras
Grb2
ERK/MAPK
SHC
SOS
FKHRGSK-3
Β-catenin
Figure 1.3. Signaling pathways activated by the IGF-IR. Binding of IGF-I to IGF-IR results in recruitment of Insulin Receptor Substrate (IRS) or src- and collagen-homology (SHC) and activate phosphatidylinositol 3-kinase (PI-3K) or mitogen-activated protein kinase (MAPK) pathway. The phosphorylation of IRS/P85 activates Akt, which can block a variety of pro-apoptotic proteins including Bcl-2-associated death promoter (BAD), forkhead transcription factors (FKHR), and the glycogen synthase kinase-3 β (GSK-3β) kinase. Atk also activates mammalian target of rapamycin (mTOR) and p70S6 kinase, which controls protein synthesis. IGF-IR can also induce proliferation or prevent cell death via the SHC-SOS-Ras-Raf-MEK-ERK/MAPK pathway. (Redrawn from O’Connor, 2003.)

11
Roles of GH-IGF axis
GH-IGF axis and cell proliferation and apoptosis
GHR mRNA and protein were detected in bovine mammary gland tissue (Glimm et al.,
1990; Sinowatz et al., 2000; Plath-Gabler et al., 2001). In lactating cows, bovine GH induced
proliferation of mammary parenchymal and growth of epithelial cells (Knight et al., 1990), and
also increased the cell renewal in the mammary gland (Capuco et al., 2001). In vitro study
showed GH had no effect on proliferation of bovine mammary epithelial cells or bovine
mammary explants (Akers et al., 2005). Both IGF-I and IGF-IR mRNA expression were detected
in mammary tissue of heifers during pregnancy, lactogenesis and galactopoiesis (Plath-Gabler et
al., 2001). IGF-I can stimulate proliferation of both the bovine mammary epithelial cell line
MAC-T and primary mammary epithelial cells (pMEC) (Silva et al., 2002; Thorn et al., 2006).
The DNA synthesis of MAC-T cells increased linearly with increasing concentrations of IGF-I in
the media (Silva et al., 2002).
IGF-I can stimulate cell proliferation by regulation of cell cycle progression (Evan and
Vousden, 2001). Studies in fibroblasts demonstrated that entry from G0 into G1 and overcoming
the G1-S checkpoint are required for the recruitment of quiescent cells into the cell cycle (Stiles
et al., 1979). The cyclin-dependent protein kinases regulate cell cycle progression through both
the G1-S and G2-M cell cycle checkpoints (Kamalati et al., 1998). Regulation of cyclin
expression plays an important role in developing mammary tissue. Genetic deletion of cyclin D1
selectively affects mammary gland development (Sicinski et al., 1995). Overexpression of cyclin
D1 in mammary epithelial cells in vitro accelerates cell cycle progression by decreasing the
length of G1 and reducing the requirement for growth factors (Kamalati et al., 1998). In addition,
overexpression of either cyclin D1 or cyclin E in mammary glands of transgenic mice results in

12
epithelial hyperplasia and carcinoma (Wang et al., 1994; Bortner and Rosenberg, 1997). These
results demonstrate that regulation of cyclin levels is a critical point in regulating cell cycle
progression and proliferation of mammary epithelial cells in both normal and abnormal growth of
this tissue.
IGF-I can regulate cell cycle progression by inducing cyclin expression (Kenney and
Rowitch, 2000). IGF-I induces cyclin D1 expression in many tumor cell lines including breast
cancer cells (Dupont et al., 2000). Expression of antisense cyclin D1 abolished the ability of IGF-
I to stimulate proliferation of human pancreatic cells (Kornmann et al., 1998). IGF-I induction of
cyclin D1 expression can occur through transcriptional regulation (Furlanetto et al., 1994;
Altucci et al., 1996) and through stabilization of cyclin D1 mRNA (Dufourny et al., 2000). IGF-I
also induces cyclin E in human breast cancer cells, and estrogen can enhance both cyclin D1 and
E expression by IGF-I induction in these cells (Dupont et al., 2000; Dupont and Le Roith, 2001).
IGF-I is required to induce cyclins essential for late G1, S and G2 progression and IGF-I is also
essential for EGF-mediated progression of mammary epithelial cells into S phase in the intact
mammary gland (Stull et al., 2002). In ventricular myocytes, IGF-I induces cyclins D1 and E in
addition to cyclins A2 and B1, cyclins essential for progression through S and G2 phases of the
cell cycle, respectively (Reiss et al., 1997). IGF-I can also induce cyclin A2 expression in
skeletal muscle satellite cells (Chakravarthy et al., 2000).
IGF-I is a potent stimulator of cell survival and an inhibitor to apoptosis in many cell
types (Barres et al., 1993). Study of transgenic mice that overexpress des(1-3)hIGF-I (truncated
analogue of IGF-I and lack a few of the teminal amino acdis, low affinity to IGFBP) within the
mammary gland during the pregnancy and lactation suggested that IGF-I inhibited apoptosis and
expression of apoptosis-associated genes, which were known to be activated by the transcription

13
factor AP-1 (Hadsell et al., 2000). Besides AP-1, a number of potential regulator proteins were
found to be involved with mammary involution, including c-myc (Strange et al., 1992), NF-1
(Furlong et al., 1996), Bcl-2 (Heermeier et al., 1996) and STAT (Li et al., 1997) families.
Inhibition of apoptosis in HC11 mammary cells by insulin caused increased abundance of Bcl-2
(Merlo et al., 1995). The mechanisms of IGF-I inhibition of apoptosis were studied in other cell
models. IGF-I inhibition of apoptosis in PCL2 cells is associated with increased Bcl-x mRNA
and increased bcl-xL protein (Parrizas and LeRoith, 1997). Activation of PI-3K and a
serine/threonine kinase termed Akt/PKB was involved in IGF-I-dependent protection of
fibroblasts from apoptosis (Kulik et al., 1997). Activation of Akt also inhibited caspase
activation (Ahmed et al., 1997) and caused activation of the Bcl-2 family member, BAD (del
Peso et al., 1997). Inactivation of BAD by this phosphorylation prevented it from
heterodimerizing with Bcl-2 (Yang et al., 1995), thereby providing a potential mechanism for the
inhibition of apoptosis.
The IGFBP have been shown to play a major role in regulating the survival effects of
IGF-I. Secretion of IGFBP-5 was involved in the initial stages of apoptosis, inhibiting IGF-1-
mediated cell survival (Tonner et al., 1997). In normal physiology, upregulation of IGFBP-5 was
associated with initiation of apoptosis during involution of the mammary gland (Flint et al.,
2000).
GH-IGF axis and nutrient transport and metabolism
Nutrient provision to the lactating mammary gland involves three factors: blood nutrient
concentration, blood flow, and cellular uptake. Administration of GH to dairy cows increases
milk yield by 10-15%. This increased milk production is associated with increased requirement
for milk precursors. Since treatment of GH for 1-3 weeks increases milk yield without increasing

14
feed intake (Bauman and Currie, 1980), one of the hypothesis of GH action is nutrient
repartitioning. After GH treatment, increased milk yield requires the repartition of nutrients to
accommodate the increase in rates of milk synthesis. This view is supported by many studies:
GH increases glucose uptake in the mammary gland (Davis et al., 1988; Fullerton et al., 1989),
while it decreases glucose uptake in skeletal muscle and adipose tissues (Davidson, 1987;
McDowell et al., 1987). Because in lactating cows, GH treatment does not alter plasma glucose
concentration (Bauman et al., 1988), the increased glucose availability in the mammary gland
may be due to the increased blood flow rate to the mammary gland (McDowell et al., 1987) or
the decreased glucose usage in other tissues.
Mammary blood flow (MBF) is assumed to be an important factor in regulation of
nutrient supply to the mammary gland and thus milk synthesis (Davis et al., 1979), and the close
correlation between MBF and milk yield in lactating ruminants indicates that local mechanisms
are involved in the regulation of MBF to the mammary gland. It is well-known that GH has a
marked stimulating effect on MBF in cows and goats (Mepham et al., 1984; Davis et al., 1988)
which may be associated with the role for prostaglandin I2 (PGI2) and prostaglandin E2 (PGE2)
in local mammary blood flow regulation during lactation. Increased mammary uptake of these
two prostanoids may be involved in the mammary blood flow response to GH (Nielsen et al.,
2004).
GH-IGF axis in amino acids transport and metabolism — Amino acid (AA) uptake
capacity of the alveolar cells and the amount/activity of protein translation components limit the
rate of milk protein synthesis in the high-producing dairy cow (Maas et al., 1997; Pohl et al.,
2005). GH has acute stimulatory effects on AA transport and protein synthesis in a variety of
tissues. Growth hormone is able to stimulate AA transport and utilization by the perfused rat

15
liver. Intracellular concentrations of seven amino acids, including threonine, serine, proline,
glycine, alanine, lysine, and arginine, are increased significantly in livers perfused with medium
containing growth hormone (Jefferson et al., 1975). But whether GH also stimulates AA
transport in the bovine mammary gland is unknown.
IGF can increase the cellular uptake of amino acids and stimulate protein synthesis
(Dimitriadis et al., 1992). The study in MCF7 cells overexpressing IGF indicated that IGF-I
upregulated the expression of genes which were involved in amino acid transport and metabolism,
protein biosynthesis and stability, including SLC7A11, SLC7A5 and SLC1A4 (Pacher et al.,
2007). SLC7A11 and SLC7A5 both bind to the activating peptide SLC3A2, which was also
upregulated by IGF-I and IGF-II (Verrey et al., 2004). SLC7A5 is a transporter for large neutral
amino acids, particularly branched and aromatic amino acids such as Gln, His, Ile, Leu, Met, Phe,
Trp, and Tyr (Wolf et al., 1996; Yanagida et al., 2001). SLC7A5 is expressed in most tumors and
tumor cell lines, indicating an important role in cancer. SLC7A11 primarily exchanges
extracellular anionic cysteine for intracellular glutamate (Verrey, 2003; Verrey et al., 2004). The
SLC1A4 transporter exchanges Na+ for small neutral amino acids such as Ala, Ser, Cys and Thr
(Kanai and Hediger, 2004). In addition to these transmembrane proteins required for amino acid
import, key factors involved in amino acid biosynthesis and metabolism are upregulated by IGF:
methionyl-tRNA synthetase (MARS), the only mammalian methionyl-tRNA synthetase and
ASNS (asparagine synthetase) and ASS (argininosuccinate synthetase), the essential precursor
for the synthesis of pyrimidine bases (Berg et al., 2002). Overexpression of IGF-I may also
increase amino acid transport in porcine lactating mammary tissue (Gronlund et al., 2003).
16
GH-IGF axis in glucose transport and metabolism—In milk production, glucose is the
primary substrate for synthesis of lactose which controls milk volume by maintenance of milk
osmolarity. Lactose synthesis and hence overall milk yield has been found to correlate positively
with glucose uptake in the mammary gland in ruminants (Nielsen and Jakobsen, 1993).
Glucose transport across the plasma membrane of mammary epithelial cells is mediated
by a family of tissue-specific facilitative glucose transporters (GLUT) (Kahn and Pedersen,
1992). Currently, thirteen members of GLUT have been identified; only GLUT1, GLUT3,
GLUT4 and GLUT8 have been cloned in bovine tissues. Before conception, the two isoforms
GLUT1 and GLUT4 are present in rat mammary tissue (Burnol et al., 1990). However, during
pregnancy, expression of the insulin-dependent GLUT4 decreases (Bell et al., 1990) and
virtually disappears during lactation, whereas the expression of GLUT1 localized in the
basolateral membrane of mammary epithelial cells increases (Burnol et al., 1990; Camps et al.,
1994). This agrees with the reported dominance of GLUT1 mRNA expression in lactating bovine
mammary tissue (Zhao et al., 1993). Treatment of GH did not affect the overall mammary
glucose uptake despite the fact that GH can increase mammary blood flow and hence glucose
supply, indicating that glucose supply is not a major determinant of mammary uptake (Nielsen et
al., 2001). GH has no effect on glucose transporter GLUT1 mRNA and protein expression (Zhao
et al., 1996), which is the major glucose transporter expressed in the mammary gland (Madon et
al., 1990). Mammary glucose uptake was also found to be unrelated to long term, as well as
acute, changes in glucose supply (Zhao et al., 1996). So it is very possible that GH did not alter
mammary glucose transporter capability, but changed the intracellular glucose metabolism
favoring lactose synthesis (Nielsen et al., 2001).
17
GH-IGF axis in fatty acid transport and metabolism—The effects of GH on lipid
metabolism are well-documented in pigs and especially in adipose cells. Exogenous GH
treatment consistently decreased lipid deposition in pigs regardless of sex, genotype or age
(Louveau and Gondret, 2004). The most striking effect of GH administration in humans is a
significant increase in free fatty acids after 1-2 h (Moller et al., 1990), reflecting stimulation of
lipolysis and ketogenesis. In vitro studies indicated that the lipolytic actions of GH may involve
stimulation of gene expression after binding of the GH receptor and activation of intracellular
signaling (Argetsinger et al., 1993), including activation of adenylyl cyclase and stimulation of
cAMP production, triggering the hormone-sensitive lipase (Yip and Goodman, 1999). Co-
infusion of GH with nicotinic acid (antilipolytic agent) abolished the effects of GH on glucose
tolerance (Davidson, 1987). Nicotinic acid derivative, which can inhibit lipolysis, can also
reduce the ability of GH to decrease insulin sensitivity (Nielsen et al., 2001). The other opinion
considered the reduction in lipid deposition results primarily from a decrease in lipogenesis
rather than from an increase in lipolysis, and involves a decrease in adipocyte insulin sensitivity.
This decreased insulin sensitivity leads to a marked decrease in insulin-regulated events such as
glucose transport and lipogenic enzyme activities as assessed in vivo and in vitro (Dunshea et al.,
1992; Harris et al., 1993; Liu et al., 1994; Wang et al., 1999). The finding that GH decreases the
activity of lipoprotein lipase (LPL) in culture of adipose tissue from neonatal and growing pigs
indicates that GH also regulates lipid uptake (Wang et al., 1999). The effect of GH on the
regulation of fatty acid synthase (FAS) is especially well-documented. Both activity and mRNA
levels of FAS (Harris et al., 1993; Liu et al., 1994) are decreased in adipose tissue of GH-treated
pigs. In primary culture of mature porcine adipocytes, GH antagonizes the stimulatory effect of
insulin on FAS expression (Louveau and Gondret, 2004). These latter data associated with data

18
obtained in various mammalian species have led to the conclusion that FAS is controlled
primarily at the level of gene transcription (Semenkovich, 1997; Yin et al., 1998). Inhibition of
GH and PRL action decreased the mRNA expressions of acetyl CoA carboxylase, fatty acid
synthase, and lipoprotein lipase in the mammary gland of rat, which could also be prevented by
treatment with GH, but not IGF-I or IGF-II (Barber et al., 1992).
Much less is known about the effect of IGF-I on free fatty acid (FFA) metabolism.
Increased lipolysis in adipose tissue from GH-deficient humans (Hussain et al., 1994) and
decreased LPL activity in adipose tissue of hypophysectomized rats (Oscarsson et al., 1999) have
been reported after IGF-I treatment. In hypophysectomized rats, IGF-I treatment reduced basal
and insulin-stimulated glucose incorporation into lipids; however, the effect of IGF-I seems to
involve decreased serum insulin levels rather than direct effects (Frick et al., 2000). In vitro, the
effect of IGF-I on adipocytes is observed only at high hormone concentrations and is believed to
be mediated through a cross-reaction with the insulin receptor, because IGF-I receptors are not
present on fat cells (Le Roith, 1997).
GH-IGF axis and mammary development and lactation
Process of mammary development
To synthesize milk, the mammary gland undergoes dramatic changes in morphology and
function during development, puberty and adult life. Although the rudimentary ductal structures
appear in utero, the development of the mammary gland largely occurs postnatally (Coleman et
al., 1988). During puberty, elongation and bifurcation of these primary ducts occur (Borst and
Mahoney, 1982). Mammary epithelial cells proliferate, invade the surrounding stromal
extracellular matrix (ECM) during the first part of pregnancy, and form lobulo-alveolar
structures that prepare the gland for lactation (Traurig, 1967; Borst and Mahoney, 1982;

19
Zwierzchowski et al., 1984). During late pregnancy, prior to parturition, breast epithelial cells
stop proliferation and invasion, and functionally differentiate into cells that express and secrete
milk proteins. Throughout lactation, epithelial cells continue to express milk proteins (Traurig,
1967). After weaning, the mammary gland undergoes involution, characterized by degradation of
ECM and epithelial cell death by apoptosis (Strange et al., 1992; Lund et al., 1996).
Fetal development—The development of mammary gland in the embryo is comparable
in all species (Damm and Turner, 1958). The slight thickening of the ventrolateral ectoderm in
the embryo is the first indication for the presence of bovine mammary development. This
thickening, also known as mammary band, first appears when the limb buds begin to lengthen
(Deome et al., 1959). The mammary band then narrows and forms a mammary line at about 30
days in the bovine embryo (Akers, 2002). Mammary lines give rise to mammary buds which
consist of congregation of ectodermal cells to form epithelial nodules, which occur at day 49 of
gestation. In the bovine, there are four mammary buds in the inguinal region, two on each side
of the former mammary band. Mammary buds then 'sink' into mesenchyme (embryonic
connective tissue) to form the secretory and duct systems of the gland which will represent the
future glandular portion (parenchyma) of the udder (Faulkin and Deome, 1960). Development
patterns of male and female have no difference before this period (Akers, 2002). Injection of GH
into the mouse fetus increased the size of the developing mammary gland in both male and
female fetuses, suggesting that this hormone is also involved in development of the mammary
gland during the fetal stage (Topper and Freeman, 1980)
Birth to conception—The mammary tissue contains a mammary cord that is embedded
in mesenchyme and indicates some branching at the distal end. Prepubertal mammary

20
development of bovine consists of branching and elongation of the mammary ducts into the
surrounding mammary fat pad (MFP). Prior to puberty, mammary growth occurs at an allometric
rate and returns to an isometric rate after puberty (Sinha and Tucker, 1969). Increased nutrient
intake during this allometric growth phase results in reduced parenchymal (PAR) mass and DNA
(Sejrsen et al., 1982; Capuco et al., 1995), which may be due to the impaired epithelial cell
proliferation because of reduced circulating growth hormone (Sejrsen et al., 1999). At puberty,
the ductal system begins to develop from the nipple, and is characterized by specialized
structures-the terminal end buds (TEB) - capping the end of the ducts. TEB grow out across the
fat pad and, by bifurcation, lay down the minimally branched structure that covers the fat pad.
There is little or no lobulo-alveolar development that occurs before conception. The mammary
growth and development are stimulated by ovarian activity at puberty. Ovariectomy in many
prepubertal species inhibits mammary growth (Lyons et al., 1958; Nandi, 1958). Additionally, it
has consistently been demonstrated that parenchymal (PAR) mass, DNA content, or both are
reduced in heifers reared on an elevated level of nutrient intake during this period of prepubertal
allometric mammary growth (Sejrsen et al., 1982; Petitclerc et al., 1984). After puberty, under
the influence of the hormones with each oestrous cycle, more extensive branching, and
elongation of the duct system is stimulated, until the final buds develop into secretory alveolar
cells. It is widely believed that estrogen is primarily responsible for duct growth, and
progesterone for alveolar formation (Chatterton, 1978). During these processes, GH has been
shown to play important roles in ductal elongation and the differentiation of ductal epithelia into
terminal end buds (Coleman et al., 1988).
Conception to parturition—Pregnancy is the greatest promoter of natural mammary
growth, which is associated with hormonal and physiological changes. For the hamster, 94% of
21
mammary development takes place during gestation. For other species, estimates range from
78% for the mouse and sheep to 66% in rabbits and 60% for rats (Anderson, 1976). In the early
stage of pregnancy, the ductal growth occurs extensively, producing a further branching of the
ducts and formation of the end buds (Coleman et al., 1988). Changes in weight, total DNA, or
percentage epithelium illustrate a marked increase in parenchymal tissue between day 80 and
115 of gestation (Smith et al., 1987). The masses of interstitial adipose tissues disappear for the
most part and make room for proliferation of epithelial cells, with appearance of a rudimentary
lobulo-alveolar system by about 5 mo of gestation (Chatterton, 1978). There occurs a dramatic
outgrowth of secondary branches throughout the estrus cycle. This together with the formation of
the lobulo-alveolar structures, results in the milk-producing gland.
Involution—When milking ceases, involution occurs characterized by apoptosis of
alveolar epithelial cells and tissue remodelling of the bovine mammary gland (Wilde et al., 1997).
By removing suckling young or by suspending milking in dairy animals, mammary involution
can be initiated at any stage of lactation (Akers, 2002). Evidence for involution can be detected
by the marked changes in gene expression in 24 h - mRNA expression for the caseins is reduced
95 percent in rats, and mRNA expression for acetyl-CoA carboxylase is reduced 98 percent
within 24 h of involution (Travers et al., 1996). Ultrastructurally, the involuting epithelium
showed progressive loss of tight junction integrity, followed by the alteration in composition of
mammary secretions during the dry period (Athie et al., 1996). The organelles intimately
involved in milk protein synthesis and secretion (rough endoplasmic reticulum and Golgi
apparatus) degenerated during involution (Holst et al., 1987).

22
Lactating mammary gland extracts glucose, amino acids, fatty acids, and minerals from
blood and produces the carbohydrate, protein, and fat in milk. Due to bacterial fermentation of
dietary carbohydrates in ruminants, acetate and β-hydroxybutyrate (BHBA) are also substrates.
The pathway of milk component synthesis is shown in Figure 1.4.
Milk components and biosynthesis
UDP-galactose
UDP-glucoseGlucose
Protein
Lactose
Fat
Milk
UTP Glucose+ +
Amino acids
Acetate
BHBA
Fattyacids
Glycerol
Diet
+
Figure 1.4. Diagram of milk component synthesis. Fat, lactose, and protein are three major components of milk. Most of the milk fat is composed of triglycerides from fatty acids and glycerol. Fatty acids in milk are derived either from diet or from acetate and β-hydroxybutyrate (BHBA). Lactose is the most common carbohydrate in milk. One glucose, together with uridine triphosphate (UTP), is converted to uridine diphosphate (UDP)-glucose, which in turn is converted to one UDP-galactose. Lactose is synthesized from UDP-galactose and another glucose by lactose synthase (a combination of galactosyl transferase and α-lactalbumin) without modification. The milk specific proteins are synthesized from amino acids derived either from the bloodstream (essential amino acids) or from amino acids synthesized by the secretory cells.

23
Milk protein biosynthesis— The basic process of milk protein synthesis is the same as
the processes by all eukaryotic cells. The milk specific proteins include the caseins (α-casein, β-
casein, κ-casein, and γ-casein) and the whey proteins (α-lactalbumin, β-lactoglobulin; Miller et
al., 1990). These milk specific proteins are synthesized from amino acids derived either from the
bloodstream (essential amino acids) or from amino acids synthesized by the secretory cells
(Shennan and Beechey, 1995). The α, β, κ, and γ-casein accounts for about 49, 35, 10, and 5
percent respectively of the total milk. The major whey protein in the milk of cows is β-
lactoglobulin, which is absent in the milk of humans, rats, and guinea pigs (Akers, 2002).
The proteins that are synthesized on the rough endoplasmic reticulum (RER) include the
proteins to be secreted (such as the caseins, α-lactalbumin, and β-lactoglobulin) and membrane
bound proteins (such as proteins involved in cell-cell contacts and membrane bound enzymes)
(Craig et al., 1978). Milk proteins for secretion pass to the Golgi apparatus, where caseins
undergo phosphorylation and associate with calcium to form micelles. Caseins and other proteins
undergo post-translational processing in the Golgi. Movement of Golgi vesicles to release their
contents from the apical cell membrane by reverse pinocytosis is thought to involve microtubules
since milk secretion is inhibited by drugs which disrupt microtubules (Patton, 1974).
Lactose biosynthesis—Lactose, a disaccharide of glucose and galactose, is the major
carbohydrate found in milk. Lactose is synthesized from UDP (uridine diphosphate)-galactose
and glucose within the Golgi by lactose synthase (Kuhn and White, 1976). The high
concentrations of lactose present in the Golgi during lactation lead to osmotic influx of water that
contributes to the fluidity of milk. Lactose synthase is a combination of galactosyl transferase
and α-lactalbumin that come together in the Golgi apparatus (Kuhn, 1968). β1,4-
galactosyltransferase (β4GalT-I) is a constitutively expressed, trans-Golgi resident, type II

24
membrane-bound glycoprotein that is widely distributed in vertebrates, and its substrate
specificity can only be activated by α-lactalbumin. β4GalT-I catalyzes the transfer of galactose to
N-acetylglucosamine residues, forming the β4-N-acetyllactosamine (Galβ4GlcNAc) (Beyer and
Barondes, 1982). In mammals, β4GalT-I has been recruited for a second biosynthetic function,
the tissue-specific production of lactose (Galβ4Glc), which takes place exclusively in the
lactating mammary gland. The synthesis of lactose is carried out by a protein heterodimer
assembled from β4GalT-I and α-lactalbumin, a noncatalytic mammalian protein expressed de
novo exclusively in the mammary gland during lactation (Brodbeck et al., 1967; Brew et al.,
1968; Hill et al., 1968).
Glucose transport systems were detected in the mammary gland at both the apical and
basal plasma membrane, and on Golgi and secretory vesicle membranes. Two distinct glucose
transport mechanisms have been identified in the mammary gland: a GLUT1 transporter
mechanism (Burnol et al., 1990) and a sodium dependent glucose transporter (Shennan and
Beechey, 1995). GLUT1 appears to mediate glucose transport at the basal and Golgi membranes,
but not contribute to glucose transport at the apical membrane (Camps et al., 1994).
Milk fat biosynthesis—Milk fat is synthesized in the smooth endoplasmic reticulum in
the basal region of the cell from precursor fatty acids and glycerol (Mather and Keenan, 1998).
Most of the milk fat is composed of triacylglycerides. The fatty acid composition of milk varies
between species. For ruminants, the two major sources of the fatty acids in milk triglycerides
include (1) diet via hydrolysis of chylomicra, (2) de novo synthesis within mammary epithelia
cells from nonglucose source (Short et al., 1977). In cows half of the milk fatty acids are derived
from the diet, including most of the C18 (stearic, oleic, or linoleic) fatty acids and about 30

25
percent of the C16 (palmitic) fatty acids. Shorter chain fatty acids are derived from de novo
synthesis of acetate and BHBA from the blood (Hansen and Knudsen, 1980).
Process of milk production
Milk production is determined by number, synthetic and secretory activity of mammary
alveolar cells and low amounts of residual milk after milking (Blum, 1992). Optimal mammary
development and sufficient availability of substrates for milk synthesis are two important factors
to achieve high milk yield. The major components of milk are water, lactose, fat, protein,
vitamins and minerals, which differ dramatically across species. Milk from Holstein cows has
about 3.2% protein, 3.4% fat, and 4.6% lactose.
Milk is synthesized and secreted from the extensive lobulo-alveolar clusters of the
lactating mammary gland (Neville and Watters, 1983). A single layer of polarized secretory
epithelial cells surrounds each alveolus within these clusters. In turn the alveoli are surrounded
by myoepithelial cells that function in milk ejection, and a vascularized connective-tissue stroma
that contains lipid-depleted adipocytes and fibroblasts. Ejection of milk from alveoli and ducts
requires contraction of myoepithelial cells, stimulated by oxytocin released from the posterior
pituitary as part of a suckling induced neuroendocrine reflex.
During pregnancy and the first few days postpartum, milk supply is controlled by the
endocrine system. At the latter part of pregnancy, the secretory activity of the alveolar cells
becomes apparent and the breasts are making colostrum, but high levels of progesterone inhibit
milk secretion and keep the volume “turned down” (Palade, 1975). At birth, the delivery of the
placenta results in a sudden drop in progesterone/estrogen levels, which leads to the copious milk
production in the presence of high prolactin levels (Neville et al., 2001). It has been shown that
during pregnancy, there is a progressive increase in progesterone followed by a sharp decrease

26
preceding delivery. This decrease is accompanied by a rapid increase in circulating estrogens,
which is essential for parturition and lactation (Vermouth and Deis, 1972). Progesterone also
prevents the release of prolactin from the anterior pituitary (Vermouth and Deis, 1974). Other
hormones (insulin, thyroxine, and cortisol) are also involved, but their roles are not yet well
understood. In the maintenance stage of milk production, milk removal is the primary control
mechanism for supply.
Role of GH-IGF in mammary development
Both GHR mRNA and protein are expressed in the epidermis of bovine mammary gland
during prenatal development (Knabel et al., 1998), suggesting that GH is involved in
development of the fetal bovine mammary gland. Administration of GH to prepubertal heifers
stimulates mammary growth (Akers et al., 2005). And there is much evidence indicating that GH
mediates postnatal mammary development and differentiation (Divisova et al., 2006). In rats, GH
stimulates the differentiation of ductal epithelia into TEB, and induces the differentiation of the
alveolar structures. GH can also promote the morphogenesis of TEB in the mammary fat pad in
rats (Walden et al., 1998). In GH-treated goats, the mammary glands are heavier; a potential cell
hypertrophy and a tendency to increase or maintain mammary cell numbers are induced
(Boutinaud et al., 2003). An antagonist of GHR dalayed pubertal ductal development resulting in
a block of ductal elongation and branching in the mammary gland of mice (Divisova et al., 2006).
This antagonist reduced the liver and serum IGF-I levels and also blocked both GH and IGF-I
signaling within the mammary gland (Divisova et al., 2006).
The role of IGF-I in mammary ductal development can be inferred from several pieces of
evidence. First, IGF-I can stimulate the proliferation of mammary epithelial cells in organ culture
at low concentrations (Richert and Wood, 1999). Overexpression of IGF-1 in the mammary

27
gland led to premature parenchymal development (Weber et al., 1998; Su and Cheng, 2004) and
delayed involution (Hadsell et al., 1996). Second, IGF-I mRNA was detected in mammary tissue
from pregnant and lactating cows (Hauser et al., 1990). Mammary tissue from pregnant heifers
was separated into fractions of epithelium, stroma, and blood components and IGF-I mRNA was
found to localize in the stromal component of the mammary gland (Cohick, 1998). IGF-I and
IGF-IR are also expressed within both the epithelial and stromal compartments of the virgin
mammary gland (Hovey et al., 1998; Richert and Wood, 1999; Berry et al., 2001). The
expression of IGF-I within the stromal compartment, coupled with the observation that both IGF-
I and the IGF-IR are expressed within TEB supports the idea that IGF-I acts as a paracrine signal
originating from the stroma and from select populations of cells within the TEB (Richert and
Wood, 1999). IGF-I can also induce some degree of mammary development in the form of TEB
development, indicating other mechanisms of IGF-I action are likely in addition to inhibition of
apoptosis (Kleinberg, 1998). Third, expression of IGF-I in mammary tissue can be elevated by
exogenous GH and E2 (Kleinberg et al., 1990). Last, localized administration of IGF-I to the
mammary gland of E2-treated hypophysectomized-ovariectomized rats can stimulate ductal
development (Ruan et al., 1992).
Direct demonstration of the role of IGF-I in this process was obtained through the
analysis of mice with targeted mutations in the genes for IGF-I and IGF-IR (Ruan and Kleinberg,
1999; Hadsell and Bonnette, 2000). Mice with a targeted mutation in the IGF-I gene have several
phenotypic abnormalities, including reduced viability, dramatically reduced postnatal growth,
and reduced fertility (Liu et al., 1993; Baker et al., 1996). In addition, the development of the
mammary ductal system in the IGF-I knockout mice is tremendously impaired (Ruan and
Kleinberg, 1999). The impaired ductal development was associated with diminished TEB

28
development and could be restored only by the administration of exogenous E2 and IGF-I (Ruan
and Kleinberg, 1999).
The need for IGF-IR in mediating the actions of IGF-I on mammary gland development
was demonstrated by targeted mutation of IGF-IR gene (Igf1r-/-) in mice (Hadsell and Bonnette,
2000). Mutation of the IGF-IR gene in mice impairs fetal growth and is perinatally lethal. This
lethality is caused by respiratory failure as a result of the impaired development of the intercostal
muscles. The transplantation of fetal mammary tissue of the Igf1r-/- mice demonstrated that
virgin mammary ductal development was dramatically impaired by loss of the IGF-IR (Hadsell
and Bonnette, 2000). Mammary gland grafts from Igflr-/- mice also displayed dramatic
reductions in both TEB number and size in comparison with Igflr+/+mice (Bonnette and Hadsell,
2001).
In ruminants, rapid mammary development is correlated with increased IGF-1 expression
(Hovey et al., 1998) and anti-IGF-1 antibodies are able to block the mitogenic effects of bovine
mammary tissue extracts (Weber et al., 1999). Compared with liver or other tissues, mammary
gland expresses less IGF-I, but this mammary derived IGF-I is potentially more meaningful than
circulating IGF-I in mammary development (Weber et al., 1998). IGF-I from mammary extract
induced much more mitogenic activity compared with the same amount of IGF-I from serum
(Weber et al., 1999).
IGFBPs are synthesized and secreted by mammary epithelial cells (Werner and LeRoith,
1996). Primary cultures of bovine mammary epithelial cells secrete IGFBP-2, -3, -4, and -5,
which by molecular weight analysis are identical to those present in bovine milk (Gibson et al.,
1999). IGFBP-3 is the predominant mammary IGFBP and its concentration also declines in
blood and milk during lactation compared to prepartum and involution periods.

29
Role of GH-IGF in milk production
Administration of bGH to high yielding Holstein cows resulted in increased milk yield
(Peel et al., 1981). GH has been used in the dairy industry to increase milk yield for more than 10
years. Treatment of rat with anti-GH for 24 h and 48 h reduced milk yield by 20% and 24%,
respectively, without any change in concentrations of lactose, fat, protein, (Flint and Gardner,
1994). Lactation inhibition caused by GH deficiency was reinitiated by GH administration either
systemically or into the mammary gland (Flint and Gardner, 1994), suggesting the direct effect
of GH was to stimulate milk synthesis. Currently, an indirect action of GH on lactating
mammary cells is widely believed for several reasons. Firstly, there is no evidence for the
presence of high-affinity GHR on mammary epithelial tissue (Akers, 1985; Hauser et al., 1990).
Secondly, GH has no stimulatory effects on milk synthesis in most in vitro studies of mammary
tissue (Bauman and Vernon, 1993; Etherton and Bauman, 1998), except for a report that it acts
synergistically with prolactin to increase synthesis of casein by goat mammary tissue in culture
(Skarda et al., 1982). Thirdly, GH stimulated neither proliferation of mammary epithelia nor
milk protein and fatty acid synthesis in mammary gland explants (Bolander and Topper, 1980).
Finally, unilateral close arterial infusion of GH into one-half of the mammary gland of sheep did
not increase milk yield of the infused udder-half (Gluckman et al., 1987).
The effects of GH on milk production is also considered to be mediated by stimulating
local production of IGF-I (Cohick, 1998). The effects and evidence of IGF-I on milk synthesis
remain controversial. IGF-1 has been shown to stimulate mammary cell (epithelial and stromal)
proliferation, casein gene expression and synthesis, and glucose transport (Baumrucker and
Stemberger, 1989), and IGF-I could inhibit apoptosis of the mammary gland (Forsyth, 1996).
Overexpressed des(1–3)IGF1 enhanced milk synthesis and mammary development during

30
prolonged lactation (Hadsell et al., 2005). In normal lactating goats, close arterial infusion of
IGF-I into the mammary gland increased milk production, which was associated with increased
blood flow (Prosser et al., 1994), suggesting a direct effect of IGF-I in mammary gland on milk
production. Bovine α-lactalbumin gene promoter can be used to increase local IGF-I expression
in transgenic mice. Milk yield in α-lactalbumin-IGF-I transgenic mice was significantly greater
than non-transgenic littermates (Su and Cheng, 2004), indicating that local overexpression of
IGF-I in the transgenic mice can stimulate milk yield during the first lactation. This may be due
to the mitogenic effect of IGF-I on mammary gland development. But Monaco et al. (2005)
failed to detect the effects of IGF-I on milk production and composition in mammary specific
transgenic swine, which over-expressed IGF-I. They found IGF-I over-expression did not
positively or negatively impact milk production of swine (Monaco et al., 2005). This is
consistent with other studies in which no statistically significant difference is found in milk yield
in IGF transgenic rabbits comparing to control lactating rabbits (Wolf et al., 1997). Pups of IGF-I
transgenic mice had about the same growth rates compared as the offspring of control mice
(Hadsell et al., 1996). Systemic administration of IGF-I had no effect on milk production in rats
(Nielsen et al., 1990; Flint et al., 1992; Flint and Vernon, 1998).
However, recent evidence suggests that GH may regulate milk production by direct
action on the mammary gland. This new evidence includes: (1) GHR mRNA and protein were
detected in the bovine mammary epithelia in most stages of mammary gland development except
involution (Hauser et al., 1990; Ilkbahar et al., 1999); (2) GHR expression in mammary gland
varies with stages of mammary gland development (lactation and galactopoiesis). In dry cows,
the expression of GHR protein is much lower than in lactating cows (Sinowatz et al., 2000). (3)
By using slow-release plastic implants, GH has been shown to have an effect on the formation of

31
terminal end buds, reinitiation of epithelial DNA synthesis, and increase in ductal diameter of the
mammary gland in mice (Coleman et al., 1988); (4) GH stimulates DNA binding activity of
STAT5, a key component of GHR signaling, in the mammary gland of cattle in vitro and in vivo
(Yang et al., 2000). GH treatment can also significantly increase the expression of STAT5
protein and mRNA in the mammary gland of lactating goat (Boutinaud et al., 2004).
GH-IGF and milk protein gene expression
Milk proteins, including caseins and whey proteins, are specific molecular markers for
functional differentiation in the mammary gland (Topper and Freeman, 1980). The genes for
these proteins display both tissue-specific and developmental patterns of expression (Hobbs et al.,
1982). The principal whey proteins in rodents, ruminants, and man are whey acidic protein
(WAP), β-lactoglobulin, and α-lactalbumin, respectively. Each is encoded by a relatively small,
single-copy gene. The casein proteins are encoded by a cluster of single-copy genes. In bovine,
the αS1-, β-, αS2-, and κ-casein genes are clustered in this order in a 250-kb region on
chromosome 6 (Rijnkels et al., 1997). In ruminant, the αS1- and β- casein genes are closely
linked and arranged in 5’-3’and 3’-5’ transcriptional orientations, respectively (Rosen et al.,
1999). The three genes encoding the calcium-sensitive caseins (αS1-, β-, and αS2-) have evolved
from a common ancestral gene (Stewart et al., 1987; Groenen et al., 1993) and share common
regulatory motifs in the proximal and distal 50 bp flanking regions (Groenen et al., 1992;
Winklehner-Jennewein et al., 1998). The κ-casein gene is, however, not evolutionarily related to
these genes, although its expression pattern is similar and its protein product is essential for
micelle formation and stability (Alexander et al., 1988).
The genes encoding these milk proteins are regulated by the complex interplay of peptide
and steroid hormones. Milk protein gene expression is controlled by hormones at the

32
transcriptional level (Teyssot and Houdebine, 1980), at the level of mRNA stability (Hobbs et al.,
1982), as well as the translational level (Rosen et al., 1999). The relative specific activity of
cytoplasmic mRNA for αS1-, αS2-, β-, and κ-casein were about 3.2, 4.6, 3.3, and 4.5- fold higher
in mammary tissues of lactating cows than in those of 8 month pregnant cows (Choi et al., 1988).
The combination of insulin, hydrocortisone, and prolactin can induce the accumulation of β-
casein mRNA and the secretion of the milk protein by epithelial cells from bovine mammary
tissue (Choi et al., 1988). GH increased ß-casein mRNA expression in mammary explants from
lactating cows (Yang et al., 2005). GH increased αS1-casein mRNA expression in a bovine
mammary epithelial cell (BMEC) clonal line (Sakamoto et al., 2005; Yonekura et al., 2006). The
expression of κ-casein RNA in mammary tissue of goat was not affected by GH (Boutinaud and
Jammes, 2004). GH treatment can also significantly increase the expression of STAT5 at both
transcriptional and protein levels in lactating goat mammary gland (Boutinaud and Jammes,
2004).
Roles of other hormones in mammary gland development and milk
production
Growth and differentiation of the mammary gland during development and lactation are
controlled by complex hormonal mechanisms. There are some other hormones and growth
factors that can control mammary gland development and lactation in addition to GH and IGF-I.
Prolactin
Prolactin (Prl), a peptide hormone synthesized and secreted by the anterior pituitary, can
also stimulate mammary growth and milk production. The requirement for Prl maintenance of
lactation varies with species. For rodents, Prl can stimulate both mammary gland development

33
and functional differentiation of the alveolar cells during pregnancy. Treatment of cows with
exogenous Prl has little effect on milk production or composition (Plaut et al., 1987), suggesting
the circulating concentration of Prl is not rate limiting to continuing milk secretion in cows. Prl
was demonstrated to play a key role in lactogenesis in ruminants but certainly a lesser role in
galactopoiesis, while exogenous Prl is very galactopoietic in rodents. Prl receptors which are
members of the cytokine receptor superfamily are expressed in mammary epithelial cells of
many species. Concentrations of Prl receptors in rodent mammary tissue correlate with milk
yields (Ormandy et al., 1997). The number of receptors increases to the time of peak milk
production and then declines. The metabolic clearance and secretion rate of Prl is also positively
correlated with milk production across stages of lactation of cows. Prl can also help to maintain
the population of mammary secreting cells and thus promote lactational persistency (Flint and
Gardner, 1994). Experiments that disrupt the normal Prl-signaling cascade so that one STAT5 is
inactivated result in lactation failure (Hynes et al., 1997).
Insulin
Insulin plays an important role in the regulation of nutrient utilization during lactation. In
ruminants, insulin has no effect on the mammary uptake of glucose, acetate, β-hydroxybutyrate,
or amino acids, but exogenous insulin inhibits milk production through the metabolic effects on
other tissue (Tucker, 2000). In adipose tissue, insulin promotes the uptake of glucose and acetate
and stimulates lipogenesis while inhibiting lipolysis. In liver, insulin inhibits gluconeogenesis. It
is unlikely that insulin plays a role in regulating the number of mammary epithelial cells. The
mitogenic activity of insulin is attributed to the ability of insulin to cross-react with IGF
receptors and to elicit IGF-related responses.

34
Transforming Growth Factor (TGF)
TGF-β plays an important role in embryonic development, cell differentiation and tissue
regeneration. It can be upregulated in some human cancers. TGF-β1 usually exerts a growth
inhibitory role on epithelial cells. TGF-β1 is the best described related to mammary function (Li
et al., 2003) among all TGF-β family members which include TGF-β1, TGF-β2 and TGF-β3. In
heifers, the ductal epithelial cells of the mammary gland show extensive presence of type I and
type II receptors (Purup et al., 2000). Most of the mammary-associated effects of TGF-β are
inhibitory. TGF-β can inhibit IGF-I or serum-stimulated growth of primary bovine mammary
epithelial cells in culture (Weber et al., 2000). TGF-β1 reversibly inhibits the growth of
mammary ducts. In the mouse, overexpression of TGF-β at puberty reduces the rate of duct
development and the degree of ductal tree expansion (Akers, 2006). Expression of TGF-β during
pregnancy impairs lobulo-alveolar development and lactation (Serra and Crowley, 2003). TGF-
β1 also affects morphology of bovine mammary cells in culture (Plaut et al., 2003).
Expression of TGF-β has been detected in human (Barrett-Lee et al., 1990) and in bovine
mammary tissue (Maier et al., 1991), in addition to being secreted in cow’s milk (Cox and Burk,
1991), where TGF-β2 was found to be the predominant molecule (Jin et al., 1991). TGF-α
stimulated proliferation of bovine mammary epithelial cells in cultures (Collier et al., 1993;
Zurfluh et al., 1990). These data support a role for TGF-α as a growth promoting factor during
mammary development.
Fibroblast Growth Factors (FGF)
FGF include a family of small peptide growth factors most of which can stimulate DNA
synthesis in cultured fibroblasts (Dvorak et al., 2006). Several members of the FGF family have
emerged as stroma-derived mitogens. They act in a paracrine manner to locally influence

35
epithelial cell proliferation and glandular morphogenesis by controlling appearance of side
branching of mammary ductal growth (Powers et al., 2000). Three of the FGF variants (FGF-1,
FGF-2 and FGF-3) are involved in ruminant mammary development (Deugnier et al., 2002).
These FGF and their receptors are expressed throughout the lactation cycle with highest level
during virgin stage and involution. Interaction between epithelium and the surrounding stroma
influence paracrine FGF-2 expression. The expression is greater in the stroma adjacent to the
developing parenchymal tissue compared with more distant mammary stromal tissue (Deugnier
et al., 2002).
Leptin
Leptin is a 16-KDa protein primarily produced in adipose cells (Havel, 2000). Leptin is
also expressed in mammary gland and secreted into milk. The long form of the leptin receptor
was found to be expressed in mammary epithelial cells (Yonekura et al., 2006). Leptin can
inhibit IGF-I or serum induced proliferation of bovine mammary epithelial cells. Increased local
secretion of leptin in the developing udder may explain the inhibitory effects of high-energy diets
on mammary development in heifers (Smith and Sheffield, 2002). Leptin is increased in the
serum of animals fed high energy diets, which may be related to the decreased mammary
development in these animals. Leptin appears in milk and is present in cultured bovine mammary
epithelial cells (Silva et al., 2002). Bovine mammary cells express mRNA for leptin and the
expression is increased by insulin and IGF-I, both of which are known mediators of mammary
function (Silva et al., 2002). This suggests that leptin may be an autocrine or paracrine signaling
molecule in the mammary gland.

36
Chapter II Effects of Growth Hormone and Insulin-Like Growth
Factor-I on Milk Protein Gene Expression, Nutrient Uptake, and
Proliferation in Bovine Mammary Epithelial Cell Line MAC-T
Abstract
Administration of growth hormone (GH) stimulates milk production in cattle and this
effect is widely believed to be mediated by GH-stimulated insulin-like growth factor-I (IGF-I).
However, recent findings that both GH receptor (GHR) mRNA and protein are expressed in the
epithelial cells of the bovine mammary gland suggest that GH may stimulate milk production by
directly affecting the milk-producing epithelial cells. The objectives of this research were to
determine whether GH and IGF-I can directly stimulate proliferation, glucose, amino acid, and
fatty acid uptake, and milk protein gene expression in MAC-T cells, a cell line that was derived
from bovine mammary epithelia. The research showed that IGF-I increased (P < 0.05) cell
proliferation and uptake of amino acids, decreased (P < 0.05) oleic acid uptake and had no effect
on uptake of 2-deoxyglucose, a nonmetabolizable analog of glucose, in MAC-T cells. IGF-I had
no effect on mRNA abundance of αS1-casein, αS2-casein, β-casein, κ-casein, α-lactalbumin, and
β-lactoglobulin, the six major milk proteins. The MAC-T cells express barely detectable GHR
mRNA. To help detect any effect of GH in these cells, MAC-T cells were transfected with
expression plasmids for GHR and signal transducer and activator of transcription 5 (STAT5), a
major transcription factor mediating GH induction of gene expressio. GH treatment of the
transfected MAC-T cells markedly stimulated (P < 0.05) the expression of αS1-casein, αS2-
casein, β-casein and α-lactalbumin mRNA, whereas it had no effect (P > 0.1) on the expression

37
of κ-casein, β-lactoglobulin, IGF-I, IGF-II or IGF binding protein 1 (IGFBP-1) to IGFBP-6
mRNAs. GH also did not affect 2-deoxyglucose, amino acid or oleic acid transport, or cell
proliferation in the transfected MAC-T cells. A sequence analysis revealed that the promoters of
the bovine αS1-casein, αS2-casein, β-casein and α-lactalbumin genes contain putative binding
sites for STAT5. Cotransfection analyses confirmed that GH could stimulate (P < 0.01)
luciferase reporter gene expression from each of these promoters in MAC-T cells, further
suggesting that GH can directly stimulate milk protein gene expression. Furthermore, GH
administration stimulated (P < 0.05) αS1-casein mRNA expression and tended to increase
several other milk protein mRNA in the mammary gland of lactating cows. These observations
together with the fact that GHR mRNA and protein are expressed in the epithelial cells of the
bovine mammary gland suggest that GH may directly stimulate milk protein gene expression in
the mammary gland as one of the mechanisms by which GH increases milk protein production in
cattle. Additional mechanisms may include IGF-I-mediated mammary epithelial cell
proliferation and amino acids uptake.
Key Words: Cattle, Growth hormone, Insulin-like growth factor-I, Mammary epithelial cells

38
Introduction
Growth hormone (GH), also known as somatotropin, is a polypeptide hormone
synthesized and secreted by the anterior pituitary, and plays a key role in the control of postnatal
growth and metabolism. One of the important effects of GH in ruminants is stimulation of
lactation. Administration of GH to lactating cows increases milk production (Knight, 1992), but
does not alter the gross composition of milk (i.e., fat, protein, and lactose concentrations)
(Barbano et al., 1992; Bauman, 1992). In response to GH injection, milk secretion of dairy cows
increases within a day and is maximized within a week. The increase in milk production is
maintained as long as GH treatment is continued (Bauman, 1992). The positive effect of GH on
milk production is also implied by the fact that plasma GH is significantly higher in high-
yielding than in low-yielding cows (Nebel and McGilliard, 1993).
The effect of GH on lactation is believed to be mediated by indirect action of GH on the
mammary gland because using GH binding assay, there was no evidence for the presence of
functional GH receptor in the mammary gland (Akers, 1985). Earlier studies that GH stimulated
neither proliferation of mammary epithelia nor milk protein (casein) and fatty acid synthesis in
mammary gland explants (Bolander and Topper, 1980) also supported an indirect mechanism for
GH stimulation of milk production.
Administration of GH to dairy cows increases milk yield by 10-15%. This increase is
associated with increased requirement for milk precursors. Since treatment of GH for 1-3 weeks
increases milk yield without increasing feed intake (Veerkamp, 1998), it is hypothesized that GH
causes a repartitioning of nutrients to accommodate the increased requirement for milk
precursors. This view is supported by many studies. For example, GH increases glucose uptake

39
in the mammary gland (Davis et al., 1988; Fullerton et al., 1989), while it decreases glucose
uptake in skeletal muscle and adipose tissues (Davidson, 1987; McDowell et al., 1987).
It is further believed that the indirect effect of GH on the mammary gland is at least in
part mediated by endocrine IGF-I. The evidence supporting this action includes that most of the
blood IGF-I comes from the liver under GH stimulation; IGF-1 has been shown to stimulate
mammary cell (epithelial and stromal) proliferation, casein gene expression and synthesis, and
glucose transport (Baumrucker and Stemberger, 1989); and IGF-I could inhibit apoptosis of the
mammary gland (Forsyth, 1996).
However, recent evidence suggests that GH may still regulate milk production by direct
action on the mammary gland. This new evidence includes: (1) GH receptor (GHR) mRNA and
protein were detected in the bovine mammary epithelia in most stages of mammary gland
development except involution (Hauser et al., 1990; Ilkbahar et al., 1999); (2) GHR expression in
mammary gland varies with stages of mammary gland development (lactation and
galactopoiesis). In dry cows, the expression of GHR protein is much lower than in lactating
cows (Sinowatz et al., 2000). (3) Slow-release plastic implants of GH stimulate the formation of
terminal end buds, reinitiate epithelial DNA synthesis, and increase ductal diameter of the
mammary gland in mice (Coleman et al., 1988); (4) GH stimulates DNA binding activity of
STAT5, a key component of GHR signaling, in the mammary gland of cattle in vitro and in vivo
(Yang et al., 2000). GH treatment can also significantly increase the expression of STAT5
protein and mRNA in the lactating goat mammary gland (Boutinaud et al., 2004).
The overall goal of this study was to understand the mechanism by which GH stimulates
milk production in cattle. This goal was achieved by determining the effects of IGF-I on cell
proliferation, nutrient uptake, and milk protein gene expression in MAC-T cells, and determining

40
the effects of GH on these processes in MAC-T cells overexpressing GHR. MAC-T cells are
clonal cells derived from the primary bovine mammary alveolar cells by stable transfection with
SV-40 large T-antigen (Huynh et al., 1991). MAC-T cells retain their ability to differentiate and
secrete milk-specific products, such as α-casein and β-casein proteins. These cells are also
responsive to extracellular matrix and to the lactogenic hormones (Huynh et al., 1991) and are
considered as a representive in vitro model for bovine lactation.
Materials and Methods
Cell culture
MAC-T cells (provided by Dr. R. M. Akers from Virginia Polytechnic Institute and State
University, Blacksburg, VA) were cultured in Dulbecco's Modified Eagle's Medium (DMEM)
supplemented with 4 mM of L-glutamine, 100 U/mL of penicillin, 100 μg/mL of streptomycin,
and 10% fetal bovine serum (FBS). The cells were cultured at 37 °C in a humidified 5% CO2
atmosphere. All reagents used in cell culture were purchased from Sigma-Aldrich, Inc. (St. Louis,
MO).
Genomic DNA and total RNA extraction from cells or tissues
Genomic DNA from the bovine liver was isolated by standard proteinase K digestion
followed by phenol-chloroform extraction.
Total RNA from MAC-T cells or bovine mammary tissues was extracted using TRI-
Reagent (Molecular Research Center, Inc., Cincinnati, OH) according to the manufacturer’s
instructions. DNA or RNA concentration was calculated based on the absorbance at 260 nm.
DNA or RNA quality was confirmed by gel electrophoresis.

41
cDNA and DNA constructs
A standard reverse transcription-polymerase chain reaction (RT-PCR) was used to clone
the cDNA fragments for six bovine milk protein genes, including αS1-casein (CSNAS1), αS2-
casein (CSNAS2), β-casein (CSNB), κ-casein (CSNK), α-lactalbumin (LALBA), and β-
lactoglobulin (LGB). Briefly, 0.2 μg of bovine mammary gland RNA was reverse transcribed
using 2 pmol of dNTPs, 50 nmol of DTT, 40 ng of random hexamers, 2 U of RNasin
ribonuclease inhibitor, and 10 U of reverse transcriptase (Promega, Madison, WI) in 10 μL of 1 x
reverse transcription buffer at 42 °C for 2 h. For PCR amplification of each milk protein cDNA,
2 µL of the reverse transcription products were mixed with 12.5 µL of 2 x PCR Master Mix
(Promega) and 10 pmol of milk protein mRNA-specific forward and reverse primers (bCAS1F1
and bCAS1R1 for bCSNAS1; bCSN1S2F1 and bCSN1S2R1 for bCSNAS2; bCSNBF1 and
bCSNBR1 for bCSNB; bCSNKF1 and bCSNKR1 for bCSNK; bLALBAF1 and bLALBAR1 for
bLALBA; bLGBF1 and bLGBR1 for bLGB) (Table 2.1) in a total volume of 25 µL. The PCR
amplification was initiated by heating at 94 °C for 3 min, followed by 35 cycles of 1 min at 94
°C, 1 min at 60 °C, and 1 min at 72 °C. The PCR products were resolved on 1.0 % agarose gels
containing ethidium bromide.
The DNA bands with the expected sizes were extracted from the gel using gel extraction
kits (Qiagen, Fremont, CA ), according to the manufacturer’s instructions. The gel-extracted
milk protein gene cDNAs were ligated into pGEM-T Easy vector (Promega), essentially
according to the manufacturer’s instructions. The ligation was transformed into competent
DH10B Escherichia (E) coli (Invitrogen, Carlsbad, CA) by electroporation and the positive
clones were selected on Luria-Bertani (LB)/Ampicillin/5-bromo-4-choloro-3-indolyl-ß-D -
galactoside (X-Gal)/isopropyl thiogalactoside (IPTG) plates. The plasmid DNA from the

42
selected E. coli cells was extracted using the Qiagen miniprep kit (Qiagen) according to the
manufacturer’s instructions and analyzed for inclusion of inserts by digestion with restriction
enzyme EcoR I.
A 2,013 bp promoter of bovine αS1-casein gene (CSNAS1) was amplified by standard
PCR from bovine genomic DNA using primers bCSNAS1PF1 and bCSNAS1PR1 (Table 2.1).
The PCR product was digested with restriction enzymes Sma I and Xho I, and cloned into pGL2-
basic (pGL2b) vector (Promega) digested with the same restriction enzymes to generate plasmid
bCSNAS1P/pGL2b. A 2,195 bp promoter of bovine αS2-casein gene (CSNAS2) and a 1,648 bp
promoter of bovine β-casein (CSNB) promoter were amplified by PCR with primers
bCSNAS2PF1 and bCSNAS2PR1, and bCSNBPF1 and bCSNBPR1, respectively (Table 2.1).
These two PCR products were digested with Xba I and Xho I, and cloned into pGL2b vector
between Nhe I and Xho I sites to generate plasmid bCSNAS2P/pGL2b and bCSNBP/pGL2b,
respectively. A 1,988 bp promoter of bovine α-lactalbumin gene was amplified by PCR using
primers bLALBAPF1 and bLALBAPR1 (Table 2.1), cloned into the pGL2b vector between the
Kpn I and Xho I sites, resulting in bLALBAP/pGL2b. The conditions of these PCR were 35
cycles of 1 min at 94 °C, 1 min at 60 °C, and 2 min at 72 °C. The PCR products were analyzed
by standard gel-electrophoresis.
All newly cloned plasmids were sequenced to verify the inserts. The sequencing reaction
was set up with 400 ng of plasmid and 5 pmol of vector specific primer in a volume of 10 µL
using the ABI Prism Big Dye Terminator cycle sequencing chemistry (Applied Biosystems,
Foster City, CA), run at 96 °C for 1 min, followed by 49 cycles of 96 °C for 10 s, 50 °C for 10 s,
and 60 °C for 4 min. The sequencing reactions were analyzed on ABI 377 Automated DNA
Sequencers (Applied Biosystems). These steps of sequencing were performed by the Virginia

43
Bioinformatics Institute (Blacksburg, VA). The nucleotide sequences of the cloned milk protein
genes or mRNAs were compared with the sequences in GenBank using the BLAST program at
http://www.ncbi.nlm.nih.gov.
The expression plasmid encoding wild-type mouse STAT5b was provided by Dr. Kouichi
Ariyoshi (The University of Tokyo, Tokyo, Japan). The bovine GHR expression construct was
made previously by our laboratory (Wang and Jiang, 2005). The pSPI-LUC plasmid was
provided by Tim Wood (Karolinska Institute).
Transient transfection and luciferase assay
For the transfection to test milk protein gene promoter response to GH, MAC-T cells
were plated onto 24-well plates at a density of 3 × 10⁴ / well. Cells in each well were transfected
with 0.5 μg of the respective milk protein gene promoter reporter construct, 0.5 μg of GHR
expression plasmid, 0.5 μg of wild-type STAT5b expression plasmid, and 2 ng of pRL-CMV as
transfection efficiency control, using FuGene 6 as transfection reagent (Roche, Indianapolis, IN).
24 h after transfection, the medium was replaced with serum-free DMEM, and the culture was
continued for 8 h. The transfected cells were subsequently treated with 500 ng/mL of
recombinant bovine GH (provided by Dr. A. F. Parlow, National Hormone and Peptide Program,
Torrance, CA) or PBS, the vehicle for GH, for 16 h before being lysed for dual-luciferase assay.
The cell lysates were prepared and assayed for luciferase activity using the Dual-LuciferaseTM
Reporter Assay System (Promega) according to the manufacturer’s instructions. This
transfection analysis was repeated four times. The luciferase activity expressed from the
promoter construct was divided by that from pRL-CMV in the same well to normalize well-to-
well variation in transfection efficiency.

44
Cell proliferation assay
MAC-T cells were cultured to 70% confluency. The cells were transfected with GHR and
STAT5 expression plasmids as described above. 24 h after transfection, the cells were detached
with Trypsin-EDTA (Sigma) and transferred to 96-well plate at 1 x 10⁴ cells/well. The cells were
cultured in DMEM containing 10% FBS for about 4 h and were then cultured in serum-free
DMEM for 8 h. The cells were then treated with 0.5 ng/mL, 5 ng/mL, 50 ng/mL, 100 ng/mL, or
500 ng/mL of bGH or PBS (control) for 16 h in serum-free DMEM. The nonradioactive
CellTiter 96 assay (Promega) was used to measure number of viable cells and this assay was
performed following the manufacture’s instruction. Briefly, the cells in each well were treated
with 15 μL of dye solution from the kit for 4 h. Then 100 μL of solubilization/stop solution was
added to each well and the plate was incubated overnight before the absorbance at 570 nm was
recorded using a 96-well plate reader. The absorbance reading was linearly proportional to the
number of viable cells per well.
The effects of IGF-I on cell proliferation of MAC-T cells were performed on
untransfected MAC-T cells. Briefly, MAC-T cells were seeded in 96 well plates in DMEM
containing 10% FBS for about 4 h and were then cultured in serum-free DMEM for 8 h. The
cells were then treated with 200 ng/ml of recombinant human IGF-I (Sigma) or PBS (control) in
serum-free DMEM for 16 h. 10% FBS was used as a positive control. The nonradioactive
CellTiter 96 assay was used to measure the number of viable cells as described above.
[3H]-2-deoxyglucose uptake assay
MAC-T Cells were seeded in 100 mm diameter culture dishes. When cells reached 60 %
confluency, they were co-transfected with 10 μg of GHR and 10 μg of STAT5b expression
plasmids using FuGene 6 as described above. 24 h after transfection, the cells were detached

45
with Trypsin-EDTA and seeded in 24 well plates at 3 x 10⁴ / well. The cells were allowed to
grow in DMEM and 10% FBS for ~4 h and then starved with serum free DMEM for 8 h. The
cells were treated with PBS, bGH (0.5 ng/mL, 5 ng/mL, 50 ng/mL, 100 ng/mL, 200 ng/mL, or
500 ng/mL) for 16 h. Each treatment was done in triplicate. The plates were set at room
temperature for 20 min to make sure the temperature of the medium reached room temperature.
The cells were rinsed three times in Krebs-Ringer phosphate buffer (KRB) containing 128 mM
NaCl, 4.7 mM KCl, 1.25 mM CaCl2, 1.25 mM MgSO4, 5.0 mM Na2HPO4, pH 7.4, and were then
incubated in KRB containing 1 μL of [3H]-2-deoxyglucose (PerkinElmer Life and Analytical
Sciences, Inc., Boston, MA) at room temperature. For time-course studies, the incubation lasted
from 5 to 60 min. For the uptake assays, a 20-min incubation was used. The uptake was
terminated by washing the cells 3 times with ice-cold KRB solution. Nonspecific [3H]-2-
deoxyglucose uptake was measured in the presence of 500 mM of glucose. The cells were lysed
in 0.5 mL of 0.1 N NaOH for 30 min and the lysates were neutralized by addition of 0.5 mL of
0.1 N HCl. 0.5 mL of the lysates was taken for counting [3H] activity and another 0.5 mL was
taken for measuring protein concentration. The counts (cpm/mL) were normalized with the
protein concentrations (µg/mL) of the same wells to make sure the difference in 2-deoxyglucose
uptake was not due to difference in the number of cells. The experiment was repeated three times.
The effect of IGF-I on [3H]-2-deoxyglucose uptake was determined in untransfected
MAC-T cells essentially as described for the GH effect except that the cells were treated with
200 ng/mL of IGF-I or PBS (control) for 16 h.
[3H]-amino acid mixture uptake assay
To determine if GH or IGF-I stimulated MAC-T cells to take up amino acids, the MAC-
T-GHR cells or MAC-T cells were treated with bGH or IGF-I, respectively as described in the

46
[3 H]-2-deoxyglucose uptake assay. For time-course studies, amino acids uptake was terminated
after incubation with [3H]-amino acid mixture (Amersham Biosciences, Amersham, UK) at 1.0
μCi/well for 5 to 60 min at room temperature. For GH or IGF-I effect on amino acid uptake, the
cells were incubated with [3H]-amino acid mixture for 20 min. The cells were then washed with
KRB and the accumulation of [3H]-amino acid within the cells was analyzed as described for
[3H]-2-deoxyglucose. Nonspecific [3H]-amino acid mixture uptake was determined in the
presence of 1000 ng/mL of unlabeled amino acids mixture (Sigma).
[3H]-oleic acid uptake assay
[3H]-oleic acid uptake assay was performed essentially following the method of Gao and
Serrero (Gao and Serrero, 1999). [3H]-oleic acid (PerkinElmer Life and Analytical Sciences,
Boston, MA) was dissolved in 10 mL of KRB at 37 °C to give a concentration of ~ 1.60 µM, or
2.5 µCi/mL. When the solution was completely clear after ~20 min, fatty acid-free BSA (Sigma)
from a concentrated stock solution (12.54 μg/μL) was added with gentle mixing to obtain an
oleic acid/BSA molar ratio of 1.0. The MAC-T-GHR or MAC-T cells were treated with GH or
IGF-I, respectively, as described before. Before initiation of the oleic acid uptake, the cells were
incubated at room temperature for 20 min. The time course study was performed by incubating
the cells with the [3H]-oleic acid/BSA solution from 2 seconds to 1 h. For the oleic uptake assay
to measure GH or IGF-I effect, the cells were incubated with [3H]-oleic acid/BSA mixture at 2.5
μCi/well for 20 min at room temperature. The uptake was stopped by removal of the solution
followed by addition of 1 mL of an ice-cold stop solution containing 200 μM phloretin. Phloretin
can adsorb to lipid surfaces and change the membrane permeability, thereby stopping fatty acid
uptake (Cseh and Benz, 1999). The cells were then washed with ice-cold KRB and the
accumulation of [3H]-oleic acid within the cells was analyzed as described for [3H]-2-

47
deoxyglucose. Background radioactivity representing [3H]-oleic acid trapped extracellularly and
bound nonspecifically by the cells was measured from 5-second incubation of the cells in the
[3H]-oleic acid/BSA solution.
Real-time PCR
Two μg of total RNA extracted from MAC-T cells were used for the synthesis of cDNA.
Reverse transcription was performed in a reaction mixture containing 0.5 mM dNTPs, 2.5 μM
random hexamers, 0.4 U/μL RNase inhibitor, 1.25 U/μL reverse transcriptase, 5.5 mM MgCl2
and 1 x RT buffer in a final volume of 10 μL. Reverse transcription was run for 10 min at 25 °C,
followed by 30 min at 48 °C, and 5 min at 95 °C. PCR was performed in a total volume of 25 µl,
containing 12.5 µL of SybrGreen PCR Master Mix (ABI), 2 µL (or 0.2 µg) of the cDNA, 0.2 µM
of forward and reverse primers, under the following thermal cycling conditions: 95 °C for 10
min, then 40 cycles of 95 °C for 15 s, and 60 °C for 1min. Glyceraldehyde-3-phosphate
dehydrogenase (GAPDH) was used as an internal control since the Ct (cycle threshold) value for
GAPDH was not different between control and treatment samples. The 2-ΔΔCt method was used
to calculate the relative abundance of mRNAs (Writzl et al., 2006).
Animal tissue
Mammary parenchymal tissues from 12 lactating Holstein cows were provided by Dr.
Anthony Capuco (USDA, ARS, Beltsville, MD). Those samples were taken during a previous
study (Capuco et al., 1989). Briefly, 6 cows were injected intramusculary with 40 mg
recombinant bGH/day for 5 consecutive days, and 6 cows were injected with an equal volume (4
ml) of excipient. The mammary gland tissue was collected at slaughter, 20-23 h after the last
injection.

48
Ribonuclease protection assay (RPA)
The RPA was used to determine the relative abundance of αS1-casein, αS2-casein, β-
casein, κ-casein, α-lactalbumin and β-lactoglobulin mRNA in bovine mammary tissues. To
synthesize antisense RNA probes, 150 ng of linearized milk protein cDNA plasmid were mixed
with 10 nmol of ATP, UTP, GTP, and 100 pmol of CTP (Promega), 50 μCi of 32P-CTP (3,000
Ci/mmol, 10 mCi/mL) (PerkinElmer Life and Analytical Sciences), 250 nmol of DTT, 20 U of
RNase inhibitor (Promega) and 15 U of T7 or SP6 RNA polymerase (Promega) in 40 μL of 1 x
transcription buffer (Promega). The mixture was incubated at 37 °C for 1 h, and then treated with
2 U of DNase I (Promega) at 37 °C for 20 min. The 32P-labeled probes were purified with
phenol-chloroform extraction followed by filtration (1,100 x g at 4 °C for 4 min) through Quick
Spin Sephadex G-50 columns (Roche Applied Science). The activity of the probes was estimated
by liquid scintillation counting. Similarly, the bovine 18s rRNA antisense probe was generated
from a bovine 18s rRNA plasmid. The RPA was performed using the RPA II kit (Ambion,
Austin, TX). Briefly, 0.2 μg of total RNA was mixed with 5 x 10⁵ dpm of αS1-casein, αS2-
casein, β-casein, κ-casein, α-lactalbumin or β-lactoglobulin antisense riboprobe, and 2 x 10⁴ dpm
of 18S rRNA probe in a total volume of 20 μL hybridization buffer. The mixture was incubated
at 42 ºC for 16 h and then digested with 200 μL of 1:100 diluted ribonucleases A and T1 at 37 °C
for 45 min. The ribonuclease-protected RNA fragments were then precipitated and resolved on
6% polyacrylamide gels containing 7 M urea. After gel electrophoresis, gels were dried and
exposed to phosphor screens. Exposed phosphor screens were scanned on a Molecular Imager
FX System (Bio-Rad Laboratories, Hercules, CA). The measured abundance of milk protein
mRNA in a sample was divided by that of the 18S rRNA in the same sample to normalize
potential variation in loading amount of RNA and in performing RPA.

49
RPA was also used to confirm the increased expression of GHR mRNA in the transfected
MAC-T cells. GAPDH mRNA expression was used as endogenous control. The bovine GHR
and GAPDH antisense probes were generated from a bovine GHR and GAPDH cDNA plasmid
(Kobayashi et al., 1999) as described before. This RPA was performed as described above.
Statistical analysis
All data were analyzed by one-factor analysis of variance (ANOVA). Multiple
comparisons of means were done using the Tukey test. These analyses were performed using
General Linear Model (GLM) of SAS (SAS Institute). All of the data were expressed as the
means ± SEM. Differences at P < 0.05 were considered significant.
Results
Establishment of GH responsive MAC-T cells through transient transfection
There was no detectable GHR mRNA in untransfected MAC-T cells (Figure 2.1A).
Following transfection with GHR and STAT5 expression plasmids, the expression of GHR
mRNA was readily detectable (Figure 2.1A). GH treatment of the transfected MAC-T cells
caused a nearly 80-fold induction (P < 0.001) in reporter gene activity expressed from a
construct containing STAT5-binding sites (Figure 2.1B), demonstrating that these transfected
cells became GH responsive. The untransfectd MAC-T cells did not respond to GH. The
following experiments to detect the effects of GH on MAC-T cells were performed on the
transfected MAC-T cells designated MAC-T-GHR cells.
Effects of GH and IGF-I on MAC-T-GHR and MAC-T cell proliferation, respectively
As shown in Figure 2.2A, GH at various concentrations had no effect on the
proliferation of MAC-T-GHR cells (P = 0.21), whereas 10% FBS increased cell proliferation

50
by 30% (P < 0.01). As shown by Figure 2.2B, 200 ng/mL of IGF-I stimulated MAC-T cell
proliferation by 50% (P < 0.01), compared with PBS.
Effects of GH and IGF-I on nutrient uptake in MAC-T-GHR and MAC-T cell, respectively
For each nutrient uptake assay, time course experiment was done first to determine the
time period within which accumulation of the radio-labeled substance increased linearly. As
shown in Figure 2.3, [3H]-2-deoxyglucose (Panel A), [3H]-amino acid mixture (Panel B), and
[3H]-oleic acid (Panel C) increased linealy within 60 min of incubation with the cells. Therefore,
20 min was used in the uptake assays to test the effects of GH or IGF-I. As shown in Figure 2.4A
and 2.5A, both GH and IGF-I had no effects on 2-deoxyglucose uptake in MAC-T-GHR and
MAC-T cells (P = 0.56, 0.24, respectively). IGF-I increased the uptake of [3H]-amino acids in
MAC-T cells (P < 0.05) (Figure 2.5B), while GH had no effect (P = 0.65) (Figure 2.4B). IGF-I
decreased [3H]-oleic acid uptake by MAC-T cells (P < 0.05) compared with PBS (Figure 2.5C).
GH had no effect on [3H]-oleic acid uptake by MAC-T-GHR cells (P = 0.87) (Figure 2.4C).
Effects of GH and IGF-I on expression of milk protein, IGF, and IGFBP mRNA in MAC-T-
GHR and MAC-T cell, respectively
Real-time PCR was performed to detect mRNA expression of six milk protein genes,
IGF-I, IGF-II, and six IGFBP genes. In MAC-T-GHR cells, GH increased αS1-casein (CSNAS1),
αS2-casein (CSNAS2), β-casein (CSNB), and α-lactalbumin (LALBA) mRNA expression
significantly (P < 0.05) (Figure 2.6A). The αS1-casein, αS2-casein, and β-casein mRNAs were
almost undetectable in MAC-T-GHR cells before GH treatment (Figure 2.6C). IGF-II and
IGFBP-1, 2, 3, 4, 5, and 6 mRNAs were readily detectable in those cells, but their expressions
were not affected by GH treatment (P = 0.91, 0.45. 0.70, 0.10, 0.99, 0.14, 0.37, respectively)
(Figure 2.6B). IGF-I, k-casein (CSNK), and β-lactoglobulin (LGB) mRNAs were not detectable

51
in GH treated or untreated MAC-T-GHR cells. IGF-I had no effect on αS1-casein, αS2-casein, β-
casein, α-lactalbumin, k-casein, and β-lactoglobulin gene expression (P = 0.83, 0.27, 0.78, 0.33,
0.91, 0.93, respectively) (Figure 2.7A). IGF-I increased IGFBP-1 (P < 0.05) and IGFBP-3 (P <
0.01) mRNA expression in MAC-T cells.
Effects of GH on reporter gene expression from milk protein gene promoters
The promoters of αS1-casein, αS2-casein, β-casein, and α-lactalbumin were cloned into
pGL2 basic vector, generating bCSNAS1P/pGL2b, bCSNAS2P/pGL2b, bCSNBP/pGL2b, and
bLALBAP/pGL2b, respectively. Transient transfection analysis was performed to determine
whether GH could enhance reporter gene expression from these milk protein gene promoters. As
shown in Figure 2.8A, GH stimulated (P < 0.01) luciferase reporter gene expression from each of
these promoters in MAC-T-GHR cells, with the greatest increase from the bCSNAS2P/pGL2b
construct.
Sequencing analysis (Figure 2.8B) revealed that each of these four promoters contained
at least one consensus sequence for STAT5 binding site (TTCNNNGAA, where N is A, C, G, or
T) indicating that the increased reporter gene expression from these promoters may be mediated
by GH induced STAT5 binding to the promoters.
Effect of GH administration on milk protein gene expression in mammary gland
As determined by RPA (Figure 2.9A), αS1-casein, αS2-casein, β-casein, κ-casein, α-
lactalbumin and β-lactoglobulin mRNA were abundantly expressed in the mammary gland of
lactating cows, with αS1-casein mRNA being most abundant. GH treatment stimulated αS1-
casein mRNA expression (P < 0.05) by 18%. The abundance of the other five milk protein
mRNAs also tended to be greater in GH-treated cows than in control cows, although these

52
differences were not statistically significant (P = 0.28, 0.40, 0.21, 0.19, 0.56, respectively)
(Figure 2.9B).
Discussion
Continuous GH administration increases milk yield in lactating cows (Etherton and
Bauman, 1998; Bauman and Vernon, 1993). Many studies on the mechanisms of GH action on
milk production were conducted using mammary explants (Forsyth and Turvey, 1984; H. Yang
et al., 2000; J. Yang et al., 2000a; Yang et al., 2005). Although explants can be easily and rapidly
prepared, they are a mixed cell population, and hence are not appropriate for addressing
questions like “Does GH or IGF-I act directly on the mammary epithelial cells to affect milk
production?” In this study, we used a clonal cell line MAC-T cell which was derived from
primary bovine mammary alveolar cells, and was considered an appropriate in vitro model for
bovine mammary epithelial cells (Huynh et al., 1991). The MAC-T cells have significant
expression of IGF-I receptor and are sensitive to IGF-I action (Cohick and Turner, 1998). We
therefore used them directly in testing the effects of IGF-I on proliferation, nutrient transport and
gene expression in them. The MAC-T cells, however, do not express much GHR mRNA. We
made these cells maximally GH responsive by transfecting them with GHR and STAT5
expression plasmids and these transfected MAC-T cells allowed us to determine whether GH has
any effects on proliferation, nutrient transport and milk protein gene expression in mammary
epithelial cells. However, a potential drawback of these transfected MAC-T cells is that they are
not exactly the same as MAC-T cells and hence they may be less representative of mammary
epithelial cells than MAC-T cells.
53
The ability to produce milk is determined by both activity and the number of epithelial
cells in the mammary gland. Lactation is typically characterized by continued proliferation of
secretory tissue during early lactation, followed by a gradual loss of secretory cells and milk
yield declines after peak lactation. This study showed that IGF-I could significantly stimulate
MAC-T cell proliferation, while GH did not have this effect, suggesting that following GH
administration, GH stimulated IGF-I, but not direct action of GH, may stimulate the proliferation
of mammary epithelial cells, thereby contributing to increased milk production. Our observation
of IGF-I stimulation on MAC-T cell proliferation is also consistent with the reports that IGF-I
had a stimulatory effect on mammary cell (epithelial and stromal cell) proliferation (Baumrucker
and Stemberger, 1989), and that IGF-I was a potent mitogen for the developing mammary gland
(Sell et al., 1995).
Administration of GH to lactating cows increases milk production by about 15% (Knight,
1992), while it does not alter milk concentrations of fat, protein, and lactose (Bauman, 1992).
This means that GH must stimulate lactose, protein and fat synthesis by about 15% in the
mammary epithelial cells. So the increased lactose, protein and fat synthesis might result
partially from increased mammary uptake of the substrates for these milk components, i. e.
glucose, amino acids, and fatty acids. In this study, we found neither GH nor IGF-I had effects
on glucose uptake of MAC-T-GHR or MAC-T cells, suggesting that GH administration-
increased lactose synthesis is not mediated by direct stimulation of GH or IGF-I on glucose
uptake by the mammary epithelial cells. Our observation is consistent with earlier reports that
bGH did not change glucose uptake by the mammary gland of lactating dairy cows (Davis et al.,
1988; McDowell et al., 1987; Miller et al., 1991). It was also found GH had no effect on glucose
transporter expression in the mammary cells (Zhao et al., 1996), and that glucose uptake of

54
mammary gland was independent of IGF-I concentration during lactation in goat (M. O. Nielsen
et al., 2001).
We found IGF-I significantly stimulated amino acid uptake of MAC-T cell, while GH
had no such effect, indicating that GH-stimulated IGF-I, but not GH itself, may increase amino
acid transport into the epithelial cells of mammary gland, thereby increasing milk protein
synthesis. This effect of IGF-I on amino acid transport is consistent with the findings that
overexpression of IGF-I in porcine lactating mammary tissue increases amino acid transport
(Gronlund et al., 2003). A previous study found GH had no effect on amino acid uptake of
mammary gland (Miller et al., 1991) in lactating cows, which is consistent with our data. IGF-I
was reported to increase amino acids uptake in both MAC-T cell line and MAC-T-based cell line
transfected to secrete IGF-I under the constitutive SV40 promoter (Robinson et al., 2001).
Recently, IGF-I was found to upregulate expression of some genes that were involved in
transport and biosynthesis of amino acids, including several amino acid transport proteins,
argininosuccinate and asparagine synthetases (Pacher et al., 2007) in MCF7 breast cancer cells. It
remains to be determined whether IGF-I upregulates amino acids transporters in MAC-T cells,
thereby increasing amino acids uptake.
In the mammary gland, the long-chain fatty acids incorporated into milk triglycerides are
derived from mobilized fat stores and from dietary sources, whereas short- and medium chain
fatty acids are synthesized within mammary tissue (Bauman and Griinari, 2003). The mechanism
of fatty acid uptake by mammary epithelial cells has not been identified. There have been few
reports on the effect of GH or IGF-I on fatty acid uptake in the mammary gland and the reports
were conflicting. Mammary uptake of nonesterified free fatty acids (NEFA) increased in mid-
lactating cows by GH administration (McDowell et al., 1987), while, early data also showed that

55
GH administration did not change free fatty acid uptake in mammary tissue of cows (Davis et al.,
1988). Oleic acid (C18:1) is the most abundant fatty acid in milk (27.1%, according to the total
milk fatty acids) (Jenkins, 2000). Our data showed that IGF-I significantly decreased oleic acid
uptake by MAC-T cells and GH had no effects on the uptake. These data suggest that increased
milk fat synthesis in the mammary gland following GH administration is due to increased de
novo fatty acid synthesis rather than increased long chain fatty acid uptake.
Major milk proteins are coded by a small group of genes expressed exclusively in the
epithelium of the mammary gland during pregnancy and lactation. In vitro studies showed that
the expression of β-casein gene was induced by the synergistic action of insulin, glucocorticoid
and prolactin (Rosen et al., 1980; Topper and Freeman, 1980) and was inhibited by progesterone
(Terada et al., 1988). Several studies have reported the effects of GH on milk protein levels.
Administration of GH to pregnant rabbits induced expression of casein and whey proteins in the
mammary gland (Malewski et al., 2002). Bovine GH was also shown to induce β-casein gene
expression in cultured whole mouse mammary gland (Plaut et al., 1993). Infusion of GH for 63 d
to the mammary gland of lactating dairy cows significantly increased β-casein mRNA levels
(Yang et al., 2005). Further investigation with cultured mammary explants showed that increased
β-casein mRNA resulted from a direct effect of bST on the mammary gland (Yang et al., 2005).
GH increased αS1-casein mRNA expression in a bovine mammary epithelial cell (BMEC) clonal
line (Sakamoto et al., 2005; Yonekura et al., 2006). Consistent with these reports, our results
demonstrated that GH can stimulate milk protein gene αS1-casein, αS2-casein, β-casein, and α-
lactalbumin RNA expression in MAC-T cells over-expressing bovine GHR. Co-transfection
analysis further demonstrated that GH can activate αS1-casein, αS2-casein, β-casein, and α-
lactalbumin promoter activity. Sequencing these four milk protein gene promoters showed that

56
all contained at least one potential STAT5 binding site. GH stimulates the DNA binding activity
of STAT5 in cattle in vitro (Yang et al., 2000a). Together these observations suggest that GH
stimulation may increase milk protein gene expression through STAT5 signaling.
Our in vivo study showed that GH treatment increased αS1-casein mRNA expression in
the mammary gland of lactating cows by 18%. GH administration tended to increase αS2-casein,
β-casein, κ-casein, α-lactalbumin and β-lactoglobulin mRNA expression, although these effects
were not statistically significant, perhaps because these changes were too slight to be reliably
detected by the RPA.
In conclusion, we demonstrated some specific effects of GH or IGF-I on the bovine
mammary epithelial cell line MAC-T. GH could directly induce expression of αS1-casein, αS2-
casein, β-casein, and α-lactalbumin mRNA in these cells. We also showed that GH
administration significantly increased αS1-casein mRNA expression in the lactating mammary
gland and tended to increase the expression of other major milk protein genes. These
observations together with the fact that GH receptor mRNA and protein are expressed in the
epithelial cells of the bovine mammary gland suggest that GH may have direct effects on milk
protein gene expression in these cells in cattle, thereby increasing milk protein production. GH
probably has no direct effect on glucose, amino acids, or fatty acid transport in mammary
epithelial cells in cattle. We also demonstrated that IGF-I could stimulate proliferation of MAC-
T cells, and increase amino acids uptake of MAC-T cells, indicating that IGF-I may have similar
effects in cattle, thereby partially mediating the GH effect on milk production.

57
Table 2.1. Primers used in this study. Name Sequence1 Template and
Genbank Accession # Product
size (bp)
bCASA1F1 bCAAS1R1
AATCCATGCCCAACAGAAAG TCAGAGCCAATGGGATTAGG
αS1-casein mRNA, BC109618
189
bCSNAS2F1 bCSNAS2R1
AGCTCTCCACCAGTGAGGAA GCAAGGCGAATTTCTGGTAA
αS1-casein mRNA, NM_174528.2
150
bCSNBF1 bCSNBR1
GTGAGGAACAGCAGCAAACA TTTTGTGGGAGGCTGTTAGG
β-casein mRNA, NM_181008
115
bCSNKF1 bCSNKR1
CCAGGAGCAAAACCAAGAAC TGCAACTGGTTTCTGTTGGT
κ-casein mRNA, NM_174294
148
bLALBAF1 bLALBAR1
AAAGACGACCAGAACCCTCA GCTTTATGGGCCAACCAGTA
α-lactalbumin mRNA, NM_174378
143
bLGBF1 bLGBR1
CTTGTGCTGGACACCGACTA TTGAGGGCTTTGTCGAATTT
β -lactoblobulin mRNA, NM_173929
146
bGAPDHRNAF1 bGAPDHRNAR1
GGGTCATCATCTCTGCACCT GGTCATAAGTCCCTCCACGA
GAPDH mRNA, XM_001252479
177
bCSNAS1PF1 bCSNAS1PR1
AGAGCTAGCTGACCCAGATAGCCACAGTT AGACTCGAGGATGGCAGACTTTTGCTTCC
αS1-casein DNA, X59856
2013
bCSNAS2PF1 bCSNAS2PR1
AGAGAGCTCCAAACCAGATCCTCCCTCAA AGACTCGAGATCTCTGAGGGATTGGCACA
αS1-casein DNA, M94327.1
2195
bCSNBPF1 bCSNBPR1
AGAGAGCTCTCTTCCTGAGAAAAGGGAAATG AGACTCGAGCCGAAGGAGGAGCTGAATGGAT
β-casein DNA, X14711.1
1648
bLALBAPF1 bLALBAPR1
AGAGAGCTCGGACTGATGCTGCAGTTGAA AGACTCGAGATGCCTACCAGGAGCAGAGA
α-lactalbumin DNA, U63109.1
1988
bIGF1F1 bIGF1R1
GTTGGTGGATGCTCTCCAGT CTCCAGCCTCCTCAGATCAC
IGF-I mRNA XM001251168.1
148
bIGF2F1 bIGF2R1
GCTCAACCAGGGAACTACA CAGAGGCATACAGCACTCCA
IGF-II mRNA XM606794.3
236
bIGFBP-1F1 bIGFBP-1R1
ACCAGCCCAGAGAATGTGTC GTTTGTCTCCTGCCTTCTGC
IGFBP-1 mRNA NM174554.2
243
bIGFBP-2F1 bIGFBP-2R1
CAAGGGTGGCAAACATCAC GAGGTTGTACAGGCCATGCT
IGFBP-2 mRNA NM174555.1
198
bIGFBP-3F1 bIGFBP-3R1
CAGAGCACAGACACCCAGAA TGCCCCGTACTTATCCACACA
IGFBP-3 mRNA AF305199.1
230
bIGFBP-4F1 bIGFBP-4R1
GCCGCACACACGTCTATCTA CGCTTGCATGATTTACACGA
IGFBP-4 mRNA XM581740.3
219
bIGFBP-5F1 bIGFBP-5R1
GTGCGGCGTCTACACTGAG TCACGGGAGTCTCTTTTCGAT
IGFBP-5 mRNA S52657.1
155
bIGFBP-6F1 bIGFBP-6R1
TCTCTAGAAAGGAGAGTAAGCCCCAAGC GAGAATTCAGCACGGAGTCCAGATGTTT
IGFBP-6 mRNA NM001040495.1
161
b18sRNAF1 b18sRNAR1
AAACGGCTACCACATCCAAG CCTCCAATGGATCCTCGTTA
18s rRNA AF176811
155
1All sequences are written from 5’ to 3’. The top sequence of a pair of primers is the forward primer and the bottom sequence the reverse primer. Underlined are restriction enzyme recognition sites added for cloning.

58
A.
B.
020406080
100
PBS GH
Rel
ativ
e lu
cife
rase
activ
ity
*
Figure 2.1. MAC-T cells made GH-responsive by transient transfection of GHR and STAT5 expression plasmids. (A) Expression of GHR mRNA was confirmed in the transfected MAC-T cells, or MAC-T-GHR cells by RPA. Yeast RNA served as a negative control. (B) The MAC-T-GHR cells were co-transfected with a GH-responsive element-containing reporter construct pSPI-LUC. Luciferase reporter assay showed GH stimulated a ~ 80-fold increase in reporter gene activity from pSPI-LUC. Values are expressed as means ± SEM (n = 4). “*” indicates P < 0.01 vs. PBS.
GHR
GAPDH
Prob
eYe
ast
MAC-T MAC-T-GHR
GHR
GAPDH
Prob
eYe
ast
MAC-T MAC-T-GHR

59
A.
0
0.1
0.2
0.3
0.4
0.5
0.6
0.7
0.8
Abs
orba
nce
at 5
70 n
m
PBSGH 0.5 ng/mlGH 5 ng/mlGH 50 ng/mlGH 100 ng/mlGH 500 ng/ml10% FBS
*
B.
00.10.20.30.40.50.60.7
PBS IGF-I 10% FBS
Abs
orba
nce
at 5
70 n
m
* *
Figure 2.2. Effects of GH and IGF-I on proliferation of MAC-T-GHR and MAC-T cells, respectively. (A) Effects of GH on proliferatrion of MAC-T-GHR cells. MAC-T cells were transfected with GHR and STAT5 expression plasmids, and were treated with indicated concentrations of GH for 16 h. Nonradioactive CellTiter 96 assay showed GH had no effect on proliferation of these cells (P = 0.21). 10% FBS was used as a positive control. (B) Effects of IGF-I on cell proliferation of MAC-T cells. MAC-T cells were treated with PBS, 200 ng/mL of IGF-I, or 10% FBS for 16 h. IGF-I increased MAC-T cell proliferation by 50%. “*” indicates P < 0.01, compared to PBS. Values are expressed as means ± SEM (n = 4).

60
A.
-202468
10
0 10 20 30 40 50 60 70
Time (min)
2-de
oxyg
luco
se u
ptak
e pm
ol/m
g
B.
050
100150200250
0 10 20 30 40 50 60 70
Time (min)
Am
ino
acid
s up
take
pmol
/mg
C.
010002000300040005000
0 10 20 30 40 50 60 70
Time (min)
Ole
ic a
cid
upta
kepm
ol/m
g
Figure 2.3. Time-course study of [3H]-2-deoxyglucose (A), [3H]-amino acids (B), and [3H]-oleic acid uptake (C) by MAC-T cells. The MAC-T cells were incubated with [H3]-labeled 2-deoxy-glucose, mixture of amino acids, or oleic acid for different times. The cells were lysed and the radioactivity of the cell lysates was measured. The accumulated radioactivity in the cells was normalized to protein concentration of the cell lysates. The accumulation of [3H]-2-deoxyglucose, amino acids, and oleic acid increased linearly with time over 60 min.

61
A.
0.00.51.01.52.02.53.0
0 0.5 5 50 100 200 500
GH (ng/ml)
2-de
oxyg
luco
se u
ptak
e pm
ol/m
g/20
min
B.
405060708090
100110
0 0.5 5 50 100 200 500
GH (ng/ml)
Am
ino
acid
s up
take
pmol
/mg/
20 m
in
C.
0500
10001500200025003000
0 0.5 5 10 100 200 500
GH treatment
Ole
ic a
cid
upta
kepm
ol/m
g/20
min
Figure 2.4. Effects of GH on nutrient uptake in MAC-T-GHR cells. Effects of GH on [3H]-2-deoxyglucose (A), [3H]-amino acids (B), and [3H]-oleic acid uptake (C) of MAC-T-GHR cells. The MAC-T-GHR cells were treated with 0, 0.5, 5, 10, 100, 200, or 500 ng/mL of GH for 16 h. Then they were incubated with [3H]-2-deoxyglucose, or [3H]-amino acid mixture, or [3H]-oleic acid at room temperature for 20 min. Radioactivity of cells was normalized to protein concentration. Values are expressed as means ± SEM (n = 3). GH had no significant effect on 2-deoxyglucose uptake (P = 0.56), amino acids uptake (P = 0.65), or oleic acid uptake (P = 0.58).

62
A.
0
1
2
3
4
5
PBS IGF-I
2-de
oxyg
luco
se u
ptak
e pm
ol/m
g/20
min
B.
60
70
80
90
100
PBS IGF-I
Am
ino
acid
s up
take
pmol
/mg/
20 m
in
*
C.
0
500
1000
1500
2000
2500
PBS IGF-I
Ole
ic a
cid
upta
kepm
ol/m
g/20
min *
Figure 2.5. Effects of IGF-I on nutrient uptake in MAC-T cells. Effects of IGF-I on [3H]-2-deoxyglucose (A), [3H]-amino acids (B), and [3H]-oleic acid uptake (C) by MAC-T cells. The MAC-T cells were treated with 200 ng/mL of IGF-I or PBS for 16 h. Then they were incubated with [3H]-2-deoxyglucose, or [3H]-amino acid mixture, or [3H]-oleic acid at room temperature for 20 min. Radioactivity of cells was normalized to protein concentration. IGF-I had no effect (P = 0.24) on 2-deoxy glucose uptake of MAC-T cells (A), stimulated amino acids uptake (P < 0.05) (B), and decreased oleic acid uptake (P < 0.05) (C). Values are expressed as means ± SEM of independent cultures (n = 3). “*” indicates P < 0.05 vs control.

63
A.
1
10
100
1000
10000
100000
CSNAS1 CSNAS2 CSNB LALBA CSNK LGB
Rel
ativ
e ab
unda
nce
PBSGH
**
*
*
B.
1
10
100
1000
10000
IGFBP-1 IGFBP-2 IGFBP-3 IGFBP-4 IGFBP-5 IGFBP-6 IGF-II
Rel
ativ
e ab
unda
nce
PBSGH
C. Figure 2.6. Effects of GH on milk protein, IGF and IGFBP mRNA expression in MAC-T-GHR cells. The MAC-T-GHR cells were treated with GH or PBS for 16 h before total RNA was isolated. Real-time PCR was performed to quantify mRNA expression. Gene expression values were normalized to GAPDH mRNA and are expressed as relative values. Values are expressed as means ± SEM (n = 4). “*” indicates a significant difference from the respective control (p < 0.01). (A) GH increased CSNAS1, CSNAS2, CSNB and LALBA mRNA expression in MAC-T-GHR cells (P < 0.01). (B) GH had no effects on IGFBP-1 to IGFBP-6 or IGF-II mRNA expression (P = 0.45, 0.70, 0.10, 0.99, 0.14, 0.37, 0.91, respectively). IGF-I mRNA was not detetable in MAC-T-GHR cells (data not shown). (C) Agarose gel images of products of RT-PCR of CSNAS1, CSNAS2, CSNB, LALBA, CSNK, and LGB, and GAPDH mRNA.
CSNAS1
CSNAS2
CSNB
LALBA
CSNK
LGB
GAPDH

64
A.
1
10
100
CSNAS1 CSNAS2 CSNB LALBA CSNK LGB
Rel
ativ
e ab
unda
nce PBS
IGF-I
B.
1
10
100
1000
10000
100000
1000000
IGFBP1 IGFBP2 IGFBP3 IGFBP4 IGFBP5 IGFBP6
Rel
ativ
e ab
unda
nce
PBSIGF-I
*
**
Figure 2.7. Effect of IGF-I on milk protein and IGFBP gene expression in MAC-T cells. The MAC-T cells were treated with 200 ng/mL of IGF-I or PBS for 16 h before total RNA was isolated. Real-time PCR was performed to quantify mRNA expression. (A) IGF-I had no significant effect on milk protein gene expression. For CSNAS1, CSNAS2, CSNB, LALBA, CSNK, and LGB, P = 0.83, 0.27, 0.78, 0.33, 0.91, 0.93, respectively. (B) IGF-I increased IGFBP-1 (P < 0.05) and IGFBP-3 (P < 0.01) mRNA expression in MAC-T cells, but had no significant effect on expression of the other IGFBP mRNA. For IGFBP-2, 4, 5, 6, P = 0.61, 0.15, 0.52, 0.68, respectively. Values are expressed as means ± SEM (n = 4). “*” indicates P < 0.05 and “**” indicates P < 0.01 vs PBS.

65
A.
05
10152025303540
CSNAS1P CSNAS2P CSNBP LALBAP
Rel
ativ
e lu
cife
rase
act
ivity
PBSGH
*
*
**
B. CSNAS1P
...TCACTTC TTTGTTGTAA ACTCTCCTTA GAATTTCTTG GGAGAGGAAC TGAACAGAAC -120ATTGATTTCC TATGTGAGAG AATTCTTAGA ATTTAAATAA ACCTGTTGGT TAAACTGAAA -60CCACAAAATT AGCATTTTAC TAATCAGTAG GTTTAAATAG CTTGGAAGCA AAAGTCTGCC +1
CSNAS2P...CTATCGA ATTTTTGTAC CCCATATTCC TCAGAATGCT TCTACTCAGT TTGATTTAGA -120TGGTTTGAAA TACCTGAACA GAATTTGAAT TCTAAGAAGT CATGACGATT AGAATTGCTG -60GATTCAGGTA TTTCAAACCA CAGAATTACC ATATTATGGA GGAACAAGGT ATAAATAGTG +1
CSNBP...GAATTAT TCCCTTTAAA ATGCTCCCCA GAATTTTTGG GGACAGAAAA ATAGGAAGAA -120TTCATTTTCT AATCATGCAG ATTTCTAGGA ATTCAAATCC ACTATTGGTT TTATTTCAAA -60AGGCTCCACT ATTTCCAGTT AAGAATACTG GAGTGGATTG TTGTGCCAAT CCCTCAGAGA +1
LALBAP...TCTGTAT GTCTCTAAGA GGAAGGAGGA GTTGGCCGTG GACCCTTTGT GCATTTTCTG -120 ATTGCTTCAC TTGTATTACC CCTGAGGCCC CCTTTGTTCC TGAAATAGGT TGGGCACATC -60TTGCTTCCTA GAACCAACAC TACCAGAAAC AACATAAATA AAGCCAAATG GGAAACAGGA +1
Figure 2.8. Transfection analysis of bovine milk protein gene promoters in MAC-T cells (A). Four milk protein gene promoters (CSNAS1P, CSNAS2P, CSNBP, and LALBAP) were cloned into pGL2b. The MAC-T cells were co-transfected with a milk promoter-reporter gene plasmid, and STAT5 and GHR expression plasmids, and pRL-CMV. Twenty-four h after transfection, the cells were serum-starved for 8 h, followed by 500 ng/mL of GH or PBS treatment for 16 h before dual-luciferase assay. The transfection was repeated four times. The firefly luciferase activity from a milk protein promoter-reporter construct was divided by the renilla luciferase activity from pRL-CMV in the same well to normalize variation in transfection efficiency. “*” indicates P < 0.01 between PBS and GH-treated cells. Each of these promoters contains at least one potential STAT5 binding site (TTCNNNGAA), which is underlined (B).

66
A.
Prob
eYe
ast
18s
CSNAS1
18s
18s
18s18s
18sCSNAS2
CSNB
CSNK
LALBA LGB
Prob
eYe
ast
1 2 3 4 5 6 1 2 3 4 5 6
Control GH
1 2 3 4 5 6 1 2 3 4 5 6
Control GH
B.
Figure 2.9. Effect of GH administration on milk protein gene expression in bovine mammary gland. The mammary gland RNA was isolated from six non-pregnant lactating cows administerd with bGH and six cows injected with excipient. (A) Ribonuclease protection assays of milk protein αS1-casein, αS2-casein, β-casein, κ-casein, α-lactalbumin and β-lactoglobulin mRNA. A milk protein mRNA and 18s rRNA (loading control) was quantified simultaneously with Yeast RNA serving as a negative control. Arrows point to ribonuclease-protected bands. (B) Density analysis of the abundance of the six milk protein mRNA relative to that of 18s rRNA. “*” indicates P < 0.05 compared to control.
00.10.20.30.40.50.60.7
CSNAS1 CSNAS2 CSNB CSNK LALBA LGB
Rel
ativ
e ab
unda
nce control
bGH
*

67
Chapter III Role of Connective Tissue Growth Factor (CTGF) in
IGF-I Induced Proliferation of Bovine Mammary Epithelial Cells
Abstract
The bioactivity of IGF-I in the cellular microenvironment is modulated by both inhibitory
and stimulatory IGF binding proteins (IGFBP), whose production is partially under the control of
IGF-I. Connective tissue growth factor (CTGF), a 38-kDa cysteine-rich peptide, is a
multifunctional growth factor for fibroblasts, chondrocytes and vascular endothelial cells, and is
also considered one of the low affinity IGFBP. This study determined the role of CTGF in IGF-I
induced proliferation of MAC-T, a bovine mammary epithelial cell line. Both microarray and
real-time PCR analyses demonstrated that IGF-I decreased CTGF mRNA expression in MAC-T
cells. GH had no effect on CTGF mRNA expression in MAC-T cells, but GH administration to
cows decreased CTGF mRNA expression in the mammary epithelia. Because GH is known to
increase IGF-I production, these in vitro and in vivo data suggest that IGF-I may also decrease
mammary CTGF mRNA expression in cows. IGF-I and CTGF each stimulated MAC-T cell
proliferation (P < 0.05). However, added together, CTGF attenuated the proliferating effect of
IGF-I on MAC-T cells, and this attenuation was reversed by additional IGF-I. The p42/44
MAPK pathway inhibitor PD098059 and mTOR inhibitor rapamycin had no effect on IGF-I
suppression of CTGF gene expression in MAC-T cells. In contrast, blocking the PI-3 kinase
signaling pathway by LY294002 reversed IGF-I-decreased CTGF mRNA expression, indicating
that IGF-I suppresses CTGF mRNA expression in MAC-T cells through the PI-3K/Atk pathway.
CTGF had no effect on IGF-I induced phosphorylation of IGF-I receptor (IGF-IR) or total IGF-
IR expression in MAC-T cells, indicating that CTGF attenuation of IGF-I stimulation of cell

68
proliferation is not mediated by decreased availability or activity of IGF-I or IGF-IR expression,
and rather that CTGF may attenuate IGF-I stimulation of mammary epithelial cell proliferation
through a postreceptor interaction with the IGF-IR signaling pathways.
Key Words: CTGF, IGF-I, cell proliferation

69
Introduction
Insulin-like growth factor-I (IGF-I) is essential for normal growth and development
(Cohick and Clemmons, 1993). It is one of the most potent stimulators of cell growth and
proliferation and a potent inhibitor of programmed cell death. The proliferation of various cells
can be stimulated by IGF-I, including fibroblasts, vascular smooth muscle cells, epithelial cells,
and endothelials (Nicosia et al., 1994).
Biological actions of IGF-I are mediated by the IGF-I receptor (IGF-IR) (Mauro et al.,
2003). Binding of IGF-I to IGF-IR activates the receptor kinase, leading to receptor
autophosphorylation and tyrosine phosphorylation of multiple substrates, including insulin
receptor substrate (IRS) and Src Homologous and Collagen (SHC) proteins (Grimberg, 2003).
Through these initial tyrosine phosphorylation reactions, IGF-I signals are transduced to a
complex network of intracellular lipid and serine/ threonine kinases that are ultimately
responsible for cell proliferation, modulation of tissue differentiation, and protection from
apoptosis (Hadsell et al., 2002).
IGF-I is present in plasma and other biological fluids predominantly in a complex with
IGF binding proteins (IGFBP). IGFBP comprise a family of six homologous proteins that bind
IGF-I with a high affinity, equal or higher than the affinity of IGF-I for IGF-IR (Baxter et al.,
1998). IGFBP have both IGF-dependent and IGF-independent effects (Firth and Baxter, 2002).
IGFBPs regulate growth and development by regulating IGF-I transport to tissues and IGF-I
bioavailability to IGF-I receptors at the cell membrane level. Excess IGFBP lead to inhibition of
IGF-I action and growth retardation with impaired organogenesis (Hwa et al., 1999).

70
Connective tissue growth factor (CTGF, also known as hypertrophic chondrocyte –
specific gene product 24 or Hcs24), is a member of the CCN family (including Cry61, CTGF,
and Nov) of immediate early proteins (Takigawa, 2003) that are multifunctional and involved in
cell proliferation, differentiation, migration, angiogenesis, and tumorigenesis (Lau and Lam,
1999). CTGF is a secretory protein and contains a motif that is homologous to IGFBP, and it can
specifically bind IGF-I with relatively low affinity (Kim et al., 1997). CTGF can also be a
negative regulator of cell growth and it does this through interactions with growth modifiers
inside the cell (Moritani et al., 2003).
In the previous chapter, IGF-I was found to stimulate MAC-T cell proliferation. The
objective of this study was to determine the underlying mechanism. Microarray analysis was
performed to detect the genes that were regulated by IGF-I in MAC-T cells. CTGF was among
the genes that were down-regulated by IGF-I. Further experiments were conducted to determine
whether CTGF was involved in IGF-I induced proliferation of MAC-T cells as well as mammary
epithelial cells in vivo. We also determined the signaling pathway that mediates IGF-I
downregulation of CTGF expression in MAC-T cells.
Materials and Methods
Cell culture and treatment
MAC-T cells were cultured as described in Chapter 2. For the cell proliferation assay, the
cells were treated with 1) Phosphate buffered saline (PBS), 2) 200 ng/mL IGF-I (Sigma, St.
Louis, MO), 3) 200 ng/mL CTGF (Fitzgerald, Concord, MA), 4) 200 ng/mL IGF-I + 200 ng/ml
CTGF, 5) 300 ng/mL IGF-I + 200 ng/mL CTGF, 6) 400 ng/mL IGF-I + 200 ng/mL CTGF, 7)
500 ng/mL IGF-I + 200 ng/mL for 16 h followed by cell proliferation assay or Western blotting
analysis. The MAC-T cells were also treated with: 1) PBS + DMSO (control); 2) 200 ng/mL

71
IGF-I, 3) 20 μM Rapamycin (Sigma), an inhibitor of p70 S6 kinase; 4) 50 µM LY294002
(Calbiochem, San Diego, CA), a PI-3 kinase/Akt inhibitor; 5) 50 µM PD098059 (Calbiochem), a
MEK1/2 inhibitor; 6) 200 ng/mL IGF-I and 20 μM Rapamycin; 7) 200 ng/mL IGF-I and 50 µM
LY294002; 8) 200 ng/mL IGF-I and 50 µM PD098059 for 16 h followed by total RNA isolation
and mRNA expression analysis.
Total RNA extraction
Total RNA from MAC-T cells or bovine mammary tissues was extracted as described in
Chapter 2. The bovine mammary tissue used in this study was the same as described in Chapter 2.
Microarray analysis
MAC-T cells were grown until 60% confluency. The cells were serum-starved for 8 h
and were then treated with 200 ng/mL of IGF-I for 16 h or PBS (control). Total RNA was
isolated using TRI reagent (Molecular Research Center, Inc., Cincinnati, OH) and further
purified using RNeasy MiniElute Cleanup kit (Qiagen). RNA quality was confirmed using the
Agilent Bioanalyzer 2100. Three IGF-I and three PBS- treated RNA samples were used in
microarray analysis. Microarray analysis (RNA labeling, hybridization, scanning, preliminary
data analysis) was conducted by the Virgina Tech Core laboratory Facilities using the
Affymetrix Genechip Bovine Genome Arrays that contained ~24,000 bovine transcripts
(Affymetrix, West Sacramento, CA). Microarray data were analyzed using Genesifter software
(Cox et al., 2006). mRNA expression differences > 1.5 fold and with P < 0.05 (by t-Test,
Benjamini and Hochberg adjustment) were considered significant.
Real-time PCR
Real-time PCR, performed as described in Chapter 2, was used to quantify mRNA in
MAC-T cells and mammary gland tissue. GAPDH mRNA was used as an endogenous control in

72
real time PCR of MAC-T mRNA and β-actin mRNA was used as an endogenous control in real
time PCR of mammary tissue mRNA. The primers used in this real time PCR were also shown in
Table 2.1. The relative expression level of a target mRNA was calculated as 2–ΔCt, where ΔCt
was obtained directly by subtracting the Ct for this mRNA from the Ct for the endogenous
control mRNA.
Cell proliferation assay
This assay was performed using the Nonradioactive CellTiter 96 assay (Promega), as
described in Chapter 2.
Western blot analysis
The effect of CTGF on IGF-I-induced proliferation of MAC-T cells was determined by
treating cells with IGF-I, CTGF, or IGF-I together with CTGF. To detect the effects of CTGF on
phospho-IGF-I receptor expression, the MAC-T cells were treated as described before. The
cellular protein lysates were prepared by lysing the cells in lysis buffer (50 mM Tris-HCl, pH 8.0,
150 mM NaCl, 1% NP-40) containing Complete Mini protease inhibitor (Roche, Indianapolis,
IN). Total protein concentrations were determined using a Bio-Rad Protein Assay kit (Bio-Rad,
Hercules, CA), according to the manufacturer’s instructions. For Western blot analysis, 40 μg of
MAC-T cell protein were separated by electrophoresis in a 12% SDS-polyacrylamide gel and
then transferred to a nitrocellulose membrane (Bio-Rad). After blocking with 5% nonfat dried
milk in TBST (20 mM Tris-HCl pH 7.5, 500 mM NaCl and 0.05% Tween 20) for 3 h, the
membrane was incubated with 1:1000 dilutions of rabbit anti-Phospho-IGF-IR antibody (Cell
Signaling, Boston, MA, catalog # 3021s) at 4 ºC overnight. After being washed 3 times in TBST,
the membrane was incubated with a horseradish peroxidase-conjugated goat anti-rabbit IgG
antibody (Santa Cruz Biotechnology) at 1:2,000 dilutions for 2 h at room temperature. The

73
membrane was subsequently incubated in SuperSignal West Pico chemiluminescence Substrate
(Pierce Biotechnology, Rockford, IL) for 5 min, and the chemiluminescent signals were detected
by exposure to X-ray films. The membrane was then stripped by immediately incubating the
membrane in Restore™ Western Blot Stripping Buffer (Pierce Biotechnology, Rockford, IL) for
30 minutes at room temperature. After blocking and washing, the membrane was incubated with
1:1000 dilutions of rabbit anti- total IGF-I R (Cell Signaling, catalog # 3027) at 4 ºC overnight.
The same membrane was stripped again and reprobed with a beta-actin antibody (Cell Signaling,
catalog # 4967). The intensities of phospho-IGF-IR, total IGF-IR, and beta-actin bands were
measured using ImageJ and the measured band intensity of phospho-IGF-IR protein or total IGF-
IR protein in a sample was divided by that of beta-actin in the same sample to normalize
variation in protein loading.
Statistic Analysis
The pairwise comparisons were made using t-Test. Multiple comparisons were done
using ANOVA followed by the Tukey test. All these procedures were performed using the GLM
of SAS. All data were expressed as mean ± SEM.
Results
Effects of IGF-I on mRNA expression in MAC-T cells
On average, the mRNA for ~30% of the 24,000 bovine genes in the MAC-T cells were
detectable in the microarray analysis. 781 transcripts were at least 1.5 fold different (P < 0.05) in
abundance between PBS- and IGF-I-treated MAC-T cells. Among them, 498 transcripts were up-
regulated and 283 transcripts down-regulated by IGF-I. Table 3.2 lists the top 10 IGF-I
upregulated genes and Table 3.3 lists the top 10 downregulated genes in MAC-T cells, including
GABA(A)RAPL1, whose involvement in IGF-I action on the mammary gland is not obvious.
74
Table 3.4 listed 10 genes that were involved in the regulation of cell proliferation, apoptosis or
nutrient metabolism. The microarray based expressions of most of these 10 genes were
confirmed by real-time PCR (Table 3.4). Of these 10 genes, CTGF was particulary interesting,
because it is a binding protein of IGF-I (Kim et al., 1997), and the relation of CTGF to IGF-I was
therefore further investigated in this study.
Effect of CTGF on IGF-I induced proliferation of MAC-T cells
Treatment with 200 ng/mL of IGF-I, or 200 ng/mL of CTGF stimulated MAC-T cell
proliferation as compared with PBS control (P < 0.05) (Figure 3.1A). Treatment with 200 ng/mL
of CTGF together with 200 ng/mL of IGF-I decreased the proliferation of MAC-T cells
compared with 200 ng/mL of IGF-I alone (P < 0.05) (Figure 3.1A), but increased the
proliferation compared with PBS (P < 0.05). Treatment of these cells with 200 ng/mL of CTGF
and 300 ng/mL of IGF-I stimulated a greater increase in MAC-T cell proliferation compared to
200 ng/mL of CTGF and 200 ng/mL of IGF-I, and this increase was even greater when IGF-I
concentration was increased to 400 ng/mL or 500 ng/mL. (P < 0.05) (Figure 3.1B).
Effect of CTGF on IGF-I activation of IGF-I receptor
To determine if CTGF inhibits IGF-I activation of MAC-T cells proliferation by an IGF-I
dependent mechanism, phospho-IGF-IR expression was compared in the MAC-T cells treated
with 1) PBS; 2) 200 ng/mL IGF-I; 3) 200 ng/mL IGF-I + 200 ng/mL CTGF; 4) 200 ng/mL
CTGF by western blotting analysis. It was found that there was no phospho-IGF-IR expression
in PBS or CTGF treatment groups (Figure 3.2A). Both IGF-I and “IGF-I + CTGF” groups
induced phospho-IGF-IR expression, but there was no difference in phospho-IGF-IR expression
between them (P = 0.78) (Figure 3.2B). Neither IGF-I nor CTGF affected total IGF-IR
expression in MAC-T cells (Figure 3.2B).

75
Signaling pathway mediating IGF-I inhibition of CTGF expression
To determine the signaling pathway by which IGF-I inhibits CTGF mRNA expression, MAC-T cells were treated with several inhibitors of proteins involved in IGF-I signaling pathways (Figure 3.3A). Real-time PCR data showed that LY294002 increased CTGF mRNA expression compared with PBS (Figure 3.3B). Neither Rapamycin nor PD98059 alone had effects on CTGF mRNA expression in MAC-T cells (P = 1.0, 0.49, respectively). LY294002 and IGF-I together increased CTGF mRNA expression, compared with IGF-I alone (P < 0.05), but it had no effect on CTGF expression compared with PBS (P = 1.00). Combination of IGF-I and Rapamycin or of IGF-I and PD98059 had no effects on CTGF mRNA expression (P = 1.00, 0.97 respectively) compared with IGF-I alone ( Figure 3.3).
Effect of GH administration on mammary gland expression of CTGF mRNA in cows
The effect of GH administration on CTGF mRNA expression in the bovine mammary
tissue was studied. GH administration to lactating cows decreased mammary expression of
CTGF mRNA (P = 0.07) (Figure 3.4).
Effect of GH on CTGF mRNA expression in MAC-T cells
MAC-T cells were transfected with GHR and STAT5 expression plasmid as described in
Chapter 2. GH had no effect on CTGF mRNA expression in the transfected MAC-T-GHR cells
(P = 0.88) (Figure 3.5).
Discussion
Both microarray and real-time PCR analyses demonstrated that CTGF mRNA expression
was decreased by IGF-I in MAC-T cells. This effect of IGF-I may also occur in vivo because GH
administration decreased CTGF mRNA in bovine mammary gland and GH is known to increase
IGF-I in vivo, and GH had no direct effect on CTGF mRNA expression in MAC-T cells.
Previous studies found that the effect of IGF-I on CTGF expression was cell type-
dependent. In renal fibroblasts, CTGF mRNA expression was decreased by IGF-I (Lam et al.,
2003). However, IGF-I had no effect on CTGF mRNA expression in retinal vascular endothelial
cells (RVEC) (Wunderlich et al., 2000) and IGF-I increased CTGF mRNA expression in Ewing's

76
sarcoma (ES) cells (Strammiello et al., 2003). To our knowledge, this study is the first to have
demonstrated an inhibiting effect of IGF-I on CTGF mRNA expression in mammary epithelial
cells.
CTGF is widely considered to be a downstream mediator of some of the fibrogenic
actions of TGF-β, particularly in the promotion of fibroblast proliferation and ECM production.
TGF-β upregulated CTGF expression in several fibrotic disorders (Paradis et al., 1999; Chen et
al., 2000) involving inflammation and connective tissue accumulation (Paradis et al., 1999; Chen
et al., 2000). The induction of CTGF by TGF-β is also cell-type specific; for example, CTGF
mRNA was increased markedly by TGF-β in human foreskin fibroblasts (Igarashi et al., 1993)
but not in epidermal keratinocytes (Grotendorst et al., 1996; Leask et al., 2003). The mechanism
by which TGF-β regulates CTGF gene expression is unknown. In this study, IGF-I inhibition of
CTGF mRNA expression was reversed when the cells were incubated with the PI-3 kinase/Akt
inhibitor LY294002. LY294002 alone also increased basal expression of CTGF mRNA. mTOR
inhibitor rapamycin or MEK1/2 inhibitor PD98059 had no effects on CTGF expression. It can
therefore be concluded that CTGF mRNA expression is regulated by IGF-I through the PI-3
kinase/Akt pathway, not through mTOR or the MAPK pathway.
Overexpression of CTGF induced lactogenic differentiation of mouse mammary
epithelial cell line HC11 with the increased expression of β-casein (Wang et al., 2007).
Overexpression of CTGF in MCF-7 cells induced apoptosis (Hishikawa et al., 1999). Low levels
of CTGF were associated with increased metastasis and poor prognosis in breast cancer patients
(Xie et al., 2001; Jiang et al., 2004). The metastatic breast cancer cell line, MDA-MB-231,
expresses lower levels of CTGF than the less invasive MCF-7 cells (Jiang et al., 2004). All these
data suggest that CTGF is a differention inducer and a proliferation inhibitor in the mammary

77
gland. In our study, CTGF stimulated MAC-T cell proliferation. This result suggests a
proliferating effect of CTGF on mammary epithelial cells, in contrast to its role in mouse or
human mammary epithelial cells (Hishikawa et al., 1999; Xie et al., 2001; Jiang et al., 2004;
Wang et al., 2007). The mechanisms underlying these differences remain to be addressed.
Our study showed that CTGF, however, attenuated the proliferating effect of IGF-I on
MAC-T cells and that this attenuation could be reversed by excess IGF-I. CTGF has an IGF-
binding domain and was considered a low-affinity IGF-I binding protein (Kim et al., 1997). We
found CTGF had no effect on IGF-I induced phosphorylation of IGF-IR protein, indicating that
CTGF did not attenuate the effect of IGF-I on cell proliferation through inhibition of the
availability or activity of IGF-I on cell membrane. Others found that overexpression of CTGF
suppressed IGF-I-dependent Akt phosphorylation and ERK 1/2 phosphorylation in NSCLC cell
lines (Chien et al., 2006). It is therefore possible that CTGF may inhibit IGF-I stimulation of
MAC-T cell proliferation through a similar inhibitory interaction with post-IGF-IR signaling
components.
In summary, IGF-I can directly inhibit CTGF mRNA expression in MAC-T cells. IGF-I
does this through the PI-3 kinase/Akt signaling pathway. The decreased expression of CTGF
may enhance IGF-I induced MAC-T cell proliferation, and this effect of CTGF does not appear
to be mediated through binding to IGF-I.

78
Table 3.1. Primers used in this study. Name Sequence1 Template and
GenBank # Product size
(bp) bGAPDHRNAF1 bGAPDHRNAR1
GGGTCATCATCTCTGCACCT GGTCATAAGTCCCTCCACGA
GAPDH mRNA, XM001252479 177
bCD1qPF1 bCD1qPR1
GCACTTCCTCTCCAAGATGC GTCAGGCGGTGATAGGAGAG
CD1 mRNA, NM001046273.1 204
bCD2qPF1 bCD2qPR1
CCAGACCTTCATCGCTCTGT GATCTTTGCCAGGAGATCCA
CD2 mRNA, NM001076372.1 163
bSLC1A5qPF1 bSLC1A5qpR1
TCGATTCGTTCCTGGATCTT CCAGGCCCAGAATGTTCATA
SLC1A5 mRNA, BC123803.1 162
bRTP801qPF2 bRTP801qPR2
ACAGCAGCAACAGTGGCTTT ACCTGGCTCACCAGCTGAC
RTP801 mRNA, NM001075922.1 208
bCTGFF1 bCTGFR1
AGCTGACCTGGAGGAGAACA GTCTGTGCACACTCCGAAGA
CTGF mRNA, BC113279.1 138
bBCL2F1 bBCL2R1
CCTGTGGATGACCGAGTACC CCTTCAGAGACAGCCAGGAG
BCL2 mRNA, XM586976.3 133
bGDF5F1 bGDF5R1
AAGCGTATCACTGCGAAGGT CAAGTTGGAGGCGTTGATTC
GDF5 mRNA, AB004301.1 120
bPETF1 bPETR1
GGAAGATCCAGATGGTACTCCT TACACCTGGGAGCTGTGTGT
PET mRNA, BC123397.1 124
bFAB3F1 bFAB3R1
TGCAGAAGTGGAATGGACAA GCAGTCAGTGGAAGGAGAGG
Fatty acid binding protein 3 mRNA, BT021486.1
144
bFAB4F1 bFAB4R1
AATTGGGCCAGGAATTTGAT TGGTGGTTGATTTTCCATCC
Fatty acid binding protein 4 mRNA, NM174314.2
116
beNOSF1 beNOSR1
CACCTACCACCTCCGAGAGA ACATCTCCTGTGCTGAGCTG
nitric oxide synthase mRNA, M89952.1
141
1All sequences are written from 5’ to 3’. The top sequence of a pair of primers is the forward primer and the bottom sequence the reverse primer.

79
Table 3.2. Top 10 IGF-I upregulated genes in MAC-T cells
*RTP801, also named HIF1 (hypoxia-inducible factor 1)-responsive gene. RTP801 is strongly upregulated by hypoxia (Shoshani et al., 2002). When induced from a tetracycline-repressible promoter, RTP801 protected human epithelial breast carcinoma cells and rat pheochromocytoma cells from hypoxia in glucose-free medium and from H2O2-triggered apoptosis via a dramatic reduction in the generation of reactive oxygen species (ROS) (Brafman et al., 2004).
Hydroxymethylglutaryl-CoA synthase: (HMG-CoA synthase) catalyzes the condensation of acetyl-CoA with acetoacetyl-CoA to produce HMG-CoA and CoA].
FABP3 is fatty acid binding protein 3. It is a transport vehicle of fatty acids between the plasma membrane and mitochondria or peroxisomes for beta-oxidation, and between other cellular organelles for lipid synthesis (Peeters et al., 1991).
Gene name* GenBank # Ratio (IGF-I to PBS)
RTP801 CK846550 4.64
Hydroxymethylglutaryl-CoA synthase CK974002 4.58
FABP3 NM174313.2 3.91
phosphoserine aminotransferase CF763176 3.25
unknown CK960423 3.18
unknown CB166901 3.08
unknown CK949309 2.96
unknown BF774362 2.93
unknown CK847195 2.93
unknown CK972168 2.87

80
Table 3.3. Top 10 IGF-I downregulated genes in MAC-T cells
*GABA(A) receptor-associated protein like 1: Gamma-Aminobutyric acid type A receptors -associated protein like 1 (GABARAPL1), also called glandular epithelial cell protein 1 (GEC1) (Pellerin et al., 1993). The deduced 117-amino acid protein shares 87% identity with GABARAP (GABA(A)R-associated protein) (Vernier-Magnin et al., 2001). GABA(A)R mediate fast synaptic inhibition in brain and spinal cord. For efficient synaptic transmission, GABA(A)Rs need to be localized to and anchored at postsynaptic sites in precise apposition to presynaptic nerve terminals that release the neurotransmitter GABA (Kneussel, 2002).
Gene name* GenBank # Ratio (IGF-I to PBS)
unknown CB424375 0.17
connective tissue growth factor (CTGF) NM174030.2 0.22 unknown CK953351 0.22 unknown BP103230 0.27 unknown BF774834 0.29 unknown BP106018 0.30 GABA(A) receptor-associated protein like 1 CB440509 0.31 unknown CK772698 0.31 unknown CB533350 0.34 GABA(A) receptor-associated protein like 1 CK966100 0.35

81
Table 3.4. Validation of microarray data by real-time PCR of 10 mRNAs.
IGF-I caused changes (fold) in mRNA expression Gene* By Microarray By real-time PCR Description
CTGF 0.22 (P < 0.05) 0.15 (P < 0.01) connective tissue growth factor Cyclin D1 0.42 (P < 0.05) 0.77 (P = 0.37) cyclin-dependent kinase Cyclin D2 1.68 (P < 0.05) 1.59 (P < 0.05) cyclin-dependent kinase SLC1A5 1.73 (P < 0.05) 1.20 (P = 0.12) neutral amino acid transporter eNOS 1.76 (P < 0.05) Not detectable nitric oxide synthase PET 2.48 (P < 0.05) 5.03 (P < 0.05) pro- and anti-apoptotic activities BCL2 2.57 (P < 0.05) 0.99 (P = 0.99) apoptosis inhibitor FABP4 3.11 (P < 0.05) 4.23 (P < 0.01) fatty acid binding protein FABP3 3.91 (P < 0.05) 4.07 (P < 0.05) fatty acid binding protein RTP801 4.64 (P < 0.05) 9.21 (P = 0.08) pro- and anti-apoptotic activities *CTGF: Connective tissue growth factor, is multifunctional and involved in cell proliferation,
differentiation, migration, angiogenesis, and tumorigenesis (Lau and Lam, 1999). It is considered as one of IGF binding proteins (Kim et al., 1997)
Cyclin D: A member of the cyclin family that regulate cyclin dependent kinase type 4 and 6. Cyclin D plays a key regulatory role during the G1 phase of the cell cycle and its gene is amplified and overexpressed in many cancers (Sweeney et al., 1997).
SLC1A5: Solute carrier family 1 (neutral amino acid transporter), member 5. SLC1A5 is a glutamine transporter and involved in glutamine efflux from astrocytes (Brauers et al., 2005).
eNOS: Endothelial nitric oxide synthase. eNOS is important in synthesizing nitric oxide (NO) in endothelial cells from L-arginine. NO accounts for the biologic activity of endothelium-derived relaxing factor (EDRF) (Furchgott and Zawadzki, 1980), which is is important in regulation of vasomotor tone and blood flow by inhibiting smooth muscle contraction and platelet aggregation (Rapoport et al., 1983).
BCL2: A anti-apoptotic protein. Overexpression of Bcl-2 is known to block cytochrome c release, possibly through the inhibition of Bax and Bak (Chao and Korsmeyer, 1998).
FABP4: Fatty acid binding protein 4. It is expressed in human bronchial epithelial cells (HBE) and is strongly upregulated by both IL-4 and IL-13 and downregulated by IFN-gamma (Shum et al., 2006), suggesting a role in allergic airway inflammation. FABP4 is an effective therapeutic agent against severe atherosclerosis and type 2 diabetes in mouse models (Furuhashi et al., 2007).

82
A.
00.10.20.30.40.50.60.70.8
Abs
orba
nce
at 5
70 n
m PBS
IGF-I 200 ng/mL
CTGF 200 ng/mL
CTGF 200 ng/mL+ IGF-I 200 ng/mL10% FBS
A A
B BC
B.
0
0.1
0.2
0.3
0.4
0.5
0.6
0.7
0.8
0.9
Abs
orba
nce
at 5
70 n
m
PBS
IGF-I 200 ng/mL
IGF-I 200 ng/mL +CTGF 200 ng/mLIGF-I 300 ng/mL+CTGF 200 ng/mLIGF-I 400 ng/mL +CTGF 200 ng/mLIGF-I 500 ng/mL +CTGF 200 ng/mL
E
D
C
BCBA
A
1 2 3 4 5 6
Figure 3.1. Effect of CTGF on IGF-I induced cell proliferation. (A) After 8 h serum starvation, MAC-T cells were incubated with 1) PBS, 2) 200 ng/mL IGF-I, 3) 200 ng/mL CTGF, 4) 200 ng/mL IGF-I + 200 ng/mL CTGF, or 5) 10% FBS for 16 h. Nonradioactive CellTiter 96 assay was performed after these treatments. (B) Incubation of MAC-T cells with PBS, 200 ng/mL IGF-I, or 200 ng/mL CTGF and increasing concentration of IGF-I for 16 h followed by cell proliferation assay. Values are expressed as means ± SEM (n = 4). Means with different letters are significantly different (P < 0.05).

83
A. B.
Total IGF-IR
00.20.40.60.8
11.21.41.61.8
PBS IGF IGF+CTGF CTGF
Rel
ativ
e ab
unda
nce
Figure 3.2. Effect of CTGF on IGF-I activation of IGF-I receptor (IGF-IR). MAC-T cells were treated with: 1) PBS; 2) 200 ng/mL of IGF-I; 3) 200 ng/mL of IGF-I + 200 ng/mL of CTGF; 4) 200 ng/mL of CTGF for 1 h. Total cell lysates were extracted from the cells and phospho-IGF-IR and total IGF-IR were detected by Western blotting using specific antibodies. (A) Representative images of Western blotting analysis. (B) Densitometric analysis of the phopho-IGF-IR and total IGF-IR protein bands like those in Panels A from 3 experiments. The density of phospho-IGF-IR and total IGF-IR bands was normalized to that of beta-actin protein in the same sample. There was no difference in phospho-IGF-IR expression between IGF-I and IGF-I plus CTGF samples (P = 0.88). Values are expressed as means ± SEM (n = 3).
phospho-IGF-IR
00.10.20.30.40.50.60.70.80.9
1
PBS IGF IGF+CTGF CTGF
Rel
ativ
e ab
unda
nce
PBS IGF-I IGF-I CTGF+CTGF
Phospho-IGF-IR
Total IGF-IR
Β-actin
PBS IGF-I IGF-I CTGF+CTGF
Phospho-IGF-IR
Total IGF-IR
Β-actin

84
A
β
α
IGF-IRPP
P
P
β
P85
P70S6K
IRSP110
Akt
mTOR
PI3K
BAD
Apoptosis
Protein synthesis
CTGF mRNA
expression
MEK1/2
Raf1
Ras
Grb2
ERK/MAPK
SHC
SOS
FKHRGSK-3
Β-catenin
α PD98059LY294002
Rapamycin
IGF-I
B
00.10.20.30.40.50.60.70.8
PBS+DMSOIG
F-I
Rapamyc
in
Ly2940
02
PD9805
9
IGF-I+
Rapam
ycin
IGF-I+
LY29400
2
IGF-I+
PD98059
CTG
FR
elat
ive
abun
danc
e
BC
D
A
BCDCD
B
D
B
Figure 3.3. Identification of signaling pathways mediating IGF-I inhibition of CTGF expression. A, specific inhibitors of the signaling pathways from IGF-IR, including MEK1/2 inhibitor PD98059, PI-3K/Akt inhibitor LY294002 and mTOR inhibitor Rapamycin. B, real-time PCR of CTGF mRNA. MAC-T cells were treated with 1) PBS + DMSO (as control), 2) 200 ng/mL IGF-I, 3) 20 µM Rapamycin, 4) 50 µM LY294002, 5) 50 µM PD98059, 6) 200 ng/mL IGF-I + 20 µM Rapamycin, 7) 200 ng/mL IGF-I + 50 µM LY294002, 8) 200 ng/mL IGF-I + 50 µM PD98059 for 16 h. Real-time PCR was performed to quantify CTGF mRNA expression. Values are expressed as means ± SEM (n = 3). Means with different letters were significantly different (P < 0.05).
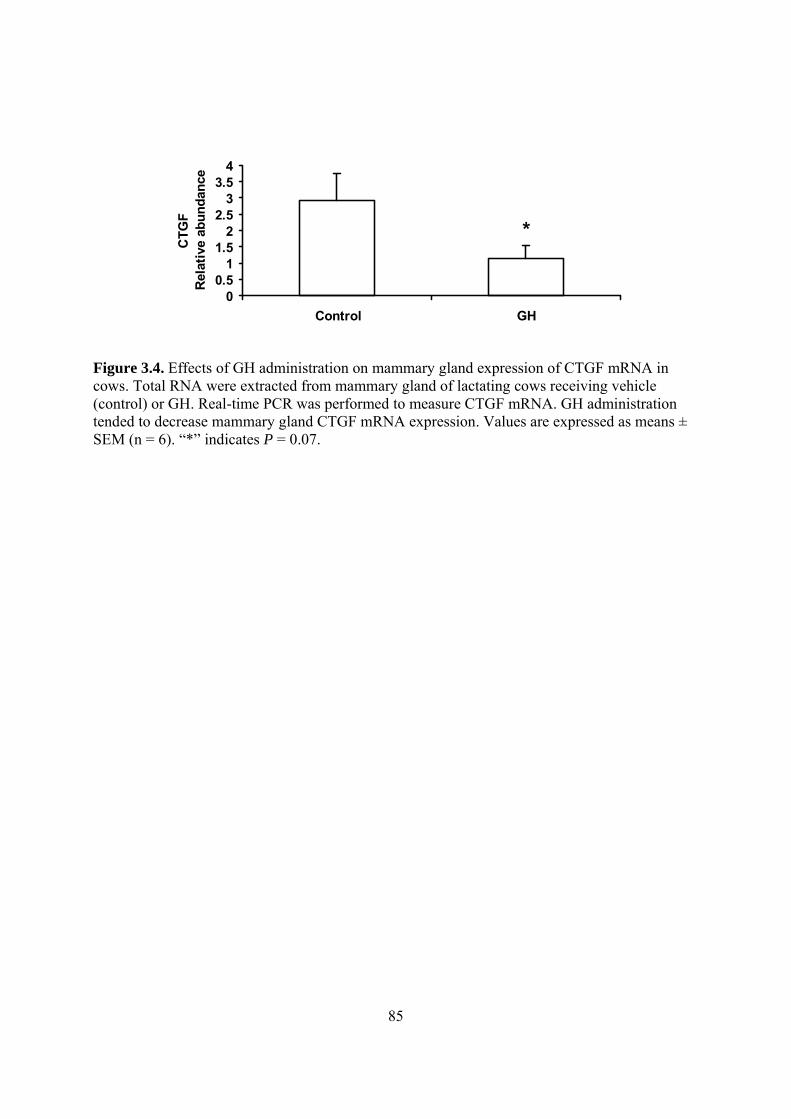
85
00.5
11.5
22.5
33.5
4
Control GH
CTG
FR
elat
ive
abun
danc
e
*
Figure 3.4. Effects of GH administration on mammary gland expression of CTGF mRNA in cows. Total RNA were extracted from mammary gland of lactating cows receiving vehicle (control) or GH. Real-time PCR was performed to measure CTGF mRNA. GH administration tended to decrease mammary gland CTGF mRNA expression. Values are expressed as means ± SEM (n = 6). “*” indicates P = 0.07.

86
0
0.5
1
1.5
2
PBS GH
CTG
FR
elat
ive
abun
danc
e
Figure 3.5. Effect of GH on CTGF mRNA expression in MAC-T cells. MAC-T cells were transfected with GHR and STAT5 expression plasmids to be GH responsive. The cells were treated with PBS or GH for 16h. Real-time PCR was performed to measure CTGF mRNA. GH had no effect on CTGF mRNA expression in these cells (P = 0.88). Values were expressed as means ± SEM (n = 4).

87
Chapter IV A Milk Trait-Associated Polymorphism in the Bovine
Growth Hormone Receptor Gene Does Not Affect Receptor
Signaling
Abstract
Growth hormone (GH), also known as somatotropin, stimulates milk production in cows.
At the tissue level, the action of GH is mediated by the GH receptor (GHR) and the receptor-
activated intracellular signaling pathway involving Janus kinase 2 (JAK2) and signal transducer
and activator of transcription 5 (STAT5). A T to A nucleotide variation in exon 8 of the bovine
GHR gene, resulting in a phenylalanine to tyrosine change at a residue of the transmembrane
domain of the GHR protein, has been reported to be associated with a major affect on milk yield
in cows. The objective of this study was to determine whether the two versions of GHR differ in
mediating GH-induced STAT5 activation of gene expression. We created cDNA expression
plasmids for the two versions of GHR and cotransfected each of them with a STAT5 expression
plasmid and a luciferase reporter gene construct containing STAT5 binding sites into two
different cell lines. Treatment of the transfected cells with various concentrations of GH
triggered a dose-dependent increase in luciferase activity. However, the GH-induced luciferase
activity was not different (P > 0.05) between the two GHR expression plasmids, indicating that
the two GHR forms do not differ in mediating GH-induced STAT5 activation of gene expression.
Thus, if the T/A polymorphism in exon 8 of the GHR gene has a causative effect on milk
production, this effect is unlikely mediated by the JAK2-STAT5 pathway, the currently known
major signaling pathway from the growth hormone receptor.

88
Key words: single nucleotide polymorphism, growth hormone receptor, milk production

89
Introduction
Growth hormone (GH), also known as somatotropin, is a major stimulator of postnatal
growth and milk production in cattle (Etherton and Bauman, 1998). At the tissue level, the GH
action is mediated by a specific cell membrane receptor, the growth hormone receptor (GHR).
Binding of GH to GHR activates Janus kinase 2 (JAK2); activated JAK2 in turn activates signal
transducer and activator of transcription 5 (STAT5) through phosphorylation. Phosphorylated
STAT5 translocates from the cytoplasm to the nucleus, where it binds to specific DNA regions
and thereby activates transcription (Herrington and Carter-Su, 2001). A well-known gene
controlled by GH through this JAK2-STAT5 pathway is insulin-like growth factor-I (IGF-I),
which is believed to mediate most of the growth- and at least part of the milk production-
stimulating effect of GH (Stewart and Rotwein, 1996; Etherton and Bauman, 1998). In addition
to STAT5, GH-activated JAK2 also phosphorylates insulin receptor substrate 1, phospholipase C,
and SHC protein, leading to changes in gene expression, enzymatic activity or metabolite
transport (Herrington and Carter-Su, 2001).
Predicted from its cDNA sequence (Hauser et al., 1990), the bovine GHR protein is a
single-chain polypeptide of 634 amino acids, composed of an 18-aa signal peptide (not present in
mature GHR protein) encoded by exon 2 of the GHR gene, a 242-aa extracellular domain
encoded by exons 3 to 7, a 24-aa single transmembrane domain encoded by exon 8, and a 350-aa
intracellular domain encoded by exons 9 and 10. The bovine GHR mRNA is heterogeneous in
the 5’-untranslated region, due to initiation of transcription from different leader exons (or
alternative exon 1) and alternative splicing (Jiang and Lucy, 2001). Because the action of GH
depends on GHR, genetic variations in the GHR gene might change the GHR amino acid

90
sequence or expression level, thereby affecting GH-controlled traits such as growth and milk
production in animals. The 279th residue of GHR, a residue located on the transmembrane
domain (Figure 4.1) of the GHR protein, is encoded by the exon 8 of the bovine GHR gene. A T
to A single nucleotide variation in exon 8 of the bovine GHR gene (the corresponding two GHR
DNA or cDNA forms are designated GHR-E8(T) and GHR-E8(A)), results in a phenylalanine
(F) to tyrosine (Y) change at the 279th residue of GHR. Through quantitative trait loci (QTL)
mapping, Blott et al. (2003) found this single nucleotide polymorphism of the 279th reside was
associated with a major effect on milk yield in Ayreshire, Holstein and Jersey cows. The cows
with GHR279Y appear to produce ~200 kg more milk annually than the cows carrying
GHR279F (Blott et al., 2003). The same authors also indicated that the single nucleotide
polymorphism had a similar effect on live weight in cattle (Blott et al., 2003).
Given the well-known effect of GH on milk production in cows, an obvious hypothesis
for why GHR279Y is associated with greater milk yield than GHR279F is that GHR279Y
mediates greater GH action than GHR279F. In this study we compared the ability of GHR279Y
and GHR279F to mediate GH-induced STAT5 activation of gene expression in both MAC-T and
CHO cell cultures.
Materials and Methods
Constructs preparation
In a previous study (Wang and Jiang, 2005), a 2026-bp bovine GHR cDNA (GenBank
accession number AY748827) containing the entire open reading frame for the 634-aa GHR
protein from a Holstein cow was cloned into the expression vector pcDNA3.1 (Invitrogen,
Carlsbad, California) between the EcoR V and Xba I restriction sites. The nucleotide at the

91
polymorphic position of exon 8 in this GHR cDNA was T (nucleotide 914 in GenBank accession
number AY748827) and, for the purpose of this study, this expression plasmid was renamed
bGHR-E8 (T)/pcDNA3. We mutated T at the polymorphic position in bGHR-E8 (T)/pcDNA3 to
A, generating bGHR-E8 (A)/pcDNA3. The mutagenesis was done by three rounds of PCR, using
a mixture (10:1) of Taq DNA polymerase and high fidelity DNA polymerase Tli (Promega,
Madison, WI). The first PCR amplified the GHR cDNA region 1 to 924 (in GenBank accession
number AY748827), using forward primer 5’-GCCATAAAGCCTGGAGGAAC-3’ and reverse
primer 5’-TATGAGTAAATATAATGTCACTGCTAGC-3’, where the nucleotide in boldface
was the incorporated mutation; the second PCR amplified the GHR cDNA region 903 to 2026
(in GenBank accession number AY748827), using forward primer 5’-
AGTGACATTATATTTACTCATATTTTC-3’ (the nucleotide in boldface was the incorporated
mutation) and reverse primer 5’-TCTCTCTAGACCTGTGCCATTCAA TGGGTAG-3’, where
the sequence underlined is a Xba I restriction site. The products of these two PCR were mixed
and from this mixture, the 2026-bp GHR-E8 (A) cDNA was amplified by the third PCR, using
the same forward primer as used in the first PCR and the same reverse primer as used in the
second PCR. The product of the third PCR was cloned into pcDNA3.1 between the EcoR V and
Xba I sites, generating bGHR-E8 (A)/pcDNA3. The GHR cDNA insert in this plasmid was
sequenced completely to confirm that it differed from GHR-E8 (T) cDNA only at the
polymorphic nucleotide position of exon 8 (Figure 4.1).
Transfection and Luciferase assay
We then cotransfected 0.2 µg of bGHR-E8(T)/pcDNA3 or bGHR-E8(A)/pcDNA3 or
pcDNA3.1 (no-GHR control), 0.2 µg of a STAT5b expression plasmid (Ariyoshi et al., 2000),
0.2 µg of pSPI-LUC, a firefly luciferase reporter plasmid that contained a growth hormone

92
response element consisting of six copies of STAT5 binding site from the Spi 2.1 gene (Wood et
al., 1997), and 0.5 ng of pRL-CMV, a Renilla luciferase-encoding plasmid for transfection
efficiency control, into Chinese hamster ovary-derived cell line CHO (American Tissue Culture
Collection, Manassas, VA) and MAC-T, using FuGENE6 (Roche, Indianapolis, IN) as
transfection reagent. Both CHO and MAC-T cells were cultured in 24-well plates in Dulbecco’s
modified Eagle’s medium (DMEM) supplemented with 10% fetal bovine serum at 37 °C under
5% CO2. In both cell lines, endogenous GHR expression was undetectable (Emtner et al., 1990;
Jiang et al., unpublished data, respectively). Twenty-four hours after transfection, the medium
was replaced with serum-free DMEM, and the culture was continued for 16 hours. The
transfected cells were subsequently treated with different concentrations of recombinant bovine
GH (provided by Dr. A. F. Parlow, National Hormone & Peptide Program) or phosphate
buffered saline (PBS), the vehicle for GH, for 8 hours before being lysed for dual-luciferase
assay (Promega). Such transfection analysis was repeated four times in CHO cells and three
times in MAC-T cells. The luciferase activity expressed from the pSPI-LUC construct was
divided by that from pRL-CMV in the same well to normalize well-to-well variation in
transfection efficiency.
Statistical analysis
The adjusted luciferase activity data for the same GHR construct were compared between
different concentrations of GH by one-factor ANOVA, followed by the Tukey’s procedure. The
adjusted luciferase activity data for the two different GHR constructs at each GH concentration
were compared by the t-Test. Differences at P < 0.05 were considered significant.

93
Results and Discussion
As shown in Fig 4.2, GH caused a dose-dependent increase in luciferase activity, with
significant induction (P < 0.05) starting to occur at 5 ng/mL, in both CHO and MAC-T cells.
This response was dependent on the GHR cDNA plasmid, because GH treatment failed to induce
luciferase expression when the GHR expression plasmid was omitted in the transfection (Figure
4.2). The CHO or MAC-T cells transfected with bGHR-E8(T)/pcDNA3 and the same type of
cells transfected with bGHR-E8(A)/pcDNA3 expressed similar levels (P > 0.05) of luciferase
activity in response to various GH concentrations (Figure 4.2), indicating that the two versions of
GHR, GHR279Y and GHR279F, expected to be expressed from bGHR-E8(A)/pcDNA3 and
bGHR-E8(T)/pcDNA3, respectively, did not differ in mediating GH-induced STAT5 activation
of reporter gene expression in CHO or MAC-T cells.
Some genotypes appear to be obvious candidates for selection aiming at improving milk
production traits. SSCP analysis revealed in Serra da Estrela sheep, GH2-N and GH2-Z
genotypes affect milk yield significantly, and the apparent joint effect of GH2-N and GH2-Z
genotype could improve milk yield by 25% as compared with the mean milk production of the
analyzed population (Marques et al., 2006). Milk protein such as κ-casein and β-LG genotypes
can influence milk traits (Tsiaras et al., 2005). The AB κ-CN genotype had a positive effect on
protein yield and content. The B variant of β-LG was associated with higher milk yield, and fat
yield and content.
That GHR279Y and GHR279F do not differ in mediating GH activation of JAK2-STAT5
signaling is perhaps not surprising, because the 279th residue of the receptor is located in the
transmembrane domain (Figure 4.1), a region that is not involved in association with JAK2 or
any other known intracellular signaling components (Argetsinger and Carter-Su, 1996). Hence, if
94
the T/A nucleotide polymorphism in exon 8 of the GHR gene has a causative effect on milk
production in cows, this effect is unlikely mediated by the JAK2-STAT5 signaling pathway, the
currently known major signaling pathway from the growth hormone receptor (Herrington and
Carter-Su, 2001). Besides a cause-effect relationship, the association between GHR sequence
variation and changes in milk yield could be due to linkage disequilibrium of the GHR gene with
proximal alleles that control the apparently GH-controlled traits.
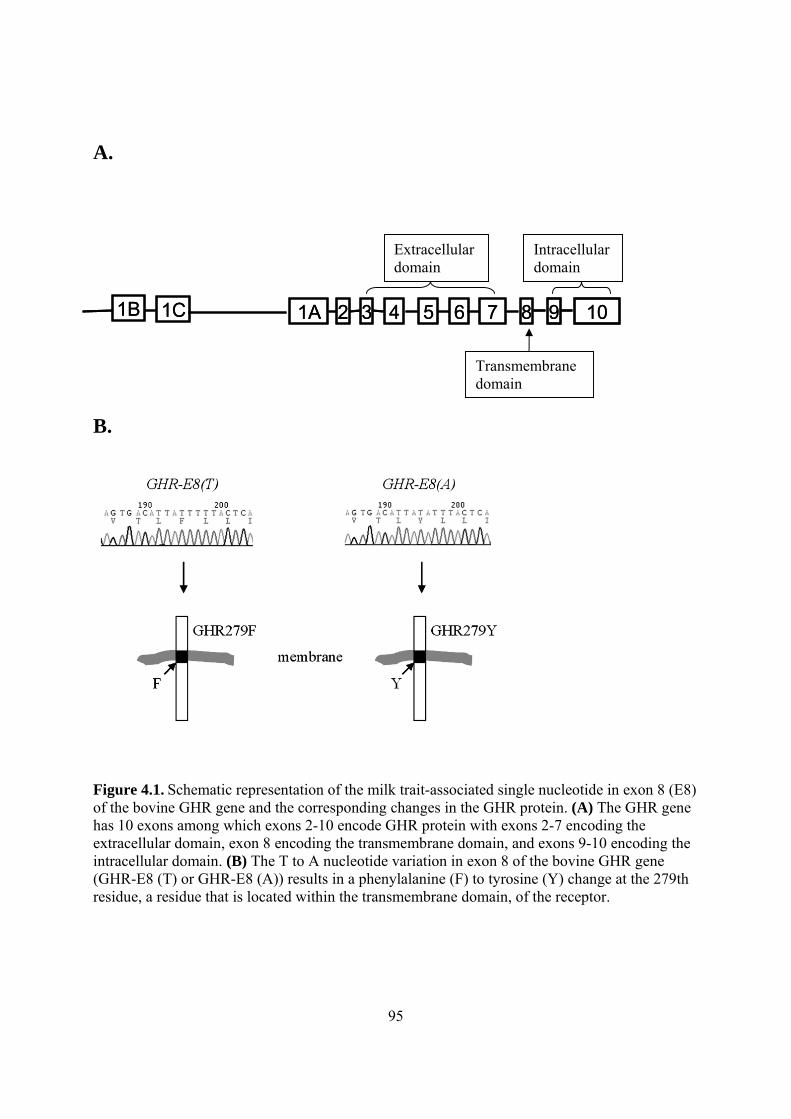
95
A.
B.
Figure 4.1. Schematic representation of the milk trait-associated single nucleotide in exon 8 (E8) of the bovine GHR gene and the corresponding changes in the GHR protein. (A) The GHR gene has 10 exons among which exons 2-10 encode GHR protein with exons 2-7 encoding the extracellular domain, exon 8 encoding the transmembrane domain, and exons 9-10 encoding the intracellular domain. (B) The T to A nucleotide variation in exon 8 of the bovine GHR gene (GHR-E8 (T) or GHR-E8 (A)) results in a phenylalanine (F) to tyrosine (Y) change at the 279th residue, a residue that is located within the transmembrane domain, of the receptor.
2 3 4 5 6 7 8 9 10 1A1B 1C
2 3 4 5 6 7 8 9 10 1A1B 1C
Extracellular domain
Intracellular domain
Transmembrane domain

96
Figure 4.2. Comparison of the abilities of GHR279F and GHR279Y to mediate growth hormone-induced STAT5 activation of reporter gene expression. Chinese hamster ovary cell line CHO and bovine mammary epithelial cell line MAC-T were transfected with a STAT5b expression plasmid, a STAT5 binding site-containing reporter gene plasmid, a transfection efficiency control plasmid, and a GHR279F-encoding plasmid (GHR279F) or a GHR279Y-encoding plasmid (GHR279Y) or the pcDNA3.1 plasmid that did not contain GHR cDNA insert (NO-GHR). The transfected cells were treated with indicated concentrations of recombinant bovine GH for 8 hours (the NO-GHR cells were treated with 500 ng/mL GH only), followed by dual-luciferase assay. Values are expressed as mean ± standard error of the mean. Growth hormone caused a dose-dependent activation of luciferase reporter gene expression in both cell types and this activation depended on inclusion of the GHR expression plasmid in the transfection. Within each cell type, GH-induced luciferase activity was not different (P > 0.05) between GHR279F and GHR279Y.

97
Conclusions
It has been known for decades that GH stimulates milk production in cows, but the
underlying mechanism is not clear. Many previous studies in this field suggest that the effect of
GH on milk production is mediated by IGF-I. The results of this dissertation research suggest
that GH can also directly stimulate milk protein gene expression in the mammary gland, thereby
increasing milk production. It has also been well established that IGF-I can stimulate mammary
epithelial cell proliferation, thereby mediating GH stimulation of milk production. The results of
this dissertation research suggest that IGF-I may stimulate mammary epithelial cell proliferation
partly by decreasing CTGF mRNA expression in the mammary epithelial cells because CTGF
can attenuate IGF-I stimulation of proliferation of MAC-T cells. The results of this dissertation
also indicated that IGF-I inhibits CTGF mRNA expression in MAC-T cells through the PI-3
kinase/Akt signaling pathway from the IGF-IR and that CTGF may attenuate IGF-I stimulation
of mammary epithelial cell proliferation through a postreceptor inhibition of the IGF-IR
signaling pathway. Finally, the results of this dissertation research suggest that a milk yield-
associated polymorphism in the GHR exon 8 does not affects signaling transduction from the
GHR and hence unlikely directly affect milk production.

98
Literature Cited
Ahmed, N. N., H. L. Grimes, A. Bellacosa, T. O. Chan, and P. N. Tsichlis. 1997. Transduction of interleukin-2 antiapoptotic and proliferative signals via akt protein kinase. Proc Natl Acad Sci U S A 94: 3627-3632.
Akers, R. M. 1985. Lactogenic hormones: Binding sites, mammary growth, secretory cell differentiation, and milk biosynthesis in ruminants. J Dairy Sci 68: 501-519.
Akers, R. M. 2002. Lactation and the mammary gland. 22-23.
Akers, R. M. 2006. Major advances associated with hormone and growth factor regulation of mammary growth and lactation in dairy cows. J Dairy Sci 89: 1222-1234.
Akers, R. M., S. E. Ellis, and S. D. Berry. 2005. Ovarian and igf-i axis control of mammary development in prepubertal heifers. Domest Anim Endocrinol 29: 259-267.
Alexander, L. J., A. F. Stewart, A. G. Mackinlay, T. V. Kapelinskaya, T. M. Tkach, and S. I. Gorodetsky. 1988. Isolation and characterization of the bovine kappa-casein gene. Eur J Biochem 178: 395-401.
Anderson, R. R. 1976. Relation between mammary gland development and body weight. J Dairy Sci 59: 1518-1521.
Argetsinger, L. S., G. S. Campbell, X. Yang, B. A. Witthuhn, O. Silvennoinen, J. N. Ihle, and C. Carter-Su. 1993. Identification of jak2 as a growth hormone receptor-associated tyrosine kinase. Cell 74: 237-244.
Argetsinger, L. S., and C. Carter-Su. 1996. Growth hormone signalling mechanisms: Involvement of the tyrosine kinase jak2. Horm Res 45 Suppl 1: 22-24.
Ariyoshi, K., T. Nosaka, K. Yamada, M. Onishi, Y. Oka, A. Miyajima, and T. Kitamura. 2000. Constitutive activation of stat5 by a point mutation in the sh2 domain. J Biol Chem 275: 24407-24413.
Athie, F., K. C. Bachman, H. H. Head, M. J. Hayen, and C. J. Wilcox. 1996. Estrogen administered at final milk removal accelerates involution of bovine mammary gland. J Dairy Sci 79: 220-226.
Barber, M. C., R. A. Clegg, E. Finley, R. G. Vernon, and D. J. Flint. 1992. The role of growth hormone, prolactin and insulin-like growth factors in the regulation of rat mammary gland and adipose tissue metabolism during lactation. J Endocrinol 135: 195-202.
Barres, B. A., R. Schmid, M. Sendnter, and M. C. Raff. 1993. Multiple extracellular signals are required for long-term oligodendrocyte survival. Development 118: 283-295.

99
Barrett-Lee, P., M. Travers, Y. Luqmani, and R. C. Coombes. 1990. Transcripts for transforming growth factors in human breast cancer: Clinical correlates. Br J Cancer 61: 612-617.
Bauman, D. E. 1992. Bovine somatotropin: Review of an emerging animal technology. J Dairy Sci 75: 3432-3451.
Bauman, D. E., and W. B. Currie. 1980. Partitioning of nutrients during pregnancy and lactation: A review of mechanisms involving homeostasis and homeorhesis. J Dairy Sci 63: 1514-1529.
Bauman, D. E., and J. M. Griinari. 2003. Nutritional regulation of milk fat synthesis. Annu Rev Nutr 23: 203-227.
Baumrucker, C. R., and B. H. Stemberger. 1989. Insulin and insulin-like growth factor-I stimulate DNA synthesis in bovine mammary tissue in vitro. J Anim Sci 67: 3503-3514.
Baxter, R. C., M. A. Binoux, D. R. Clemmons, C. A. Conover, S. L. Drop, J. M. Holly, S. Mohan, Y. Oh, and R. G. Rosenfeld. 1998. Recommendations for nomenclature of the insulin-like growth factor binding protein superfamily. Endocrinology 139: 4036.
Bell, G. I., T. Kayano, J. B. Buse, C. F. Burant, J. Takeda, D. Lin, H. Fukumoto, and S. Seino. 1990. Molecular biology of mammalian glucose transporters. Diabetes Care 13: 198-208.
Berg, J. M., J. L. Tymoczko, and L. Stryer. 2002. BIochemistry.
Berry, S. D., T. B. McFadden, R. E. Pearson, and R. M. Akers. 2001. A local increase in the mammary IGF-I: IGFBP-3 ratio mediates the mammogenic effects of estrogen and growth hormone. Domest Anim Endocrinol 21: 39-53.
Beyer, E. C., and S. H. Barondes. 1982. Quantitation of two endogenous lactose-inhibitable lectins in embryonic and adult chicken tissues. J Cell Biol 92: 23-27.
Blum, J. W. 1992. [physiological basis of high milk production in cattle]. Schweiz Arch Tierheilkd 134: 213-229.
Bolander, F. F., Jr., and Y. J. Topper. 1980. Stimulation of lactose synthetase activity and casein synthesis in mouse mammary explants by estradiol. Endocrinology 106: 490-495.
Bonnette, S. G., and D. L. Hadsell. 2001. Targeted disruption of the IGF-I receptor gene decreases cellular proliferation in mammary terminal end buds. Endocrinology 142: 4937-4945.
Borst, D. W., and W. B. Mahoney. 1982. Mouse mammary gland DNA synthesis during pregnancy. The Journal of experimental zoology 221: 245-250.
Boutinaud, M., J. Guinard-Flamenta, and H. Jammes. 2004. The number and activity of mammary epithelial cells, determining factors for milk production. Reprod Nutr Dev 44: 499-508.
100
Boutinaud, M., C. Rousseau, D. H. Keisler, and H. Jammes. 2003. Growth hormone and milking frequency act differently on goat mammary gland in late lactation. J Dairy Sci 86: 509-520.
Brafman, A., I. Mett, M. Shafir, H. Gottlieb, G. Damari, S. Gozlan-Kelner, V. Vishnevskia-Dai, R. Skaliter, P. Einat, A. Faerman, E. Feinstein, and T. Shoshani. 2004. Inhibition of oxygen-induced retinopathy in rtp801-deficient mice. Investigative ophthalmology & visual science 45: 3796-3805.
Brauers, E., U. Vester, K. Zerres, and T. Eggermann. 2005. Search for mutations in slc1a5 (19q13) in cystinuria patients. Journal of inherited metabolic disease 28: 1169-1171.
Brazil, D. P., J. Park, and B. A. Hemmings. 2002. Pkb binding proteins. Getting in on the akt. Cell 111: 293-303.
Brew, K., T. C. Vanaman, and R. L. Hill. 1968. The role of alpha-lactalbumin and the a protein in lactose synthetase: A unique mechanism for the control of a biological reaction. Proc Natl Acad Sci U S A 59: 491-497.
Brodbeck, U., W. L. Denton, N. Tanahashi, and K. E. Ebner. 1967. The isolation and identification of the b protein of lactose synthetase as alpha-lactalbumin. J Biol Chem 242: 1391-1397.
Burnol, A. F., A. Leturque, M. Loizeau, C. Postic, and J. Girard. 1990. Glucose transporter expression in rat mammary gland. Biochem J 270: 277-279.
Butler, A. A., and D. Le Roith. 2001. Control of growth by the somatropic axis: Growth hormone and the insulin-like growth factors have related and independent roles. Annual review of physiology 63: 141-164.
Camps, M., S. Vilaro, X. Testar, M. Palacin, and A. Zorzano. 1994. High and polarized expression of glut1 glucose transporters in epithelial cells from mammary gland: Acute down-regulation of glut1 carriers by weaning. Endocrinology 134: 924-934.
Capuco, A. V., J. E. Keys, and J. J. Smith. 1989. Somatotrophin increases thyroxine-5'-monodeiodinase activity in lactating mammary tissue of the cow. J Endocrinol 121: 205-211.
Capuco, A. V., D. L. Wood, R. Baldwin, K. McLeod, and M. J. Paape. 2001. Mammary cell number, proliferation, and apoptosis during a bovine lactation: Relation to milk production and effect of bst. J Dairy Sci 84: 2177-2187.
Carter-Su, C., and L. S. Smit. 1998. Signaling via jak tyrosine kinases: Growth hormone receptor as a model system. Recent Prog Horm Res 53: 61-82; discussion 82-63.
Chao, D. T., and S. J. Korsmeyer. 1998. Bcl-2 family: Regulators of cell death. Annual review of immunology 16: 395-419.
101
Chatterton, R. T., Jr. 1978. Mammary gland: Development and secretion. Obstetrics and gynecology annual 7: 303-324.
Chen, M. M., A. Lam, J. A. Abraham, G. F. Schreiner, and A. H. Joly. 2000. Ctgf expression is induced by tgf- beta in cardiac fibroblasts and cardiac myocytes: A potential role in heart fibrosis. Journal of molecular and cellular cardiology 32: 1805-1819.
Chien, W., D. Yin, D. Gui, A. Mori, J. M. Frank, J. Said, D. Kusuanco, A. Marchevsky, R. McKenna, and H. P. Koeffler. 2006. Suppression of cell proliferation and signaling transduction by connective tissue growth factor in non-small cell lung cancer cells. Mol Cancer Res 4: 591-598.
Choi, Y. J., W. L. Keller, I. E. Berg, C. S. Park, and A. G. Mackinlay. 1988. Casein gene expression in bovine mammary gland. J Dairy Sci 71: 2898-2903.
Cohick, W. S. 1998. Role of the insulin-like growth factors and their binding proteins in lactation. J Dairy Sci 81: 1769-1777.
Cohick, W. S., and D. R. Clemmons. 1993. The insulin-like growth factors. Annual review of physiology 55: 131-153.
Coleman, S., G. B. Silberstein, and C. W. Daniel. 1988. Ductal morphogenesis in the mouse mammary gland: Evidence supporting a role for epidermal growth factor. Dev Biol 127: 304-315.
Combes, S., I. Louveau, and M. Bonneau. 1997. Effect of gh administration on gh and IGF-I receptors in porcine skeletal muscle and liver in relation to plasma gh-binding protein. J Endocrinol 155: 19-26.
Cox, D. A., and R. R. Burk. 1991. Isolation and characterisation of milk growth factor, a transforming-growth-factor-beta 2-related polypeptide, from bovine milk. Eur J Biochem 197: 353-358.
Cox, L. A., N. Schlabritz-Loutsevitch, G. B. Hubbard, M. J. Nijland, T. J. McDonald, and P. W. Nathanielsz. 2006. Gene expression profile differences in left and right liver lobes from mid-gestation fetal baboons: A cautionary tale. J Physiol 572: 59-66.
Craig, R. K., A. P. Boulton, and P. N. Campbell. 1978. Intracellular mechanisms involved in the biosynthesis of milk proteins. Biochem Soc Trans 6: 501-505.
Cseh, R., and R. Benz. 1999. Interaction of phloretin with lipid monolayers: Relationship between structural changes and dipole potential change. Biophysical journal 77: 1477-1488.
Damm, H. C., and C. W. Turner. 1958. Effects of hormone dose and length of injection on mouse mammary gland growth. Proc Soc Exp Biol Med 98: 192-195.

102
Davidson, M. B. 1987. Effect of growth hormone on carbohydrate and lipid metabolism. Endocr Rev 8: 115-131.
Davis, A. J., I. R. Fleet, J. A. Goode, M. H. Hamon, F. M. Walker, and M. Peaker. 1979. Changes in mammary function at the onset of lactation in the goat: Correlation with hormonal changes. J Physiol 288: 33-44.
Davis, S. R., R. J. Collier, J. P. McNamara, H. H. Head, W. J. Croom, and C. J. Wilcox. 1988. Effects of thyroxine and growth hormone treatment of dairy cows on mammary uptake of glucose, oxygen and other milk fat precursors. J Anim Sci 66: 80-89.
Deome, K. B., L. J. Faulkin, Jr., H. A. Bern, and P. B. Blair. 1959. Development of mammary tumors from hyperplastic alveolar nodules transplanted into gland-free mammary fat pads of female c3h mice. Cancer Res 19: 515-520.
Deugnier, M. A., M. M. Faraldo, B. Janji, P. Rousselle, J. P. Thiery, and M. A. Glukhova. 2002. EGF controls the in vivo developmental potential of a mammary epithelial cell line possessing progenitor properties. J Cell Biol 159: 453-463.
Dimitriadis, G., M. Parry-Billings, S. Bevan, D. Dunger, T. Piva, U. Krause, G. Wegener, and E. A. Newsholme. 1992. Effects of insulin-like growth factor i on the rates of glucose transport and utilization in rat skeletal muscle in vitro. Biochem J 285 ( Pt 1): 269-274.
Divisova, J., I. Kuiatse, Z. Lazard, H. Weiss, F. Vreeland, D. L. Hadsell, R. Schiff, C. K. Osborne, and A. V. Lee. 2006. The growth hormone receptor antagonist pegvisomant blocks both mammary gland development and mcf-7 breast cancer xenograft growth. Breast Cancer Res Treat.
Dvorak, P., D. Dvorakova, and A. Hampl. 2006. Fibroblast growth factor signaling in embryonic and cancer stem cells. FEBS Lett 580: 2869-2874.
Etherton, T. D., and D. E. Bauman. 1998. Biology of somatotropin in growth and lactation of domestic animals. Physiological reviews 78: 745-761.
Evan, G. I., and K. H. Vousden. 2001. Proliferation, cell cycle and apoptosis in cancer. Nature 411: 342-348.
Evans, H. M., and L. A. Long. 1921. The effect of the anterior lobe of the hypophysis administered intraperitoneally upon growth and maturity and estrous cycles of the rat. Anat Record 21: 62.
Faulkin, L. J., Jr., and K. B. Deome. 1960. Regulation of growth and spacing of gland elements in the mammary fat pad of the c3h mouse. J Natl Cancer Inst 24: 953-969.
Firth, S. M., and R. C. Baxter. 2002. Cellular actions of the insulin-like growth factor binding proteins. Endocr Rev 23: 824-854.

103
Flint, D. J., and M. Gardner. 1994. Evidence that growth hormone stimulates milk synthesis by direct action on the mammary gland and that prolactin exerts effects on milk secretion by maintenance of mammary deoxyribonucleic acid content and tight junction status. Endocrinology 135: 1119-1124.
Flint, D. J., E. Tonner, and G. J. Allan. 2000. Insulin-like growth factor binding proteins: Igf-dependent and -independent effects in the mammary gland. J Mammary Gland Biol Neoplasia 5: 65-73.
Forsyth, I. A. 1996. The insulin-like growth factor and epidermal growth factor families in mammary cell growth in ruminants: Action and interaction with hormones. J Dairy Sci 79: 1085-1096.
Furchgott, R. F., and J. V. Zawadzki. 1980. The obligatory role of endothelial cells in the relaxation of arterial smooth muscle by acetylcholine. Nature 288: 373-376.
Furuhashi, M., G. Tuncman, C. Z. Gorgun, L. Makowski, G. Atsumi, E. Vaillancourt, K. Kono, V. R. Babaev, S. Fazio, M. F. Linton, R. Sulsky, J. A. Robl, R. A. Parker, and G. S. Hotamisligil. 2007. Treatment of diabetes and atherosclerosis by inhibiting fatty-acid-binding protein ap2. Nature 447: 959-965.
Gao, J., and G. Serrero. 1999. Adipose differentiation related protein (adrp) expressed in transfected cos-7 cells selectively stimulates long chain fatty acid uptake. J Biol Chem 274: 16825-16830.
Gibson, C. A., M. D. Staley, and C. R. Baumrucker. 1999. Identification of igf binding proteins in bovine milk and the demonstration of IGFBP-3 synthesis and release by bovine mammary epithelial cells. J Anim Sci 77: 1547-1557.
Gluckman, P. D., B. H. Breier, and S. R. Davis. 1987. Physiology of the somatotropic axis with particular reference to the ruminant. J Dairy Sci 70: 442-466.
Gordon, D. F., D. P. Quick, C. R. Erwin, J. E. Donelson, and R. A. Maurer. 1983. Nucleotide sequence of the bovine growth hormone chromosomal gene. Mol Cell Endocrinol 33: 81-95.
Groenen, M. A., R. J. Dijkhof, J. J. van der Poel, R. van Diggelen, and E. Verstege. 1992. Multiple octamer binding sites in the promoter region of the bovine alpha s2-casein gene. Nucleic acids research 20: 4311-4318.
Groner, B., and L. Hennighausen. 2000. Linear and cooperative signaling: Roles for stat proteins in the regulation of cell survival and apoptosis in the mammary epithelium. Breast Cancer Res 2: 149-153.
Gronlund, D. E., W. L. Hurley, M. H. Monaco, M. B. Wheeler, and S. M. Donovan. 2003. Over-expression of IGF-I in lactating porcine mammary tissue has a differential effect on amino acid transport systems. . J dairy sci 81: 189.

104
Hadsell, D. L., and S. G. Bonnette. 2000. Igf and insulin action in the mammary gland: Lessons from transgenic and knockout models. J Mammary Gland Biol Neoplasia 5: 19-30.
Hadsell, D. L., S. G. Bonnette, and A. V. Lee. 2002. Genetic manipulation of the igf-i axis to regulate mammary gland development and function. J Dairy Sci 85: 365-377.
Hadsell, D. L., N. M. Greenberg, J. M. Fligger, C. R. Baumrucker, and J. M. Rosen. 1996. Targeted expression of des(1-3) human insulin-like growth factor i in transgenic mice influences mammary gland development and igf-binding protein expression. Endocrinology 137: 321-330.
Hansen, J. K., and J. Knudsen. 1980. Transacylation as a chain-termination mechanism in fatty acid synthesis by mammalian fatty acid synthetase. Synthesis of butyrate and hexanoate by lactating cow mammary gland fatty acid synthetase. Biochem J 186: 287-294.
Hauser, S. D., M. F. McGrath, R. J. Collier, and G. G. Krivi. 1990. Cloning and in vivo expression of bovine growth hormone receptor mrna. Mol Cell Endocrinol 72: 187-200.
Havel, P. J. 2000. Role of adipose tissue in body-weight regulation: Mechanisms regulating leptin production and energy balance. The Proceedings of the Nutrition Society 59: 359-371.
Herrington, J., and C. Carter-Su. 2001. Signaling pathways activated by the growth hormone receptor. Trends Endocrinol Metab 12: 252-257.
Hill, R. L., K. Brew, T. C. Vanaman, I. P. Trayer, and P. Mattock. 1968. The structure, function, and evolution of alpha-lactalbumin. Brookhaven symposia in biology 21: 139-154.
Hishikawa, K., B. S. Oemar, F. C. Tanner, T. Nakaki, T. F. Luscher, and T. Fujii. 1999. Connective tissue growth factor induces apoptosis in human breast cancer cell line mcf-7. J Biol Chem 274: 37461-37466.
Hobbs, A. A., D. A. Richards, D. J. Kessler, and J. M. Rosen. 1982. Complex hormonal regulation of rat casein gene expression. J Biol Chem 257: 3598-3605.
Holst, B. D., W. L. Hurley, and D. R. Nelson. 1987. Involution of the bovine mammary gland: Histological and ultrastructural changes. J Dairy Sci 70: 935-944.
Hovey, R. C., H. W. Davey, D. D. Mackenzie, and T. B. McFadden. 1998. Ontogeny and epithelial-stromal interactions regulate igf expression in the ovine mammary gland. Mol Cell Endocrinol 136: 139-144.
Hussain, M. A., O. Schmitz, A. Mengel, Y. Glatz, J. S. Christiansen, J. Zapf, and E. R. Froesch. 1994. Comparison of the effects of growth hormone and insulin-like growth factor i on substrate oxidation and on insulin sensitivity in growth hormone-deficient humans. J Clin Invest 94: 1126-1133.

105
Huynh, H. T., G. Robitaille, and J. D. Turner. 1991. Establishment of bovine mammary epithelial cells (MAC-T): An in vitro model for bovine lactation. Exp Cell Res 197: 191-199.
Hwa, V., Y. Oh, and R. G. Rosenfeld. 1999. The insulin-like growth factor-binding protein (IGFBP) superfamily. Endocr Rev 20: 761-787.
Jefferson, L. S., C. M. Schworer, and E. L. Tolman. 1975. Growth hormone stimulation of amino acid transport and utilization by the perfused rat liver. J Biol Chem 250: 197-204.
Jenkins, T. C. 2000. Feeding oleamide to lactating jersey cows 1. Effects on lactation performance and milk fatty acid composition. J Dairy Sci 83: 332-337.
Jiang, H., and M. C. Lucy. 2001. Variants of the 5'-untranslated region of the bovine growth hormone receptor mrna: Isolation, expression and effects on translational efficiency. Gene 265: 45-53.
Jiang, W. G., G. Watkins, O. Fodstad, A. Douglas-Jones, K. Mokbel, and R. E. Mansel. 2004. Differential expression of the ccn family members cyr61, ctgf and nov in human breast cancer. Endocr Relat Cancer 11: 781-791.
Jin, Y., D. A. Cox, R. Knecht, F. Raschdorf, and N. Cerletti. 1991. Separation, purification, and sequence identification of tgf-beta 1 and tgf-beta 2 from bovine milk. Journal of protein chemistry 10: 565-575.
Kahn, B. B., and O. Pedersen. 1992. Tissue-specific regulation of glucose transporters in different forms of obesity. Proc Soc Exp Biol Med 200: 214-217.
Kamalati, T., D. Davies, J. Titley, and M. R. Crompton. 1998. Functional consequences of cyclin d1 overexpression in human mammary luminal epithelial cells. Clinical & experimental metastasis 16: 415-426.
Kanai, Y., and M. A. Hediger. 2004. The glutamate/neutral amino acid transporter family slc1: Molecular, physiological and pharmacological aspects. Pflugers Arch 447: 469-479.
Kenney, A. M., and D. H. Rowitch. 2000. Sonic hedgehog promotes g(1) cyclin expression and sustained cell cycle progression in mammalian neuronal precursors. Mol Cell Biol 20: 9055-9067.
Kim, H. S., S. R. Nagalla, Y. Oh, E. Wilson, C. T. Roberts, Jr., and R. G. Rosenfeld. 1997. Identification of a family of low-affinity insulin-like growth factor binding proteins (IGFBPs): Characterization of connective tissue growth factor as a member of the igfbp superfamily. Proc Natl Acad Sci U S A 94: 12981-12986.
Kisseleva, T., S. Bhattacharya, J. Braunstein, and C. W. Schindler. 2002. Signaling through the jak/stat pathway, recent advances and future challenges. Gene 285: 1-24.
Kleinberg, D. L. 1998. Role of IGF-I in normal mammary development. Breast Cancer Res Treat 47: 201-208.

106
Kleinberg, D. L., W. Ruan, V. Catanese, C. B. Newman, and M. Feldman. 1990. Non-lactogenic effects of growth hormone on growth and insulin-like growth factor-i messenger ribonucleic acid of rat mammary gland. Endocrinology 126: 3274-3276.
Knabel, M., S. Kolle, and F. Sinowatz. 1998. Expression of growth hormone receptor in the bovine mammary gland during prenatal development. Anat Embryol (Berl) 198: 163-169.
Kneussel, M. 2002. Dynamic regulation of gaba(a) receptors at synaptic sites. Brain research 39: 74-83.
Knight, C. H. 1992. Milk yield responses to sequential treatments with recombinant bovine somatotropin and frequent milking in lactating goats. J Dairy Res 59: 115-122.
Knight, C. H., P. A. Fowler, and C. J. Wilde. 1990. Galactopoietic and mammogenic effects of long-term treatment with bovine growth hormone and thrice daily milking in goats. J Endocrinol 127: 129-138.
Kobayashi, Y., C. K. Boyd, C. J. Bracken, W. R. Lamberson, D. H. Keisler, and M. C. Lucy. 1999. Reduced growth hormone receptor (GHR) messenger ribonucleic acid in liver of periparturient cattle is caused by a specific down-regulation of ghr 1a that is associated with decreased insulin-like growth factor i. Endocrinology 140: 3947-3954.
Kornmann, M., N. Arber, and M. Korc. 1998. Inhibition of basal and mitogen-stimulated pancreatic cancer cell growth by cyclin d1 antisense is associated with loss of tumorigenicity and potentiation of cytotoxicity to cisplatinum. J Clin Invest 101: 344-352.
Kuhn, N. J. 1968. Lactogenesis in the rat. Metabolism of uridine diphosphate galactose by mammary gland. Biochem J 106: 743-748.
Kuhn, N. J., and A. White. 1976. Evidence for specific transport of uridine diphosphate galactose across the golgi membrane of rat mammary gland. Biochem J 154: 243-244.
Lam, S., R. N. van der Geest, N. A. Verhagen, F. A. van Nieuwenhoven, I. E. Blom, J. Aten, R. Goldschmeding, M. R. Daha, and C. van Kooten. 2003. Connective tissue growth factor and igf-i are produced by human renal fibroblasts and cooperate in the induction of collagen production by high glucose. Diabetes 52: 2975-2983.
Lau, L. F., and S. C. Lam. 1999. The ccn family of angiogenic regulators: The integrin connection. Exp Cell Res 248: 44-57.
Le Roith, D. 1997. Seminars in medicine of the beth israel deaconess medical center. Insulin-like growth factors. The New England journal of medicine 336: 633-640.
Li, W., W. Qiao, L. Chen, X. Xu, X. Yang, D. Li, C. Li, S. G. Brodie, M. M. Meguid, L. Hennighausen, and C. X. Deng. 2003. Squamous cell carcinoma and mammary abscess formation through squamous metaplasia in smad4/dpc4 conditional knockout mice. Development 130: 6143-6153.

107
Liu, X., G. W. Robinson, K. U. Wagner, L. Garrett, A. Wynshaw-Boris, and L. Hennighausen. 1997. Stat5a is mandatory for adult mammary gland development and lactogenesis. Genes Dev 11: 179-186.
Louveau, I., and F. Gondret. 2004. Gh and insulin affect fatty acid synthase activity in isolated porcine adipocytes in culture without any modifications of sterol regulatory element binding protein-1 expression. J Endocrinol 181: 271-280.
Maas, J. A., J. France, and B. W. McBride. 1997. Model of milk protein synthesis. A mechanistic model of milk protein synthesis in the lactating bovine mammary gland. J Theor Biol 187: 363-378.
Madon, R. J., S. Martin, A. Davies, H. A. Fawcett, D. J. Flint, and S. A. Baldwin. 1990. Identification and characterization of glucose transport proteins in plasma membrane- and golgi vesicle-enriched fractions prepared from lactating rat mammary gland. Biochem J 272: 99-105.
Maier, R., P. Schmid, D. Cox, G. Bilbe, and G. K. McMaster. 1991. Localization of transforming growth factor-beta 1, -beta 2 and -beta 3 gene expression in bovine mammary gland. Mol Cell Endocrinol 82: 191-198.
Malewski, T., M. Gajewska, T. Zebrowska, and L. Zwierzchowski. 2002. Differential induction of transcription factors and expression of milk protein genes by prolactin and growth hormone in the mammary gland of rabbits. Growth Horm IGF Res 12: 41-53.
Marques, M. D., I. C. Santos, N. Carolino, C. C. Belo, R. Renaville, and A. Cravador. 2006. Effects of genetic polymorphisms at the growth hormone gene on milk yield in serra da estrela sheep. J Dairy Res: 1-12.
Martin, M. B., and A. Stoica. 2002. Insulin-like growth factor-I and estrogen interactions in breast cancer. J Nutr 132: 3799S-3801S.
Mather, I. H., and T. W. Keenan. 1998. Origin and secretion of milk lipids. J Mammary Gland Biol Neoplasia 3: 259-273.
Mauro, L., M. Salerno, C. Morelli, T. Boterberg, M. E. Bracke, and E. Surmacz. 2003. Role of theIGF-I receptor in the regulation of cell-cell adhesion: Implications in cancer development and progression. J Cell Physiol 194: 108-116.
McDowell, G. H., J. M. Gooden, D. Leenanuruksa, M. Jois, and A. W. English. 1987. Effects of exogenous growth hormone on milk production and nutrient uptake by muscle and mammary tissues of dairy cows in mid-lactation. Aust J Biol Sci 40: 295-306.
Merlo, G. R., F. Basolo, L. Fiore, L. Duboc, and N. E. Hynes. 1995. P53-dependent and p53-independent activation of apoptosis in mammary epithelial cells reveals a survival function of egf and insulin. J Cell Biol 128: 1185-1196.
108
Mertani, H. C., and G. Morel. 1995. In situ gene expression of growth hormone (gh) receptor and gh binding protein in adult male rat tissues. Mol Cell Endocrinol 109: 47-61.
Miller, M. J., S. A. Witherly, and D. A. Clark. 1990. Casein: A milk protein with diverse biologic consequences. Proc Soc Exp Biol Med 195: 143-159.
Miller, P. S., B. L. Reis, C. C. Calvert, E. J. DePeters, and R. L. Baldwin. 1991. Relationship of early lactation and bovine somatotropin on nutrient uptake by cow mammary glands. J Dairy Sci 74: 3800-3806.
Moller, N., J. O. Jorgensen, K. G. Alberti, A. Flyvbjerg, and O. Schmitz. 1990. Short-term effects of growth hormone on fuel oxidation and regional substrate metabolism in normal man. J Clin Endocrinol Metab 70: 1179-1186.
Monaco, M. H., D. E. Gronlund, G. T. Bleck, W. L. Hurley, M. B. Wheeler, and S. M. Donovan. 2005. Mammary specific transgenic over-expression of insulin-like growth factor-i (IGF-I) increases pig milk igf-i and igf binding proteins, with no effect on milk composition or yield. Transgenic Res 14: 761-773.
Moritani, N. H., S. Kubota, T. Nishida, H. Kawaki, S. Kondo, T. Sugahara, and M. Takigawa. 2003. Suppressive effect of overexpressed connective tissue growth factor on tumor cell growth in a human oral squamous cell carcinoma-derived cell line. Cancer Lett 192: 205-214.
Nebel, R. L., and M. L. McGilliard. 1993. Interactions of high milk yield and reproductive performance in dairy cows. J Dairy Sci 76: 3257-3268.
Neville, M. C., J. Morton, and S. Umemura. 2001. Lactogenesis. The transition from pregnancy to lactation. Pediatric clinics of North America 48: 35-52.
Neville, M. C., and C. D. Watters. 1983. Secretion of calcium into milk: Review. J Dairy Sci 66: 371-380.
Nicosia, R. F., S. V. Nicosia, and M. Smith. 1994. Vascular endothelial growth factor, platelet-derived growth factor, and insulin-like growth factor-I promote rat aortic angiogenesis in vitro. Am J Pathol 145: 1023-1029.
Nielsen, M. O., and K. Jakobsen. 1993. Changes in mammary glucose and protein uptake in relation to milk synthesis during lactation in high- and low-yielding goats. Comp Biochem Physiol Comp Physiol 106: 359-365.
Nielsen, M. O., T. G. Madsen, and A. M. Hedeboe. 2001. Regulation of mammary glucose uptake in goats: Role of mammary gland supply, insulin, IGF-I and synthetic capacity. J Dairy Res 68: 337-349.
Nielsen, M. O., S. Nyborg, K. Jakobsen, I. R. Fleet, and J. Norgaard. 2004. Mammary uptake and excretion of prostanoids in relation to mammary blood flow and milk yield during

109
pregnancy-lactation and somatotropin treatment in dairy goats. Domest Anim Endocrinol 27: 345-362.
Nielsen, S., N. Moller, J. S. Christiansen, and J. O. Jorgensen. 2001. Pharmacological antilipolysis restores insulin sensitivity during growth hormone exposure. Diabetes 50: 2301-2308.
O'Connor, R. 2003. Regulation of IGF-I receptor signaling in tumor cells. Horm Metab Res 35: 771-777.
Ormandy, C. J., N. Binart, and P. A. Kelly. 1997. Mammary gland development in prolactin receptor knockout mice. J Mammary Gland Biol Neoplasia 2: 355-364.
Oscarsson, J., M. Ottosson, and S. Eden. 1999. Effects of growth hormone on lipoprotein lipase and hepatic lipase. J Endocrinol Invest 22: 2-9.
Palade, G. 1975. Intracellular aspects of the process of protein synthesis. Science 189: 347-358.
Paradis, V., D. Dargere, M. Vidaud, A. C. De Gouville, S. Huet, V. Martinez, J. M. Gauthier, N. Ba, R. Sobesky, V. Ratziu, and P. Bedossa. 1999. Expression of connective tissue growth factor in experimental rat and human liver fibrosis. Hepatology (Baltimore, Md 30: 968-976.
Parrizas, M., and D. LeRoith. 1997. Insulin-like growth factor-1 inhibition of apoptosis is associated with increased expression of the bcl-xl gene product. Endocrinology 138: 1355-1358.
Patton, S. 1974. Reversible suppression of lactation by colchicine. FEBS Lett 48: 85-87.
Peel, C. J., D. E. Bauman, R. C. Gorewit, and C. J. Sniffen. 1981. Effect of exogenous growth hormone on lactational performance in high yielding dairy cows. J Nutr 111: 1662-1671.
Peeters, R. A., J. H. Veerkamp, A. Geurts van Kessel, T. Kanda, and T. Ono. 1991. Cloning of the cdna encoding human skeletal-muscle fatty-acid-binding protein, its peptide sequence and chromosomal localization. Biochem J 276 ( Pt 1): 203-207.
Pellerin, I., C. Vuillermoz, M. Jouvenot, C. Ordener, M. Royez, and G. L. Adessi. 1993. Identification and characterization of an early estrogen-regulated rna in cultured guinea-pig endometrial cells. Mol Cell Endocrinol 90: R17-21.
Petitclerc, D., L. T. Chapin, and H. A. Tucker. 1984. Carcass composition and mammary development responses to photoperiod and plane of nutrition in holstein heifers. J Anim Sci 58: 913-919.
Plaut, K., D. E. Bauman, N. Agergaard, and R. M. Akers. 1987. Effect of exogenous prolactin administration on lactational performance of dairy cows. Domest Anim Endocrinol 4: 279-290.

110
Plaut, K., M. Ikeda, and B. K. Vonderhaar. 1993. Role of growth hormone and insulin-like growth factor-i in mammary development. Endocrinology 133: 1843-1848.
Plaut, K., R. L. Maple, C. E. Wade, L. A. Baer, and A. E. Ronca. 2003. Effects of hypergravity on mammary metabolic function: Gravity acts as a continuum. J Appl Physiol 95: 2350-2354.
Pohl, J., A. Ring, U. Korkmaz, R. Ehehalt, and W. Stremmel. 2005. Fat/cd36-mediated long-chain fatty acid uptake in adipocytes requires plasma membrane rafts. Mol Biol Cell 16: 24-31.
Pombo, M., C. M. Pombo, A. Garcia, E. Caminos, O. Gualillo, C. V. Alvarez, F. F. Casanueva, and C. Dieguez. 2001. Hormonal control of growth hormone secretion. Horm Res 55 Suppl 1: 11-16.
Powers, C. J., S. W. McLeskey, and A. Wellstein. 2000. Fibroblast growth factors, their receptors and signaling. Endocr Relat Cancer 7: 165-197.
Prosser, C. G., S. R. Davis, V. C. Farr, L. G. Moore, and P. D. Gluckman. 1994. Effects of close-arterial (external pudic) infusion of insulin-like growth factor-ii on milk yield and mammary blood flow in lactating goats. J Endocrinol 142: 93-99.
Purup, S., M. Vestergaard, and K. Sejrsen. 2000. Involvement of growth factors in the regulation of pubertal mammary growth in cattle. Adv Exp Med Biol 480: 27-43.
Rapoport, R. M., M. B. Draznin, and F. Murad. 1983. Endothelium-dependent vasodilator-and nitrovasodilator-induced relaxation may be mediated through cyclic gmp formation and cyclic gmp-dependent protein phosphorylation. Transactions of the Association of American Physicians 96: 19-30.
Richert, M. M., and T. L. Wood. 1999. The insulin-like growth factors (IGF) and igf type i receptor during postnatal growth of the murine mammary gland: Sites of messenger ribonucleic acid expression and potential functions. Endocrinology 140: 454-461.
Rijnkels, M., P. M. Kooiman, H. A. de Boer, and F. R. Pieper. 1997. Organization of the bovine casein gene locus. Mamm Genome 8: 148-152.
Rinderknecht, E., and R. E. Humbel. 1978. The amino acid sequence of human insulin-like growth factor i and its structural homology with proinsulin. J Biol Chem 253: 2769-2776.
Robinson, R. M., R. M. Akers, and K. E. Forsten. 2001. IGF-I stimulation of extracellular acidification is not linked to cell proliferation for autocrine cells. Endocrine 15: 205-211.
Rosen, J. M., R. J. Matusik, D. A. Richards, P. Gupta, and J. R. Rodgers. 1980. Multihormonal regulation of casein gene expression at the transcriptional and posttransciptional levels in the mammary gland. Recent Prog Horm Res 36: 157-193.

111
Rosen, J. M., S. L. Wyszomierski, and D. Hadsell. 1999. Regulation of milk protein gene expression. Annu Rev Nutr 19: 407-436.
Ruan, W., and D. L. Kleinberg. 1999. Insulin-like growth factor I is essential for terminal end bud formation and ductal morphogenesis during mammary development. Endocrinology 140: 5075-5081.
Ruan, W., C. B. Newman, and D. L. Kleinberg. 1992. Intact and amino-terminally shortened forms of insulin-like growth factor i induce mammary gland differentiation and development. Proc Natl Acad Sci U S A 89: 10872-10876.
Sakamoto, K., B. A. Creamer, A. A. Triplett, and K. U. Wagner. 2007. The janus kinase 2 (jak2) is required for expression and nuclear accumulation of cyclin d1 in proliferating mammary epithelial cells. Mol Endocrinol.
Sakamoto, K., T. Komatsu, T. Kobayashi, M. T. Rose, H. Aso, A. Hagino, and Y. Obara. 2005. Growth hormone acts on the synthesis and secretion of alpha-casein in bovine mammary epithelial cells. J Dairy Res 72: 264-270.
Sejrsen, K., J. T. Huber, H. A. Tucker, and R. M. Akers. 1982. Influence of nutrition of mammary development in pre- and postpubertal heifers. J Dairy Sci 65: 793-800.
Sejrsen, K., S. Purup, M. Vestergaard, M. S. Weber, and C. H. Knight. 1999. Growth hormone and mammary development. Domest Anim Endocrinol 17: 117-129.
Sell, C., R. Baserga, and R. Rubin. 1995. Insulin-like growth factor i (IGF-I) and the igf-i receptor prevent etoposide-induced apoptosis. Cancer Res 55: 303-306.
Serra, R., and M. R. Crowley. 2003. Tgf-beta in mammary gland development and breast cancer. Breast Dis 18: 61-73.
Shennan, D. B., and R. B. Beechey. 1995. Mechanisms involved in the uptake of d-glucose into the milk producing cells of rat mammary tissue. Biochem Biophys Res Commun 211: 986-990.
Short, V. J., D. N. Brindley, and R. Dils. 1977. Co-ordinate changes in enzymes of fatty acid synthesis, activation and esterification in rabbit mammary gland druing pregnancy and lactation. Biochem J 162: 445-450.
Shoshani, T., A. Faerman, I. Mett, E. Zelin, T. Tenne, S. Gorodin, Y. Moshel, S. Elbaz, A. Budanov, A. Chajut, H. Kalinski, I. Kamer, A. Rozen, O. Mor, E. Keshet, D. Leshkowitz, P. Einat, R. Skaliter, and E. Feinstein. 2002. Identification of a novel hypoxia-inducible factor 1-responsive gene, rtp801, involved in apoptosis. Mol Cell Biol 22: 2283-2293.
Shum, B. O., C. R. Mackay, C. Z. Gorgun, M. J. Frost, R. K. Kumar, G. S. Hotamisligil, and M. S. Rolph. 2006. The adipocyte fatty acid-binding protein ap2 is required in allergic airway inflammation. J Clin Invest 116: 2183-2192.
112
Sinha, Y. N., and H. A. Tucker. 1969. Mammary development and pituitary prolactin level of heifers from birth through puberty and during the estrous cycle. J Dairy Sci 52: 507-512.
Sinowatz, F., D. Schams, A. Plath, and S. Kolle. 2000. Expression and localization of growth factors during mammary gland development. Adv Exp Med Biol 480: 19-25.
Skarda, J., E. Urbanova, S. Becka, L. M. Houdebine, C. Delouis, D. Pichova, J. Picha, and J. Bilek. 1982. Effect of bovine growth hormone on development of goat mammary tissue in organ culture. Endocrinol Exp 16: 19-31.
Smith, J. J., A. V. Capuco, and R. M. Akers. 1987. Quantification of progesterone binding in mammary tissue of pregnant ewes. J Dairy Sci 70: 1178-1185.
Smith, J. L., and L. G. Sheffield. 2002. Production and regulation of leptin in bovine mammary epithelial cells. Domest Anim Endocrinol 22: 145-154.
Stewart, C. E., and P. Rotwein. 1996. Growth, differentiation, and survival: Multiple physiological functions for insulin-like growth factors. Physiological reviews 76: 1005-1026.
Stiles, C. D., G. T. Capone, C. D. Scher, H. N. Antoniades, J. J. Van Wyk, and W. J. Pledger. 1979. Dual control of cell growth by somatomedins and platelet-derived growth factor. Proc Natl Acad Sci U S A 76: 1279-1283.
Strange, R., F. Li, S. Saurer, A. Burkhardt, and R. R. Friis. 1992. Apoptotic cell death and tissue remodelling during mouse mammary gland involution. Development 115: 49-58.
Su, H. Y., and W. T. Cheng. 2004. Increased milk yield in transgenic mice expressing insulin-like growth factor 1. Anim Biotechnol 15: 9-19.
Sundstrom, M., T. Lundqvist, J. Rodin, L. B. Giebel, D. Milligan, and G. Norstedt. 1996. Crystal structure of an antagonist mutant of human growth hormone, g120r, in complex with its receptor at 2.9 a resolution. J Biol Chem 271: 32197-32203.
Sweeney, K. J., B. Sarcevic, R. L. Sutherland, and E. A. Musgrove. 1997. Cyclin d2 activates cdk2 in preference to cdk4 in human breast epithelial cells. Oncogene 14: 1329-1340.
Takigawa, M. 2003. Ctgf/hcs24 as a multifunctional growth factor for fibroblasts, chondrocytes and vascular endothelial cells. Drug News Perspect 16: 11-21.
Terada, N., H. Wakimoto, and T. Oka. 1988. Regulation of milk protein synthesis by progesterone in cultured mouse mammary gland. Journal of steroid biochemistry 29: 99-104.
Teyssot, B., and L. M. Houdebine. 1980. Role of prolactin in the transcription of beta-casein and 28-s ribosomal genes in the rabbit mammary gland. Eur J Biochem 110: 263-272.

113
Tonner, E., M. C. Barber, M. T. Travers, A. Logan, and D. J. Flint. 1997. Hormonal control of insulin-like growth factor-binding protein-5 production in the involuting mammary gland of the rat. Endocrinology 138: 5101-5107.
Topper, Y. J., and C. S. Freeman. 1980. Multiple hormone interactions in the developmental biology of the mammary gland. Physiological reviews 60: 1049-1106.
Traurig, H. H. 1967. A radioautographic study of cell proliferation in the mammary gland of the pregnant mouse. The Anatomical record 159: 239-247.
Tsiaras, A. M., G. G. Bargouli, G. Banos, and C. M. Boscos. 2005. Effect of kappa-casein and beta-lactoglobulin loci on milk production traits and reproductive performance of holstein cows. J Dairy Sci 88: 327-334.
Tucker, H. A. 2000. Hormones, mammary growth, and lactation: A 41-year perspective. J Dairy Sci 83: 874-884.
Ullrich, A. G., A. Tam, A. W. Yang-Feng, T. Tsubokawa, M. Collins, C. Henzel, W., T. Le Bon, S. Kathuria, E. Chen, and et al. 1986. Insulin-like growth factor i receptor primary structure: Comparison with insulin receptor suggests structural determinants that define functional specificity. Embo J 5: 2503-2512.
Veerkamp, R. F. 1998. Selection for economic efficiency of dairy cattle using information on live weight and feed intake: A review. J Dairy Sci 81: 1109-1119.
Vermouth, N. T., and R. P. Deis. 1972. Prolactin release induced by prostaglandin f2 in pregnant rats. Nature: New biology 238: 248-250.
Vermouth, N. T., and R. P. Deis. 1974. Prolactin release and lactogenesis after ovariectomy in pregnant rats: Effect of ovarian hormones. J Endocrinol 63: 13-20.
Vernier-Magnin, S., S. Muller, M. Sallot, J. Radom, J. F. Musard, P. Adami, P. Dulieu, J. P. Remy-Martin, M. Jouvenot, and A. Fraichard. 2001. A novel early estrogen-regulated gene gec1 encodes a protein related to gabarap. Biochem Biophys Res Commun 284: 118-125.
Verrey, F., E. I. Closs, C. A. Wagner, M. Palacin, H. Endou, and Y. Kanai. 2004. Cats and hats: The slc7 family of amino acid transporters. Pflugers Arch 447: 532-542.
Walden, P. D., W. Ruan, M. Feldman, and D. L. Kleinberg. 1998. Evidence that the mammary fat pad mediates the action of growth hormone in mammary gland development. Endocrinology 139: 659-662.
Wang, W., B. Morrison, T. Galbaugh, C. C. Jose, N. Kenney, and M. L. Cutler. 2007. Glucocorticoid induced expression of connective tissue growth factor contributes to lactogenic differentiation of mouse mammary epithelial cells. J Cell Physiol.

114
Wang, Y., S. K. Fried, R. N. Petersen, and P. A. Schoknecht. 1999. Somatotropin regulates adipose tissue metabolism in neonatal swine. J Nutr 129: 139-145.
Wang, Y., and H. Jiang. 2005. Identification of a distal stat5-binding DNA region that may mediate growth hormone regulation of insulin-like growth factor-i gene expression. J Biol Chem 280: 10955-10963.
Weber, M. S., P. L. Boyle, B. A. Corl, E. A. Wong, F. C. Gwazdauskas, and R. M. Akers. 1998. Expression of ovine insulin-like growth factor-1 (IGF-I) stimulates alveolar bud development in mammary glands of transgenic mice. Endocrine 8: 251-259.
Weber, M. S., S. Purup, M. Vestergaard, R. M. Akers, and K. Sejrsen. 2000. Nutritional and somatotropin regulation of the mitogenic response of mammary cells to mammary tissue extracts. Domest Anim Endocrinol 18: 159-164.
Weber, M. S., S. Purup, M. Vestergaard, S. E. Ellis, J. Scndergard-Andersen, R. M. Akers, and K. Sejrsen. 1999. Contribution of insulin-like growth factor (IGF)-I and IGF-binding protein-3 to mitogenic activity in bovine mammary extracts and serum. J Endocrinol 161: 365-373.
Werner, H., and D. LeRoith. 1996. The role of the insulin-like growth factor system in human cancer. Adv Cancer Res 68: 183-223.
Wilde, C. J., C. V. Addey, P. Li, and D. G. Fernig. 1997. Programmed cell death in bovine mammary tissue during lactation and involution. Experimental physiology 82: 943-953.
Winklehner-Jennewein, P., S. Geymayer, J. Lechner, T. Welte, L. Hansson, S. Geley, and W. Doppler. 1998. A distal enhancer region in the human beta-casein gene mediates the response to prolactin and glucocorticoid hormones. Gene 217: 127-139.
Wolf, E., P. M. Jehle, M. M. Weber, H. Sauerwein, A. Daxenberger, B. H. Breier, U. Besenfelder, L. Frenyo, and G. Brem. 1997. Human insulin-like growth factor i (IGF-I) produced in the mammary glands of transgenic rabbits: Yield, receptor binding, mitogenic activity, and effects on igf-binding proteins. Endocrinology 138: 307-313.
Wood, D. C., W. J. Salsgiver, T. R. Kasser, G. W. Lange, E. Rowold, B. N. Violand, A. Johnson, R. M. Leimgruber, G. R. Parr, N. R. Siegel, and et al. 1989. Purification and characterization of pituitary bovine somatotropin. J Biol Chem 264: 14741-14747.
Writzl, K., B. Zorn, and B. Peterlin. 2006. Preliminary analysis of azfb region duplication by quantitative real-time pcr. Hum Reprod 21: 753-754.
Xie, D., C. W. Miller, J. O'Kelly, K. Nakachi, A. Sakashita, J. W. Said, J. Gornbein, and H. P. Koeffler. 2001. Breast cancer. Cyr61 is overexpressed, estrogen-inducible, and associated with more advanced disease. J Biol Chem 276: 14187-14194.
115
Yakar, S., J. L. Liu, B. Stannard, A. Butler, D. Accili, B. Sauer, and D. LeRoith. 1999. Normal growth and development in the absence of hepatic insulin-like growth factor i. Proc Natl Acad Sci U S A 96: 7324-7329.
Yang, J., J. J. Kennelly, and V. E. Baracos. 2000. Physiological levels of stat5 DNA binding activity and protein in bovine mammary gland. J Anim Sci 78: 3126-3134.
Yang, J., B. Zhao, V. E. Baracos, and J. J. Kennelly. 2005. Effects of bovine somatotropin on beta-casein mrna levels in mammary tissue of lactating cows. J Dairy Sci 88: 2806-2812.
Yee, D. 1994. The insulin-like growth factor system as a target in breast cancer. Breast Cancer Res Treat 32: 85-95.
Yip, R. G., and H. M. Goodman. 1999. Growth hormone and dexamethasone stimulate lipolysis and activate adenylyl cyclase in rat adipocytes by selectively shifting gi alpha2 to lower density membrane fractions. Endocrinology 140: 1219-1227.
Yonekura, S., K. Sakamoto, T. Komatsu, A. Hagino, K. Katoh, and Y. Obara. 2006. Growth hormone and lactogenic hormones can reduce the leptin mrna expression in bovine mammary epithelial cells. Domest Anim Endocrinol 31: 88-96.
Zamzami, N., C. Brenner, I. Marzo, S. A. Susin, and G. Kroemer. 1998. Subcellular and submitochondrial mode of action of bcl-2-like oncoproteins. Oncogene 16: 2265-2282.
Zavizion, B., R. C. Gorewit, and I. Politis. 1995. Subcloning the mac-t bovine mammary epithelial cell line: Morphology, growth properties, and cytogenetic analysis of clonal cells. J Dairy Sci 78: 515-527.
Zhao, F. Q., D. R. Glimm, and J. J. Kennelly. 1993. Distribution of mammalian facilitative glucose transporter messenger rna in bovine tissues. Int J Biochem 25: 1897-1903.
Zhao, F. Q., W. M. Moseley, H. A. Tucker, and J. J. Kennelly. 1996. Regulation of glucose transporter gene expression in mammary gland, muscle, and fat of lactating cows by administration of bovine growth hormone and bovine growth hormone-releasing factor. J Anim Sci 74: 183-189.
Zhu, J., and C. R. Kahn. 1997. Analysis of a peptide hormone-receptor interaction in the yeast two-hybrid system. Proc Natl Acad Sci U S A 94: 13063-13068.

116
Vita
Yinli Zhou was born on May 20, 1977 in Zhoukou, Henan Province, China. She
graduated from Tongji Medical College, Huazhong University of Science and Technology,
with a Bachelor of Science in Clinical Medicine in July 1999 and a Master of Science
degree in Hematology in 2002. In 2003, she enrolled in a Doctor of Philosophy program
under the direction of Dr. H. Jiang in the Department of Animal and Poultry Sciences at
Virginia Polytechnic Institute and State University and defended on Aug 23th, 2007. She is
a member of the American Society of Animal Science.