effects of some practices of citrus postharvest … m... · chemical characteristics and...
TRANSCRIPT

Dottorato Internazionale in Frutticoltura Mediterranea
Dipartimento Scienze Agrarie e Forestali
Settore Scientifico Disciplinare AGR/03
EFFECTS OF SOME PRACTICES OF CITRUS
POSTHARVEST MANAGEMENT ON FRUITS
QUALITY AND AROMATIC FINGERPRINT
IL DOTTORE IL COORDINATORE
Dr. Maria Cupane Prof. M.A. Germanà
IL TUTOR IL CO TUTOR Prof. M.A. Germanà Dr. P.L. San Biagio
CICLO XXV
ANNO CONSEGUIMENTO TITOLO 2015

2

3
Preface
The citrus flavor is one of the most attractive and recognized flavors worldwide, and
it is one of the major characteristics able to influence the consumer acceptance. The
main objective of this research work is to investigate the relation among flavor,
chemical characteristics and postharvest management.
This thesis is organized in two parts: the first one is a short state of art of citrus and
the second one represents the experimental part of the work carried out during the
three years of my PhD program.
More precisely, the first chapter contains the citrus world’s economic situation, and
an overview on the physico-chemical composition of citrus fruits and juices. A small
review of the most popular varieties cultivated in Sicily, with particular regard to
traditional cultivars, will be also presented. Considering the extent of these
arguments, only major characteristics will be highlighted.
In the second chapter, the main theme of the thesis will be discussed. Citrus flavor
will be approached from the chemical point of view, as the chemical classes that
contribute to the overall aroma. Then, its relation with post harvest management will
be analyzed.
Regarding the experimental part, first the motivational approach and the main
objectives of the experiments conducted will be explained. Then, the methods and the
techniques applied will be described.
The first experiment is focused on three lemon traditional varieties cultivated in
Sicily. Different part of the experiment investigates different characteristics, mainly
aromatic pattern and antioxidant properties, of lemon juices. These experiments
were carried out thanks to the collaboration with the Research Center for Citrus and
Mediterranean crops (CRA – ACM) and with the RoccaCoop that provided the fruits
and collaborated with me making available their habits in citrus postharvest
management.
The second experiment was done in Spain, in collaboration with the Polytechnic
University of Valencia. The leitmotif of this experience was to evaluate the aromatic
pattern of Salustiana oranges, focusing on different postharvest treatments.

4
Moreover, in this work an instrumental comparison between two different Electronic
Nose instruments was performed. This experiment were carried out thanks to the
Emilio Esteve farm, in Xeraco in the region of Valencia, that kindly provided the
fruits and the methods to perform the experimental conditions.
Finally, the global results of the work and the general conclusions will be presented.

5
Index
Preface ......................................................................................................................... 3
Part I ............................................................................................................................. 7
1. INTRODUCTION ................................................................................................ 8
1.1 Citrus: Production and Consumption ................................................................ 8
1.2 Citrus: Varieties cultivated in Italy ................................................................. 10
1.3 Citrus fruit morphology and ripening ............................................................. 14
1.4 Citrus Bioactive Compounds .......................................................................... 18
2. CITRUS FLAVOR ............................................................................................. 23
2.1 Factors Affecting Citrus Flavor ...................................................................... 26
2.1.1 Pre harvest handling, genotype and harvest time ........................................ 27
2.1.2 Post harvest handling .................................................................................. 27
3. FLAVOR ANALYSIS TECHNIQUES ............................................................. 32
3.1 Extraction Techniques .................................................................................... 32
3.2 Gas Chromatography – Mass Spectrometry ................................................... 34
3.2.1 Principles of Gas Chromatography ............................................................. 34
3.2.2 Principles of Mass Spectrometry ................................................................ 36
3.3 Electronic Nose ............................................................................................... 37
3.3.1 Sensors description...................................................................................... 38
3.3.2 Instruments description ............................................................................... 39
3.3.2.1 EOS835 ....................................................................................................... 40
3.3.2.2 Multisensory Odor Olfactory System – MOOSY32 ................................... 42
Part II ......................................................................................................................... 46
1. GENERAL OBJECTIVES ................................................................................. 47
2. EXPERIMENT 1: ............................................................................................... 49
Postharvest life and aroma quality of three lemon cultivars grown in Sicily ............ 49
2.1 Introduction ..................................................................................................... 49
2.2 Materials and Methods .................................................................................... 50
2.3 Results and Discussion ................................................................................... 54
2.4 Conclusions ..................................................................................................... 69
3. EXPERIMENT 2: ............................................................................................... 71
Application of a new electronic nose instrument to assess the effects of some
postharvest treatments on the quality of ‘Salustiana’ orange juice ........................... 71
6
3.1 Introduction ..................................................................................................... 71
3.2 Materials and Methods .................................................................................... 73
3.3 Results and Discussion ................................................................................... 77
3.4 Conclusions ..................................................................................................... 89
4. GENERAL CONCLUSIONS ............................................................................ 90
5. Appendix 1 ......................................................................................................... 92
6. Appendix 2 ......................................................................................................... 94
7. Acknowledgments ............................................................................................ 100
8. Scientific skills ................................................................................................. 101
8.1 List of paper and reports ............................................................................... 101
8.2 Stage and Collaborations .............................................................................. 101
8.3 Seminar participations .................................................................................. 102
References ................................................................................................................ 103

7
Part I
8
1. INTRODUCTION
1.1 Citrus: Production and Consumption
Citrus are the most widely cultivated fruit crops and rank first in the world fruits
production (FAOSTAT2012). Citrus are cultivated in more than 50 countries
worldwide, and their production grew enormously during the last four decades of the
twentieth century reaching in 2011 almost 9 million ha of growing areas and a
production of about 130 million tons (FAOSTAT2012).
Due to their need of a temperate climate, the mayor producer countries are located in
the tropical and subtropical regions, with the Mediterranean region ranking around
20% of the world citrus production. The main producer countries are China, Brazil,
USA, and Mexico (CLAM, 2007; Liu et al., 2012; Youseif et al., 2014).
In all these countries the cultivated area has been almost constant in the last ten
years, with a slight increase in the total production. China is the only country in
which, compared with a slight increase in cultivated area, there has been a more than
doubling of production (Calabrese, 2009).
Among the Mediterranean regions Italy and Spain are the main contributors to citrus
production, with a harvested area of 168.802,00 ha and 317.605,00 ha respectively
(FAOSTAT20212).
Italy is the second citrus producer in the Mediterranean region and it produces
around 4% of the world orange and lemon crops (Schimmenti, 2009; Baldi, 2011).
Like in the other producer countries, in the last 10 years there was a slight decrease
in total citrus area, mainly due to the abandoning of orchards, the lack of
organization, the increasing of input costs and the small size of the farm (Pergola et
al., 2013; Baldi, 2011; Aguglia et al., 2008).
All this factors caused a loss of competitiveness on both the foreign and domestic
markets with the benefit of the other Mediterranean producing countries (Baldi,
2011).

9
Despite the reduction of the cultivated areas, in the last years the production rate
increased with a total production around 3.8 million tons in 2011.
Oranges constitute the bulk of citrus fruit production, accounting for approximately
60% of global citrus production, followed by lemons and limes group with a total
production about 12%. The remaining 28% consists of grapefruit, tangerines,
mandarins, clementines and satsumas (FAOSTAT2012).
The distributions of the citrus area in Italy is concentrated in the southern regions,
particularly in Sicily and in Calabria that together are responsible of more than 80%
of total citrus production (ISMEA, 2013).
The worldwide importance of citrus, both on the fresh and processed markets, is in
constant rising mainly due to their preferred flavor and important role in human
health (Ting, 1980).
In the last years in fact, the awareness of the health benefit deriving from the
consumption of citrus fruits has been increasing. About two-thirds of the citrus
produced worldwide is consumed as fresh fruit, the rest is processed primarily into
juice (Rouseff and Perez-Cacho, 2007; Liu et al., 2012). The bulk of citrus fruits
produced in Mediterranean region are used primarily for fresh market and domestic
consumption, especially regarding Italian blood oranges (Calabrese, 2009; Tounsi et
al., 2010; Baldi, 2011). The rest of the production is intended for industrial
processing for the production of juices, essences and secondary derivatives, or for
exportation. In fact, more than 30% of fruits are exported especially to Northern
European markets, such as Germany, France and United Kingdom, and to Eastern
European countries and Russia (Aguglia et al., 2008; ISMEA, 2013).
Italy contributes to exportation only for 3%, while the rest is made up of products of
Spanish origin (Calabrese, 2009; ISMEA, 2013). Industrial processing affects
approximately 20% of production for the obtaining of juices and essences. Even
secondary products and by-products deriving from citrus processing are valuable on
markets, like the oils derived from the flavedo that are used as source of flavor in the
industries (Rouseff and Perez-Cacho, 2007).
From the point of view of the cultivated varieties, a large breeding program has been
conducted on the mandarins group, including mainly tangerines and mandarins. It is

10
a very dynamic sector, especially due to the consumer interest in new varieties,
characterized by easy peeling and seedless fruits with optimal size and shape, and
early or late ripening, extending the commercialization calendar. Not the same
massive work has been conducted on lemons and oranges varieties, which have
remained almost the same over time (Lorente et al. 2014; Calabrese, 2009). The
static nature of lemons and oranges markets resulted in an aging of the varietal
panorama of these two species. For lemons, for example, the majority of selection
programs were directed principally to increase the resistance to “Mal Secco” disease,
caused by the fungus Phoma tracheiphila (Calabrese and Barone, 2009). So, the last
breeding programs of this species lead to selection of the varieties mainly on the
basis of their ability to survive and produce, without focusing on the quality and
commercial characteristics of the fruits. An intensive study on the aromatic
characteristics of old and traditional varieties, combined with an investigation on the
antioxidant properties, could lead to re-assessment the importance of these cultivars.
1.2 Citrus: Varieties cultivated in Italy
The main citrus varieties cultivated in Italy are the Navel orange group (‘Navelina’,
‘Newhall’, Navelate’ and ‘Lane Late’), the pigmented oranges (‘Tarocco’, ‘Moro’,
and ‘Sanguinello’ with their hybrids), the lemons (‘Femminello’ and hybrids,
‘Monachello’, ‘Interdonato’, and ‘Lunario’), and the mandarin-like fruits
(Mandarins, Clementines, hybrids and Satsumas). Concerning blond oranges, this
group is very restricted in Italy due to the major interest towards pigmented ones
(Pergola et al., 2013; MiPAF 2006). Briefly, a description of the major varieties
cultivated in Italy is reported, as described in The Citrus Industry (Reuther et al.,
1967)
Lemon (Citrus limon L. Burm)
Femminello Group: it is the most important lemon group in Italy, covering almost
70% of the cultivated area. In general, all the selections within the Femminello group
are characterized by a good tolerance to mal secco disease. The trees set fruit
throughout the year, and are characterized by a constant production over the years.
Trees are culturally managed so as to produce four crops per year. The autumn crop

11
is called Primofiore, the winter to spring crop is called Limoni Invernali, the spring
crop is called Bianchetti, and the summer crop is called Verdelli. Femminello
Comune is the most representative variety of the group. Fruits are medium sized and
elliptical to oblong. The rind is medium thick, finely pitted with sunken oil glands,
and yellow at full maturity. The flesh is pale greenish-yellow, low-seeded to
seedless, juicy, and very acidic. This cultivar, through several bud mutations and
human hybridizations, arose a number of local cultivars and clones like F. Santa
Teresa; F. Zagara Bianca; F. Sfusato.
Femminello Santa Teresa is one of the oldest varieties. It has unknown genetic
origin, as said before probably originated from a mutation of ‘Femminello Comune’.
Its cultivation has been confined to a small area due to its low production rate and
poor quality of the production. Fruits are rich in essential oils and have high juice
content, which is acidic and rich in seeds. The major advantage of this cultivar is its
high tolerance to mal secco. According to Reuther and Webber (1967) “the parent
tree was an old disease-free tree discovered in a Femminello orchard that had almost
been destroyed by the disease (Russo, 1955). It is said to be the variety currently
most planted as a replacement in areas of Italy where the disease is severe."
Femminello Zagara Bianca is one of the most appreciate variety because of the
high quality of the fruits, the high rate of reflorescent, high tolerance to mal secco
and constant production rate. The name derives from the characteristic color of the
flowers that are totally white and similar to oranges.
Monachello: unknown genetic origin. With the cultivar F. Santa Teresa is the most
tolerant cultivar to mal secco. For this reason this cultivar has been one of the most
diffused in Italy, and currently it is planted only in areas where mal secco is very
severe. However the fruits are medium-small, rich in seeds, low in juice and acidity.
The rind is thin, the surface is smooth but with large sunken oil glands, very tightly
adherent. Trees are slow growing, and with low production rate in comparison with
Femminello and well adapted to forcing but with markedly reduced winter crop.
Even from this cultivar arose several clonal selections, like the” nucellare” produced
by Research Center for Citrus and Mediterranean crops (CRA – ACM) of Acireale.
Certain characteristics of this variety, particularly the distinctive growth habit and
cross-sectional shape of the larger branches, suggest that it is a lemon-citron hybrid.

12
Interdonato: It is the earliest of Italian varieties, which produces in fall and early
winter. According to Burke (1962), in origin this variety has been planted because of
its resistance to mal secco disease, to which its resistance is said to be intermediate
between the Femminello and Monachello varieties. Respect to these varieties,
however, the Interdonato produces fruits of better quality that are large and juicy
with oblong-cylindrical shape. The rind is thin, very smooth and adherent, and the
flavor is highly acid with slight bitterness. This cultivar is moderately productive but
does not respond well to “forzatura” treatment, aimed to Verdelli production, and
hence grown primarily for early fruit. Interdonato is considered a lemon-citron
hybrid.
Orange (Citrus sinensis Osbeck)
Navel group: Almost all the varieties of this group derive from a bud mutation of
‘Washington Navel’ that is the forefather of the entire navel group. Navelina is the
most diffused cultivar of the group in Italy, due to the high quality of fruits and juice.
In fact, fruits of this cultivar present a little navel, big and spherical shape and
seedless, the color is reddish-orange at maturity. The juice is very sweet with a high
sugar content and with a sweet flavor that is less sprightly than Washington navel.
Maturation is in October-November but fruits can be hold on the tree for a long time
with an increase of the sugar content as the only effect. The New Hall variety
originated as a limb sport of a Washington navel orange. It produces fruits that are
seedless, elongated, big shape and weigh, and it is characterized by a big navel. With
Navelina, represent the earlier orange production in Italy. The juice is sweet, with a
good ratio between sugars and acids. It is used mainly for fresh consumption and
only rarely for industrial processing. Regarding the late navel oranges, major
varieties are Navelate and Lane Late, whose maturation starts in January to June.
Fruits of both varieties are seedless and can store on the tree for several months after
reaching maturity before the quality deteriorates. The juice is abundant and sweet,
due to a high content in soluble solids. In general, Navelate trees have a low
production rate, and for this reason the cultivar ‘Lane Late’ is preferred.
Oranges without navel: Ovale Calabrese Unknown origin. Fruits do not have navel,
are ever blooming and not very productive. Fruits are well colored at maturity stage,
but re-greens if held on the tree long thereafter. This cultivar is characterized by late
13
maturation, from March till May, fruits are hard peeling and with seeds. The juice
possesses high quality, being very sweet and easy to squeeze. Nowadays in Italy this
cultivar is not diffused anymore, except in the traditional growing area, Calabria and
Sicily near the Tyrrhenian coast, where it is used mainly for domestic or industrial
juice extraction. Valencia is the widespread cultivated orange variety in the world. It
is characterized by a late maturation from April to June and it is almost the last
orange on the market. Good for long-term storage but not for long term holding on
the tree because of the re-greening of the peel, that is more accentuated than in the
‘Ovale Calabrese’. It is characterized by good juice content, high sugar and vitamin
C content. Salustiana is an ancient variety probably originated in Spain in the
Valencia community, where is cultivated nowadays. It is characterize by early and
extended maturation, from December until March. Fruits are seedless, juicy and
sweet. Good for juice extraction.
Pigmented oranges: Tarocco is the most known and appreciate. Probably introduced
in Italy at the beginning of ‘800, nowadays it’s almost the leader orange in local
markets reaching 45% of the total Italian production of oranges (Recupero and
Russo, 2009). The characteristic red color is due to the presence of anthocyanin, a
colored pigment present just in mature oranges. Anthocyanin production is very
dependent on genotype and environmental factors. Among growing factors,
temperatures play a key role in the synthesis of anthocyanin being low temperature
during night essential for their formation in the ripening and maturity stages. The
fruits are big and easy peeling, but not very resistant to storage. This is the main
reason for the intense breeding programs started in ’60 and focused on lengthening
the harvesting season; increase and stabilization of the anthocyanin content; increase
the sugar/acid ratio and the persistence of the fruit on the tree. Moro is the most
pigmented orange in the group of blood oranges, due to an impressive content of
anthocyanin. It’s used mainly for industrial processing, especially by mixing with
non-pigmented juices. The juice, in fact, has a very distinctive flavor, which is very
sweet and rich compared to that of the navel oranges. Unlike the ‘Tarocco’, this
variety has not been subjected to genetic improvement and the fruit does not have
characteristics of particular value. Sanguinello is characterized by a reddish skin,
few seeds and a sweet and tender flesh. It ripens in February, but fruits can remains
on the tree until April.

14
1.3 Citrus fruit morphology and ripening
The genus Citrus belongs to the family of Rutaceae, which is probably originated in
subtropical and tropical regions of Asia, whereas new researches suggested that some
species of citrus are actually native to Australia and New Guinea (Liu et al., 2012).
Botanically, citrus fruit is a hesperidium, a specialized berry composed in general of
three parts: the outer peel, a leathery aromatic rind called “flavedo”, rich of oil
glands and carotenoids; the inner peel, called “albedo”, a spongy parenchyma tissue
rich in sugar and peptic substances; and the endocarp, the edible portion composed
by segments filled with multiple-fluid filled sacs. Segments are usually aligned
around the soft central core of the fruit and covered by a thin membrane called
septum. The cytoplasm content of sacs is the primary source of the juice (Liu et al.,
2012).
Citrus fruits growth and development follow a characteristic sigmoid growth curve,
divided into three clear-cut phases (Bain, 1958). The initial stage, or phase I, is
characterized by a high division process and slow growth of cells, including the
period between anthesis and June drop. Phase II is a rapid growth period, with a
tremendous increase in cells sizes determined by water accumulation during four to
six months. The last growth stage, phase III, is the final ripening period. Cells growth
Oil sacs in flavedo Seed
Epidermis Albedo
Central
core Juice sacs
Segment
membrane
Segment
Fig. 1. Schematically representation of a citrus fruit, from Liu et al., 2012

15
is mostly arrested and fruits undergo a non-climacteric process (Iglesias et al., 2007).
Citrus fruits, in fact, are classified as non-climacteric, based on the absence of a
postharvest, ripening-associated rise in ethylene evolution and respiration (Katz et
al., 2004). During ripening, fruits growth slows down, ethylene production is low,
respiration is attenuated and changes in texture and composition proceed gradually
(Eaks, 1970; Goldschmidt et al., 1993). Major ripening symptoms are: color break;
rise of soluble solids and nitrogenous compounds contents; decrease of total acidity
level. Metabolite accumulation and increasing are strictly and inversely related with
temperature. After complete ripening, maturation process starts. During this process,
fruits reach their complete development, assuming all the external differences, flavor,
and texture that are characteristic of mature fruits. Main maturity symptoms are:
accomplishment of final external color, due to complete degradation of chlorophylls
and synthesis of carotenoids; weight loss; sugars enhancement; decrease of acidity.
After maturity, other changes may occur that define senescence of fruits: turgidity
loss; parting of tissues; overall quality loss determined above all by senescence of
peel tissues (Agustí, 2009). Quality traits are acquired during phases II and III, and
are related to many physical properties, such as size, shape, color, texture, and
chemical components, such as sugars, acids, flavor compounds, volatiles and
nutraceutical substances like vitamin C (Iglesias et al., 2007). Evolution of major
quality characteristics during citrus fruits growth is reported in Figure 2.
Fig. 2. Schematically representation of metabolic changes associated with maturation
process, from Iglesias et al., 2007

16
The chemical composition is strictly dependent from environmental factors and
growing conditions such as rootstocks, stage of maturity as well as genetic factors
(Ranganna et al., 1986). In general, citrus fruits are rich in macronutrients, like
simple sugars and dietary fiber, and contain several micronutrients including folate,
thiamin, niacin, vitamin B, riboflavin, pantothenic acid, potassium, calcium,
phosphorus, magnesium, and copper, which are essential for the normal growth and
the correct functioning of the human physiological system (Liu et al., 2012;
González-Mas et al., 2010).
Generally, the juice is an aqueous solution with high acidity level and cloudy
appearance, caused by colloidal and dissolved pectin. The levels of different
compounds vary according to species, cultivars, maturity stage, and growing factors
(Lorente et al., 2014).
The main components in citrus juice are:
- Sugars:
Sucrose, glucose and fructose, generally in the ratio of 2:1:1, are the major
components of this fraction, and are responsible for the sweetness of the juice
(Kefford, 1966; Ting and Attaway, 1971). The total sugar content could range
from lower than 1%, in some limes fruits, to as high as 15% in some oranges,
depending on the specific fruit and variety (Sass-Kiss et al., 2004). Other
sugars, like mannose, maltose and galactose, are present in extremely low
amount. Maturity and variety are the main factor affecting the sugar content
in citrus juice. Actually during ripeness the content of the different sugars can
vary tending to an increase with maturity (Ting and Attaway, 1971; Izquierdo
and Sendra, 1993).
- Polysaccharides:
Represent the main component of the insoluble portion. The biggest parts of
this fraction are pectic substances, cellulose, lignin and hemicelluloses that
are contained in peel, pulp, juice and membrane (Ting 1980). They contribute
to the body of the juice and to a desirable juice quality (Nagy and Shaw,
1990; Hirsch et al., 2012). In general, the polysaccharides of citrus fruits,
particularly in the peel and pulp, are considered a source of dietary fibers, and
play an important role in human health (Liu et al., 2010). In literature the role

17
of the dietary fiber as antioxidant factor is well claimed. Several studies
showed that dietary supplementation of pectin determines a decrease in levels
of blood cholesterol and serum glucose (Fernandez et al 1994; Larrauri et al.,
1996) and it has been shown to have potential beneficial effects in human
health (Kertesz, 1951; Baker et al., 1994; Yamada et al., 1996)
- Organic acids:
The most representative in citrus fruits are citric, malic and succinic acid
(Kefford, 1966). These are carboxylic acids that can be found in the free form
or in the form of salts, such as citrates and malates (Clements, 1964). The
contemporary presence of free acids and cations, like potassium, calcium and
magnesium, origins a buffer system that regulates internal pH. The ratio
between sugars and acidity content is called maturity index, which plays a
key role in the consumer and commercial acceptability providing the
delightful and typical taste of citrus fruits. As well as sugars, also the acid
content depends on the maturity, storage, climate and temperatures. In
general, during maturity the gradual decrease of citric acid leads to declined
acidity, whereas acid malic content remains relatively constant (Rasmussen,
1963).
- Nitrogenous compounds:
This small fraction consist of compounds present in rather small
concentration, but essential in assessing juice purity (Reid et al., 2006). Free
amminoacids are the most important compounds, representing about 70% of
total nitrogen fraction in the juice (Zamorani et al., 1973; Ranganna et al.,
1986). The most abundant are asparagine, arginine, alanine and proline,
which are considered non-essential amino acids (Block and Bolling, 1944).
Also, citrus fruits contain a small amount of proteins which are basically
enzymes, like oxidoreductases, transferases, hydrolases and lysases
(Vandercook, 1977).
- Lipids:
Lipids can be divided in three classes: non polar, nonionic polar and ionic
polar. Free fatty acids form an essential part of the non-polar group, with
linolenic, oleic, palmitic, and linoleic acids as the major components. The
nonionic polar lipids consist of a sugar containing lipids that includes
glycosyl glycerides and sterol glucosides. The ionic polar consist essentially
18
of phospholipids, that represent almost 50% of the total juice lipid content
(Nagy et al., 1978). They are primarily found in seeds and rinds, although
they can also be found in the flesh in small quantities (Nordby and Nagy,
1971). The significant difference in the lipid content of the various citrus
fruits can allow distinguishing among different species, and the fatty acid
profile can even be used to identify the cultivar (Tounsi et al., 2011; Nicolosi-
Asmundo et al., 1987; Nordby and Nagy, 1971). In general, the most
representative fatty acids are linolenic, 21-39% of total content of fatty acids,
oleic, palmitic, linolenic and palmitoleic (Nordby and Nagy, 1973; Nordby
and Nagy, 1971). Despite their low content, about 0.1% in orange juice, lipids
play a key role in the development of off-flavors during juices storage
because of their breakdown caused by oxidative stress (Moufida and Marzouk,
2003).
- Inorganic elements:
Citrus fruits are a good source of potassium that could constitute up 40% of
the total ash, although they are generally low in sodium (Guthrie et al., 1995).
Other main inorganic elements are calcium, magnesium, phosphorous. Even
traces of copper, zinc, iron and manganese, which are essential in sever
enzymatic reactions, can be found (Rouseff and Nagy, 1994; Liu et al., 2012).
The percentage of ash and the relative concentrations of inorganic
constituents are dependent upon growing conditions, like fertilization, soil
type, and climate; cultivars, stage of maturity, season of harvest and
geographic origin. Likewise, the percentage distribution of inorganic
elements in processed products is dependent on several processing parameters
like pressure used to juice fruit, pulp control, finishing and pulp washing. It
was shown that some trace elements, like iron, copper and manganese, are
effective in prevention and treatment of atherosclerosis (Gey et al., 1993).
1.4 Citrus Bioactive Compounds
Bioactive compounds deserve to be treated in a part, because of the growing
consumers demand of high nutritional and health quality fruits. Nowadays citrus
fruits are recognizing as an important aid in human health, as they possess an high

19
level of bioactive and natural antioxidant compounds (Lorente et al., 2014;
González-Molina et al., 2010; Finley, 2005; Gorinstein et al., 2001; Craig, 1997). So
citrus fruits represent a very important part of a balanced diet, particularly for their
role in prevention of disease, such as obesity, diabetes, cardiovascular disease and
certain types of cancer (Lin, 1994; Larrauri et al., 1996; González-Molina et al.,
2010).
The antioxidant and antiradicals activities are mainly provided by the hydro soluble
fraction, that contains vitamin C, flavonoids and polyphenols, and by the a polar
fraction, that includes carotenoids (Gorinstein et al 2001; Tripoli et al 2007).
- Vitamins:
Vitamins can be divided in two groups: fat-soluble vitamins and water-
soluble vitamins. Vitamin A is the only fat-soluble vitamin present in citrus
juice in considerable amount (Liu et al., 2012). It exists in the form of
provitamin A carotenoid, with the carotenes and β-cryptoxanthin as the major
vitamin A precursors (Ting, 1977; Stewart, 1977; Agocs et al., 2007). Total
provitamin A carotenoids vary widely among different citrus fruits:
mandarins, tangerines and pink grapefruits are the major sources (Holden et
al., 1999), while red grapefruits and oranges contain lower concentrations
(Lime et al., 1954; Ting and Deszyck, 1958; Holden et al., 1999). The most
representative water-soluble vitamin contained in citrus juice is ascorbic acid,
also known as vitamin C (Kays and Paull, 2004; Gadjeva et al., 2005). This
term commonly indicates both ascorbic (AA) and dehydroascorbic (DHAA)
acid. The first one is the reduced, dominant and active form (Zumreoglu-
Karan, 2006). Ascorbic acid is very labile and can be oxidized into the
DHAA form very easily (Halliwell, 1996; Davey et al., 2000). It is an
essential water-soluble vitamin, plays a key role in human health, like the
formation of collagen, a primary component of much of the connective tissue
in the body, and the absorption of inorganic iron (Rowe et al., 1999). It is also
a very important aid in prevent oxidative stress (Gorinstein et al., 2001). The
antioxidant function of vitamin C is based on its ability as hydrogen donor
that lets it inactivate free radicals preventing proteins, lipid and DNA
damages (Gardner et al., 2000; González-Molina et al., 2010).

20
The edible portion of the fruits contains about one-fourth of the total vitamin
C content, the rest in contained mainly in the peels that possess the higher
concentration than the other components of the whole fruit (Gorinstein et al.,
2001) Total content depends in the species and the cultivar and its level vary
with ripening time, storage, processing, and climate and agronomic factors
(Mozafar, 1993; Lee and Kader, 2000; Wang et al., 2007; Huang et al., 2008;
Rapisarda et al., 2008). In addition to Vitamin C, citrus fruits are a source of
vitamin B complex (Liu et al., 2012). In particular, vitamin B1 (thiamin);
vitamin B6 (pyridoxal phosphate); folate, the natural occurring form of folic
acid; niacin; riboflavin, and pantothenic acid (Hill et al., 1971; Rampersaud,
2007).
- Carotenoids:
Carotenoids are the only non-polar compounds that possess antioxidant
activity in citrus fruits. It is proved that carotenoids exert a potential action
against certain types of cancer, cardiovascular disease and cataracts
(Narisawa et al., 1999; Voutilainen et al., 2006; Trumbo and Ellwood, 2006).
These compounds are also responsible for the color of the fruits, and are
contained in the plastids of the flavedo and of the internal juice vesicles
(Rodrigo and Zacarias, 2007). The color can range from light yellows in
lemon to deep red in oranges and tangerines. Moreover, they could also
contribute to the flavor developing in some citrus species, like tangerine,
being precursors of potent aroma-active volatiles (Winterhalter and Rouseff,
2002). Citrus fruits contain a large number of complex carotenoids. In
literature approximately 115 different carotenoids are reported, and their
composition can vary depending on the location in peel or in the pulp
(Goodner et al., 2001). This variation is more accentuated in orange,
clementine and lemon (Agocs et al., 2007). However, almost all citrus, except
lime, have similar carotenoid profile even differences can be found in the
proportion of various compound. Among carotenoids present in citrus, the
most representative are: α- and β-carotene, lycopene, β-cryptoxanthin, and
lutein. Their content fluctuate with maturation, being higher in the last
maturity stage, growing conditions and postharvest treatments, and it is very
dependent on cultivars (Rodrigo and Zacarias, 2007; Kato et al., 2004;
Navarro et al., 2010; Alós et al., 2006).

21
- Phenolic compounds:
The phenolic substances in citrus can be classified into two groups: phenolic
acids and related compounds, and flavonoids.
The most important phenolic acids in citrus juices are benzoic and
hydroxycinnamic acids. Gallic acid is the most representative of the
hydroxybenzoic acid in citrus, even it was shown that its presence and
quantity is strictly dependent by the growing conditions and by the variety
diversity (Tounsi et al., 2011). In addition, gallic acid has been proven to
possess strong free-radical scavenging activity (Rangkadilok et al., 2007).
Citrus fruits also contain hydroxycinnamic acid and its derivatives: ferulic, p-
coumaric, sinapic, caffeic and chlorogenic acids (Robards and Antolovich,
1997). Their antioxidant potential is associated with their effectiveness as
hydrogen donors, which is dependent on the number and arrangement of the
hydroxyl groups and on the extent of structural conjugation, as well as the
presence of electron-donating and electron-withdrawing substituents in the
aromatic ring (Rice-Evans et al., 2000; Clegg and Morton, 1968). In addition
to their antioxidant capacity, fruit phenolics have been the subject of
increased interest in the last few years because their presence can contribute
to the sensory quality of the fruit and juice through their effect on color,
bitterness, astringency and flavor (Sousa et al., 2004).
Flavonoids are aromatic secondary plant metabolites that possess
physiological and pharmacological activities (Del Rio et al., 2004; Tusa et al.,
2007). Epidemiological studies have shown that the intake level of flavonoids
is associated with a reduced risk of certain chronic disease (Sun et al., 2002;
Manach et al., 2004; Burdock et al., 2006). The most important flavonoids in
citrus can be classified into different groups, on the basis of their carbon
skeleton: flavanones, flavones, flavanols and anthocyanins (Tusa et al.,
2007). Flavonoids can exist in the glycoside or aglycone forms, but most of
them commonly occur as C- or O-glycosides (Gattuso et al., 2007).
Fresh fruits and juices contain mostly flavanones and flavones in their
glycoside forms (Robards and Antolovich, 1997). Normally the glycosilation
of flavanones occurs at the 7-position by two disaccharides: rutinose or
neohesperidose. The most important difference between these two kinds of
glycolsilations is that the flavanone neohesperidosides are strongly bitter,
22
whereas the corresponding rutinosides are tasteless (Tusa et al., 2007). The
major flavanone glycoside that can be found in citrus are: didimin, eriocitrin,
hesperidin, narirutin, naringin and neohesperidin. Anyway, each species of
citrus contain a characteristic flavanone glycoside pattern that makes the
flavonoids profile suitable as chemotaxonomic marker (Ortuño et al., 1997;
Abad-García et al., 2012). Another group of compounds that belong to this
class are the polymethoxyflavones (PMFs). These are usually found as
components of the essential oils fraction of citrus peels, and their composition
varies among citrus species (Gattuso et al., 2007; Peterson et al., 2006). They
can also be found in the flesh as glycosides, with the same mechanism
described above. Anthocyanins are water-soluble glycosides that belong to
the flavonoid compounds. The red color characteristic of the rind and flesh of
blood oranges is due to water soluble anthocyanins, which are reduced from
the yellow flavonoids due to loss of oxygen (Merken and Beecher, 2000).
Anthocyanin content has been considered as an important quality attribute in
both fresh fruit market and processing industry due to its biological activity
(Barbagallo et al., 2007). The major anthocyanin identified in blood oranges
are cyaniding-3-glucoside and cyaniding-3-(6II-malonyl)-glucoside.
- Limonoids:
Limonoids are a group of structurally similar triterpene derivatives, that can
be find only in plant family of Rutaceae and Meliaceae. In citrus fruits and
juices, limonoids appear in large amount as water soluble limonoid
glucosides or in seeds as water insoluble limonoid aglycones. The aglycone
form is responsible for the development of delayed bitterness in citrus, and is
converted to the non-bitter limonoid glucosides during fruit maturation (Jacob
et al., 2000). The persistence of the extremely bitter taste can cause problems
in consumer acceptance. Limonin and nomilin are the most abundant
aglycone limonoids in citrus. A number of studies were conducted on these
compounds, showing that both limonin and nomilin could inhibit the
development of carcinogen-induced cancers in a variety of different animal
models, including models for stomach, lung, and skin cancer (Miller et al.,
2004).

23
2. CITRUS FLAVOR
Citrus flavor is one of the most appreciate flavor worldwide and it is one of the main
characteristics of citrus fruits influencing consumer choice, beginning with the visual
selection and leading to the consumption of the fruit. As reported by the Dictionary
of Flavors, flavor is the combination of the total sensory experience (De Rovira,
2008). Although flavor is perceived by receptors in the eye, tongue, nose and mouth
lining, the brain interprets the overall sensation as occurring in the mouth, localizing
all the sensory information into the mouth (Taylor and Hort, 2004).
The flavor composition is influenced both by genetic and environmental factors, so it
is specific to species and variety, and strictly dependent on pre and postharvest
handling of fruits (El Hadi et al., 2013; Sanz et al., 1997). It derives from a complex
combination of soluble compounds, principally sugars, acids, flavonoids and volatile
compounds (VOCs). The overall combination of the volatile compounds that
represent the odoriferous portion of the flavor profile is defined as aroma (De Rovira,
2008). Although a large number of chemical compounds have been detected in citrus
fruits, only a fraction of compounds have been identified as impact components of
flavor and aroma, based on their quantitative abundance and olfactory thresholds
(Willye et al., 1995). For example, linalool, limonene, valencene, and β-pinene are
the key aroma of many citrus species (El Hadi et al., 2013; González-Más et al.,
2011). In general, the big number of compounds that compose the aromatic pattern
can be divided in two classes: impact compounds, that are the key compounds
responsible of the characteristic aroma, and compounds that contribute to the overall
aroma. Another important characteristic is the odor threshold, which indicates the
minimum concentration producing an olfactory response and permitting to be
detected by the human nose/human sense of smell. The threshold values are
frequently determined by smelling (orthonasal value) and by tasting the sample
(retronasal value). The threshold value for an aroma compound is dependent on
temperature, medium, and interaction with other odor-producing substances that can
result in a strong increase in the odor threshold (Belitz et al., 2009). The ratio
between the concentration of an individual substance and its odor threshold is
defined as Odor Activity Value (OAV). Generally compounds that are present in

24
concentration higher than their odor thresholds are considered key contributors to the
aroma, while the others had no or minimal effect. In orange juice, 12 compounds
were demonstrated to be prominent based on the odor activity values, being
nootkatone, ethyl butanoate, linalool and limonene the higher contributors (Kelebek
and Selli, 2011).
Citrus VOCs are comprised of diverse classes of chemicals, predominantly terpenes
and terpenoids, alcohols, esters, aldehydes, and ketones. The difference between
terpenes and terpenoids is that terpenes are hydrocarbons, whereas terpenoids contain
additional functional groups. In general, aromatic compounds are characterized by
low molecular weight, ranged between 30 and 300 Da, and by their chemical
structure and functional groups. In fact, depending on polarity, number and type of
bonds, volatility and functional groups, and enantiomeric properties, the overall
shape of the molecules can lead to a particular aroma and flavor sensation (Gardner
and Bartlett, 1999). Aroma compounds are often released upon cell disruption, when
previously compartmentalized enzymes and substrate interact (Buettry, 1993).
Moreover, sometimes VOCs are bound to sugars as glycosides or glucosinolates. The
odorous aglycones can be released from the sugar moiety during maturation,
processing and storage, or by the effect of enzymes, acids or heat.
- Terpenes:
This is by far the most representative class of aroma compounds presents in
fruits. Terpenes basic structure is formed by isoprene units, (C5)n, that build
up the carbon skeleton (Breitmaier, 2007) following the isoprene rule. The
isoprene units can be linked together “head and tail” forming linear chains or
can be arranged forming rings structures (Fig. 3). Depending on the number
of isoprene units terpenes are classified sequentially by size as hemi- (C5),
mono- (C10), sesqui- (C15), until polyterpenes (C5)n with n>8. In nature,
terpenes and terpenoids derived from the universal C5 precursor isopentenyl
diphosphate and its isomer dimethylallyl diphosphate. In citrus terpenes occur
mainly as hydrocarbons, aldehydes, ketones, esters, and alcohols and their
glycosides. Characterized by high volatility, terpenes are the mainly
compounds found in citrus essential oils.

25
- Aldehydes:
This is by far the largest group of aroma-active compounds in citrus and
particularly in oranges. Aldehydes are formed from the oxidative cleavage of
linoleic and linolenic acids. Frequently these compounds appear soon after
the disintegration of tissue in the presence of oxygen, and a part of them is
enzymatically reduced to the corresponding alcohol (Belitz et al., 2009).
Together with alcohols they serve as precursors of esters synthesis, so their
composition reflects the esters present in fruits. Alcohol dehydrogenase can
reduce the aldehydes into the corresponding alcohols. The short chain
aldehydes and alcohols are produced by plants in response to wounding and
play an important role in the plant defense strategies (Matsui, 2006; Stumpe
and Feussner, 2006).
- Alcohols:
Chemically, an alcohol is formed by a hydroxyl functional group bounded to
a carbon atom. Due to their relation with esters, that are present mostly as
ethyl ester of C3 to C4 organic acid, linalool is by far the most important
alcohol As said before, often alcohols are the simply versions of the more
potent aldehydes forms. The reduction of aldehydes to the corresponding
alcohol can be very slow, thus with the high enzyme specificity can result in
an alcohol/aldehyde ratio in which aldehydes are predominant. Moreover,
alcohols can be oxidized to the corresponding ketone.
- Esters:
a
b c d
Fig.3. Chemical structure of isoprene and example of possible rearrangement.
a) Isoprene unit; b) α-phellandrene; c) menthol; d) citral
26
This class of compounds derives from a reaction between a carboxylic acid
and an alcohol. Due to their massive diffusion in almost all the plants, esters
constitute one of the most important aromatic families. In general, they are
responsible for the fruity flavor character (Berger, 2007). They are
synthesized only by intact cells, so when the fruits are homogenized, such as
in the processing of juice, esters are rapidly hydrolyzed by the hydrolase
enzymes present, and the fruit aroma flattens (Beliz et al., 2009).
- Ketones:
Chemically, this class of compounds is characterized by a carbonyl group
bounded to two carbon containing substituents. Sometimes ketones possess
an odor threshold lower than the alcohol’s, so they can contribute greatly to
the overall aroma. Due to this characteristic, they are often considered as off-
flavors. For example, in oranges, they are oxidation products or products of
microbial contamination. Their presence above threshold levels severely
degrades the quality of the juice and is an indication of thermal abuse and/or
storage abuse (Rouseff and Perez-Cacho, 2007).
2.1 Factors Affecting Citrus Flavor
There are several factors that can affect citrus fruits flavor, and can be divided in two
general classes: pre- and post- harvest factors. The post harvest development of citrus
fruits can alter significantly their commercial properties (Marcilla et al., 2006)
During the commercial packing of citrus, fruits are subjected to a number of
processes on the packing line which include: washing, rinsing, waxing, drying, sizing
and placement into boxes. Almost all the steps in the packing line have the potential
to induce physiological changes in the fruit that can results in flavor changes. It is
well known that all this process, combined with subsequent storage of the fruit, acts
to reduce eating quality of the fruit (Obenland et al., 2008).
27
2.1.1 Pre harvest handling, genotype and harvest time
As said before, the aromatic pattern derives from a complex combination of
numerous factors. So different species of citrus are characterized by different
aromatic patterns (Moufida et al., 2002; González-Mas et al., 2011; Allegrone et al.,
2006; Dharmawan, 2008), showing that there is a genetic control in the expression of
the aromatic profile (Sanz et al., 1997; Schwab et al., 2008; El Hadi et al., 2013).
Even often the differences are mainly quantitative, and only a few compounds are
variety-specific (Gonzales-Mas et al., 2011).
The harvest time is strictly related to the content and the composition of fruits. So it
is able to affect internal characteristics of the fruits (Bruckner et al., 2008; Rekha et
al., 2012).
Five standards has been usually used to define mature citrus fruits, color break,
minimum juice content, minimum percentage of total soluble solids, minimum acid
content, and total soluble solids/acid ratio (Nagi et al., 1978).
2.1.2 Post harvest handling
- Washing and Packing line: When arrived in the packing house, fruits are usually
washed using mechanical brushes (Obenland et al., 2008). This process, if too
strong, can enhance water loss from the peel and lead to changes in the internal
atmosphere of the fruits (Hagenmaier and Baker, 1993). In fact an aggressive
wash, causing the water loss from the peel, can result in an increase of the
resistance to gas exchange (Ben-Yehoshua, 1969). Moreover, even passing
through the packing line fruits are dropped and squeezed. Both these process can
induce a wounding effect and lead to an increasing of the respiratory rate and of
the accumulation of ethylene (Petracek et al., 1998). Production of ethanol is a
very efficient indicator of wound injury, because its production is stimulated by
all those factors which are capable of damaging the fruits (Cohen et al., 1990). It
is proved that ethanol production is enhanced by various steps of the packing
line like washing, packing and waxing, demonstrating that the metabolism of the
fruit is altered by passage through all the portions of the packing line,

28
presumably due to mechanical injury of the fruit (Obenland et al., 2008).
Important factors in washing step are: temperature and pressure of the applied
water, velocity of brushes, and chemical product applied. Due to the high
susceptibility of citrus fruit to green and blue molds during post harvest storage,
some modification to the washing step has been proposed, like the addiction of
fungicide or other chemical products to the washing water (Rodov et al., 1995;
Brown and Chambers, 1996; Smilanick et al., 1999; Smilanick et al., 2003).
Moreover, positive effect of heat treatments, between 50 ° and 60 °C depending
on citrus fruit, on the storability of citrus fruits is well proved (Ben-Yehoshua et
al., 1987; Del Rio et al., 1992; Rodov et al., 1995; Porat et al., 2000). Heat can
be applied as hot water dips, vapor heat, hot dry air or by hot water rising and
brushing (Schirra et al., 2000; Fallik, 2004). It is proved that the main effect of
this practice is to reduce chilling injuries and mould infections, without altering
fruit quality (Schirra et al., 2011; Ozdemir and Dundar, 2006). Hot water dip is
one of the most easily applied and environmentally safe fruit treatments to
reduce the incidence of mould injuries (Rodov et al., 1995). For example it has
been applied effectively on Kumquats fruits (Schirra et al., 2004; Rodov et al.,
1995); on red grapefruit, Satsuma, blood oranges, and fortune mandarins without
increasing the respiration rate during storage, and without exerting negative
effects on the overall quality of the fruits (Schirra and D’Hallewin, 1997; Porat
et al., 2000; Hong, 2007) Despite this, it was proved that eat treatments
deteriorate taste and flavor of blood oranges, and mandarins, mainly enhancing
the production of ethanol and others off-flavors (Schirra et al., 2002; Schirra et
al., 2004; Hagenmaier and Shaw, 2002; Moshonas et al., 1992). Different results
were obtained on another study conducted on mandarin that showed no
detrimental effect on fruit flavor, and no overproduction of off-flavor related
compounds (Perez et al., 2005).
- Waxing and coating: Application of external waxes on the fruits surface is
usually used to replace the natural waxes that have been removed by washing
and brushing procedures (Marcilla et al., 2009). It is also used to improve
consumers visual attraction to the fruits. But coating does not have the only
attracting effect. Application of wax or non-wax based coatings can alter internal
atmosphere of the fruits, leading to the production of anaerobic metabolites such
as ethanol and acetaldehyde (Hagenmaier and Goodner, 2002, Tietel et al.,

29
2011). As said before, over production and accumulation of these compound is
associated to poor flavor and production of off-flavor related compounds in
waxed citrus (Cohen et al., 1990; Hagenmaier, 2002), and with an overall loss of
quality of citrus fruit (Shaw et al., 1991; Del Rio et al., 1999). Among citrus
fruits, mandarins are prone to the accumulation of ethanol and off-flavors
following waxing (Hagenmaier, 2002). These two compounds are not the only
flavor-related volatiles that are altered in citrus fruits. Coated fruits have
increased levels of several volatile components, some of them being potentially
beneficial to the flavor of the fruit (Nisperos-Carriedo et al., 1990; Baldwin et
al., 1995; Obenland et al., 2009). The patterns of change varied depending on the
compound, some increasing and others decreasing during storage with waxing
and type of wax being key factors in determining the amounts present (Baldwin
et al., 1995). Moreover, it was shown that the development and perception of
ethanol as an off-flavor, is strictly dependent from the absolute content and odor
threshold of a particular compound (Martínez-Javéca, 1991; Hagenmaier, 2000;
Hagenmaier, 2002). Several studies tried to relate postharvest treatments, like
coating, with fruit sensory quality (Hagenmaier and Baker, 1994; Manheim and
Soffer, 1996; Bioatto et al., 2005; Shi et al., 2005; Marcilla et al., 2009). Of
course, type wax used is an extremely important factor. The most commonly
coating formulations are composed of either synthetic or natural waxes dispersed
in water or resin solutions (Marcilla et al., 2009). In general, polyethylene waxes
do not promote modification of internal atmosphere of citrus fruit (Hagenmaier
and Baker, 1993), whereas waxes with high shellac content are those that affect
more internal quality, due to their low permeability to gases (Baldwin et al.,
1995; Fallik et al., 2004; Marcilla et., 2009). The oxygen permeability of
coatings can be used for predicting flavor changes (Hagenmaier, 2002).
- Ethylene degreening:
According to their respiration rates, citrus fruits are classified as non-climacteric,
since the fruits show no or slight variation in the production of carbon dioxide
and ethylene during maturation (reviewed in Iglesias et al., 2007). Ethylene is a
plant growth hormone, also known as stress hormone, that has numerous effects
on the growth, development, storage life of many fruits and vegetables (Saltveit,
1999). Its production in albedo and flavedo tissues of citrus fruits is stimulated
in response to a variety of stress, like wounding, low temperature, and pathogen

30
infections (Eveson et al., 1991; Eaks, 1980; McCollum and McDonald, 1991;
Achilea et al., 1984; Mullins et al., 2000). Exposure of harvested fruits to
exogenous ethylene induced several physiological changes, mainly destruction
of chlorophyll, and synthesis and development of carotenoids (Rodrigo and
Zacarias, 2007; Iglesias, 2007). The major effect of these processes is the color
change of the fruit flavedo, from green to the characteristic color of each species.
However, prolonged exposure of fruits at high concentrations of ethylene can
produce unpleasant effects related to the senescence of fruits (Saltveit, 1999),
causing important fruit quality loss and reduction in shelf-life (Wills and
Warton, 2000; Wills et al., 1999; Wills et al., 2001). There are different effects
of quality loss mainly enhanced of respiration and ethylene production rates,
both indicators of biochemical changes in citrus flesh, such as breakdown of
sugars and acids that serve as respiratory substrates. Moreover, different studies
proved that ethylene affects various metabolic pathways like: decrease acidity in
‘Mosambi’ oranges (Ladaniya and Singh, 2001); increase production of aroma
volatiles in green lemons (Norman and Craft, 1968); increase susceptibility to
stem-end rots, enhances weight loss; and accelerate rind and calyx senescence
(Barmore and Brown, 1985; Carvalho et al., 2008; Porat, 2008).
Notwithstanding, more recent works showed that ethylene had only minor
effects on content and composition of juice aroma volatiles of several citrus
fruits, such as ‘Navel’ oranges, ‘Star Ruby’ grapefruits, and ‘Satsuma’
mandarins; and on the overall antioxidant activity (Chaudhary et al., 2008;
Mayuoni et al., 2011). Concluding that, maintaining adequate temperature and
duration, ethylene is probably not involved in regulation of internal ripening
process in citrus flesh and did not affect fruit quality attributes, including
perceived flavor and nutritional quality (Mayuoni et al., 2011).
- Storage:
It was shown in the older literature (Biale, 1961), that the packing process
combined with the subsequent storage determines a reduced eating quality of the
fruits (Obenland et al., 2008). A lot of investigations have been conducted to
better understand the physiological changes that occur during this process and
what are the factors that affect it majorly. It is proved that most of the storage
effects are determined by temperature (Marcilla et al., 2006; Rapisarda et al.,
2001; Obenland et al., 2011), being citrus fruit native from tropical and

31
subtropical regions and sensitive to low temperature. The consequence of the
exposure of fruits to low but not freezing temperature, typically below 10 °C is
the chilling injury (Schirra et al., 1998; Kader and Arpaia, 2002). It is a
physiological disorder that often appears on the surface of fruits, probably due to
the rupture of the oil glands with consequent water loss. Gravity of symptoms
depends on citrus varieties and on maturity stage of the fruit (Chalutz et al.,
1985; Underhill et al., 1995; Bajwa and Anjum, 2007).
Injury symptoms increase as temperature decrease and storage period is
extended (Henriod et al., 2005). Instead storage at temperature higher than 20 °C
caused degradation of anthocyanins and ascorbic acid in blood oranges
(Rapisarda et al., 2001) and flavor loss in mandarins (Obenland et al., 2011).
Changes are rapid if fruits held under hot and dry ambient conditions, while
under optimum refrigerated conditions with high relative humidity, changes are
gradual and at times may be insignificant.
Several studies report that the main effects on fruit quality are a general
reduction in flavor quality, and a small increase in the volatile compound
content, weight loss, and maturity index due to an increase in soluble solid
content and a decrease of acidity level (Baldwin et al., 1995; Obenland et al.,
2011; Tietel et al., 2012; Marcilla et al., 2009). Nevertheless panel test showed
that in some cases panelist revealed differences that were not instrumentally
determined (Harker et al., 2002; Marcilla et al., 2006). In a study conducted on
‘Navel’ orange, sensory panel evaluation indicates that the freshness of the
orange flavor decrease progressively as a result of storage, and hedonic ratings
indicates that stored fruits are liked less by the panelist (Obenland et al., 2008).
32
3. FLAVOR ANALYSIS TECHNIQUES
In order to investigate the changes occurring during the citrus packing line and the
subsequent storage of the fruits, it is essential to establish the chemical nature of the
VOCs and the overall aromatic pattern that characterize the fruits aroma. To achieve
these objectives it is necessary to isolate, and sometimes to concentrate, the volatile
fraction from the non-volatile bulk of the fruit matrix. Afterward, a wide range of
techniques can be applied to obtain different qualitative and quantitative information
on all compounds of possible sensory importance.
3.1 Extraction Techniques
Although in flavor research the direct analysis of the sample is a common practice,
pre concentration of the samples is often required to obtain the maximum of
information from the sample matrix (Bazemore, 2011). The most widely used sample
preparation techniques are rapid and precise, and are based on products that
incorporate polydimethylsiloxane (PDMS). It is a hydrophobic polymeric material
that extracts the volatile components present in a sample matrix by absorption into
the polymer liquid phase, without binding water appreciably. Moreover, it does not
require the use of solvents (Lötters et al., 1997).
Headspace sampling with SPME
The term headspace is referred to the gas phase located above the surface of a liquid
or solid sample present in a sealed vessel (Bazemore, 2011). In headspace sampling
techniques, the atmosphere adjacent the sample, that contains the volatiles, is
analyzed leaving the actual sample material behind (Wampler, 2002).
The partition of VOCs into the gas phase is strictly dependent on a big number of
factors, all related to each other. The main variables that regulate this process are:
solubility in water, polarity, molecular weight, ionic nature of analyte and solvent,
and temperature (Bazemore, 2011).
For this thesis SPME technique was used to sampling the static headspace of
samples. SPME is one of the most widely solvent free techniques used to extract

33
VOCs from a complex matrix. It consists of a microfiber sorbent coated on a fused
silica fiber, that adsorbs the analytes until equilibrium is reached in the system. The
first were developed by Arthur and Pawliszyn in 1990 and were made only with
PDMS, nowadays different coatings are available depending on the matrix and the
type of compounds analyzed. The most common coatings are PDMS, Carboxen,
divinyl benzene (DVB), polyacrylate, and polyethylene glycol (Carbowax). Fibers
can be made of one or a combination of different coatings. The amount of analyte
extracted is determined by the partition coefficient of the analyte between the sample
matrix and coating material (Pawliszyn, 1997). So, the choice/selection of different
coatings and film thickness is a fundamental factor, and it is mainly based on the
molecular weight and polarity of components (Bazemore, 2011). In general, thicker
film, higher analyte loading into the polymer, and higher analyte detection. For high
polarity are recommended fibers made by DVB/Carboxen or PEG (Shirey, 1999).
The main advantages of this technique are that it is rapid and simple, requires no
solvent addiction, can be applied for liquid, solid and gas, and can be performed
without heating the samples (Harmon, 2001). The commercial product that utilizes
this technology is commercialized by Supelco Corp.
For the experiments presented in this thesis, a biphasic fiber made of CAR/PDMS
was used.
Briefly, other major extraction techniques will be described:
- Static headspace: in this kind of extraction the sample is placed in a vial
crimped with an inert material, like Teflon (in order to avoid volatiles from
sticking to the surface via adsorption, or being absorbed into the septum
material), and allowed to reach equilibrium between the sample and the gas
phase. Then, an aliquot of the headspace is removed with a gas-tight syringe
and usually directly injected in a GC system to be analyzed. This technique
provides a good representation of the volatile compounds responsible of the
aroma, because it reflects natural headspace concentration. But, it can be
difficult to detect potentially important components due to the non-
concentration of the samples that can lead to the detection only of the
compounds present in higher concentrations (Reineccius, 2006).
- Dynamic Headspace: in this technique that is also known as purge and trap
VOCs are continuously swept from the headspace into a trap by a flow of

34
inert gas, like nitrogen or helium. Traps can contain one or a combination of
substances, included activated carbon, Tenax (2,6-diphenylene-oxide
polymer), or PDMS foam. Once trapped, volatiles are usually released for
chromatographic analysis. The major advantages of this technique are the
lower detection limits, due to the possibility of concentration of the samples,
and the possible application to solid samples (Goodner and Rouseff, 2011).
3.2 Gas Chromatography – Mass Spectrometry
Many different techniques are available in flavor research. The choice among them
depend primarily on the kind of desired information, and on the type of samples
analyzed (pure or mixtures, their volatility, physical state or solubility) (Rouseff and
Goodner, 2011). However, the most widespread techniques are Gas Chromatography
(GC) coupled with Mass Spectrometer (MS) detector (Reineccius, 2006). GC-MS is
an instrumental combination of the separation power of capillary gas
chromatography with the identification power of the mass spectrometer. It is the
most ubiquitous analytical technique for the identification and quantification of
volatile organic substances in complex matrix.
This technique allow the separation of the volatile compound contained in the
volatile fraction of the sample using GC separation, and their classification based on
the mass spectra of the detected compounds using MS identification.
3.2.1 Principles of Gas Chromatography
GC is a high resolution technique that enables the separation of gaseous substances
on the basis of physical-chemical properties such as boiling point, polarity and size
of the gas molecules. During a GC analysis, samples are volatilized and transported
by the carrier gas (mobile phase), through the column, where separation occurs
(stationary phase). Usually the carrier gas is inert, like Helium, Nitrogen or
Hydrogen. Stationary phase is usually a high molecular weight liquid that is
deposited either on the surface of finely divided particles or on the walls of a long
capillary tubing (Karasec and Clement, 1988). It may also consist of molecules
35
chemically bonded to the wall of the column; or it may be an adsorptive or inert
porous solid (Jonsson, 1987). The time taken for a specific volatile to elute from the
end of the column after injection is a characteristic of the volatile molecule and its
interaction with the column stationary phase (Rouseff and Goodner, 2011). The
separation of the individual components of a mixture involves the partitioning of a
compound between the two different phases, mobile and stationary. The compounds
with greater solubility in the stationary phase take longer to emerge from the column
than those with lesser solubility (Karasec and Clement, 2005). So the relative affinity
of the substances for the stationary or mobile phase determines the difference in
migration velocity and ultimately leads to physical separation of the components in a
sample (Jonsson, 1987). The relative affinity is strictly dependent from the partition
coefficient that is specific for each molecule and is defined as the ratio of
concentrations of a compound in the two phases of a mixture of two immiscible
liquids at equilibrium (Leo et al., 1971). Subtle differences in a compound partition
coefficient result in differential retention on the stationary phase and thus changing
the separation. So it is possible to discriminate molecules according to their rate of
elution, or through the measurement of the volumes eluted or, more commonly,
through the detection of the times elapsed between the introduction of the sample and
the time at which the analyte reaches the detector. This time interval is defined as the
“retention time”.
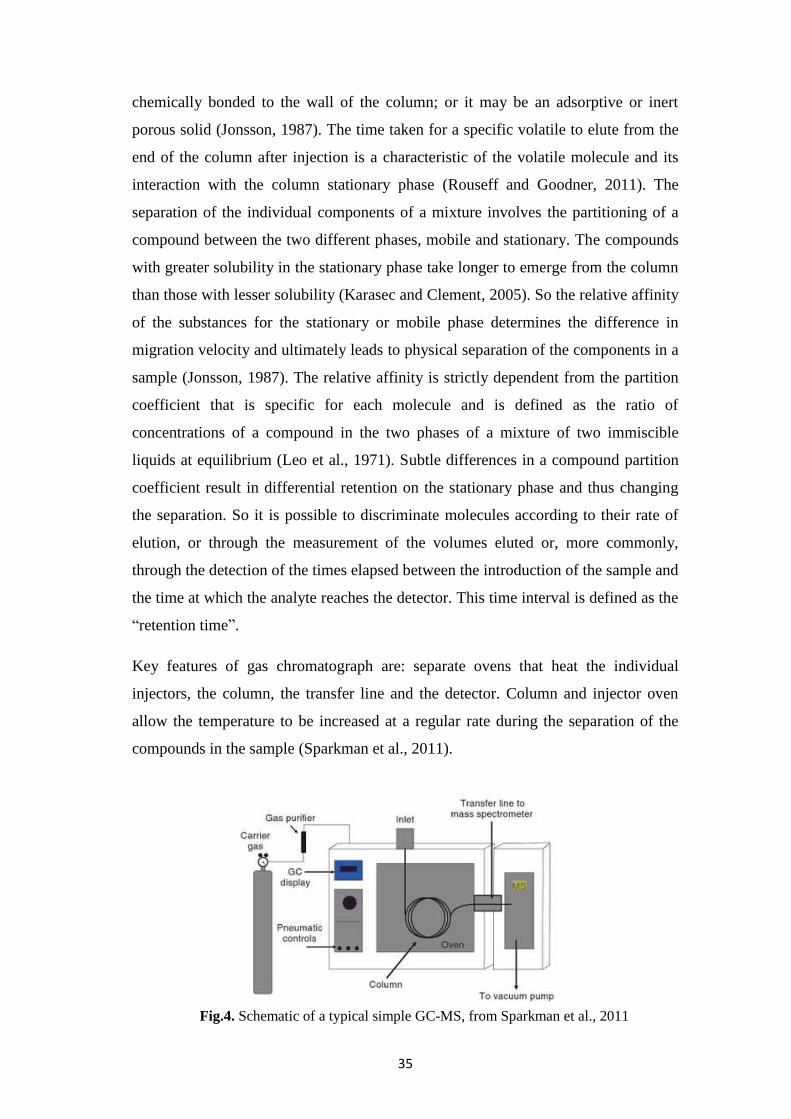
Key features of gas chromatograph are: separate ovens that heat the individual
injectors, the column, the transfer line and the detector. Column and injector oven
allow the temperature to be increased at a regular rate during the separation of the
compounds in the sample (Sparkman et al., 2011).
Fig.4. Schematic of a typical simple GC-MS, from Sparkman et al., 2011

36
3.2.2 Principles of Mass Spectrometry
Mass spectrometry is one of the analytical techniques of major application since it
allows performing quantitative-qualitative analysis of any chemical species, from
metal ions to organic macromolecules, with extremely low detection limits, and in
samples of any type. The sample, pure or in mixture, is brought to the state of gas or
vapor at low pressure and then ionized by bombardment by a beam of particles that
disintegrates into fragments of different mass and charge ratio (m/z). It works on the
principle that volatiles are fragmented into ions of predictable size and frequency
(Rouseff and Goodner, 2011). The weakest chemical bonds holding the molecule
together will be the place at which the molecule is most frequently fragmented and
ions form. The degree of fragmentation depends on the energy of the particles that
bombard the sample.
The ions that are formed, accelerated by an electric field within a magnetic field, run
through different trajectories according to their respective mass/charge (m/z) ratio
and therefore separated. The most common ionization system uses electron impact
(EI), in which the sample is bombarded with a high energy stream of electrons, to
approximately 70 eV, that fragments the volatiles as they elute from the end of the
capillary column of GC. The ions formed are focused and then sent to a mass
analyzer, such as a Quadrupole Mass Analyzer, that sorts the ions in terms of their
m/z ratio. The resulting fragmentation pattern is characteristic for each molecule, and
is called mass spectra. The peak in the mass spectrum with the greatest intensity is
called the base peak (Cozzi et al., 1998).
Key features of mass spectrometer are: the ion source; the mass analyzer; and the
detector. The ion source is the core of the spectrometer and, because ions are very
reactive and short lived; their formation and manipulation must be conducted under
vacuum.
A GCMS-QP2010 (Shimadzu) was used during the PhD study. This instrument uses
a single quadrupole mass analyzer that is responsible for filtering sample ions, based
on their m/z ratio and the stability of their trajectories in the oscillating electric fields
that are applied to the rods of the quadrupole. This kind of analyzer permits selection

37
of an ion with a particular m/z, or allows scanning for a range of m/z-values by
continuously varying the applied voltage.
The instrument was equipped with a SLB5-ms column (Supelco). It is a capillary,
non-polar column, made of silphenylene, a polymer virtually equivalent in polarity to
poly(5% diphenyl/95% dimethyl siloxane) phase. The low phenyl content provides a
boiling point elution order with a slight increase in selectivity, especially for
aromatic compounds.
3.3 Electronic Nose
The Electronic Nose (E.N.) instruments are able to simulate the human nose,
replicating the four fundamental functions of the sense of smell: detection, recording,
memory search and identification. The first two functions are simulated by the use of
chemical sensors; the other can be simulated by Artificial Intelligence software (Win,
2005). The most common E.N. are based on the use of an array of electronic
chemical sensors, with partial or no specificity, coupled with an appropriate system
of pattern recognition. The statistical treatments of the data use complex algorithms
to extract all the information that can be useful for the different applications (del
Cueto Belchi et al., 2013). Contrarily to the classical techniques used in aroma
analysis, like chromatography, E.N. does not identify the composition of volatiles
compounds but provides a fast comparative measure of patterns of odors,
representative of compounds disengaged by a substratum (Steine et al., 2001). The
E.N. offers a fast non-destructive alternative to sense aroma, and in the last decade
there have been several reports on electronic sensing in environmental control,
medical diagnostics and food industry (Olarte et al., 2013; Reinhard et al., 2008;
Tang et al., 2010; Lebrun et al., 2008; Saraolglu and Kocan, 2010; Horvath et al.,
2010). Some authors reported positive applications of the E.N. technology to the
discrimination of fruit of different quality, but as yet few literatures refer to control
the fruit maturity in the shelf life state (Hernandez-Gomez A. et al., 2007).

38
3.3.1 Sensors description
Different type of sensors can be used for this objective: Metal Oxide Semiconductors
(MOS); Gas sensitive Field Effect Transistor (GasFET or MOSFET); Conducting
Polymers; acoustic wave devices such as the Buck Acoustic Waves (BAW) or
Quartz Crystal Microbalance (QCM); Surface Acoustic Wave (SAW) (Strike and
Koudelka-Hep, 1999). In case of MOS sensors, the interaction with the volatile
compounds induces mechanisms of adsorption and desorption, taking place on the
surface of sensors and provoking the modification of its electrically measurable
properties by a variation of resistance versus time (Aishima, 1991). The most
common sensors used in an electronic nose system are metal oxide semiconductor.
MOS sensors are able to detect gases through a decrease in resistance values when
reducing gases are adsorbed on the sensor surface. The general operating principle of
a MOS gas sensor is based on the changes that occur in the sensing material when it
is heated (Fig. 4). In fact when a metal oxide crystal, such as SnO2, is heated, the
oxygen is adsorbed on the crystal surface causing a negative charge, and the donor
electrons are transferred to the adsorbed oxygen. As a result of this process, a
positive charge is formed in a space charge layer forming a surface potential that
serve as a potential barrier against electron flow. Inside the sensor, at the level of
SnO2 micro crystals, an electric current flows and at grain boundaries, the adsorbed
oxygen forms a potential barrier that prevents carriers from moving freely. This
potential barrier determines the electrical resistance of the sensor. In this way when a
deoxidizing gas arrives on the sensor, the surface density of the negatively charged
oxygen decreases, so the barrier height in the grain boundary is reduced. The reduced
barrier height decreases sensor resistance and increases the electrical conductivity.
For a target gas, the relationship between the sensor resistance and the gas
concentration is:
Rs= A(C)-α
Where Rs is the electrical resistance of the sensor; A is a constant, and α the slope of
the curve Rs.

39
3.3.2 Instruments description
Due to their wide range of sensitivity to different gas types and the wide range of
application of E.N. devices, a lot of instruments were developed both by industries
and research group. Basically, an E.N. is formed by three fundamental parts:
sampling system; sensor chamber; data analysis system.
Selected electronic nose instrument examples and their application in food analysis:
AlphaMOS, Toulouse, France instruments Fox3000; Fox4000. Used for
the authentication, classification and characterization of Citrus spp. (Steine et
al., 2001; Reinhard et al., 2008; Goodner and Manthey, 2005); for the
discrimination of different mango varieties (Lebrun et al., 2008); or for the
evaluation of Chinese tea (Qin et al., 2013);
AromaScan, Aroma Analysis Specialist instrument AromaScan A32
Multisample used for identification and characterization of sausages aroma
(Win, 2000); and other dairy products (Visser and Taylor, 2007); and for the
detection pesticide residues in crop production (Wilson, 2012)
WMA Airsense Analysentechnik GmbH instrument PEN2 used for several
investigation of food quality monitoring, like mandarins and tomatoes
(Hernandez Gomez et al., 2007; Hernandez Gomez et al., 2006), and fish
(Cheli et al., 2009; Campagnoli et al., 2009)
Fig.5. Schematic representation of a MOS sensor, from Simon et al., 2011

40
Neotronics Scientific instrument Neotronic Olfactory Sensory Equipment
(NOSE) Model 4000. Used for the classification of processed orange juice
(Shaw et al., 2000)
Sensigent instrument Cyranose 320, used for assess maturity stage of
tropical fruits, like mango or avocado, or for classification of honey origin
(Zakaria et al., 2012; Pereira et al., 2009)
For this PhD research two different electronic noses were used:
- EOS835
- Multisensory Odor Olfactory System – MOOSY32
3.3.2.1 EOS835
It is a commercial device developed by Italian Sacmi industry (Fig. 6). The
instrument employs an array of 6 MOS sensors installed inside a patented measuring
cell, the sensor chamber (Tab. 1). Different sensors that can react differently to the
same odor molecules generating a set of signals that is characteristics of the analyzed
sample, and represent the aromatic fingerprint.
Model Sensing layer Operating Temperature
CJ1316 SnO2 cat SiO2 450°C
SB0225 SnO2 cat Ag 400°C
SD0515 SnO2 cat Mo 400°C
SH0612 WO3 375°C
SJ0717 SnO2 450°C
WHT19 WO3 400°C
Tab. 1. MOS sensor array configuration of the EOS835. Specificity from Sacmi
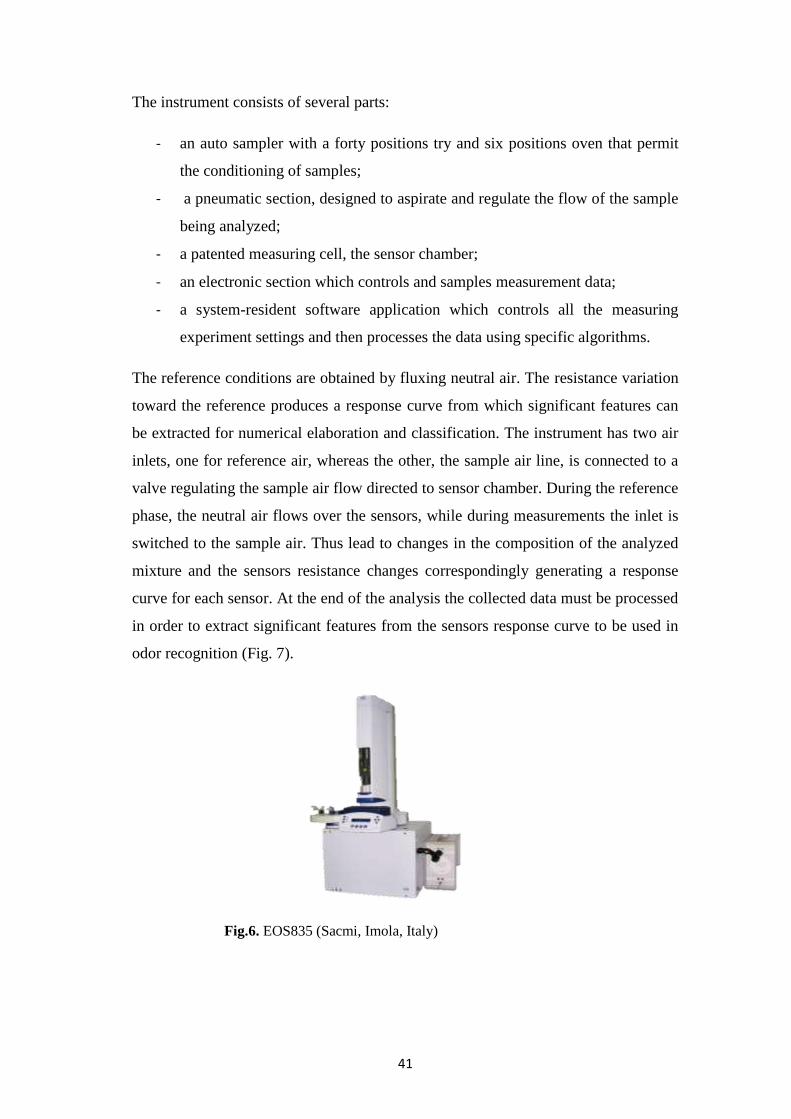
41
The instrument consists of several parts:
- an auto sampler with a forty positions try and six positions oven that permit
the conditioning of samples;
- a pneumatic section, designed to aspirate and regulate the flow of the sample
being analyzed;
- a patented measuring cell, the sensor chamber;
- an electronic section which controls and samples measurement data;
- a system-resident software application which controls all the measuring
experiment settings and then processes the data using specific algorithms.
The reference conditions are obtained by fluxing neutral air. The resistance variation
toward the reference produces a response curve from which significant features can
be extracted for numerical elaboration and classification. The instrument has two air
inlets, one for reference air, whereas the other, the sample air line, is connected to a
valve regulating the sample air flow directed to sensor chamber. During the reference
phase, the neutral air flows over the sensors, while during measurements the inlet is
switched to the sample air. Thus lead to changes in the composition of the analyzed
mixture and the sensors resistance changes correspondingly generating a response
curve for each sensor. At the end of the analysis the collected data must be processed
in order to extract significant features from the sensors response curve to be used in
odor recognition (Fig. 7).
Fig.6. EOS835 (Sacmi, Imola, Italy)

42
3.3.2.2 Multisensory Odor Olfactory System – MOOSY32
Is a homemade instrument developed by the research group of Electronic
Engineering Department of the Polytechnic University of Valencia. The instrument
utilized 32 commercial MOS sensors of 5 different types, all produced by Figaro
Engineering Inc. (Tab. 2). So, the use of different types of sensors combined with the
selected operating temperature leads to a wide range of different responses toward
volatile organic compounds with a wide variety of applications.
Model Target Gas Typical detection Range
TGS2600 General Air Contaminants 1 – 30 ppm
TGS2610 – C00 LP gas 500 – 10.000 ppm
TGS2610 – D00 LP gas 500 – 10.000 ppm
TGS2611 Methane 500 – 10.000 ppm
TGS2620 Alcohol, solvents vapor 500 – 5.000 ppm
The system is composed mainly by two parts: the electrical part and the processing
of the sample part (prechamber) (Fig. 8). The prechamber is linked with a clean air
pump which air flow is splitted in two streams, one that goes directly to the sensors
Tab. 2. MOS sensor array configuration of the MOOSY32. Specificity from Figaro
Fig.7. Typical sensor response

43
Fig.8. MOOSY32, operation of the whole system. From del Cueto Belchi et al., 2012
and is used as a reference line, while the other passes through the sample chamber to
carry the volatile molecules to the sensors chamber.
Flow velocity can be manually adjusted with a small valve. So, neutral air passes
through the system to clean it during a predetermined time and then the airflow
passes through the sample chamber during another fixed time. The electrical part
consists in an electrical circuit that can convert the change in conductivity to an
output signal that corresponds to the gas concentration. The sensor chamber consists
of a piece of steel composed with eight identical electronic boards each one with four
sensors and a voltage regulator, which supplies the heater for each of the four sensors
(Fig. 9).

44
Each part of the instrument is controlled by user interfaces that permit the setup of
the measurement parameters. This kind of configuration allows to maintain every
sensing element at a specific temperature, which is optimal for the sensing process,
and to have different sensitivity properties by selecting the most appropriate
combinations of the sensor temperature, as described in the reference of del Cueto
Belchi et al. (del Cueto Belchi et al., 2012).
Fig.10. Example of response of sensor TGS 2600 to different samples air
Fig.9. MOOSY32

45
The sensor signal are recorded continuously until the signal of each sensor reaches a
steady state, and acquired by a board of National Instruments. Thereafter, the output
signals from the sensors are digitized and stored (Fig. 10). It is possible to analyze
this data in different ways, using different algorithms for the extraction of different
features.
The classification features utilized for this goal are: late saturation; saturation slope;
early saturation; transient slope and time to threshold.

46
Part II

47
1. GENERAL OBJECTIVES
To evaluate the effect of some practices of the postharvest management on the
quality characteristics of different citrus fruits is the main objective of this thesis. In
order to achieve this objective, the work was structured in two different parts, each
one investigating different aspects of the main theme.
Organoleptic quality is one of the main factors that are able to influence consumer
choice. A lot of investigations have been conducted on the effect of postharvest and
storage on this quality trait of several fruits of Citrus spp. As said before, a great
number of practices are able to modify in some way the internal atmosphere of the
fruits and the subsequent storage performance.
The first experiment was conducted in Sicily, Italy, with the collaboration of the
RoccaCoop, a cooperative located in the province of Messina which includes about
70 growers. The experiment was designed in order to verify if the harvest and the
postharvest handling adopted by the cooperative is able to guarantee the maintenance
of citrus fruits quality. Actually, harvest time is often decided taking in accounts the
requirements of the market and not the real maturity stage of fruits, and also the
adopted storage conditions are not always suitable to preserve organoleptic quality.
Obviously, this way of behave is motivated by economical requisites, which include
the need of organizing and optimizing all the corporate resources. But sometimes
with just small adjustments, it is possible to significantly improve the quality of the
product. In this experiment, lemon fruit samples were submitted to the same storage
and handling conditions applied in the farm. The objective was to evaluate the
changes that occur during fruits storage, and to evaluate the feasibility of a non-
refrigerated storage. Moreover, special attention has been paid to the characterization
of the aromatic pattern and of the bioactive compounds of three cultivars
traditionally cultivated in Sicily.
It seems that the lack of communication among scientific community and growers
and processors caused that the improvement of the knowledge regarding citrus
acquired from researchers did not correspond to an improvement of the producers
knowledge and habits.

48
The second experiment was conducted in the campus of Gandia of the Polytechnic
University of Valencia, Spain. In this case, the experiment was designed and
supported by the participation of the company Emilio Esteve, located in the region of
Valencia, which is specialized in orange fruits commercialization. To investigate the
effect of the packing line, postharvest treatments and the subsequent storage on the
aromatic pattern of orange fruits was the objective of this work. In order to evaluate
the effect of each treatment, samples were picked at different steps of the fruits
packing line. Moreover, thanks to the collaboration of the research group of
Electronic Engineering Department of the Polytechnic University of Valencia,
coordinated by Professor José Pelegrí-Sebastiá, a comparison between the ability of
two different electronic noses to monitor the changes during storage was performed.
49
2. EXPERIMENT 1:
Postharvest life and aroma quality of three lemon cultivars grown in
Sicily
Abstract
The present work is focused on the study of the characteristics of the fruits
of three main lemon (Citrus limon L. Burm.) varieties cultivated in Sicily:
‘Femminello Comune’, ‘Femminello Zagara Bianca’, and ‘Femminello Santa
Teresa’.
Physical and chemical properties as well as aroma compounds were analysed as
quality discrimination factors. The effect of the storage conditions was verified.
Also, to assess the antioxidant potential, vitamin C content and total polyphenols
content were analysed. Standard experimental techniques were used to determine:
weight, longitudinal and transverse diameters, titratable acidity, total soluble
solids, and juice percentage. The volatile component was analysed by i) a gas
chromatographer with a mass spectrometer detector (GCMS QP2010, Shimadzu),
and ii) an electronic olfactory system equipped with an array of six MOS sensors
(EOS835, Sacmi). Vitamin C content was determined with a HPLC instrument
with a UV/VIS detector (Waters Alliance 2695- PDA).
Most of the physical and chemical parameters analysed allowed a statistically
significant discrimination among the factors “cultivar” and “storage”. The
aromatic pattern was similar for the cultivars ‘Femminello Comune’ and
‘Femminello Zagara Bianca’, while ‘Femminello Santa Teresa’ showed different
volatile composition. Differences were observed after the storage at 18°C.
2.1 Introduction
Qualitative characteristics are the main focus of many studies regarding citrus.
However, to provide a specific definition of “quality” may be very difficult because
it can assume different meanings depending on the step of the supply chain and on
the final destination market. In fact, different quality attributes are required for the
fresh market, like the carpometric parameters, or for the industrial use, like the
50
chemical characteristics. Moreover, since in 2010 Mediterranean diet was recognized
as intangible cultural heritage by UNESCO, particular attention is paid to fruits
nutraceutical characteristics. Citrus fruits are a fundamental source of antioxidant and
bioactive compounds, and their consumption has been related to the prevention of
several diseases such as obesity, diabetes, cardiovascular diseases, and certain types
of cancer (Benavente-García and Castillo, 2008; Del Rio et al., 2004; Lin et al.,
2007; Schroeder, 2007; Vanamala et al., 2006). So, chemical, aromatic and
nutraceutical properties are able to directly determine customer satisfaction. All these
characteristics are influenced by several factors, such as cultivar, maturity stage,
growing region, cultural practices, and storage conditions of fruits (Gorinstein et al.,
2001; Rapisarda et al., 2001; Lorente et al., 2014).
Particularly regarding citrus aroma, most of the knowledge gained so far is
focused on oranges, grapefruits and mandarins (Buttner and Schieberle, 1999; Perez-
Cacho and Rouseff, 2008 a, b; Zipora et al., 2011). With regards to lemon fruits,
there are many studies in literature that analyzed the variation of physical and
chemical characteristics of the fruits during the storage (Martinez-Romero et al.,
1999; Undurraga et al., 2007), others that describe the volatile composition of the
juices (Allegrone et al., 2006). On the contrary, papers concerning the time of storage
and its effect on the aromatic pattern and volatile composition of lemon fruits are
limited.
The aim of this work is to characterize some aspects of three Sicilian cultivars of
lemon, namely: ‘Femminello Comune’; ‘Femminello Zagara Bianca’; and
‘Femminello Santa Teresa’. Particularly, the fruits and the juices were analyzed for
chemical characteristics, antioxidant compounds, and aromatic patterns. Moreover,
their response to two different storage conditions was analyzed.
2.2 Materials and Methods
Plant Material
This study was carried out using fruits of three lemon cultivars: ‘Femminello
Comune’, ‘Femminello Zagara Bianca’ and ‘Femminello Santa Teresa’. The fruits
were harvested on March of two consecutive years, 2012 and 2013, in a farm located
in Torrenova (Messina, Sicily, Italy). All trees were of the same age, approximately
15 years, grafted on sour orange (Citrus aurantium), and grown in the same orchard

51
under conventional farming system. To evaluate the different response to the storage,
180 fruits were collected for each cultivar: 36 fruits for each plant at the cardinal
points, from 5 trees and divided in 3 theses. For the storage treatments the fruits were
analyzed the day after harvesting (ST0); the other fruits were stored for 4 weeks at 4
°C (ST28 4 °C) or at 18 °C (ST28 18 °C).
Physical and Chemical Parameters
Sampled fruits were individually weighted with a precision balance.
Longitudinal (DL) and transverse (DT) diameters were measured with a digital
caliper. For each thesis, percentage of juice (Juice %) was calculated as the weight
ratio between the fresh fruits and the juice squeezed with an electric juicer. Total
soluble solids (TSS) were determined by a digital refractometer (Atago) and
titratable acidity (TA) was determined by potentiometric titration with 0.1 N NaOH,
using 2 ml of pure juice and expressed in g/L of citric acid. Maturity Index (MI) was
also calculated as the ratio between TSS, expressed in °Brix, and TA, expressed in
percentage (%).
Cultivar ‘Femminello Zagara Bianca’
Cultivar ‘Femminello Santa Teresa’
Cultivar ‘Femminello Comune’

52
Total Polyphenols Content
Total polyphenols content (TPC) was determined by Folin–Ciocalteu method
measuring the absorbance at 750 nm with a UV–VIS spectrophotometer (UV-2401
PC, Shimadzu), as described by Tounsi et al. (2010). The total polyphenols content
of the samples was expressed as mg/mL of gallic acid equivalent (GAE). All the
analyses were performed in triplicate.
Vitamin C
Vitamin C concentration was determined by liquid chromatography using a
Waters Alliance 2695 HPLC instrument equipped with a Waters 996 photodiode
array detector (PDA), and Waters Empower software. The column was a C18
Hypersil ODS (150 mm x 4.6 mm i.d., 5 µm; Phenomenex, Torrence, CA)
maintained at 35 °C. The elution was performed with a buffer solution of 0.1 M
KH2PO4/H3PO4 at pH 2.3, at a flow rate 1 mL/min, and the wavelength was set at
260 nm (Rapisarda and Intelisiano, 1996). The vitamin C content of the samples was
expressed as mg/100 mL of ascorbic acid. All the analyses were performed in
triplicate.
Gas Chromatography – Mass Spectrometry
The volatile compounds (VOCs) of the fresh squeezed lemon juices were
sampled with the headspace solid phase micro extraction (HS-SPME) technique
using a Car/PDMS fiber (1 cm, Supelco). An aliquot of 10 mL of juice was added
with 1 g of NaCl, stirred and extracted for 30 minutes at 60 °C. The measurements
were carried out with a gas chromatographer coupled with a mass spectrometer
detector (GC-MS) (GCMS-QP2010, Shimadzu), equipped with a SLB5-ms column
(30 m x 0,25 mm x 0,25 µm, Supelco), with the method described by Costa et al.
(2010) with some modifications. The GC-MS instrument parameters were: injection
temperature 270 °C, injection mode splitless, sampling time 1 min, split ratio 50:1,
carrier gas Helium, pressure 33.7 KPa, linear velocity 32.4 cm/s, ion source
temperature 200 °C, interface temperature 250 °C, scan interval 0.25 s, mass range
40–400 m/z. The peak identification was performed through comparison of the
experimental mass spectra with those reported in the National Institute of Standards
and Technology (NIST) libraries incorporated in the instrument software (GCMS
solution Library, Shimadzu) and by comparison with previous studies on citrus fruits
53
(Yo and Lin, 2004; Allegrone et al., 2006; Dharmawan et al., 2007; Tounsi et al.,
2010; Gonzalez-Mas et al., 2011; Saura et al., 2012). Libraries used were: NIST 21,
NIST 107, and NIST 147. Only the molecules recognized with a percentage of
similarity greater than 90% were used for this study. All the analyses were performed
for each sample in triplicate.
Electronic Nose
The aroma fingerprints of fresh squeezed juices were performed by an
electronic nose (EOS835, Sacmi) equipped with an array of six metal oxide
semiconductor (MOS) sensors (see paragraph 3.3.2.1). Two milliliters of pure juice
were placed into a 20 mL glass vial, sealed and incubated for 5 min at 50 °C under
stirring. The automatic sampler draws a volume of 4 mL from the headspace by a gas
syringe and a chromatographic airflow of 10 mL/min carried the sample air to the
sensors chamber. The measurement duration was 27 minutes. The responses of the
sensors were processed by Principal Component Analysis (PCA), a multivariate
statistic method.
Statistical Analysis
Physical and chemical parameters data were submitted to two-way Analysis
of Variance (ANOVA) using the software SYSTAT 13 (Systat Software Inc.) and
analyzed for the effects of cultivar and storage. Means are separated using Tuckey
Honestly Significant Difference Test.
For the e-nose sensors responses, a Principal Component Analysis (PCA) was
used. The PCA is an unsupervised multivariate statistical analysis, which provides a
transformation of many variables into a linear combination of variables, into two or
three dimensions. This technique extracts features projecting the high-dimensional
data set into a dimensionally reduced space formed by the uncorrelated and
orthogonal eigenvectors of the correlation matrix calculated from the sensor
response, called principal component. The magnitude of the single
eigenvector or percentage of information is expressed by the eigenvalue, which gives
a measure of the variance related to the principal component. The first principal
component (PC1) accounts for the maximum of the total variance, the second (PC2)
is uncorrelated with the first and accounts the maximum of the residual variance
(Berrueta et al., 2007), and so on for the other components. The feature calculated for

54
each sensor and used in the statistical analysis is the ratio (R/R0), between the
electrical resistance of the sensor in the presence of volatile substances (R) and the
resistance of the same sensor measured in the absence of volatile substances (R0).
The PCA was performed with Nose Pattern Editor (Sacmi) and with the software S-
PLUS 2000 (MathSoft Inc.) using a correlation matrix.
2.3 Results and Discussion
Physical and Chemical Parameters of Lemon Fruits
As shown by the results reported in Table 1, regarding the Maturity Index and
the juice percentage, in the two analyzed years the fruits were characterized by
different maturation stage. It led to differences in the starting values of the fruits.
Also, the interaction between the cultivar and the storage time was not statistically
significant, meaning that although the physical characteristics were different among
the cultivars and the storage times, the differences remained stable within the storage
time. Table 1 summarizes the data obtained for each cultivar, and each treatment, in
the two years.
The physical and carpometric parameters were significantly affected by the
storage time, and showed the same behavior in response to the storage conditions. In
fact, storage caused a significant reduction of weight and longitudinal and transverse
diameters of the fruits, more accentuated with the storage at 18 °C. The juice
percentage increased whit storage, probably as a consequence of the loss of total
weight of the fruits caused by water loss from the peel. Regarding chemical
parameters, total soluble solids content and titratable acidity remained unchanged
during the storage, with a slight decrease of titratable acidity with the refrigerated
storage.
Titratable Acidity: higher values were registered in 2012, and in the juice of
the cultivar Femminello Santa Teresa. In both years storage time did not influence
significantly TA levels, that was subjected to just a slight decrease with the
refrigerated storage, as reported in literature (Del Caro et al., 2004; Marcilla et al.,
2006)
Total Soluble Solids: higher values were detected in 2013. Among the
cultivars, Femminello Santa Teresa showed the highest content of sugars. Storage
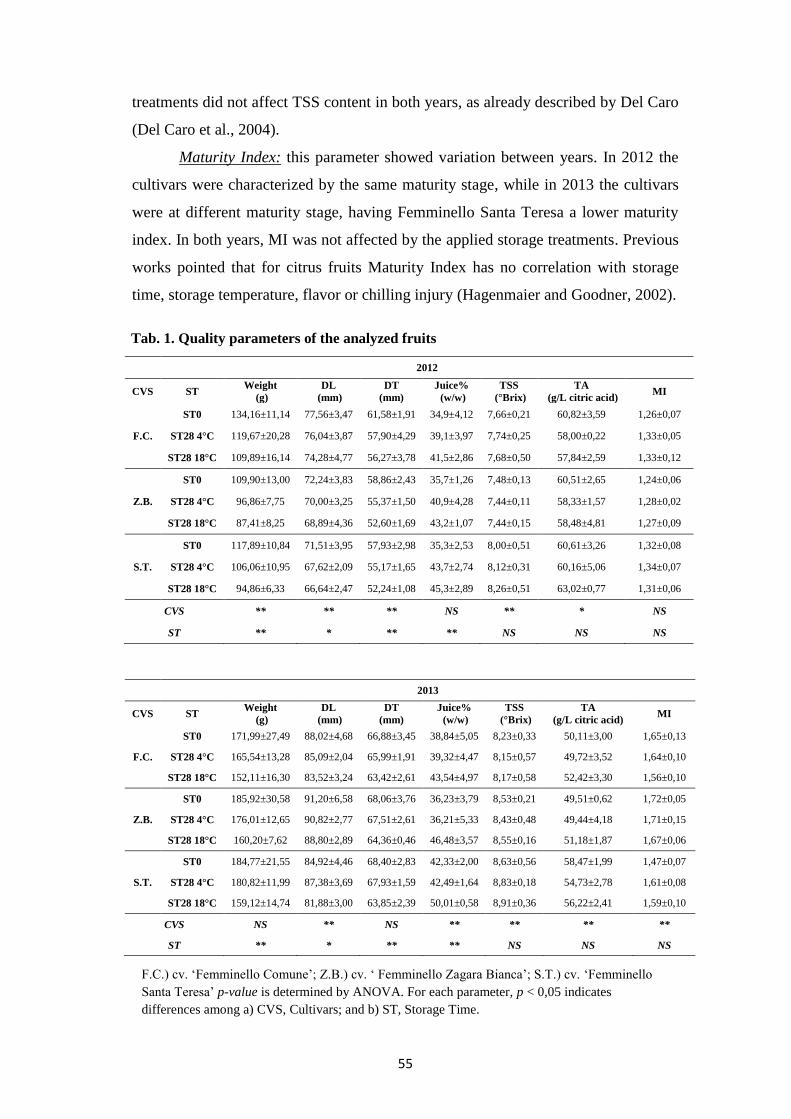
55
treatments did not affect TSS content in both years, as already described by Del Caro
(Del Caro et al., 2004).
Maturity Index: this parameter showed variation between years. In 2012 the
cultivars were characterized by the same maturity stage, while in 2013 the cultivars
were at different maturity stage, having Femminello Santa Teresa a lower maturity
index. In both years, MI was not affected by the applied storage treatments. Previous
works pointed that for citrus fruits Maturity Index has no correlation with storage
time, storage temperature, flavor or chilling injury (Hagenmaier and Goodner, 2002).
2012
CVS ST Weight
(g)
DL
(mm)
DT
(mm)
Juice%
(w/w)
TSS
(°Brix)
TA
(g/L citric acid) MI
F.C.
ST0 134,16±11,14 77,56±3,47 61,58±1,91 34,9±4,12 7,66±0,21 60,82±3,59 1,26±0,07
ST28 4°C 119,67±20,28 76,04±3,87 57,90±4,29 39,1±3,97 7,74±0,25 58,00±0,22 1,33±0,05
ST28 18°C 109,89±16,14 74,28±4,77 56,27±3,78 41,5±2,86 7,68±0,50 57,84±2,59 1,33±0,12
Z.B.
ST0 109,90±13,00 72,24±3,83 58,86±2,43 35,7±1,26 7,48±0,13 60,51±2,65 1,24±0,06
ST28 4°C 96,86±7,75 70,00±3,25 55,37±1,50 40,9±4,28 7,44±0,11 58,33±1,57 1,28±0,02
ST28 18°C 87,41±8,25 68,89±4,36 52,60±1,69 43,2±1,07 7,44±0,15 58,48±4,81 1,27±0,09
S.T.
ST0 117,89±10,84 71,51±3,95 57,93±2,98 35,3±2,53 8,00±0,51 60,61±3,26 1,32±0,08
ST28 4°C 106,06±10,95 67,62±2,09 55,17±1,65 43,7±2,74 8,12±0,31 60,16±5,06 1,34±0,07
ST28 18°C 94,86±6,33 66,64±2,47 52,24±1,08 45,3±2,89 8,26±0,51 63,02±0,77 1,31±0,06
CVS ** ** ** NS ** * NS
ST ** * ** ** NS NS NS
2013
CVS ST Weight
(g)
DL
(mm)
DT
(mm)
Juice%
(w/w)
TSS
(°Brix)
TA
(g/L citric acid) MI
F.C.
ST0 171,99±27,49 88,02±4,68 66,88±3,45 38,84±5,05 8,23±0,33 50,11±3,00 1,65±0,13
ST28 4°C 165,54±13,28 85,09±2,04 65,99±1,91 39,32±4,47 8,15±0,57 49,72±3,52 1,64±0,10
ST28 18°C 152,11±16,30 83,52±3,24 63,42±2,61 43,54±4,97 8,17±0,58 52,42±3,30 1,56±0,10
Z.B.
ST0 185,92±30,58 91,20±6,58 68,06±3,76 36,23±3,79 8,53±0,21 49,51±0,62 1,72±0,05
ST28 4°C 176,01±12,65 90,82±2,77 67,51±2,61 36,21±5,33 8,43±0,48 49,44±4,18 1,71±0,15
ST28 18°C 160,20±7,62 88,80±2,89 64,36±0,46 46,48±3,57 8,55±0,16 51,18±1,87 1,67±0,06
S.T.
ST0 184,77±21,55 84,92±4,46 68,40±2,83 42,33±2,00 8,63±0,56 58,47±1,99 1,47±0,07
ST28 4°C 180,82±11,99 87,38±3,69 67,93±1,59 42,49±1,64 8,83±0,18 54,73±2,78 1,61±0,08
ST28 18°C 159,12±14,74 81,88±3,00 63,85±2,39 50,01±0,58 8,91±0,36 56,22±2,41 1,59±0,10
CVS NS ** NS ** ** ** **
ST ** * ** ** NS NS NS
Tab. 1. Quality parameters of the analyzed fruits
F.C.) cv. ‘Femminello Comune’; Z.B.) cv. ‘ Femminello Zagara Bianca’; S.T.) cv. ‘Femminello
Santa Teresa’ p-value is determined by ANOVA. For each parameter, p < 0,05 indicates
differences among a) CVS, Cultivars; and b) ST, Storage Time.
Main effects are indicated as non-significant (NS) or significant at either the * p<0,05 or **p<0,01
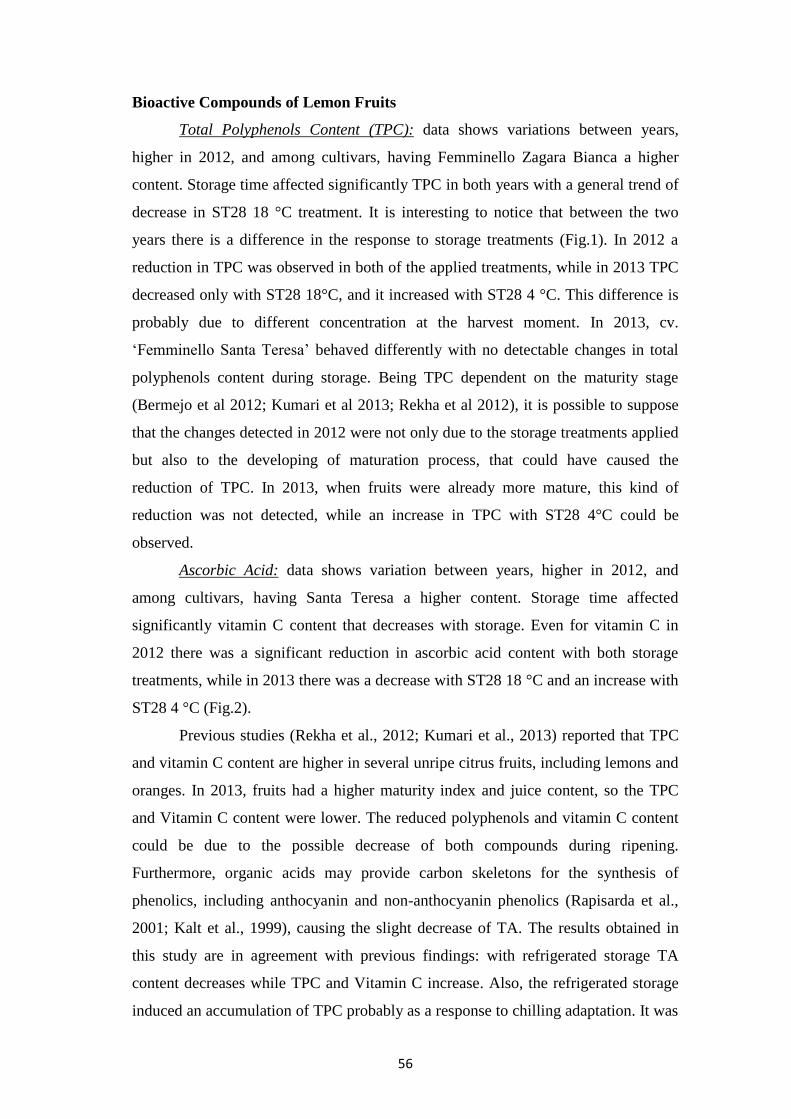
56
Bioactive Compounds of Lemon Fruits
Total Polyphenols Content (TPC): data shows variations between years,
higher in 2012, and among cultivars, having Femminello Zagara Bianca a higher
content. Storage time affected significantly TPC in both years with a general trend of
decrease in ST28 18 °C treatment. It is interesting to notice that between the two
years there is a difference in the response to storage treatments (Fig.1). In 2012 a
reduction in TPC was observed in both of the applied treatments, while in 2013 TPC
decreased only with ST28 18°C, and it increased with ST28 4 °C. This difference is
probably due to different concentration at the harvest moment. In 2013, cv.
‘Femminello Santa Teresa’ behaved differently with no detectable changes in total
polyphenols content during storage. Being TPC dependent on the maturity stage
(Bermejo et al 2012; Kumari et al 2013; Rekha et al 2012), it is possible to suppose
that the changes detected in 2012 were not only due to the storage treatments applied
but also to the developing of maturation process, that could have caused the
reduction of TPC. In 2013, when fruits were already more mature, this kind of
reduction was not detected, while an increase in TPC with ST28 4°C could be
observed.
Ascorbic Acid: data shows variation between years, higher in 2012, and
among cultivars, having Santa Teresa a higher content. Storage time affected
significantly vitamin C content that decreases with storage. Even for vitamin C in
2012 there was a significant reduction in ascorbic acid content with both storage
treatments, while in 2013 there was a decrease with ST28 18 °C and an increase with
ST28 4 °C (Fig.2).
Previous studies (Rekha et al., 2012; Kumari et al., 2013) reported that TPC
and vitamin C content are higher in several unripe citrus fruits, including lemons and
oranges. In 2013, fruits had a higher maturity index and juice content, so the TPC
and Vitamin C content were lower. The reduced polyphenols and vitamin C content
could be due to the possible decrease of both compounds during ripening.
Furthermore, organic acids may provide carbon skeletons for the synthesis of
phenolics, including anthocyanin and non-anthocyanin phenolics (Rapisarda et al.,
2001; Kalt et al., 1999), causing the slight decrease of TA. The results obtained in
this study are in agreement with previous findings: with refrigerated storage TA
content decreases while TPC and Vitamin C increase. Also, the refrigerated storage
induced an accumulation of TPC probably as a response to chilling adaptation. It was
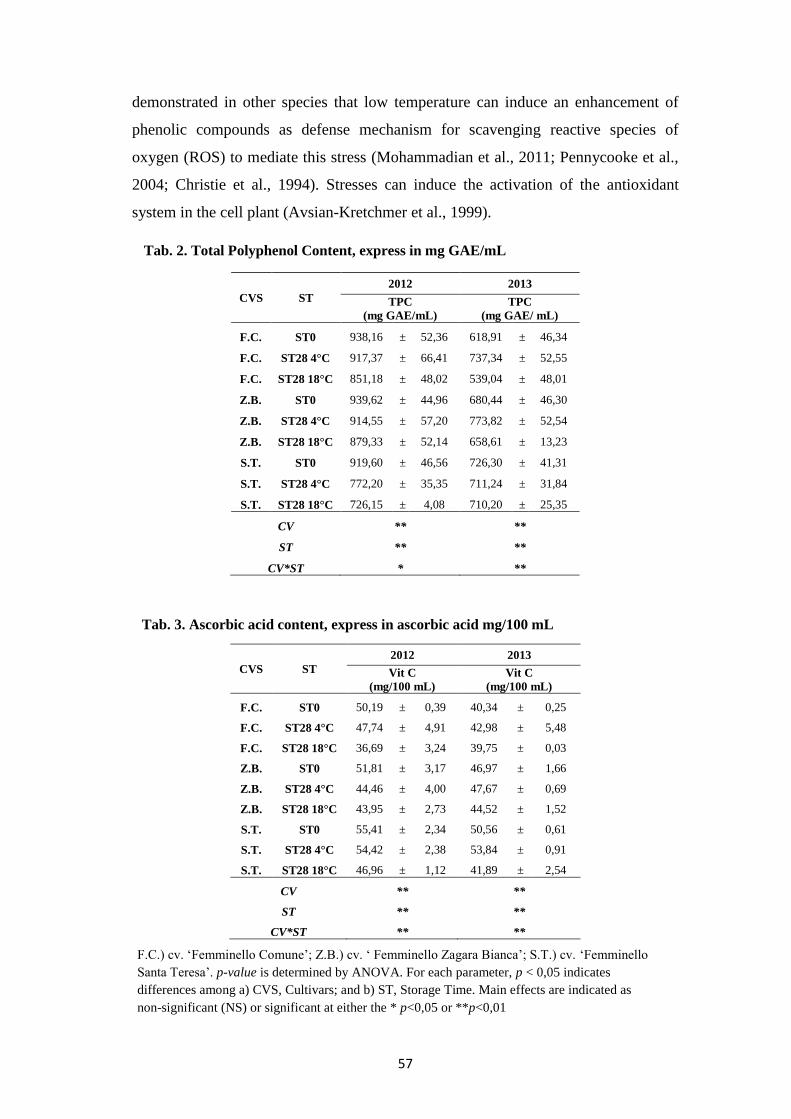
57
demonstrated in other species that low temperature can induce an enhancement of
phenolic compounds as defense mechanism for scavenging reactive species of
oxygen (ROS) to mediate this stress (Mohammadian et al., 2011; Pennycooke et al.,
2004; Christie et al., 1994). Stresses can induce the activation of the antioxidant
system in the cell plant (Avsian-Kretchmer et al., 1999).
CVS ST
2012 2013
TPC
(mg GAE/mL)
TPC
(mg GAE/ mL)
F.C. ST0 938,16 ± 52,36 618,91 ± 46,34
F.C. ST28 4°C 917,37 ± 66,41 737,34 ± 52,55
F.C. ST28 18°C 851,18 ± 48,02 539,04 ± 48,01
Z.B. ST0 939,62 ± 44,96 680,44 ± 46,30
Z.B. ST28 4°C 914,55 ± 57,20 773,82 ± 52,54
Z.B. ST28 18°C 879,33 ± 52,14 658,61 ± 13,23
S.T. ST0 919,60 ± 46,56 726,30 ± 41,31
S.T. ST28 4°C 772,20 ± 35,35 711,24 ± 31,84
S.T. ST28 18°C 726,15 ± 4,08 710,20 ± 25,35
CV ** **
ST ** **
CV*ST * **
CVS ST
2012 2013
Vit C
(mg/100 mL)
Vit C
(mg/100 mL)
F.C. ST0 50,19 ± 0,39 40,34 ± 0,25
F.C. ST28 4°C 47,74 ± 4,91 42,98 ± 5,48
F.C. ST28 18°C 36,69 ± 3,24 39,75 ± 0,03
Z.B. ST0 51,81 ± 3,17 46,97 ± 1,66
Z.B. ST28 4°C 44,46 ± 4,00 47,67 ± 0,69
Z.B. ST28 18°C 43,95 ± 2,73 44,52 ± 1,52
S.T. ST0 55,41 ± 2,34 50,56 ± 0,61
S.T. ST28 4°C 54,42 ± 2,38 53,84 ± 0,91
S.T. ST28 18°C 46,96 ± 1,12 41,89 ± 2,54
CV ** **
ST ** **
CV*ST ** **
Tab. 2. Total Polyphenol Content, express in mg GAE/mL
F.C.) cv. ‘Femminello Comune’; Z.B.) cv. ‘ Femminello Zagara Bianca’; S.T.) cv. ‘Femminello
Santa Teresa’. p-value is determined by ANOVA. For each parameter, p < 0,05 indicates
differences among a) CVS, Cultivars; and b) ST, Storage Time. Main effects are indicated as
non-significant (NS) or significant at either the * p<0,05 or **p<0,01
Tab. 3. Ascorbic acid content, express in ascorbic acid mg/100 mL
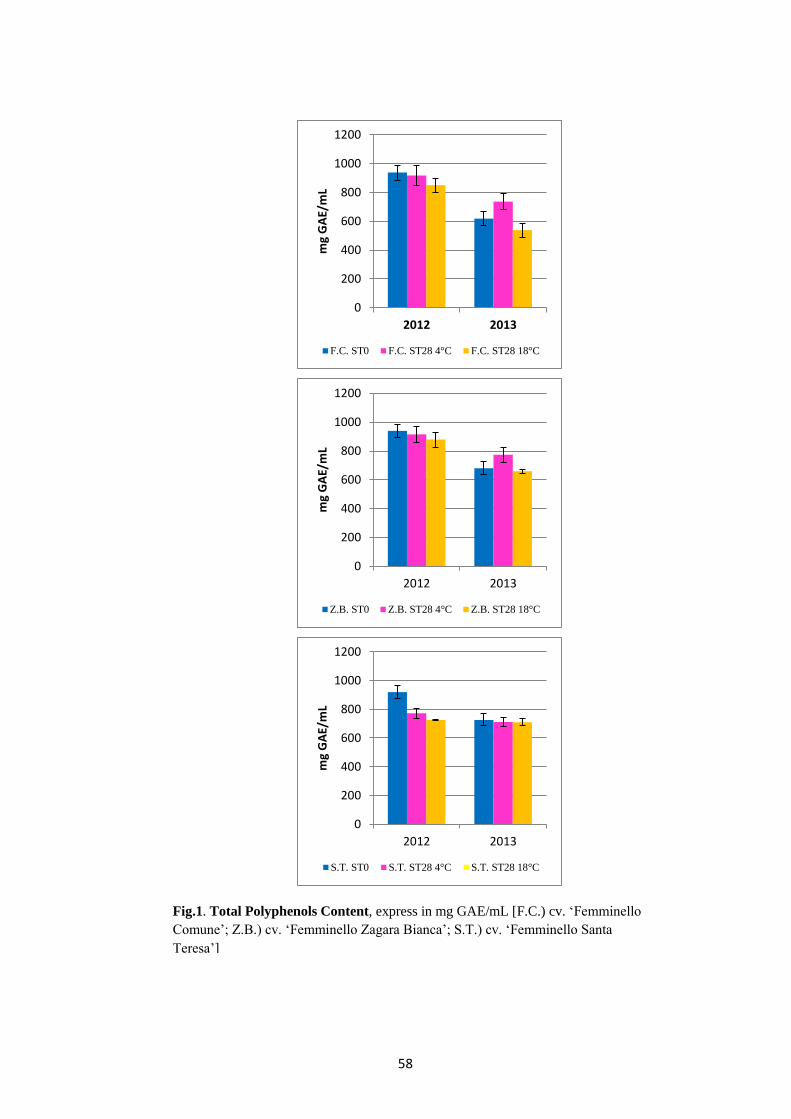
58
0
200
400
600
800
1000
1200
2012 2013m
g G
AE/
mL
F.C. ST0 F.C. ST28 4°C F.C. ST28 18°C
0
200
400
600
800
1000
1200
2012 2013
mg
GA
E/m
L
Z.B. ST0 Z.B. ST28 4°C Z.B. ST28 18°C
0
200
400
600
800
1000
1200
2012 2013
mg
GA
E/m
L
S.T. ST0 S.T. ST28 4°C S.T. ST28 18°C
Fig.1. Total Polyphenols Content, express in mg GAE/mL [F.C.) cv. ‘Femminello
Comune’; Z.B.) cv. ‘Femminello Zagara Bianca’; S.T.) cv. ‘Femminello Santa
Teresa’]
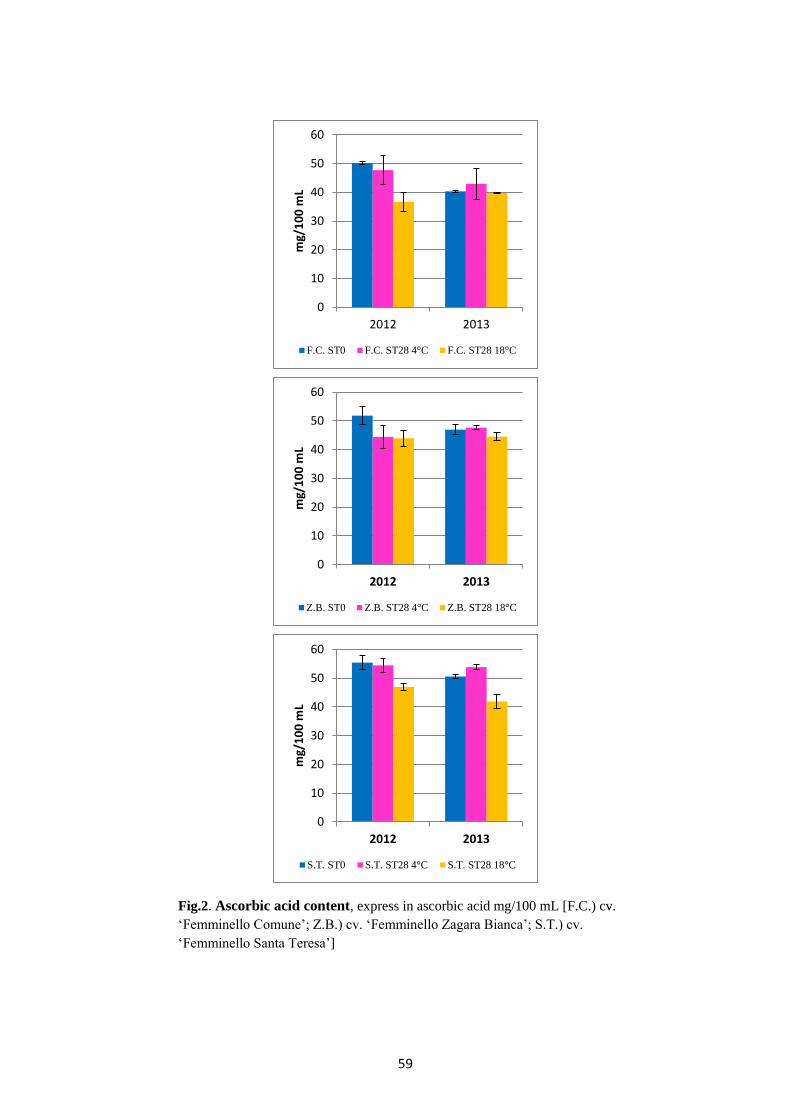
59
0
10
20
30
40
50
60
2012 2013
mg/
10
0 m
L
F.C. ST0 F.C. ST28 4°C F.C. ST28 18°C
0
10
20
30
40
50
60
2012 2013
mg/
10
0 m
L
Z.B. ST0 Z.B. ST28 4°C Z.B. ST28 18°C
0
10
20
30
40
50
60
2012 2013
mg/
10
0 m
L
S.T. ST0 S.T. ST28 4°C S.T. ST28 18°C
Fig.2. Ascorbic acid content, express in ascorbic acid mg/100 mL [F.C.) cv.
‘Femminello Comune’; Z.B.) cv. ‘Femminello Zagara Bianca’; S.T.) cv.
‘Femminello Santa Teresa’]

60
VOCs Analysis of Lemon Juices by GC-MS
The aroma characterization led to the detection and identification of 76
volatile molecules that can be divided in 6 principal chemical classes, as reported in
Appendix 1 (Tables 1, 2, and 3).
The radar plot in Figure 3 shows qualitative analyses and comparison of the
gas chromatographic peaks of the three cultivars in the two years analyzed, divided
into chemical classes and expressed as relative percentage of area. To better highlight
the small changes in the chemical classes, the plot scale used is logarithmic.
The overall aroma was richer in 2012, as shown by the total absolute areas
analysis (data not shown), especially due to the higher content of aldehydes, esters
and sesquiterpenes. Nevertheless, a larger number of molecules have been identified
in 2013, and the volatile fraction of the fruits collected in this year is characterized
by a higher content in monoterpenes.
The analysis of the volatile fractions of the juices extracted from the different
cultivars just after harvesting showed a different composition of VOCs according to
the varieties. Particularly, cultivar ‘Femminello Santa Teresa’ is characterized by a
0.01
0.10
1.00
10.00
100.00Others
Alcohols
Aldehydes
EstersKetones
Monoterpens
Sesquiterpens
ST0
FC 2013
ZB 2013
ST 2013
FC 2012
ZB 2012
ST 2012
Sesquiterpenes
Fig.3. Chemical composition of the volatile fraction of the juices of the three cvs at Storage
Time 0. F.C.) cv. ‘Femminello Comune’; Z.B.) cv. ‘Femminello Zagara Bianca’; S.T.) cv.
‘Femminello Santa Teresa’
Monoterpenes
61
higher content of alcohols (mainly 4-terpineol and α.-terpineol), aldehydes
(especially β-citral), and esters (as geraniol acetate), and a lower content of
monoterpenes, especially due to a lower content of limonene. Aldehydes and esters
are characteristics of freshly squeezed juice and, with a small number of alcohols,
contribute to citrus fresh juices green and floral odor notes (Perez-Cacho and
Rouseff, 2008). These molecules contribute to characterize the flavor of the juice of
this cultivar. In fact monoterpenes, aldehydes and esters contents were already
proved to be discrimination factors of juices from different lemon cultivars
(Allegrone et al., 2006). Particularly β-citral content was reported to be critical in the
perceived quality of lemon flavor (Rouseff and Perez-Cacho, 2007).
Regarding the response of each cultivar to the storage conditions, slight
differences were observed within the years and the cultivars. Particularly:
- Cv. ‘Femminello Comune’ (Fig. 4, Appendix 1 Tab. 1, and 2): alcohols
increased during both storage treatments in 2012, while there were no
appreciable differences in 2013. Aldehydes showed no changes with storage
in both years. Esters increased with storage at 4 °C in both years, even this
enhances was consisting only in 2012. Monoterpenes underwent to
considerable reduction with refrigerated storage in 2012. Sesquiterpenes
varied differently in response to storage, their content increased with
refrigerated storage and decreased with storage at 18 °C. Ketone content was
not affected by storage in both years.
- Cv. ‘Femminello Zagara Bianca’ (Fig. 5, Appendix 1 Tab. 1, and 2): alcohols
content increased in 2012 in response to ST28 18 °C. Substantial reduction of
aldehydes was observed with storage at 18 °C in 2013, while no changes
were observed after storage in 2012. Ester content increased with both
storage treatments in 2012, and in 2013 this enhancement was appreciable
only in refrigerated storage. Monoterpenes considerably decreased with
storage in both years. Solid increase of sesquiterpenes was observed with
refrigerated storage. Ketone content did not vary in response to storage
treatments.
- Cv. ‘Femminello Santa Teresa’ (Fig. 6, Appendix 1 Tab. 1, and 2): alcohol
and ester contents were not affected by storage treatments. Aldehydes
decreased with storage, and this reduction was consisting only in 2012.
Monoterpenes substantially increased in 2012 in response to storage, while no

62
changes were observed in 2013. Sesquiterpene content did not vary in 2013,
while in 2012 storage at 18 °C caused a valid reduction of this class.
Fig.4. Chemical composition of the volatile fraction of the juices of the cv.
‘Femminello Comune’
Fig.5. Chemical composition of the volatile fraction of the juices of the cv.
’Femminello Zagara Bianca’
0.0
0.1
1.0
10.0
100.0Others
Alcohols
Aldehydes
EstersKetones
Monoterpens
Sesquiterpens
Z.B.
ST0 2013
ST28 4°C 2013
ST28 18°C 2013
ST0 2012
ST28 4°C 2012
ST28 18°C 2012
0.0
0.1
1.0
10.0
100.0Others
Alcohols
Aldehydes
EstersKetones
Monoterpens
Sesquiterpens
F.C.
ST0 2013
ST28 4°C 2013
ST28 18°C 2013
ST0 2012
ST28 4°C 2012
ST28 18°C 2012
Sesquiterpenes
Sesquiterpenes
Monoterpenes
Monoterpenes

63
Generally, the pattern of variation depends on the cultivar and on the year.
Nevertheless, it is possible to establish a general trend of variation of some chemical
classes. Primarily, aldehyde, ester, monoterpene and sesquiterpene contents are
influenced by storage. Aldehydes content decreases with non-refrigerated storage,
while storage at 4 °C determines enhancement of esters and sesquiterpenes and
decrease of monoterpenes. A previous work reported an enhancement of ester
content and a decline of aldehydes in the juice during mandarins storage (Obenland
et al., 2011).
Considering that the perceived aroma is the results of the complex
combinations of all the molecules that constitute the volatile fraction, and is not due
to the change of single molecule or chemical class, the data were submitted to PCA
analysis merging all the collected data and using each molecule as a variable. This
analysis confirmed that the biggest differences exist between the two years of harvest
(Fig. 7). Actually, it is possible to divide the data in the PCA score plot into two big
clusters: data from fruits harvested in 2012 and data from fruits harvested in 2013.
As said before, the overall volatile pattern was different in the two years, and this
factor probably determined the different response to the storage. The data shows that
Fig.6. Chemical composition of the volatile fraction of the juices of the cv.
’Femminello Santa Teresa’
0.0
0.0
0.1
1.0
10.0
100.0Others
Alcohols
Aldehydes
EstersKetones
Monoterpens
Sesquiterpens
S.T.
ST0 2013
ST28 4°C 2013
ST28 18°C 2013
ST0 2012
ST28 4°C 2012
ST28 18°C 2012
Monoterpenes
Sesquiterpenes

64
in 2012 there was a variation in the volatile fraction caused by the storage at 18 °C,
while in 2013 the biggest changes was due to the storage at 4°C. It is important to
notice that in the performed PCA, the percentage of variability covered by each
component was very low, about 40%, meaning that the variations in the aromatic
patterns highlighted with this analysis are enlarged and the changes determined by
the different treatments analyzed could not be significant.
The major components responsible of the different volatile composition of the juices
and of the positioning of the data in the PCA plot are:
- Limonene, trans-geraniol, and α-phellandrene: the content of these
compounds were higher and characteristic in 2013, and they are responsible
of the shift along the right of the PC1 axis. Trans geraniol is characterized by
odor type floral, medium odor strength, and a sweet floral and fruity odor
description (Mosciano, 1997); α-phellandrene has a terpenic odor type,
medium odor strength, and a citrusy slight green odor description (Mosciano,
1991); Limonene has a typical citrus odor type and a medium odor strength,
its odor type is described as sweet and orange (Mosciano, 1994);
- Nonanal, decanal and undecanal: the content of these aldehydes was higher
in 2012, and determined the shift toward the left of the PC1 axis. These three
aldehydes are characterized by an odor type aldehydic, high odor strength,
and a typical green citrus-lemon peel like nuance (Mosciano, 2001);
- Β-farnesene: this sesquiterpene is the only molecule responsible of the shift
upward along PC2 axis; its content was higher in 2012 and decreased in each
cultivar with the non-refrigerated storage. It has a medium odor strength and
woody citrusy sweet odor description (Mosciano, 1996);
- Fenchol, α-terpineol, para-α-dimethyl styrene; 2,4,6-Octatriene, 2,6-
dimethyl, and 2,4,6-Octatriene, 2,6-dimethyl, E, Z: the fluctuation of these
molecules is the main responsible of the variation of the aromatic pattern
detected in 2012 in response to the treatment ST28 18 °C. In 2012, the
increase of content of these molecules with the non-refrigerated storage,
determined the shift downward along PC2 axis. Fenchol alcohol has a
balsamic odor type and medium odor strength characterized sweet lemon
odor description (Luebke, 1989). Α-terpineol has a floral, medium strength
odor type, with citrusy floral odor description. Para-α-dimethyl styrene it has
a high odor strength described as spicy and musty (Mosciano, 1996). 2,4,6-

65
Octatriene, 2,6-dimethyl, and its stereoisomer 2,4,6-Octatriene, 2,6-dimethyl,
E, Z have a floral and medium strength odor type, characterized by sweet
floral and tropical odor description (Luebke, 1983).
Generally, the shift along PC1, that covers the higher percentage of variance,
describes the effect of the year; while the shift along PC2 describes the changes in
response to storage conditions. Regarding the differences revealed between the years,
is interesting to point out that in 2012, the major contributors to the overall aromatic
pattern are represented only by aldehyde molecules. While in 2013 the overall
volatile fraction is better represented by molecules belonging to different chemical
classes, such as monoterpenes, alcohols and sesquiterpenes.
Fig.7. PCA analysis of the GC data of the years 2012 and 2013. F.C.) cv. ‘Femminello
Comune’; Z.B.) cv. ‘Femminello Zagara Bianca’; S.T.) cv. ‘Femminello Santa Teresa’
P C 1 3 7 .6 0
-1 0 -8 -6 -4 -2 0 2 4 6 8 1 0 1 2
PC
2 1
2.8
4
-1 2
-1 0
-8
-6
-4
-2
0
2
4
6
2 D G ra p h 2
X D a ta
0 1 2 3 4 5 6
Y D
ata
0
1
2
3
4
5
6
7
8
Z .B . S T 0 2 0 1 2
Z .B . S T 2 8 4 ° C 2 0 1 2
Z .B . S T 2 8 1 8 ° C 2 0 1 2
S .T . S T 0 2 0 1 2
S .T . S T 2 8 4 ° C 2 0 1 2
S .T . S T 2 8 1 8 ° C 2 0 1 2
F .C . S T 0 2 0 1 2
F .C . S T 2 8 4 ° C 2 0 1 2
F .C . S T 2 8 1 8 ° C 2 0 1 2
Z .B . S T 0 2 0 1 3
Z .B . S T 2 8 4 ° C 2 0 1 3
Z .B . S T 2 8 1 8 ° C 2 0 1 3
S .T . S T 0 2 0 1 3
S .T . S T 2 8 4 ° C 2 0 1 3
S .T . S T 2 8 1 8 ° C 2 0 1 3
F .C . S T 0 2 0 1 3
F .C . S T 2 8 4 ° C 2 0 1 3
F .C . S T 2 8 1 8 ° C 2 0 1 3
PC1 37,60%
PC
2
12
,8
4
%
66
Aroma Pattern by Electronic Nose
The e-nose results are shown in Figure 8 in a PCA score plot. It is possible to
note that the most appreciable differences were observed between the aromas of the
juices of the fruits collected in different years, confirming the GC-MS observations.
Moreover, all the cultivars showed similar aromatic patterns, and showed the same
response to the storage conditions in the two years, with a slight shift of the points of
the thesis ST28 18 °C towards PC1 axis. To better evaluate the response of each
variety, a merge of the data of each cultivar in the two years was submitted to PCA
analyses (Fig.9; Fig.10; Fig.11). All the cultivars showed the same behavior,
repeatable within the years. The e-nose seems to be able to discriminate on the basis
of the storage conditions: at storage time 0 and after 4 weeks at 4 °C the aroma
fingerprints were very similar, while after the storage at 18 °C the aroma changed. In
fact, the cluster of 18 °C measures has a shift towards the PC1 axis that represents
more than 95% of the total variance. Considering also the shift that occurs along PC2
axis, in 2013 the cv. ‘Femminello Zagara Bianca’ showed a slight displacement due
to the storage at 4 °C, as already observed in the GC data with the increase of ester
and sesquiterpene classes. Anyway, considering the low variability represented by
the PC2 axis, this shift is probably not significant, and the changes due to this kind of
refrigerated storage are not strong enough to be well perceived by the E.N. system.
Furthermore, the data of the cv. ‘Femminello Comune’ show no separation due the
storage conditions, in all the analyzed years.
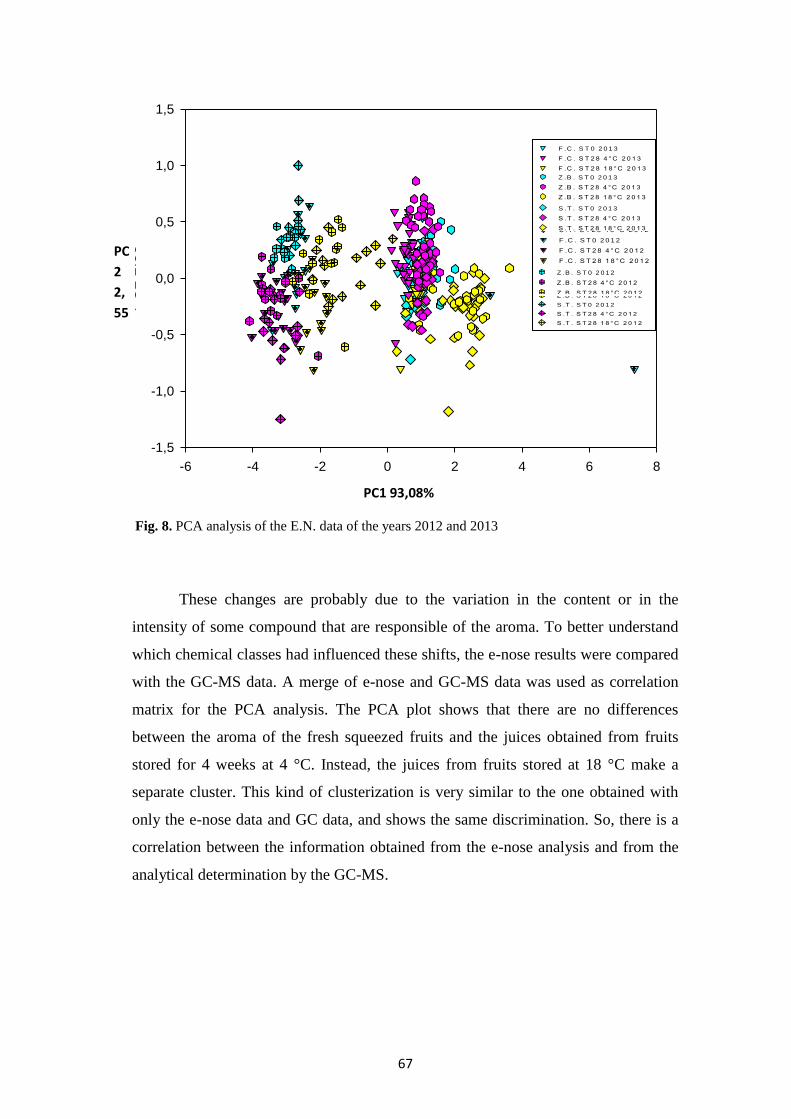
67
These changes are probably due to the variation in the content or in the
intensity of some compound that are responsible of the aroma. To better understand
which chemical classes had influenced these shifts, the e-nose results were compared
with the GC-MS data. A merge of e-nose and GC-MS data was used as correlation
matrix for the PCA analysis. The PCA plot shows that there are no differences
between the aroma of the fresh squeezed fruits and the juices obtained from fruits
stored for 4 weeks at 4 °C. Instead, the juices from fruits stored at 18 °C make a
separate cluster. This kind of clusterization is very similar to the one obtained with
only the e-nose data and GC data, and shows the same discrimination. So, there is a
correlation between the information obtained from the e-nose analysis and from the
analytical determination by the GC-MS.
PC1 96.08
-6 -4 -2 0 2 4 6 8
PC
2 2
.55
-1,5
-1,0
-0,5
0,0
0,5
1,0
1,5
2 D G ra p h 2
X D a ta
0 1 2 3 4 5 6
Y D
ata
0
1
2
3
4
5
6
7
8
Z .B . S T 0 2 0 1 2
Z .B . S T 2 8 4 ° C 2 0 1 2
Z .B . S T 2 8 1 8 ° C 2 0 1 2
S .T . S T 0 2 0 1 2
S .T . S T 2 8 4 ° C 2 0 1 2
S .T . S T 2 8 1 8 ° C 2 0 1 2
F .C . S T 0 2 0 1 2
F .C . S T 2 8 4 ° C 2 0 1 2
F .C . S T 2 8 1 8 ° C 2 0 1 2
Z .B . S T 0 2 0 1 3
Z .B . S T 2 8 4 ° C 2 0 1 3
Z .B . S T 2 8 1 8 ° C 2 0 1 3
S .T . S T 0 2 0 1 3
S .T . S T 2 8 4 ° C 2 0 1 3
S .T . S T 2 8 1 8 ° C 2 0 1 3
F .C . S T 0 2 0 1 3
F .C . S T 2 8 4 ° C 2 0 1 3
F .C . S T 2 8 1 8 ° C 2 0 1 3
Fig. 8. PCA analysis of the E.N. data of the years 2012 and 2013
PC1 93,08%
PC
2
2,
55
%

68
P C 1 9 6 .5 6
-6 -4 -2 0 2 4 6 8 1 0
PC
2 2
.29
-1 .5
-1 .0
-0 .5
0 .0
0 .5
1 .0
Fig. 10. PCA analysis of the E.N. data of the cv. ‘Femminello Zagara Bianca’. Comparison
between years 2012 and 2013
P C 1 9 6 .7 5
-6 -4 -2 0 2 4
PC
2 2
.23
-0 .8
-0 .6
-0 .4
-0 .2
0 .0
0 .2
0 .4
0 .6
0 .8
1 .0
2 D G ra p h 2
X D a ta
0 1 2 3 4 5 6
Y D
ata
0
1
2
3
4
5
6
7
8
Z .B . S T 0 2 0 1 2
Z .B . S T 2 8 4 ° C 2 0 1 2
Z .B . S T 2 8 1 8 ° C 2 0 1 2
S .T . S T 0 2 0 1 2
S .T . S T 2 8 4 ° C 2 0 1 2
S .T . S T 2 8 1 8 ° C 2 0 1 2
F .C . S T 0 2 0 1 2
F .C . S T 2 8 4 ° C 2 0 1 2
F .C . S T 2 8 1 8 ° C 2 0 1 2
Z .B . S T 0 2 0 1 3
Z .B . S T 2 8 4 ° C 2 0 1 3
Z .B . S T 2 8 1 8 ° C 2 0 1 3
S .T . S T 0 2 0 1 3
S .T . S T 2 8 4 ° C 2 0 1 3
S .T . S T 2 8 1 8 ° C 2 0 1 3
F .C . S T 0 2 0 1 3
F .C . S T 2 8 4 ° C 2 0 1 3
F .C . S T 2 8 1 8 ° C 2 0 1 3
Fig. 9. PCA analysis of the E.N. data of the cv. ‘Femminello Comune’. Comparison between
years 2012 and 2013
2 D G ra p h 2
X D a ta
0 1 2 3 4 5 6
Y D
ata
0
1
2
3
4
5
6
7
8
Z .B . S T 0 2 0 1 2
Z .B . S T 2 8 4 ° C 2 0 1 2
Z .B . S T 2 8 1 8 ° C 2 0 1 2
S .T . S T 0 2 0 1 2
S .T . S T 2 8 4 ° C 2 0 1 2
S .T . S T 2 8 1 8 ° C 2 0 1 2
F .C . S T 0 2 0 1 2
F .C . S T 2 8 4 ° C 2 0 1 2
F .C . S T 2 8 1 8 ° C 2 0 1 2
Z .B . S T 0 2 0 1 3
Z .B . S T 2 8 4 ° C 2 0 1 3
Z .B . S T 2 8 1 8 ° C 2 0 1 3
S .T . S T 0 2 0 1 3
S .T . S T 2 8 4 ° C 2 0 1 3
S .T . S T 2 8 1 8 ° C 2 0 1 3
F .C . S T 0 2 0 1 3
F .C . S T 2 8 4 ° C 2 0 1 3
F .C . S T 2 8 1 8 ° C 2 0 1 3
PC
2
2,
29
%
PC1 96,56%
PC
2
2,
23
%
PC1 96,75%

69
2.4 Conclusions
The main effect observed in this experiment was due to the influence of the year
analyzed. Probably, the high variability of the analyzed parameters could be
explained according to the differences of the climate conditions between the two
years.
The effect of the cultivar was statistically significant for all the physical and
chemical parameters analyzed in 2012, while in 2013 this effect was reduced
probably due to the environmental influence. The effect of storage was significant for
the carpometric parameters, at 18 °C as well as at 4 °C in both years.
The difference in the maturity stage between the analyzed years probably
determined the different responses obtained in the two years to storage treatments,
especially regarding total polyphenols content and vitamin C. In 2012 storage
induced a decrease of both TPC and vitamin C. On the contrary, in 2013 storage at
P C 1 9 6 .1 9
-6 -4 -2 0 2 4
PC
2 3
.00
-1 .5
-1 .0
-0 .5
0 .0
0 .5
1 .0
1 .5
2 D G ra p h 2
X D a ta
0 1 2 3 4 5 6
Y D
ata
0
1
2
3
4
5
6
7
8
Z .B . S T 0 2 0 1 2
Z .B . S T 2 8 4 ° C 2 0 1 2
Z .B . S T 2 8 1 8 ° C 2 0 1 2
S .T . S T 0 2 0 1 2
S .T . S T 2 8 4 ° C 2 0 1 2
S .T . S T 2 8 1 8 ° C 2 0 1 2
F .C . S T 0 2 0 1 2
F .C . S T 2 8 4 ° C 2 0 1 2
F .C . S T 2 8 1 8 ° C 2 0 1 2
Z .B . S T 0 2 0 1 3
Z .B . S T 2 8 4 ° C 2 0 1 3
Z .B . S T 2 8 1 8 ° C 2 0 1 3
S .T . S T 0 2 0 1 3
S .T . S T 2 8 4 ° C 2 0 1 3
S .T . S T 2 8 1 8 ° C 2 0 1 3
F .C . S T 0 2 0 1 3
F .C . S T 2 8 4 ° C 2 0 1 3
F .C . S T 2 8 1 8 ° C 2 0 1 3
Fig. 11. PCA analysis of the E.N. data of the cv. ‘Femminello Santa Teresa’. Comparison
between years 2012 and 2013
Fig. 10. PCA analysis of the E.N. data of the cv. ‘Santa Teresa’. Comparison
between years 2012 and 2013
PC
2
3,
00
%
PC1 96,19%

70
18 °C determined a decrease, while refrigerated storage caused an increase of
bioactive compounds.
By the e–nose measurements, all the cultivars showed a variation of the
aroma depending on the storage conditions. The e–nose responses were confirmed by
the GC data, which show a different behavior of the chemical classes, mainly due to
an increase in the percentage of alcohols, esters and sesquiterpenes, and a decrease of
aldehydes and monoterpenes. The E.N. results showed no discrimination among the
aromatic pattern of the three cultivars tested. GC-MS results, instead, highlighted a
different composition in the volatile composition of the cultivar ‘Femminello Santa
Teresa’.
Regarding the changes observed in the different chemical classes, the
environmental influence was stronger than the treatments imposed, providing no
significant changes. Analyzing just the general content of each chemical class, it is
interesting to highlights that aldehydes, esters, and sesquiterpenes were significant
higher in 2012, while in 2013 there was a major content of monoterpenes. This is
consistent with the different maturity stage of the fruits in the two analyzed years,
determined by chemical parameters analysis. Fruits collected in 2012 were less
mature and the volatile fraction was richer in aldehydes and esters that are
responsible of green and fruity notes.
So, both the e-nose and the GC-MS revealed that only some modifications
occurs in the volatile pattern due to the storage conditions, but the merge of data is
not always easy to understand. Future work are needed do better understand the
possibility of establishing a correlation between the two techniques, leading to a
simple and rapid method to control the aroma quality during the storage that can be
adopted by the food and storage industries.

71
3. EXPERIMENT 2:
Application of a new electronic nose instrument to assess the
effects of some postharvest treatments on the quality of
‘Salustiana’ orange juice
Abstract
Salustiana oranges were picked at different steps of a commercial fruit
packing line: right after harvesting, after the washing, after the ethylene
degreening, and after waxing. Fruits were stored for 0, 4, or 8 weeks at 4°C
followed by one week at 20°C. Fruits were individually weighted and analyzed for
percentage of juice content, Total Soluble Solids, and Titratable Acidity. The
aromatic patterns of orange juices were evaluated by two different electronic nose
instruments, in order to taste the ability of the two instruments to monitor the
changes that occur during storage. Moreover, volatile fractions were analyzed by
GC-MS techniques.
.
3.1 Introduction
The majority of citrus fruits are consumed as fresh product, and this clearly
indicates the importance to preserve the natural qualities of fresh citrus after
harvesting. To achieve this objective, one of the most critical point is represented by
the postharvest treatments and storage. In fact, all packing house operations until the
arrival of the products to the final market play a very important role in maintaining
the quality characteristics of the fruits. Storage is one of the most critical point in the
commercialization of citrus fruits. In fact, all the alterations that can be induced by
the postharvest treatments are amplified during the storage.
It is well known that all of the steps of the packing house have potential
effects on the internal quality of citrus fruits, and for this reason in the recent years
many studies has been conducted to optimize the use of all these treatments in order
to reduce undesired effects and quality decay during storage (Obenland et al., 2009).

72
Ethylene degreening is one of the most common practice in citrus postharvest
management that can stimulate various ripening related processes, as the destruction
of chlorophyll pigments and the formation of carotenoids in the peel tissue (Rodrigo
and Zacarias, 2007). Previous works reported different effects of the degreening on
fruits and juices quality attributes, showing very slight effects (Mayuoni et al., 2011);
or severe physiological and biochemical (Rodrigo and Zacaria, 2007), that can even
involve alterations in the volatile composition of the aromatic pattern and the
development of off-flavors (Testoni et al., 1992), related to the accumulation of
ethanol (Sdiri et al., 2012).
Wax coating is usually applied with an esthetical purpose, to make fruits
more attracting to consumers. But coating does not have only this effect, limiting gas
exchanges between the fruit surface and the external atmosphere, and modifying the
internal atmosphere of the fruits, enhancing the level of CO2 and reducing O2. This
can lead to the production and accumulation of off-flavor volatile, such as ethanol
and acetaldehyde (Tietel et al., 2011). The effect of wax on quality attributes of citrus
fruits is not well clear. The modified atmosphere can lead to an alteration in the
Soluble Solids Content/Titratable Acidity ratio and in the composition of aroma
volatiles, some increasing, other decreasing and some of them positively correlated
with taste and aroma (Obenland et al., 2008). In two different studies, Baldwin et al.
(1995) and Hagenmaier and Shaw (2002) did not find any effect of waxing during
the storage of oranges, grapefruit or tangerines. Also Obenland in a study conducted
in 2008 on navel oranges, did not find a clear effect of waxing and storage on sugar
and acidity levels. However, the effect of the coating treatment is strictly dependent
of the type of wax used (Marcilla et al., 2009; Hagenmaier, 2002).
To understand the combined effect of the postharvest treatments and how
they act together during the storage and the shelf life to modify the quality can be
very useful.
The objectives of this research were: a) to evaluate the quality of ‘Salustiana’
juice squeezed from fruits submitted to postharvest treatments with fungicide,
degreening and wax coating, by monitoring the changes in the aroma fingerprint; b)
to evaluate the effect of different treatments during two different fruits storage
conditions, on the aromatic pattern of juices; c) to evaluate the capacity of a new
Electronic Nose instrument to monitoring the change in volatile composition of
‘Salustiana’ oranges submitted to different postharvest treatments and storage
73
conditions. Moreover, different methods of sample classification, such as Bayesian
nets, Artificial Neuron Networks and classification tree were applied.
3.2 Materials and Methods
Plant Material
This study was carried on fruits of ‘Salustiana’ orange (Citrus sinensis L.
Osbeck), purchased by Emilio Esteve (www.emilioesteve.com) farm located in
Xeraco, in the region of Valencia, Spain. Fruits were harvested on 13 December
2013, at the commercial maturity stage. A total of 160 fruits were divided in four
theses, 40 fruits for each sample, and four postharvest treatments were conducted,
respectively. After the treatments, the fruits were transported to the laboratory of the
“Departamento de Ingeniería Electrónica”, Polytechnic University of Valencia for
the storage tests.
Postharvest treatments
Different postharvest treatments were conducted picking up the samples in
subsequent step of the packing line. Precisely:
- Control: fruits were provided and analyzed directly right after the harvest;
- Chemical treatment: fruits were drenched with a mixture of fungicide
product, namely Fecundal S-7,5 6 L/1000 L, biostimulant product, namely
Fortisol Ca Plus 8 L/1000 L; and oxidizing product, like Oxypure 902 DW-50
1,8 L/1000 L, for the disinfection of water;
- Ethylene degreening treatment: after the packing line fruits were stored for 72
h with the application of 1.5 ppm of ethylene and a continuous flow regulated
at 22 ±1 °C, and 95% - 98% of relative humidity, and CO2 concentration at
3.000 ppm;

74
- Wax treatment: to evaluate the effect of the entire packing line, fruits were
analyzed at the end of the process after coating with Citrosol Imad 2 VS UE,
a commercial emulsion with a polyethylene/shellac ratio of 20% (w/v) and an
Imazalil content of 0.2%.
Storage conditions
The samples were analyzed in the first 24 - 48 h after harvest (T0). Treated
and control fruits were stored at 5±1 °C and 85% RH for eight weeks and analyzed
after four (T1), and after eight weeks (T2) to assess the changes occurring during the
storage. After the storage period, all the fruit were kept at 20 °C for 7 days to
simulate the shelf-life conditions (T3).
Methods
For each treatment and storage period, 10 fruits were individually weighted,
and the longitudinal and transverse diameters were measured with a digital caliper.
All the fruits were then squeezed and the juice was used to analysis of juice yield,
soluble solids content (TSS), titratable acidity (TA), Maturity Index (MI), pH and
aromatic pattern.
Total soluble solid content was evaluated with a digital refractometer with automatic
temperature compensation (Atago) and expressed as °Brix.
Control fruits Chemical fruits
Ethylene fruits Wax fruits

75
Titratable acidity was determined by titrating to pH 8.1 using 0.1 N NaOH and
expressed as g/ L of citric acid.
Maturity Index was calculated as the ratio between TSS, expressed in °Brix, and
TA, expressed in percentage (%).
The aromatic pattern of the juice was analyzed with the two following Electronic
Nose instruments:
- Electronic Nose EOS835 (Sacmi): two milliliters of pure juice were placed
into a 20 mL glass vial, sealed and incubated for 5 min at 50 °C under
stirring. The measurement duration was 27 minutes. The instrument is
equipped with an array of 6 MOS sensors (as described in paragraph 3.3.2.1).
- Multisensory Odor Olfactory System – MOOSY32: for the aromatic
pattern analysis, 10 mL of juice was kept in a Petri dish maintained at 25 °C.
Total acquisition time was 3,5 minutes and the air flow was settled at 0,5 m/s.
After 2 minutes of equilibration time, in which the sample was placed in the
acquisition chamber, for each analysis were made 5 repetitions with a delay
between repetitions of 10 sec. The instrument is equipped with an array of 32
MOS sensors (as described in paragraph 3.3.2.2).
The volatile fraction was evaluated using a Gas Chromatographer equipped with
a Mass Spectrometer (GCMS QP2010, Shimadzu). The instrument was equipped
with a SLB5-ms capillary column (30 m x 0,25 mm x 0,25 µm, Supelco), and settled
as previously described by Costa et al. (2010), with some modifications (Cupane et
al., 2012). Before analysis, samples were conditioned for 30 minutes at 60 °C, with
the addition of salt in order to promote the removal of volatile molecules from the
juice matrix. The volatile fraction was sampled with the headspace solid phase micro
extraction (HS-SPME) technique using a Car/PDMS fiber (1 cm, Supelco).
The peaks identification was performed through comparison of the
experimental mass spectra and those reported in the National Institute of Standards
and Technologies (NIST) libraries incorporated in the instrument software (GCMS
solution Library, Shimadzu) and by comparison with previous studies on citrus fruits
(Yo and Lin, 2004; Allegrone et al., 2006; Dharmawan et al., 2007; Tounsi et al.,
2010; Gonzalez-Mas et al., 2011; Saura et al., 2012). Libraries used were: NIST 21,
NIST 107, and NIST 147. Only the molecules recognized with a percentage of

76
similarity greater than 90% were used for this study. All the analyses were performed
for each sample in duplicate.
Statistical Analysis
Physical and chemical parameters data were submitted to two-way Analysis
of Variance (ANOVA) using the software SYSTAT 13 (Systat Software Inc.) and
analyzed for the effects of treatment and time. Means are separated using Tuckey
Honestly Significant Difference Test.
For the e-nose sensors responses, a multivariate classification analysis with
the software WEKA using different algorithms was performed. WEKA is an open
source software issued under the GNU General Public License (Hall at al., 2009).
The different algorithms applied were: two probabilistic models, Bayes Net and
Naïve Bayes, that calculate a set of probabilities by counting the frequency and
combination values on a given data set; two Artificial Neuron Networks (ANN),
Multi-Layer Perceptron (MLP) and Radial Basis Function network (RBF), that
permit to create a model, during a training test, that is able to classify the data
(Batista et al., 2012); a classification tree, J48 that is a support system that uses a
tree- like graph decisions and their possible after effect; and a lazy algorithm named
IB1, that uses the technique of the ‘Nearest Neighbour’ to classify new instances
using a similarity function to calculate the similarity between the training instance
and the instances of the data set (Barrueta et al., 2007).
The classification analysis consists in the organization of data in classes, using given
class labels to order the objects in the data collection. Classification approaches
normally use a training set where all objects are already associated with known class
labels. The classification algorithms learn from the training set to build a model. The
model is used to classify new objects (Patil and Sherekar, 2013). ANNs learn from
examples through iteration, without requiring a priori knowledge of the relationship
among variables under investigation (Benedetti et al. 2004).
The results are illustrated in the confusion matrix that represents the accuracy of the
solution of the classification problem. It allows the visualization of the performance
of an algorithm. Each column of the matrix represents the instances in a predicted
class, while each row represents the instances in the actual class. The ideal result is to

77
have all the samples end up on the diagonal cells of the matrix (Benedetti et al.
2004).
3.3 Results and Discussion
Physical and Chemical Parameters of Treated Orange Fruits
Carpometric parameters were significantly affected by storage time, but the
interaction between treatment and storage time was not statistical significant,
meaning that, regardless of the treatment applied, the variation of the carpometric
parameters during storage remains unchanged (Tab. 1). Juice content was not altered
by storage. Storage had no significant effect on TSS or TA values (Tab. 2).
Regarding maturity index, it was significantly affected by storage time, generally
increasing over time. This parameter allows noticing that there are slight differences
in content of TSS and TA that cause the enhancement of this index. These results are
in general agreement with those reported from previous work (Marcilla et al., 2006).
Moreover, similar studies demonstrated that fruit quality can be properly preserved
in cold conditions for long period of time, resulting only in a small reduction of
flavor quality, and a small enhance in the VOCs content, weight loss and maturity
index (Martínez Jávega et al., 1991; Baldwin et al., 1995).
Titratable Acidity: Acidity content decreased after 4 weeks and enhanced after 8
weeks. The storage week at 20 °C led to a decrease in its content. Ethylene treatment
caused a lower level of TA that remains lower respect to the other treatments, as
previously showed in experiment using ‘Mosambi’ oranges (Ladaniya and Singh,
2001).
Total Soluble Solids: Soluble solids content was found to be more stable during
storage, with respect of TA content. This caused an increase of maturity index as
consequence of the last storage week at 20 °C.
pH: pH values generally registered a slight increase with storage. Its content reflects
the variations in total acidity content.

78
Treatment Time Weight
(g)
DL
(mm)
DT
(mm) Juice % (w/w)
Control
T0 220,2±8,4 71,1±3,4 76,1±5,1 49,6
T1 181,0±28,8 67,5±4,0 71,9±4,0 52,4
T2 157,3±13,8 63,1±3,4 66,9±3,4 53,6
T3 161,0±24,8 61,1±2,8 67,3±4,4 53,3
Chemical
T0 194,2±21,1 70,1±4,2 73,9±3,1 53,0
T1 168,6±24,2 66,5±4,2 70,8±4,3 52,8
T2 159,9±26,0 65,6±3,9 67,0±4,4 52,5
T3 150,4±20,2 61,9±5,0 66,2±3,8 52,8
Ethylene
T0 221,0±17,3 69,9±4,8 77,5±2,4 52,3
T1 211,1±25,1 68,6±6,4 75,2±3,8 52,1
T2 204,0±34,0 67,9±5,4 74,7±5,7 51,1
T3 183,0±33,0 63,3±3,9 70,5±5,1 54,2
Wax
T0 164,0±2,4 64,8±3,5 68,5±1,9 53,8
T1 162,1±6,1 63,0±4,3 66,3±2,0 54,1
T2 149,1±5,1 60,5±2,2 65,0±2,3 54,1
T3 136,9±5,6 58,2±3,7 63,1±1,5 56,3
Treatment ** ** ** NS
Time ** ** ** NS
Tab. 1. Physical parameters of the analyzed fruits
p-value is determined by ANOVA for P<0,05. For each parameter, p indicates differences among
Treatments and Time.
Time T0: just harvest; T1: after 4 weeks at 4 °C; T2: after 8 weeks at 4 °C; T3: after an additional
week at 20 °C. Main effects are indicated as non-significant (NS) or significant at either the *
p<0,05 or **p<0,01
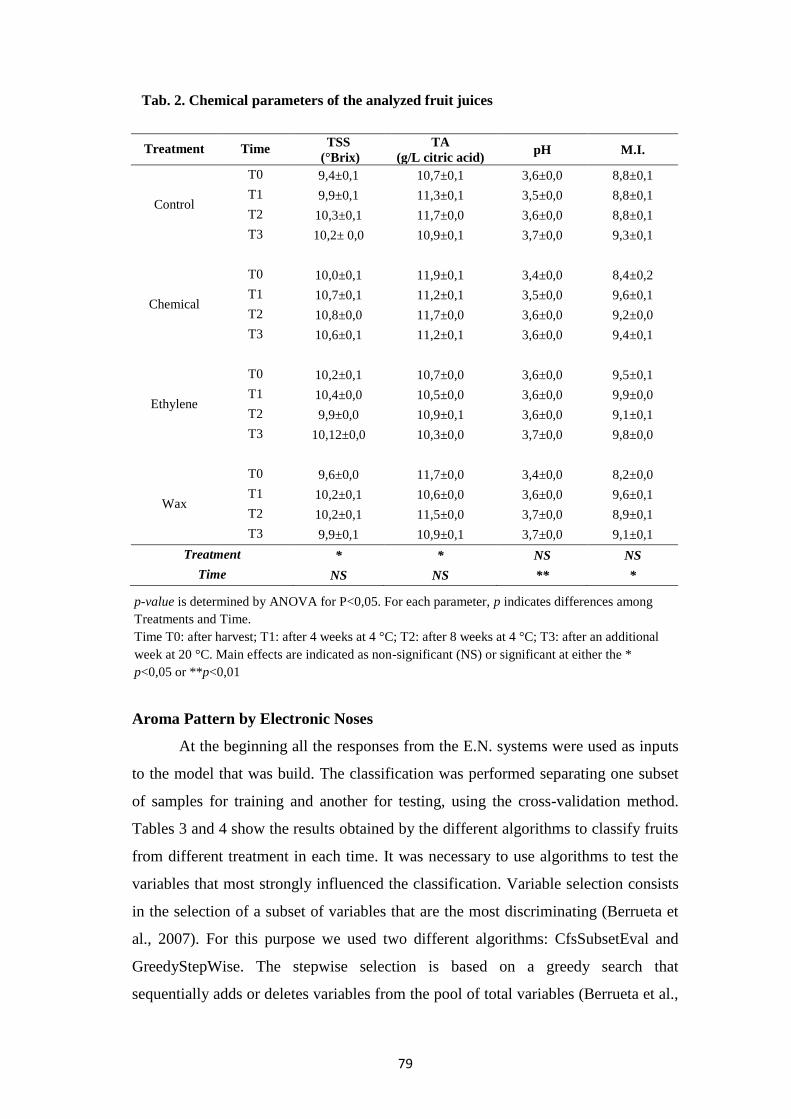
79
Treatment Time TSS
(°Brix)
TA
(g/L citric acid) pH M.I.
Control
T0 9,4±0,1 10,7±0,1 3,6±0,0 8,8±0,1
T1 9,9±0,1 11,3±0,1 3,5±0,0 8,8±0,1
T2 10,3±0,1 11,7±0,0 3,6±0,0 8,8±0,1
T3 10,2± 0,0 10,9±0,1 3,7±0,0 9,3±0,1
Chemical
T0 10,0±0,1 11,9±0,1 3,4±0,0 8,4±0,2
T1 10,7±0,1 11,2±0,1 3,5±0,0 9,6±0,1
T2 10,8±0,0 11,7±0,0 3,6±0,0 9,2±0,0
T3 10,6±0,1 11,2±0,1 3,6±0,0 9,4±0,1
Ethylene
T0 10,2±0,1 10,7±0,0 3,6±0,0 9,5±0,1
T1 10,4±0,0 10,5±0,0 3,6±0,0 9,9±0,0
T2 9,9±0,0 10,9±0,1 3,6±0,0 9,1±0,1
T3 10,12±0,0 10,3±0,0 3,7±0,0 9,8±0,0
Wax
T0 9,6±0,0 11,7±0,0 3,4±0,0 8,2±0,0
T1 10,2±0,1 10,6±0,0 3,6±0,0 9,6±0,1
T2 10,2±0,1 11,5±0,0 3,7±0,0 8,9±0,1
T3 9,9±0,1 10,9±0,1 3,7±0,0 9,1±0,1
Treatment * * NS NS
Time NS NS ** *
Aroma Pattern by Electronic Noses
At the beginning all the responses from the E.N. systems were used as inputs
to the model that was build. The classification was performed separating one subset
of samples for training and another for testing, using the cross-validation method.
Tables 3 and 4 show the results obtained by the different algorithms to classify fruits
from different treatment in each time. It was necessary to use algorithms to test the
variables that most strongly influenced the classification. Variable selection consists
in the selection of a subset of variables that are the most discriminating (Berrueta et
al., 2007). For this purpose we used two different algorithms: CfsSubsetEval and
GreedyStepWise. The stepwise selection is based on a greedy search that
sequentially adds or deletes variables from the pool of total variables (Berrueta et al.,
p-value is determined by ANOVA for P<0,05. For each parameter, p indicates differences among
Treatments and Time.
Time T0: after harvest; T1: after 4 weeks at 4 °C; T2: after 8 weeks at 4 °C; T3: after an additional
week at 20 °C. Main effects are indicated as non-significant (NS) or significant at either the *
p<0,05 or **p<0,01
Tab. 2. Chemical parameters of the analyzed fruit juices

80
2007). The addiction or deletion of a variable is determined based on the largest
improvement in the classification, until the search finds the most influencing
variables.
Sample type
Classifier algorithm % accuracy
Bayes Net Naive
Bayes MLP RBF J48 IB1
T0 20 35 40 25 30 40
T1 93,06 94,44 93,06 93,06 94,44 91,67
T2 95,77 88,73 92,96 90,14 92,96 94,37
T3 90,41 65,75 95,89 86,3 90,41 84,83
Sample type
Classifier algorithm % accuracy
Bayes Net Naive
Bayes MLP RBF J48 IB1
T0 92,5 95 95 97,5 88,75 97,5
T1 100 100 100 100 96,25 100
T2 97,5 97,5 98,75 98,75 91,25 97,5
T3 87,5 93,75 87,5 92,5 85 90
The results show as:
- EOS835 is not able to distinguish among the different juice samples at T0;
- General classification accuracy is better in MOOSY32 than in EOS835;
- In the MOOSY32, the algorithm J48 permitted the worse classification, and
the percentage of accuracy decreased with time. Not the same for EOS835. It
can be due to the diverse number of sensors, and information that had to be
processed;
- The applied algorithms showed different performances;
- In the MOOSY32the classification accuracy decreased over time and it is
maximum in storage time T2, after 8 weeks of storage at 4 °C;
- In the EOS835 system the classification accuracy was higher in T1, after 4
weeks of refrigerated storage, and decreased over time.
It is interesting to notice that, while in the other analysis time the classification was
better in the MOOSY32, in T3 is the opposite with EOS835 having the best
percentage of correct classifications.
Tab. 3. Results of the used classification algorithms for the EOS835
Tab. 4. Results of the used classification algorithms for the MOOSY32

81
Detailed confusion matrices of each algorithm applied in each time of storage are
presented in Appendix 2 (Tab. 6).
Both instruments allowed a good classification of the analyzed juice samples
according to the time of storage, with better results using the MOOSY32. It is
possible to highlight a trend in the observed data:
- T0: this time gave the worst classification, especially for EOS835. The
aromatic patterns were similar right after the treatments. The lower
percentage of classification is caused by confusion between ‘Control’ and
‘Chemical’;
- T1 and T2: showed the greater percentage of correctly classified instances
with some accuracy difference due to the different instruments and
algorithms;
- T3: this time permits the worst classification with all the algorithms.
These results are consisting with the hypothesis that initially the aromatic patterns
were quite similar (T0), but with slight differences that permitted the classification.
Since fruits belonging to the same lot, the differences at T0 can only be due to the
applied treatments. Major mistakes in classification were mainly due to un-correct
classification of ‘Control’ and ‘Chemical’ treated samples.
With advancing of time the aromatic patterns became more different, resulting in an
increase of the correctly classified instances. After 4 and 8 weeks of storage (T1 and
T2) the instruments were able to better classify the samples, meaning that the major
changes occurred during this period. It is possible to suppose that the different
treatments caused variations in the internal atmosphere of fruits, probably due to
metabolic changes and variations in the respiration rate, as reported in literature
(Rodrigo and Zacaria, 2007; Mayuoni et al. 2011; Tietel et al., 2011), that led to
different VOCs production and consequently to changes in the aromatic pattern.
The last analysis time (T3) gave the worst results. There were no more detectable
differences in the aromatic patterns that became similar for all the treatments after a
week of storage at 20 °C. All the changes that were stimulated by the applied
treatments were amplified by the storage, and overall by the temperature of storage.
To confirm this hypothesis and to better understand the evolution of the aromatic
pattern, juice samples were analyzed by GC-MS instrument.
VOCs Analysis of Orange Juices by GC-MS

82
The aroma characterization led to the detection and identification of 72
volatile molecules that can be divided in 6 principal chemical classes, as reported in
Appendix 2 (Tables 3, and 4). The radar plots, in Figures 1, 2, 3 and 4, show
qualitative analyses and comparison of the gas chromatographic peaks of the
analyzed juices, divided into chemical classes and expressed as a percentage of area.
To better highlight the small changes in the chemical classes, the plot scale used is
logarithmic.
There was a general trend in the variation of several chemical classes over
time, with aldehyde and alcohol contents tending to diminish, and ester and
sesquiterpene contents increasing. Regarding aldehydes, hexanal was the major
molecule that contributes to this class. It is an important aldehyde that characterize
orange flavor, and its content dramatically decreased with storage and was not
detectable after the week of simulated shelf life. Several molecules contribute to the
alcohol content, and its variation depended on the variation of several molecules,
such as 1-octanol, β-linalool, β-terpineol, nonanol, 3-exen-1-ol, and 4-terpineol. For
this chemical class, the variation was more accentuated between T0 and T1, and then
the overall content remained stable. Especially β-linalool and 3-exen-1-ol are
important molecules, whose content makes a positive contribution to orange flavor in
combination with other volatiles, being responsible respectively of a floral-woody
odor with a faintly citrusy note (Arctander, 1969), and of a fruity-green flavor in
fresh orange juice. Β-linalool was present in major amount in ‘Control’ fruits, and 3-
exen-1-ol is detected only in ‘Control’ and ‘Chemical’ fruits. The decrease of both
these compounds over time is consistent with the decrease of orange flavor in
response to storage and to different treatments.
Ester and sesquiterpene contents tended to enhance with time. Fruits of the
‘Control’ were characterized by a lower content of esters, especially ethyl butanoate
and ethyl hexanoate. As previously reported, its content increases with maturation
(Selli et al., 2004). Sesquiterpene content increased after 4 weeks of storage, and then
remained stable. The major contributors to this chemical class were valencene,
whose content was higher in the ethylene and wax treatments, and β-panasinsene.
Monoterpene content remained almost stable with time and treatments. Being esters
and aldehydes the primary contributors to fresh orange flavor (Bruemmer, 1975)
their content reflect the major changes that occur in fruit aroma as a consequence of
the packing line and storage.

83
Analyzing each time specifically, it is interesting to notice that at T0 (Fig. 1),
right after the treatments, the volatile composition was similar in groups of two:
‘Control+Chemical’ and ‘Ethylene+Wax’. This clusterization remained stable in T1
(Fig. 2), then the differences tended to flatten. After 8 weeks of refrigerated storage
(T2, Fig. 3) the aromatic pattern of fruits submitted to chemical treatments became
similar to that of ‘Ethylene+Wax’, while ‘Control’ remained different. The major
variations were related to the aldehyde, ester and sesquiterpene contents. After
another week of storage at 20 °C the volatile composition of all the fruits, regardless
of treatment, was very similar (T3, Fig. 4). The only remarkable difference
concerned the esters remained lower in ‘Control’ fruits, while it increased in the
other treatments. Even if previous work showed a positive correlation among esters
and orange flavor (Selli et al., 2004), this enhance over time is not necessarily
positive for the aromatic pattern of the juice because it can lead to an altered balance
in the fruit aroma, which is dependent on the correct proportion of the different
compounds (Shaw, 1979). It was also reported that ethyl butanoate and ethyl
hexanoate contents increase in concentration over the course of the storage in packed
orange fruits, while it is not detected in fruits that did not pass through the packing
line (Obenland et al., 2008).

84
Fig.1. Chemical composition of the volatile fraction of the juices at Storage Time 0
Fig.2. Chemical composition of the volatile fraction of the juices at Storage Time 1, after 4
weeks at 4°C
0.0
0.1
1.0
10.0
100.0?
Alcohols
Aldehydes
EstersKetones
Monoterpenes
Sesquiterpenes
TIME 1
CONTROL
CHIMICAL
ETHYLENE
WAX
Other
0.0
0.0
0.1
1.0
10.0
100.0?
Alcohols
Aldehydes
EstersKetones
Monoterpenes
Sesquiterpenes
TIME 0
CONTROL
CHIMICAL
ETHYLENE
WAX
Other
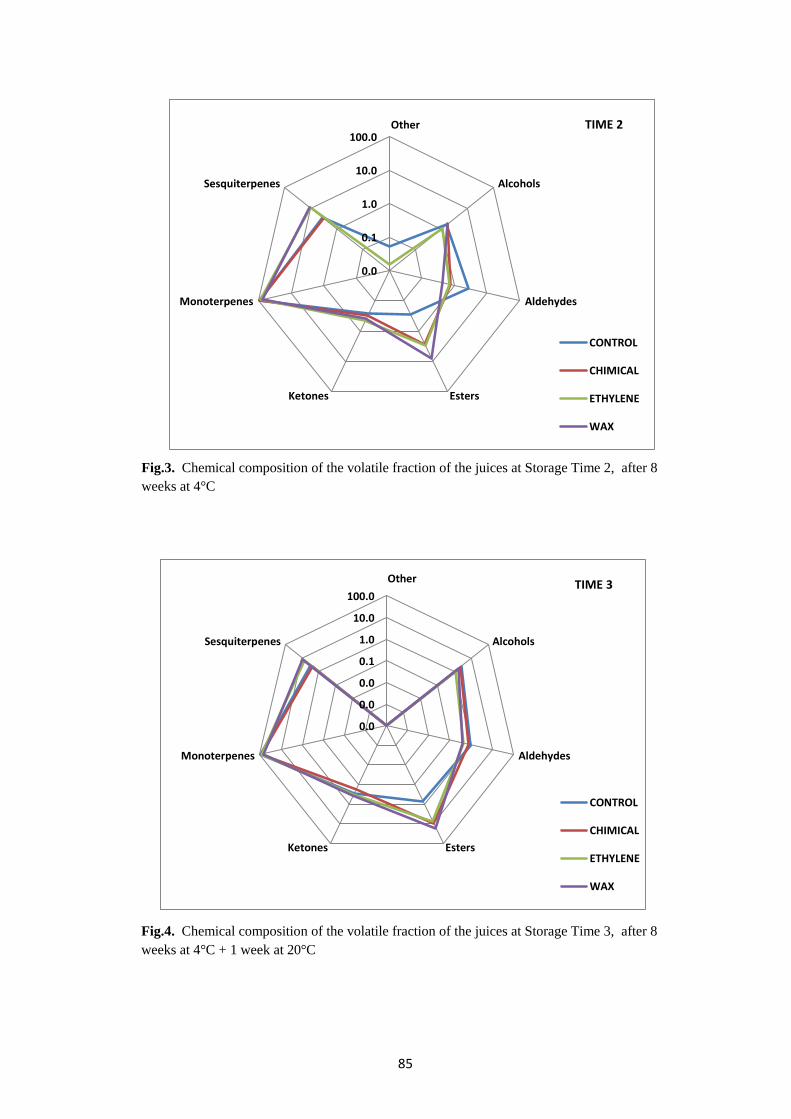
85
Fig.3. Chemical composition of the volatile fraction of the juices at Storage Time 2, after 8
weeks at 4°C
Fig.4. Chemical composition of the volatile fraction of the juices at Storage Time 3, after 8
weeks at 4°C + 1 week at 20°C
0.0
0.1
1.0
10.0
100.0?
Alcohols
Aldehydes
EstersKetones
Monoterpenes
Sesquiterpenes
TIME 2
CONTROL
CHIMICAL
ETHYLENE
WAX
Other
0.0
0.0
0.0
0.1
1.0
10.0
100.0?
Alcohols
Aldehydes
EstersKetones
Monoterpenes
Sesquiterpenes
TIME 3
CONTROL
CHIMICAL
ETHYLENE
WAX
Other

86
The PCA analysis of the chromatogram peaks is showed in Figure 5. This
analysis confirmed that the biggest differences exist between the two groups
‘Control+Chemical’ and ‘Ethylene+Wax’, that forms two big clusters in the PCA
loading plot, and that the overall aromatic pattern tends to change principally after 8
weeks of storage. Moreover, PCA analysis highlighted that the major variations
determined by the storage are detectable in ‘Control’ fruits. Generally, the shift along
PC1 describes the effect of the storage time that is the main effect observed, while
the shift along PC2 describes the effect of the treatments. In fact, PC1 is the axis that
covers the higher percentage of variance and describes the most significant effect, i.e.
storage time and temperature effect. PC2, that cover the lower percentage of
variance, describes the minor effect of the treatments applied to the fruits.
The major components responsible of the different volatile composition and of
the positioning of the data in the PCA plot are:
- Eudalene, 3-Carene, and nootkatone the content of these molecules increased
with time and was characteristics of T2 and T3, being absent in T0 and T1 in
‘Control’, ‘Chemical’, and ‘Ethylene’ treated fruits. These compounds
determined the displacement of data toward the right of PC1 axis, and possess
a sweet citrus odor type with a medium odor strength;
- Levo-carvone, β-trans-ocimene, and 4-acetyl-1-methylcyclohexene, the
content of these compounds was higher in T0 and tended to decrease with
storage. These molecules are responsible of the shift along the left of the PC1
axis. Levo-carvone has a medium odor strength and a sweet minty herbal
odor type (Luebke, 1993); while the ketone 4-acetyl-1-methylcyclohexene is
characterized by a spicy odor type, both of them are recognize to be
important contributors to orange flavor; and β-trans-ocimene lends a sweet
herbal note;
- Cumaldehyde, Allo-aromadendrene, α-caryophyllene, α-gurjunene and β-
panasinsene. These compounds are responsible of the upward shift along
PC2, and their content is higher in ‘Ethylene’ and ‘Wax’ treated fruits.
Cumaldehyde has a spicy odor type with high odor strength, characterized by
spicy-green odor (Mosciano, 1985); the other molecules that determined the
displacement upward PC2 are sesquiterpene compounds that are
characterized by a woody odor type

87
- 1-hexanol, the variation of the content of this molecule determined the shift
of the data downward along PC2 axis. It is characterized by herbal odor type
of medium strength, with pungent fruity, sweet and alcoholic note (Mosciano,
1993).
Fig.5. PCA analysis of the GC data
P C 1 2 8 .8 0
-8 -6 -4 -2 0 2 4 6 8 1 0 1 2
PC
2 1
6.8
2
-1 0
-8
-6
-4
-2
0
2
4
6
8
C O N T R O L T 0
Q U IM IC A T 0
E T H Y L E N O T 0
C E R A T 0
C O N T R O L T 1
Q U IM IC A T 1
E T H Y L E N O T 1
C E R A T 1
C O N T R O L T 2
Q U IM IC A T 2
E T H Y L E N O T 2
C E R A T 2
C O N T R O L T 3
Q U IM IC A T 3
E T H Y L E N O T 3
C E R A T 3
C O N T R O L T 0
Q U IM IC A T 0
E T H Y L E N O T 0
C E R A T 0
C O N T R O L T 1
Q U IM IC A T 1
E T H Y L E N O T 1
C E R A T 1
C O N T R O L T 2
Q U IM IC A T 2
E T H Y L E N O T 2
C E R A T 2
C O N T R O L T 3
Q U IM IC A T 3
E T H Y L E N O T 3
C E R A T 3
C O N T R O L T 0
Q U IM IC A T 0
E T H Y L E N O T 0
C E R A T 0
C O N T R O L T 1
Q U IM IC A T 1
E T H Y L E N O T 1
C E R A T 1
C O N T R O L T 2
Q U IM IC A T 2
E T H Y L E N O T 2
C E R A T 2
C O N T R O L T 3
Q U IM IC A T 3
E T H Y L E N O T 3
C E R A T 3
C O N T R O L T 0
Q U IM IC A T 0
E T H Y L E N O T 0
C E R A T 0
C O N T R O L T 1
Q U IM IC A T 1
E T H Y L E N O T 1
C E R A T 1
C O N T R O L T 2
Q U IM IC A T 2
E T H Y L E N O T 2
C E R A T 2
C O N T R O L T 3
Q U IM IC A T 3
E T H Y L E N O T 3
C E R A T 3
C O N T R O L T 0
Q U IM IC A T 0
E T H Y L E N O T 0
C E R A T 0
C O N T R O L T 1
Q U IM IC A T 1
E T H Y L E N O T 1
C E R A T 1
C O N T R O L T 2
Q U IM IC A T 2
E T H Y L E N O T 2
C E R A T 2
C O N T R O L T 3
Q U IM IC A T 3
E T H Y L E N O T 3
C E R A T 3
C O N T R O L T 0
Q U IM IC A T 0
E T H Y L E N O T 0
C E R A T 0
C O N T R O L T 1
Q U IM IC A T 1
E T H Y L E N O T 1
C E R A T 1
C O N T R O L T 2
Q U IM IC A T 2
E T H Y L E N O T 2
C E R A T 2
C O N T R O L T 3
Q U IM IC A T 3
E T H Y L E N O T 3
C E R A T 3
C O N T R O L T 0
Q U IM IC A T 0
E T H Y L E N O T 0
C E R A T 0
C O N T R O L T 1
Q U IM IC A T 1
E T H Y L E N O T 1
C E R A T 1
C O N T R O L T 2
Q U IM IC A T 2
E T H Y L E N O T 2
C E R A T 2
C O N T R O L T 3
Q U IM IC A T 3
E T H Y L E N O T 3
C E R A T 3
C O N T R O L T 0
Q U IM IC A T 0
E T H Y L E N O T 0
C E R A T 0
C O N T R O L T 1
Q U IM IC A T 1
E T H Y L E N O T 1
C E R A T 1
C O N T R O L T 2
Q U IM IC A T 2
E T H Y L E N O T 2
C E R A T 2
C O N T R O L T 3
Q U IM IC A T 3
E T H Y L E N O T 3
C E R A T 3
C O N T R O L T 0
Q U IM IC A T 0
E T H Y L E N O T 0
C E R A T 0
C O N T R O L T 1
Q U IM IC A T 1
E T H Y L E N O T 1
C E R A T 1
C O N T R O L T 2
Q U IM IC A T 2
E T H Y L E N O T 2
C E R A T 2
C O N T R O L T 3
Q U IM IC A T 3
E T H Y L E N O T 3
C E R A T 3
C O N T R O L T 0
Q U IM IC A T 0
E T H Y L E N O T 0
C E R A T 0
C O N T R O L T 1
Q U IM IC A T 1
E T H Y L E N O T 1
C E R A T 1
C O N T R O L T 2
Q U IM IC A T 2
E T H Y L E N O T 2
C E R A T 2
C O N T R O L T 3
Q U IM IC A T 3
E T H Y L E N O T 3
C E R A T 3
C O N T R O L T 0
Q U IM IC A T 0
E T H Y L E N O T 0
C E R A T 0
C O N T R O L T 1
Q U IM IC A T 1
E T H Y L E N O T 1
C E R A T 1
C O N T R O L T 2
Q U IM IC A T 2
E T H Y L E N O T 2
C E R A T 2
C O N T R O L T 3
Q U IM IC A T 3
E T H Y L E N O T 3
C E R A T 3
C O N T R O L T 0
Q U IM IC A T 0
E T H Y L E N O T 0
C E R A T 0
C O N T R O L T 1
Q U IM IC A T 1
E T H Y L E N O T 1
C E R A T 1
C O N T R O L T 2
Q U IM IC A T 2
E T H Y L E N O T 2
C E R A T 2
C O N T R O L T 3
Q U IM IC A T 3
E T H Y L E N O T 3
C E R A T 3
C O N T R O L T 0
Q U IM IC A T 0
E T H Y L E N O T 0
C E R A T 0
C O N T R O L T 1
Q U IM IC A T 1
E T H Y L E N O T 1
C E R A T 1
C O N T R O L T 2
Q U IM IC A T 2
E T H Y L E N O T 2
C E R A T 2
C O N T R O L T 3
Q U IM IC A T 3
E T H Y L E N O T 3
C E R A T 3
C O N T R O L T 0
Q U IM IC A T 0
E T H Y L E N O T 0
C E R A T 0
C O N T R O L T 1
Q U IM IC A T 1
E T H Y L E N O T 1
C E R A T 1
C O N T R O L T 2
Q U IM IC A T 2
E T H Y L E N O T 2
C E R A T 2
C O N T R O L T 3
Q U IM IC A T 3
E T H Y L E N O T 3
C E R A T 3
C O N T R O L T 0
Q U IM IC A T 0
E T H Y L E N O T 0
C E R A T 0
C O N T R O L T 1
Q U IM IC A T 1
E T H Y L E N O T 1
C E R A T 1
C O N T R O L T 2
Q U IM IC A T 2
E T H Y L E N O T 2
C E R A T 2
C O N T R O L T 3
Q U IM IC A T 3
E T H Y L E N O T 3
C E R A T 3
C O N T R O L T 0
Q U IM IC A T 0
E T H Y L E N O T 0
C E R A T 0
C O N T R O L T 1
Q U IM IC A T 1
E T H Y L E N O T 1
C E R A T 1
C O N T R O L T 2
Q U IM IC A T 2
E T H Y L E N O T 2
C E R A T 2
C O N T R O L T 3
Q U IM IC A T 3
E T H Y L E N O T 3
C E R A T 3
PC
2
16
,8
2
%
PC2 28,80%

88
Relating the results of GC-MS analysis with those of the two E.N. instruments, it is
interesting to point out that both electronic noses revealed differences in the aromatic
pattern that are difficult to highlight from the GC analysis, confirming that the
aromatic pattern derives from the complex combination of all the VOCs that
compose the volatile fraction, and not of single compounds. Especially in T1, after 4
weeks at 4 °C, both E.N. detect differences that are quite difficult to notice with the
GC-MS analysis. In fact, from the GC data seems that the volatile fractions are very
similar between ‘Control’ and ‘Chemical’, and ‘Ethylene’ and ‘Wax’.
However, E.N. results indicate that these slight differences revealed by the GC, even
within the groups, are strong enough to discriminate among the different aromatic
patterns.
To analyze GC-MS data with PCA methods seems to be useful to highlight the
molecules that are effectively determining for the aromatic pattern changes.
The results obtained after a week of simulated shelf life at 20 °C are interesting. In
this case, percentage of accuracy of both the instruments declined, being able to
classify fruits from the end of the packing line (‘Ethylene’ and ‘Wax’) from the fruits
that did not pass through the packing line (‘Control’ and ‘Chemical’), and having
difficulties to distinguish among fruits of the same group (like the volatile fraction of
GC in T0 and T1).
From the GC data, it was expected to have low classification in general, but high
classification accuracy for ‘Control’ fruits. Except for T0, ‘Control’ fruits
classification always had higher classification rate being always recognized as
different. As confirmed by GC data.
Considering that both the instruments are able to correctly classified the fruits on the
basis of treatment and that the principal chemical classes responsible for these
differences are aldehyde, ester, sesquiterpene, and alcohols, it is possible to suppose
that sensors are mostly sensible to those compounds, in general. Different sensibility
anyway exists among the sensors of the two instruments. The MOOSY32 is always
able to correctly classify a high percentage of the instances, while EOS835 is less
stable in the accuracy of classification.

89
3.4 Conclusions
Electronic noses revealed different aromatic pattern of the fruit juices, with
differences in the performance of the two instruments. The MOOSY32 was able to
detect variation in the juice aroma even when juices were analyzed right after each
treatment (T0). Treatments caused changes in the ‘flavor’ of orange fruit juices.
These variations seem to be easier detected by electronic nose instruments, than in
the direct analysis of the composition of volatile fractions by GC-MS. This
confirming that even slight changes in the chemical composition of the volatile
fraction can lead to changes in the perceived aroma.
Moreover, the E.N. results showed that something changed in the aromatic pattern of
orange fruits due to the packing line, and that the pattern of variation is different on
the basis of the applied storage conditions. Furthermore, there is a major effect due to
ethylene degreening and coating, but also control fruits changed their aromatic
pattern in response to the storage time and temperature. Storage amplified the effect
of each treatment, making possible to distinguish among them.
The E.N. results showed that not only coating or degreening caused changes in the
aromatic pattern, but also volatile composition is altered as well by passage through
the drenching system.
This study suggests that the packing line itself is able to affect the aromatic pattern of
oranges, and that this effect is more pronounced when fruits are stored. Particularly,
major changes were caused by ethylene and wax applications. Take care in the
manipulation of fruits and to minimize the other treatments and the storage times
would be an appropriate suggestion in trying to preserve flavor quality of Salustiana
orange juice. However, panel test to assess the effect of these variations on consumer
acceptance would be useful to confirm these findings.

90
4. GENERAL CONCLUSIONS
Storage time influence the carpometric parameters of lemon and orange
fruits, while it has no influence on chemical characteristics.
In lemon fruits storage, temperature affects total polyphenols and vitamin C
contents that increase with refrigerated storage.
Lemon juice flavor remains unchanged during 4 weeks of refrigerated
storage. Moreover, this kind of storage allows an increase in bioactive
compounds of the juices.
The chemical compositions and the volatile fraction analysis of fruits permit
the discrimination of the cultivar ‘Femminello Santa Teresa’. This variety is
characterized by a higher content in total soluble solids, titratable acidity, and
vitamin C. Furthermore, it possesses different volatile composition.
Orange juice flavor changes even when fruits are stored under refrigerated
conditions. These changes are easier detectable with E.N. systems, than using
GC-MS analysis.
Electronic nose instruments equipped with MOS sensors confirm their ability
to monitor the changes in the aromatic pattern of citrus juice during storage.
Moreover, it seems able to reveal differences in the maturity stage of lemon
fruits.
Between the two E.N. instruments tested, the MOOSY32 provided better
classification of the juices according to the treatments applied, being able to
distinguish the different aromatic pattern of the juices in every step of the
packing process.
The chemical classes that better describe the variations of the aromatic
pattern of lemon and orange juices are aldehyde and ester, the first decreasing
and the second increasing over time, describing the loss of freshness and of
typical citrusy-green odors and the increasing of sweet floral flavor.
Future perspective could be to establish a definitive correlation between the changes
perceived by the electronic nose with those in the chemical composition of the
volatile fraction of citrus fruits, and then relates these results with the consumer
acceptance.

91
According to these results, and after other desirable investigations, electronic noses
could be widely applicable by growers and processors to make the quality control
simple and highly sensitive, directly in the field, monitoring fruits maturity, as well
as during packing processes.
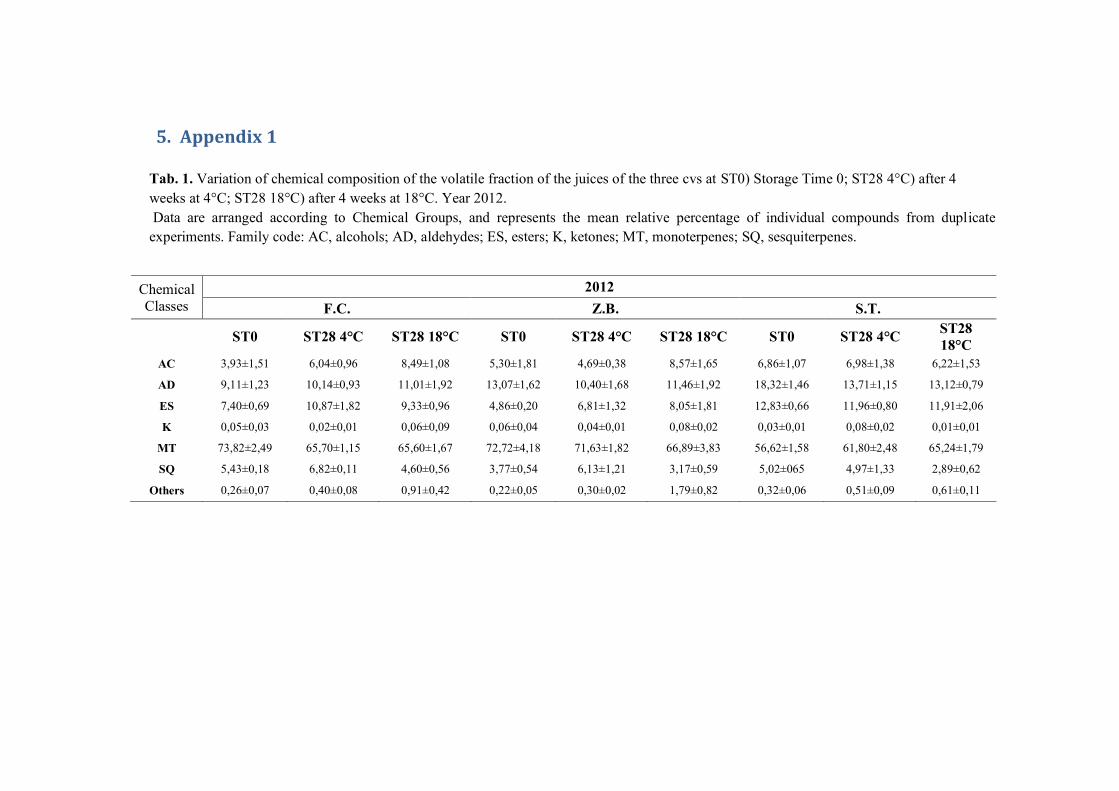
5. Appendix 1
Chemical
Classes
2012
F.C. Z.B. S.T.
ST0 ST28 4°C ST28 18°C ST0 ST28 4°C ST28 18°C ST0 ST28 4°C
ST28
18°C
AC 3,93±1,51 6,04±0,96 8,49±1,08 5,30±1,81 4,69±0,38 8,57±1,65 6,86±1,07 6,98±1,38 6,22±1,53
AD 9,11±1,23 10,14±0,93 11,01±1,92 13,07±1,62 10,40±1,68 11,46±1,92 18,32±1,46 13,71±1,15 13,12±0,79
ES 7,40±0,69 10,87±1,82 9,33±0,96 4,86±0,20 6,81±1,32 8,05±1,81 12,83±0,66 11,96±0,80 11,91±2,06
K 0,05±0,03 0,02±0,01 0,06±0,09 0,06±0,04 0,04±0,01 0,08±0,02 0,03±0,01 0,08±0,02 0,01±0,01
MT 73,82±2,49 65,70±1,15 65,60±1,67 72,72±4,18 71,63±1,82 66,89±3,83 56,62±1,58 61,80±2,48 65,24±1,79
SQ 5,43±0,18 6,82±0,11 4,60±0,56 3,77±0,54 6,13±1,21 3,17±0,59 5,02±065 4,97±1,33 2,89±0,62
Others 0,26±0,07 0,40±0,08 0,91±0,42 0,22±0,05 0,30±0,02 1,79±0,82 0,32±0,06 0,51±0,09 0,61±0,11
Tab. 1. Variation of chemical composition of the volatile fraction of the juices of the three cvs at ST0) Storage Time 0; ST28 4°C) after 4
weeks at 4°C; ST28 18°C) after 4 weeks at 18°C. Year 2012.
Data are arranged according to Chemical Groups, and represents the mean relative percentage of individual compounds from duplicate
experiments. Family code: AC, alcohols; AD, aldehydes; ES, esters; K, ketones; MT, monoterpenes; SQ, sesquiterpenes.

92
Chemical
Classes
2013
F.C. Z.B. S.T.
ST0 ST28 4°C ST28 18°C ST0 ST28 4°C ST28 18°C ST0 ST28 4°C ST28 18°C
AC 5,34±0,32 6,03±1,26 5,02±2,32 5,31±1,07 4,45±0,44 6,45±0,91 5,93±1,65 6,88±1,33 4,92±1,51
AD 3,10±2,14 5,02±2,54 2,04±1,75 2,26±1,57 5,22±1,97 0,31±0,07 1,91±1,51 1,62±1,42 0,86±0,38
ES 7,20±1,38 11,32±4,50 5,20±3,21 4,09±1,67 8,22±0,98 4,55±0,77 6,34±2,03 6,55±2,04 5,98±1,62
K 0,01±0,00 0,02±0,01 0,01±000 0,01±0,01 0,02±0,01 0,01±0,00 0,01±0,00 0,01±0,01 0,01±0,01
MT 80,65±3,76 73,20±7,73 84,17±4,48 86,36±3,52 77,80±2,99 84,88±0,34 83,09±4,87 82,38±3,23 84,82±2,11
SQ 3,49±0,42 4,04±1,46 3,27±1,84 1,72±0,35 4,09±0,32 3,58±1,00 2,32±0,55 2,24±0,14 3,14±0,76
Others 0,20±0,03 0,36±0,11 0,29±0,00 0,26±0,04 0,20±0,04 0,21±0,02 0,41±0,09 0,31±0,12 0,26±0,01
Tab. 2. Variation of chemical composition of the volatile fraction of the juices of the three cvs at ST0) Storage Time 0; ST28 4°C) after 4
weeks at 4°C; ST28 18°C) after 4 weeks at 18°C. Year 2013.
Data are arranged according to Chemical Groups, and represents the mean relative percentage of individual compounds from duplicate
experiments. Family code: AC, alcohols; AD, aldehydes; ES, esters; K, ketones; MT, monoterpenes; SQ, sesquiterpenes.

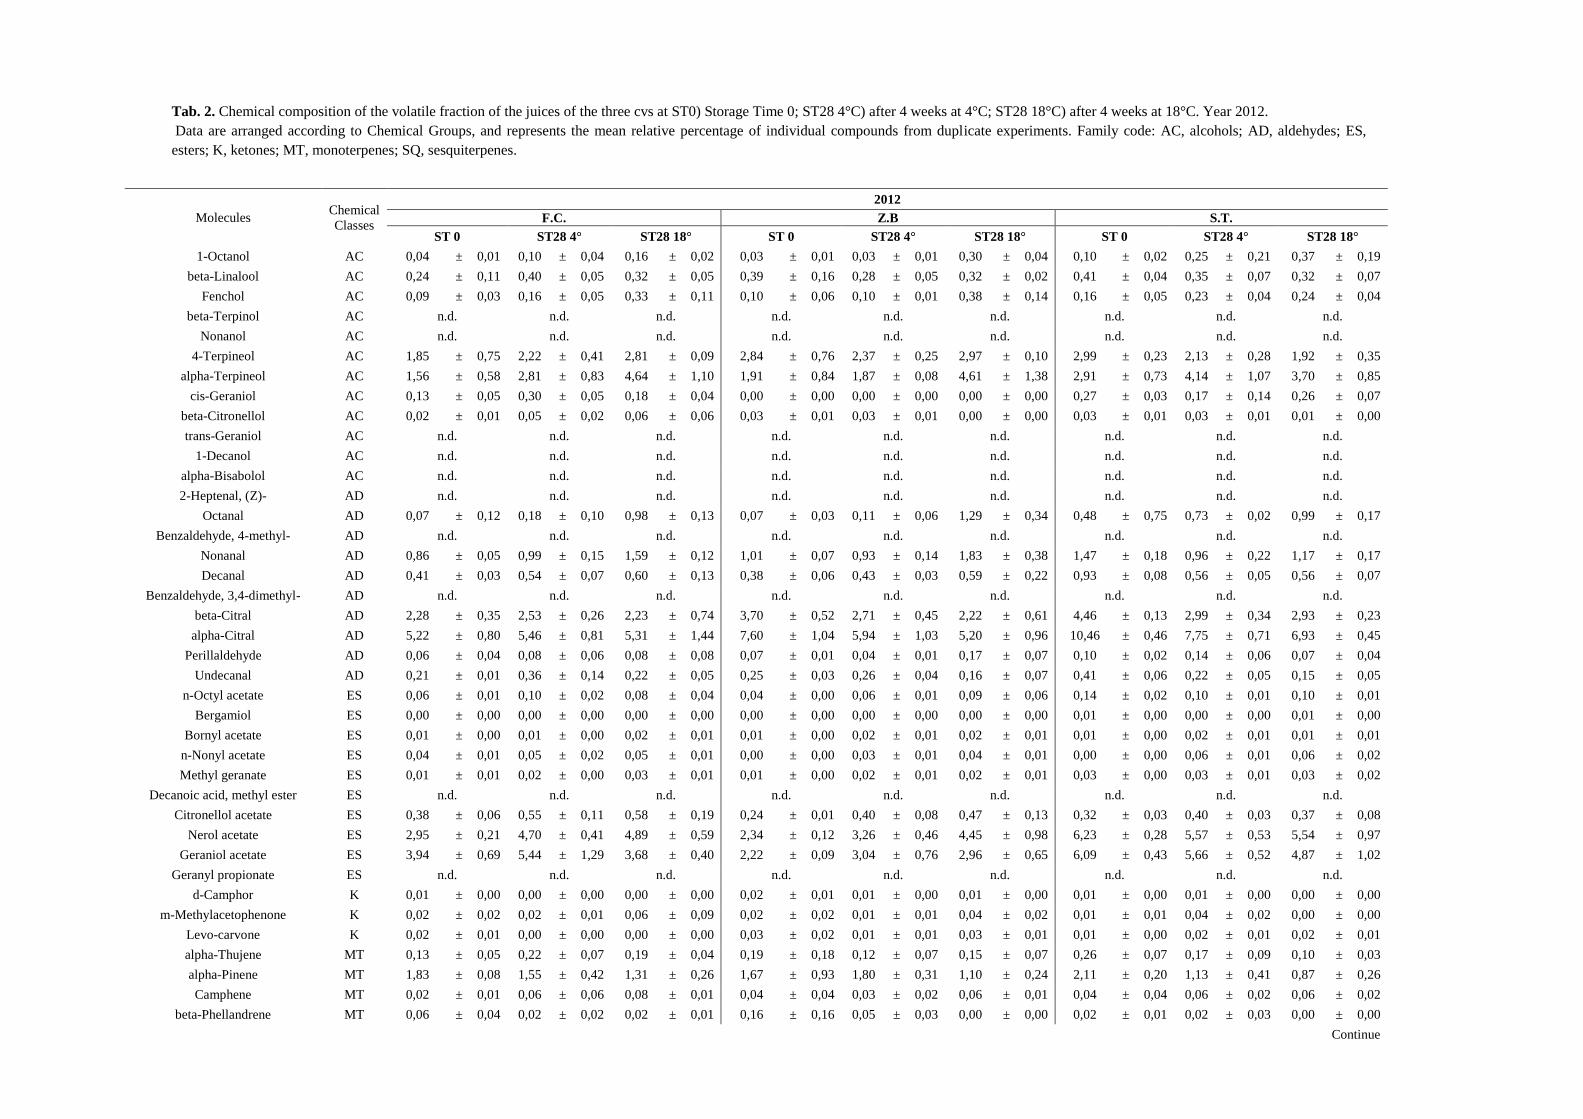
Molecules Chemical
Classes
2012
F.C. Z.B S.T.
ST 0 ST28 4° ST28 18° ST 0 ST28 4° ST28 18° ST 0 ST28 4° ST28 18°
1-Octanol AC 0,04 ± 0,01 0,10 ± 0,04 0,16 ± 0,02 0,03 ± 0,01 0,03 ± 0,01 0,30 ± 0,04 0,10 ± 0,02 0,25 ± 0,21 0,37 ± 0,19
beta-Linalool AC 0,24 ± 0,11 0,40 ± 0,05 0,32 ± 0,05 0,39 ± 0,16 0,28 ± 0,05 0,32 ± 0,02 0,41 ± 0,04 0,35 ± 0,07 0,32 ± 0,07
Fenchol AC 0,09 ± 0,03 0,16 ± 0,05 0,33 ± 0,11 0,10 ± 0,06 0,10 ± 0,01 0,38 ± 0,14 0,16 ± 0,05 0,23 ± 0,04 0,24 ± 0,04
beta-Terpinol AC n.d. n.d. n.d. n.d. n.d. n.d. n.d. n.d. n.d.
Nonanol AC n.d. n.d. n.d. n.d. n.d. n.d. n.d. n.d. n.d.
4-Terpineol AC 1,85 ± 0,75 2,22 ± 0,41 2,81 ± 0,09 2,84 ± 0,76 2,37 ± 0,25 2,97 ± 0,10 2,99 ± 0,23 2,13 ± 0,28 1,92 ± 0,35
alpha-Terpineol AC 1,56 ± 0,58 2,81 ± 0,83 4,64 ± 1,10 1,91 ± 0,84 1,87 ± 0,08 4,61 ± 1,38 2,91 ± 0,73 4,14 ± 1,07 3,70 ± 0,85
cis-Geraniol AC 0,13 ± 0,05 0,30 ± 0,05 0,18 ± 0,04 0,00 ± 0,00 0,00 ± 0,00 0,00 ± 0,00 0,27 ± 0,03 0,17 ± 0,14 0,26 ± 0,07
beta-Citronellol AC 0,02 ± 0,01 0,05 ± 0,02 0,06 ± 0,06 0,03 ± 0,01 0,03 ± 0,01 0,00 ± 0,00 0,03 ± 0,01 0,03 ± 0,01 0,01 ± 0,00
trans-Geraniol AC n.d. n.d. n.d. n.d. n.d. n.d. n.d. n.d. n.d.
1-Decanol AC n.d. n.d. n.d. n.d. n.d. n.d. n.d. n.d. n.d.
alpha-Bisabolol AC n.d. n.d. n.d. n.d. n.d. n.d. n.d. n.d. n.d.
2-Heptenal, (Z)- AD n.d. n.d. n.d. n.d. n.d. n.d. n.d. n.d. n.d.
Octanal AD 0,07 ± 0,12 0,18 ± 0,10 0,98 ± 0,13 0,07 ± 0,03 0,11 ± 0,06 1,29 ± 0,34 0,48 ± 0,75 0,73 ± 0,02 0,99 ± 0,17
Benzaldehyde, 4-methyl- AD n.d. n.d. n.d. n.d. n.d. n.d. n.d. n.d. n.d.
Nonanal AD 0,86 ± 0,05 0,99 ± 0,15 1,59 ± 0,12 1,01 ± 0,07 0,93 ± 0,14 1,83 ± 0,38 1,47 ± 0,18 0,96 ± 0,22 1,17 ± 0,17
Decanal AD 0,41 ± 0,03 0,54 ± 0,07 0,60 ± 0,13 0,38 ± 0,06 0,43 ± 0,03 0,59 ± 0,22 0,93 ± 0,08 0,56 ± 0,05 0,56 ± 0,07
Benzaldehyde, 3,4-dimethyl- AD n.d. n.d. n.d. n.d. n.d. n.d. n.d. n.d. n.d.
beta-Citral AD 2,28 ± 0,35 2,53 ± 0,26 2,23 ± 0,74 3,70 ± 0,52 2,71 ± 0,45 2,22 ± 0,61 4,46 ± 0,13 2,99 ± 0,34 2,93 ± 0,23
alpha-Citral AD 5,22 ± 0,80 5,46 ± 0,81 5,31 ± 1,44 7,60 ± 1,04 5,94 ± 1,03 5,20 ± 0,96 10,46 ± 0,46 7,75 ± 0,71 6,93 ± 0,45
Perillaldehyde AD 0,06 ± 0,04 0,08 ± 0,06 0,08 ± 0,08 0,07 ± 0,01 0,04 ± 0,01 0,17 ± 0,07 0,10 ± 0,02 0,14 ± 0,06 0,07 ± 0,04
Undecanal AD 0,21 ± 0,01 0,36 ± 0,14 0,22 ± 0,05 0,25 ± 0,03 0,26 ± 0,04 0,16 ± 0,07 0,41 ± 0,06 0,22 ± 0,05 0,15 ± 0,05
n-Octyl acetate ES 0,06 ± 0,01 0,10 ± 0,02 0,08 ± 0,04 0,04 ± 0,00 0,06 ± 0,01 0,09 ± 0,06 0,14 ± 0,02 0,10 ± 0,01 0,10 ± 0,01
Bergamiol ES 0,00 ± 0,00 0,00 ± 0,00 0,00 ± 0,00 0,00 ± 0,00 0,00 ± 0,00 0,00 ± 0,00 0,01 ± 0,00 0,00 ± 0,00 0,01 ± 0,00
Bornyl acetate ES 0,01 ± 0,00 0,01 ± 0,00 0,02 ± 0,01 0,01 ± 0,00 0,02 ± 0,01 0,02 ± 0,01 0,01 ± 0,00 0,02 ± 0,01 0,01 ± 0,01
n-Nonyl acetate ES 0,04 ± 0,01 0,05 ± 0,02 0,05 ± 0,01 0,00 ± 0,00 0,03 ± 0,01 0,04 ± 0,01 0,00 ± 0,00 0,06 ± 0,01 0,06 ± 0,02
Methyl geranate ES 0,01 ± 0,01 0,02 ± 0,00 0,03 ± 0,01 0,01 ± 0,00 0,02 ± 0,01 0,02 ± 0,01 0,03 ± 0,00 0,03 ± 0,01 0,03 ± 0,02
Decanoic acid, methyl ester ES n.d. n.d. n.d. n.d. n.d. n.d. n.d. n.d. n.d.
Citronellol acetate ES 0,38 ± 0,06 0,55 ± 0,11 0,58 ± 0,19 0,24 ± 0,01 0,40 ± 0,08 0,47 ± 0,13 0,32 ± 0,03 0,40 ± 0,03 0,37 ± 0,08
Nerol acetate ES 2,95 ± 0,21 4,70 ± 0,41 4,89 ± 0,59 2,34 ± 0,12 3,26 ± 0,46 4,45 ± 0,98 6,23 ± 0,28 5,57 ± 0,53 5,54 ± 0,97
Geraniol acetate ES 3,94 ± 0,69 5,44 ± 1,29 3,68 ± 0,40 2,22 ± 0,09 3,04 ± 0,76 2,96 ± 0,65 6,09 ± 0,43 5,66 ± 0,52 4,87 ± 1,02
Geranyl propionate ES n.d. n.d. n.d. n.d. n.d. n.d. n.d. n.d. n.d.
d-Camphor K 0,01 ± 0,00 0,00 ± 0,00 0,00 ± 0,00 0,02 ± 0,01 0,01 ± 0,00 0,01 ± 0,00 0,01 ± 0,00 0,01 ± 0,00 0,00 ± 0,00
m-Methylacetophenone K 0,02 ± 0,02 0,02 ± 0,01 0,06 ± 0,09 0,02 ± 0,02 0,01 ± 0,01 0,04 ± 0,02 0,01 ± 0,01 0,04 ± 0,02 0,00 ± 0,00
Levo-carvone K 0,02 ± 0,01 0,00 ± 0,00 0,00 ± 0,00 0,03 ± 0,02 0,01 ± 0,01 0,03 ± 0,01 0,01 ± 0,00 0,02 ± 0,01 0,02 ± 0,01
alpha-Thujene MT 0,13 ± 0,05 0,22 ± 0,07 0,19 ± 0,04 0,19 ± 0,18 0,12 ± 0,07 0,15 ± 0,07 0,26 ± 0,07 0,17 ± 0,09 0,10 ± 0,03
alpha-Pinene MT 1,83 ± 0,08 1,55 ± 0,42 1,31 ± 0,26 1,67 ± 0,93 1,80 ± 0,31 1,10 ± 0,24 2,11 ± 0,20 1,13 ± 0,41 0,87 ± 0,26
Camphene MT 0,02 ± 0,01 0,06 ± 0,06 0,08 ± 0,01 0,04 ± 0,04 0,03 ± 0,02 0,06 ± 0,01 0,04 ± 0,04 0,06 ± 0,02 0,06 ± 0,02
beta-Phellandrene MT 0,06 ± 0,04 0,02 ± 0,02 0,02 ± 0,01 0,16 ± 0,16 0,05 ± 0,03 0,00 ± 0,00 0,02 ± 0,01 0,02 ± 0,03 0,00 ± 0,00
Continue
Tab. 2. Chemical composition of the volatile fraction of the juices of the three cvs at ST0) Storage Time 0; ST28 4°C) after 4 weeks at 4°C; ST28 18°C) after 4 weeks at 18°C. Year 2012.
Data are arranged according to Chemical Groups, and represents the mean relative percentage of individual compounds from duplicate experiments. Family code: AC, alcohols; AD, aldehydes; ES,
esters; K, ketones; MT, monoterpenes; SQ, sesquiterpenes.

Molecules Chemical
Classes
2012
F.C. Z.B. S.T.
ST0 ST28 4°C ST28 18°C ST0 ST28 4°C ST28 18°C ST0 ST28 4°C ST28 18°C
beta-Pinene MT 9,95 ± 0,33 7,29 ± 0,72 6,97 ± 0,56 10,20 ± 1,42 8,11 ± 1,18 6,37 ± 1,15 11,16 ± 0,58 6,16 ± 1,82 5,16 ± 1,01
beta-Myrcene MT 3,33 ± 0,21 2,29 ± 1,36 4,37 ± 0,26 1,54 ± 1,50 1,86 ± 0,48 4,82 ± 0,57 1,70 ± 1,39 3,39 ± 0,50 4,13 ± 0,35
alpha-Phellandrene MT n.d. n.d. n.d. n.d. n.d. n.d. n.d. n.d. n.d.
2-Carene MT 0,07 ± 0,06 0,09 ± 0,04 0,06 ± 0,03 0,14 ± 0,04 0,06 ± 0,03 0,21 ± 0,22 0,02 ± 0,02 0,35 ± 0,20 0,39 ± 0,26
alpha-Terpinene MT n.d. n.d. n.d. n.d. n.d. n.d. n.d. n.d. n.d.
D-Limonene MT 44,17 ± 1,49 40,01 ± 0,73 37,97 ± 0,83 44,39 ± 1,94 44,11 ± 1,24 39,17 ± 1,95 29,77 ± 0,44 38,53 ± 3,08 41,84 ± 2,21
beta-trans-Ocimene MT n.d. n.d. n.d. n.d. n.d. n.d. n.d. n.d. n.d.
beta-cis-Ocimene MT 0,45 ± 0,19 0,45 ± 0,17 0,46 ± 0,07 0,35 ± 0,02 0,38 ± 0,04 0,44 ± 0,04 0,35 ± 0,04 0,52 ± 0,09 0,58 ± 0,05
gamma-Terpinene MT 12,46 ± 0,60 12,13 ± 0,90 12,02 ± 0,28 12,69 ± 0,45 13,47 ± 0,21 11,75 ± 0,60 9,94 ± 0,62 10,51 ± 0,59 11,14 ± 0,60
(+)-4-Carene MT 1,30 ± 0,18 1,51 ± 0,15 1,90 ± 0,18 1,29 ± 0,10 1,58 ± 0,04 2,41 ± 0,49 1,20 ± 0,08 1,40 ± 0,06 1,58 ± 0,11
Isopropenyltoluene MT 0,16 ± 0,04 0,28 ± 0,06 0,75 ± 0,32 0,16 ± 0,03 0,19 ± 0,03 1,53 ± 0,63 0,22 ± 0,04 0,42 ± 0,08 0,58 ± 0,09
2,4,6-Octatriene, 2,6-dimethyl-,
(E,Z)- MT 0,02 ± 0,02 0,03 ± 0,03 0,10 ± 0,03 0,02 ± 0,00 0,04 ± 0,01 0,14 ± 0,05 0,02 ± 0,00 0,03 ± 0,01 0,09 ± 0,02
2,6-Dimethyl-1,3,5,7-
octatetraene, E MT n.d. n.d. n.d. n.d. n.d. n.d. n.d. n.d. n.d.
2,4,6-Octatriene, 2,6-dimethyl MT 0,03 ± 0,02 0,05 ± 0,02 0,16 ± 0,06 0,03 ± 0,01 0,03 ± 0,01 0,25 ± 0,09 0,02 ± 0,01 0,05 ± 0,01 0,15 ± 0,03
Elixene SQ 0,02 ± 0,01 0,03 ± 0,02 0,03 ± 0,01 0,02 ± 0,01 0,05 ± 0,01 0,02 ± 0,01 0,03 ± 0,01 0,03 ± 0,02 0,01 ± 0,01
alpha.-Bergamotene SQ 0,11 ± 0,01 0,14 ± 0,01 0,09 ± 0,02 0,06 ± 0,01 0,11 ± 0,03 0,06 ± 0,01 0,10 ± 0,02 0,08 ± 0,03 0,06 ± 0,02
beta.-Caryophyllene SQ 0,76 ± 0,16 0,96 ± 0,06 0,85 ± 0,21 0,81 ± 0,16 1,29 ± 0,25 0,91 ± 0,13 0,73 ± 0,09 0,56 ± 0,08 0,42 ± 0,06
trans-.alpha.-Bergamotene SQ 1,44 ± 0,09 1,86 ± 0,09 1,32 ± 0,25 0,83 ± 0,12 1,45 ± 0,31 0,90 ± 0,14 1,30 ± 0,19 1,17 ± 0,36 0,78 ± 0,21
Caryophyllene SQ 0,07 ± 0,00 0,10 ± 0,02 0,07 ± 0,02 0,04 ± 0,01 0,07 ± 0,02 0,05 ± 0,02 0,06 ± 0,01 0,05 ± 0,02 0,04 ± 0,01
Allo-Aromadendrene SQ 0,01 ± 0,01 0,03 ± 0,01 0,03 ± 0,03 0,02 ± 0,01 0,04 ± 0,01 0,02 ± 0,02 0,04 ± 0,02 0,02 ± 0,02 0,01 ± 0,00
beta.-Farnesene SQ 0,14 ± 0,00 0,16 ± 0,02 0,06 ± 0,02 0,07 ± 0,01 0,13 ± 0,03 0,02 ± 0,01 0,13 ± 0,03 0,09 ± 0,04 0,03 ± 0,01
alpha.-Caryophyllene SQ 0,06 ± 0,02 0,08 ± 0,01 0,07 ± 0,02 0,06 ± 0,01 0,10 ± 0,03 0,07 ± 0,02 0,05 ± 0,01 0,04 ± 0,01 0,04 ± 0,02
beta.-Santalene SQ 0,08 ± 0,00 0,11 ± 0,01 0,09 ± 0,02 0,05 ± 0,01 0,08 ± 0,01 0,07 ± 0,01 0,07 ± 0,01 0,07 ± 0,02 0,06 ± 0,01
beta.-Himachalene SQ 0,03 ± 0,01 0,03 ± 0,01 0,01 ± 0,01 0,01 ± 0,01 0,03 ± 0,01 0,01 ± 0,00 0,03 ± 0,01 0,02 ± 0,01 0,01 ± 0,01
alpha.-Curcumene SQ 0,02 ± 0,01 0,04 ± 0,01 0,04 ± 0,02 0,01 ± 0,01 0,04 ± 0,04 0,03 ± 0,02 0,02 ± 0,00 0,03 ± 0,01 0,02 ± 0,02
Isocaryophyllene SQ 0,09 ± 0,01 0,11 ± 0,01 0,08 ± 0,01 0,05 ± 0,01 0,09 ± 0,03 0,05 ± 0,01 0,00 ± 0,00 0,08 ± 0,02 0,06 ± 0,01
Valencene SQ 0,14 ± 0,06 0,27 ± 0,04 0,48 ± 0,21 0,11 ± 0,03 0,28 ± 0,06 0,24 ± 0,05 0,12 ± 0,03 0,37 ± 0,01 0,24 ± 0,04
Eremophilene SQ n.d. n.d. n.d. n.d. n.d. n.d. n.d. n.d. n.d.
Germacrene B SQ 0,13 ± 0,02 0,17 ± 0,05 0,10 ± 0,02 0,17 ± 0,03 0,23 ± 0,04 0,08 ± 0,02 0,13 ± 0,01 0,08 ± 0,10 0,04 ± 0,01
.beta.-Bisabolene SQ 2,24 ± 0,05 2,65 ± 0,17 1,24 ± 0,32 1,39 ± 0,15 2,08 ± 0,41 0,62 ± 0,17 2,14 ± 0,31 1,84 ± 0,59 0,83 ± 0,27
(-)-.alpha.-Panasinsen SQ n.d. n.d. n.d. n.d. n.d. n.d. n.d. n.d. n.d.
Humulene SQ 0,08 ± 0,01 0,08 ± 0,02 0,04 ± 0,02 0,05 ± 0,01 0,07 ± 0,01 0,02 ± 0,01 0,06 ± 0,01 0,06 ± 0,02 0,03 ± 0,01
Bornyl chloride OTHER 0,04 ± 0,02 0,06 ± 0,03 0,11 ± 0,10 0,01 ± 0,01 0,04 ± 0,02 0,21 ± 0,22 0,06 ± 0,02 0,09 ± 0,02 0,04 ± 0,02
Tridecane OTHER 0,01 ± 0,00 0,00 ± 0,00 0,01 ± 0,00 0,01 ± 0,00 0,02 ± 0,01 0,01 ± 0,00 0,01 ± 0,01 0,00 ± 0,00 0,00 ± 0,00
7-Tetradecene, (E) OTHER n.d. n.d. n.d. n.d. n.d. n.d. n.d. n.d. n.d.
Tetradecane OTHER 0,04 ± 0,01 0,06 ± 0,02 0,04 ± 0,01 0,03 ± 0,01 0,06 ± 0,01 0,03 ± 0,01 0,03 ± 0,01 0,03 ± 0,03 0,02 ± 0,01
Hexadecane OTHER n.d. n.d. n.d. n.d. n.d. n.d. n.d. n.d. n.d.

Molecules Chemical
Classes
2013
F.C. Z.B. S.T.
ST 0 ST28 4°
ST28 18°
ST 0 ST28 4° ST28 18° ST 0 ST28 4° ST28 18°
1-Octanol AC 0,24 ± 0,06 0,17 ± 0,06 0,13 ± 0,04 0,15 ± 0,05 0,15 ± 0,07 0,25 ± 0,06 0,41 ± 0,14 0,46 ± 0,08 0,25 ± 0,10
beta-Linalool AC 0,34 ± 0,03 0,38 ± 0,12 0,41 ± 0,23 0,39 ± 0,16 0,26 ± 0,03 0,45 ± 0,10 0,55 ± 0,12 0,67 ± 0,26 0,41 ± 0,16
Fenchol AC 0,09 ± 0,02 0,18 ± 0,02 0,08 ± 0,03 0,12 ± 0,02 0,12 ± 0,03 0,14 ± 0,03 0,07 ± 0,03 0,09 ± 0,02 0,08 ± 0,03
beta-Terpinol AC 0,02 ± 0,01 0,03 ± 0,02 0,04 ± 0,02 0,04 ± 0,01 0,01 ± 0,00 0,03 ± 0,01 0,03 ± 0,02 0,03 ± 0,02 0,02 ± 0,01
Nonanol AC 0,23 ± 0,04 0,23 ± 0,17 0,14 ± 0,01 0,18 ± 0,04 0,21 ± 0,06 0,23 ± 0,06 0,21 ± 0,10 0,25 ± 0,08 0,14 ± 0,05
4-Terpineol AC 1,11 ± 0,06 1,45 ± 0,30 0,90 ± 0,29 1,12 ± 0,23 1,36 ± 0,19 1,09 ± 0,11 0,87 ± 0,31 0,97 ± 0,17 0,75 ± 0,27
alpha-Terpineol AC 1,58 ± 0,11 2,47 ± 0,63 1,94 ± 0,95 2,17 ± 0,25 1,47 ± 0,24 2,33 ± 0,48 1,82 ± 0,82 2,22 ± 0,62 1,75 ± 0,60
cis-Geraniol AC 0,53 ± 0,16 0,33 ± 0,07 0,45 ± 0,27 0,33 ± 0,15 0,25 ± 0,07 0,69 ± 0,14 0,61 ± 0,05 0,65 ± 0,11 0,58 ± 0,14
beta-Citronellol AC 0,13 ± 0,03 0,10 ± 0,03 0,13 ± 0,08 0,09 ± 0,05 0,07 ± 0,02 0,16 ± 0,03 0,15 ± 0,03 0,14 ± 0,08 0,11 ± 0,04
trans-Geraniol AC 0,98 ± 0,27 0,61 ± 0,20 0,77 ± 0,52 0,68 ± 0,38 0,47 ± 0,20 1,02 ± 0,19 1,15 ± 0,21 1,31 ± 0,26 0,78 ± 0,16
1-Decanol AC 0,07 ± 0,01 0,02 ± 0,02 0,04 ± 0,02 0,01 ± 0,01 0,04 ± 0,03 0,05 ± 0,02 0,06 ± 0,03 0,07 ± 0,04 0,04 ± 0,02
alpha-Bisabolol AC 0,03 ± 0,01 0,05 ± 0,03 0,02 ± 0,01 0,01 ± 0,00 0,03 ± 0,01 0,01 ± 0,00 0,01 ± 0,01 0,02 ± 0,01 0,01 ± 0,01
2-Heptenal, (Z)- AD 0,01 ± 0,01 0,03 ± 0,03 0,01 ± 0,01 0,02 ± 0,02 0,01 ± 0,01 0,01 ± 0,01 0,02 ± 0,00 0,03 ± 0,03 0,03 ± 0,02
Octanal AD n.d. n.d. n.d. n.d. n.d. n.d. n.d. n.d. n.d.
Benzaldehyde, 4-methyl- AD 0,00 ± 0,01 0,00 ± 0,00 0,06 ± 0,02 0,02 ± 0,01 0,00 ± 0,00 0,04 ± 0,01 0,00 ± 0,01 0,00 ± 0,00 0,04 ± 0,08
Nonanal AD 0,12 ± 0,01 0,30 ± 0,12 0,06 ± 0,02 0,11 ± 0,12 0,35 ± 0,16 0,06 ± 0,01 0,06 ± 0,02 0,10 ± 0,05 0,10 ± 0,05
Decanal AD 0,12 ± 0,05 0,27 ± 0,17 0,04 ± 0,02 0,07 ± 0,08 0,27 ± 0,11 0,02 ± 0,00 0,05 ± 0,01 0,07 ± 0,06 0,05 ± 0,03
Benzaldehyde, 3,4-dimethyl- AD 0,00 ± 0,00 0,03 ± 0,03 0,00 ± 0,00 0,00 ± 0,00 0,01 ± 0,01 0,00 ± 0,00 0,00 ± 0,00 0,06 ± 0,01 0,01 ± 0,02
beta-Citral AD 0,77 ± 0,55 1,09 ± 0,60 0,47 ± 0,41 0,55 ± 0,40 1,24 ± 0,47 0,05 ± 0,02 0,49 ± 0,43 0,34 ± 0,35 0,16 ± 0,08
alpha-Citral AD 1,97 ± 1,48 3,09 ± 1,60 1,35 ± 1,21 1,40 ± 1,00 3,14 ± 1,22 0,14 ± 0,05 1,25 ± 1,02 0,99 ± 1,03 0,46 ± 0,21
Perillaldehyde AD 0,06 ± 0,04 0,09 ± 0,03 0,06 ± 0,05 0,05 ± 0,02 0,09 ± 0,02 0,00 ± 0,00 0,04 ± 0,02 0,02 ± 0,03 0,01 ± 0,01
Undecanal AD 0,05 ± 0,02 0,11 ± 0,06 0,00 ± 0,00 0,02 ± 0,03 0,12 ± 0,04 0,00 ± 0,00 0,01 ± 0,01 0,01 ± 0,01 0,00 ± 0,01
n-Octyl acetate ES 0,03 ± 0,02 0,06 ± 0,02 0,03 ± 0,01 0,02 ± 0,01 0,05 ± 0,01 0,02 ± 0,01 0,04 ± 0,02 0,04 ± 0,02 0,03 ± 0,01
Bergamiol ES n.d. n.d. n.d. n.d. n.d. n.d. n.d. n.d. n.d.
Bornyl acetate ES 0,00 ± 0,00 0,01 ± 0,01 0,01 ± 0,01 0,00 ± 0,01 0,01 ± 0,00 0,01 ± 0,00 0,00 ± 0,01 0,00 ± 0,01 0,00 ± 0,00
n-Nonyl acetate ES 0,02 ± 0,01 0,04 ± 0,01 0,01 ± 0,01 0,01 ± 0,00 0,03 ± 0,01 0,01 ± 0,00 0,01 ± 0,00 0,03 ± 0,02 0,01 ± 0,00
Methyl geranate ES 0,03 ± 0,01 0,03 ± 0,01 0,03 ± 0,01 0,01 ± 0,00 0,02 ± 0,01 0,02 ± 0,00 0,02 ± 0,01 0,02 ± 0,00 0,02 ± 0,01
Decanoic acid, methyl ester ES 0,01 ± 0,01 0,00 ± 0,00 0,01 ± 0,00 0,00 ± 0,00 0,00 ± 0,00 0,01 ± 0,00 0,01 ± 0,01 0,01 ± 0,00 0,01 ± 0,01
Citronellol acetate ES 0,50 ± 0,05 0,69 ± 0,37 0,44 ± 0,30 0,26 ± 0,09 0,56 ± 0,08 0,38 ± 0,06 0,26 ± 0,05 0,27 ± 0,06 0,30 ± 0,08
Nerol acetate ES 3,33 ± 0,49 5,08 ± 1,91 2,27 ± 1,51 2,03 ± 0,86 3,79 ± 0,50 2,27 ± 0,48 3,19 ± 0,95 2,96 ± 0,84 2,87 ± 0,77
Geraniol acetate ES 3,24 ± 0,82 5,37 ± 2,26 2,37 ± 1,32 1,74 ± 0,73 3,72 ± 0,69 1,82 ± 0,25 2,78 ± 1,03 3,19 ± 1,10 2,74 ± 0,78
Geranyl propionate ES 0,03 ± 0,01 0,04 ± 0,03 0,03 ± 0,04 0,02 ± 0,01 0,05 ± 0,01 0,02 ± 0,00 0,03 ± 0,01 0,03 ± 0,03 0,00 ± 0,00
d-Camphor K n.d. n.d. n.d. n.d. n.d. n.d. n.d. n.d. n.d.
m-Methylacetophenone K n.d. n.d. n.d. n.d. n.d. n.d. n.d. n.d. n.d.
Levo-carvone K 0,01 ± 0,00 0,02 ± 0,01 0,01 ± 0,00 0,01 ± 0,01 0,02 ± 0,01 0,01 ± 0,00 0,01 ± 0,00 0,01 ± 0,01 0,01 ± 0,01
alpha-Thujene MT 0,10 ± 0,03 0,19 ± 0,12 0,08 ± 0,01 0,17 ± 0,09 0,18 ± 0,11 0,05 ± 0,01 0,05 ± 0,02 0,09 ± 0,03 0,04 ± 0,01
alpha-Pinene MT 0,59 ± 0,16 1,40 ± 0,71 0,61 ± 0,03 1,49 ± 0,82 1,20 ± 0,58 0,55 ± 0,05 0,36 ± 0,08 0,64 ± 0,13 0,43 ± 0,07
Camphene MT 0,03 ± 0,01 0,07 ± 0,03 0,05 ± 0,00 0,06 ± 0,03 0,07 ± 0,03 0,04 ± 0,01 0,02 ± 0,01 0,04 ± 0,01 0,03 ± 0,01
beta-Phellandrene MT 0,06 ± 0,02 0,02 ± 0,02 0,02 ± 0,01 0,02 ± 0,04 0,03 ± 0,02 0,02 ± 0,02 0,01 ± 0,01 0,03 ± 0,03 0,00 ± 0,00
Continue
Tab. 3. Chemical composition of the volatile fraction of the juices of the three cvs at ST0) Storage Time 0; ST28 4°C) after 4 weeks at 4°C; ST28 18°C) after 4 weeks at 18°C. Year 2013.
Data are arranged according to Chemical Groups, and represents the mean relative percentage of individual compounds from duplicate experiments. Family code: AC, alcohols; AD, aldehydes; ES,
esters; K, ketones; MT, monoterpenes; SQ, sesquiterpenes.
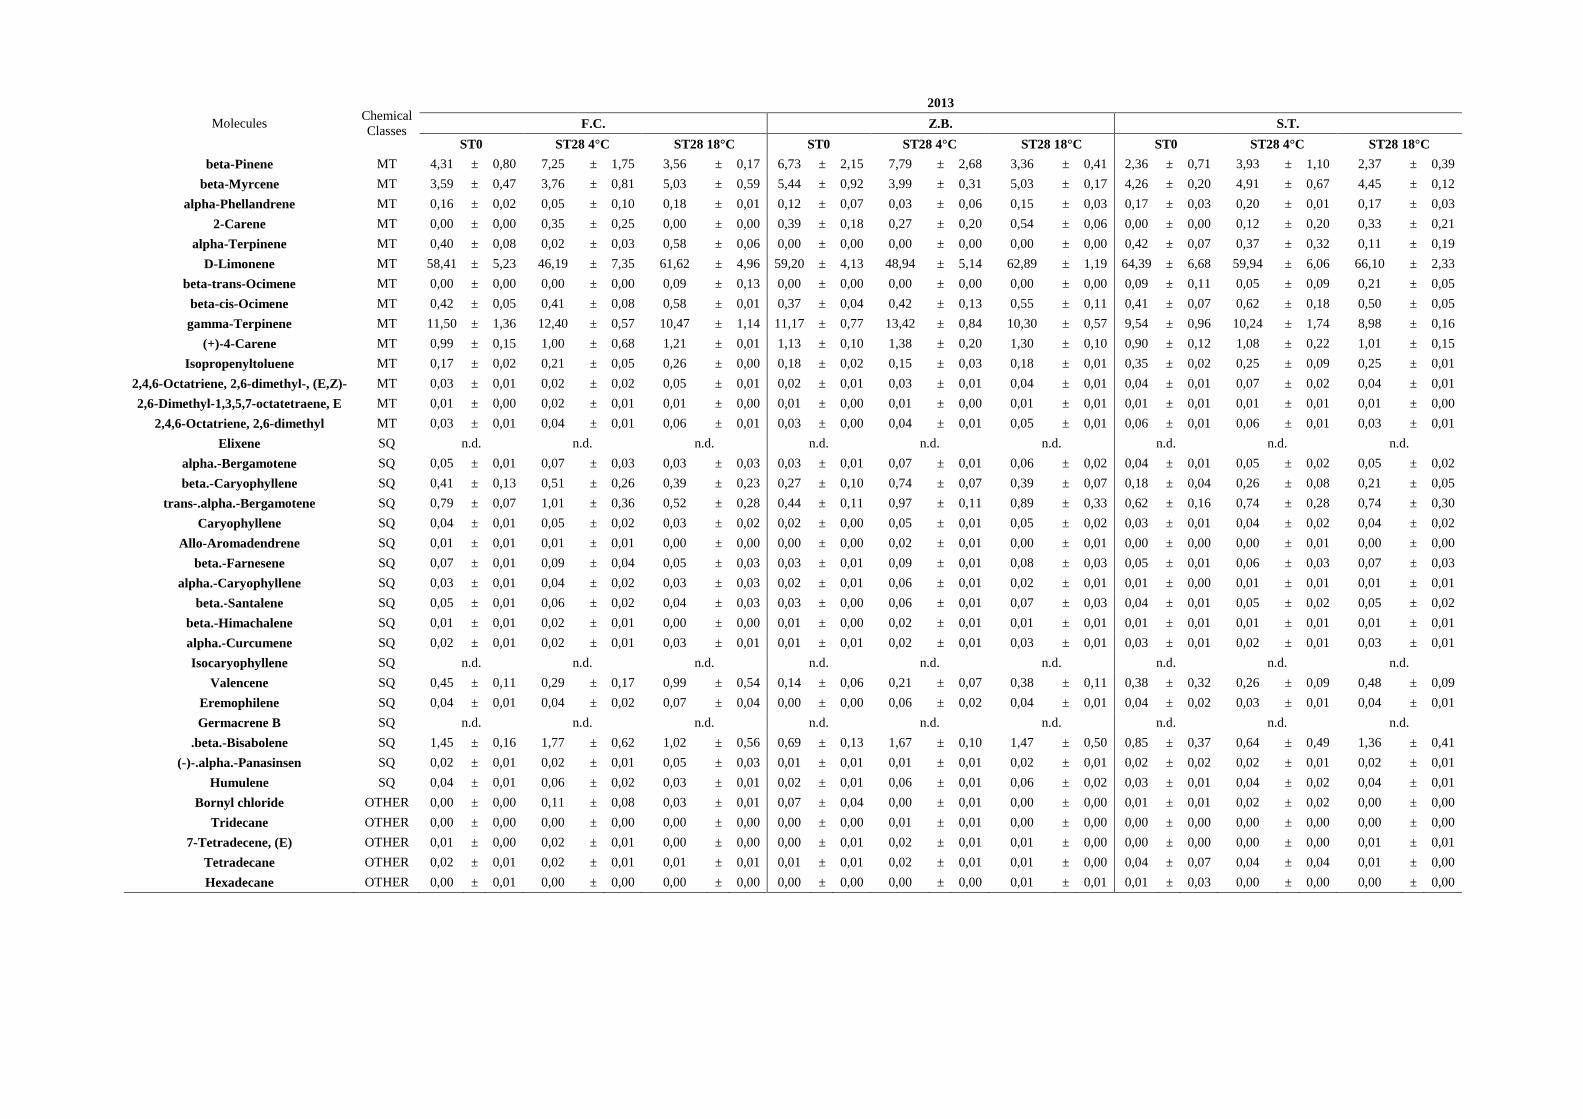
Molecules Chemical
Classes
2013
F.C. Z.B. S.T.
ST0 ST28 4°C ST28 18°C ST0 ST28 4°C ST28 18°C ST0 ST28 4°C ST28 18°C
beta-Pinene MT 4,31 ± 0,80 7,25 ± 1,75 3,56 ± 0,17 6,73 ± 2,15 7,79 ± 2,68 3,36 ± 0,41 2,36 ± 0,71 3,93 ± 1,10 2,37 ± 0,39
beta-Myrcene MT 3,59 ± 0,47 3,76 ± 0,81 5,03 ± 0,59 5,44 ± 0,92 3,99 ± 0,31 5,03 ± 0,17 4,26 ± 0,20 4,91 ± 0,67 4,45 ± 0,12
alpha-Phellandrene MT 0,16 ± 0,02 0,05 ± 0,10 0,18 ± 0,01 0,12 ± 0,07 0,03 ± 0,06 0,15 ± 0,03 0,17 ± 0,03 0,20 ± 0,01 0,17 ± 0,03
2-Carene MT 0,00 ± 0,00 0,35 ± 0,25 0,00 ± 0,00 0,39 ± 0,18 0,27 ± 0,20 0,54 ± 0,06 0,00 ± 0,00 0,12 ± 0,20 0,33 ± 0,21
alpha-Terpinene MT 0,40 ± 0,08 0,02 ± 0,03 0,58 ± 0,06 0,00 ± 0,00 0,00 ± 0,00 0,00 ± 0,00 0,42 ± 0,07 0,37 ± 0,32 0,11 ± 0,19
D-Limonene MT 58,41 ± 5,23 46,19 ± 7,35 61,62 ± 4,96 59,20 ± 4,13 48,94 ± 5,14 62,89 ± 1,19 64,39 ± 6,68 59,94 ± 6,06 66,10 ± 2,33
beta-trans-Ocimene MT 0,00 ± 0,00 0,00 ± 0,00 0,09 ± 0,13 0,00 ± 0,00 0,00 ± 0,00 0,00 ± 0,00 0,09 ± 0,11 0,05 ± 0,09 0,21 ± 0,05
beta-cis-Ocimene MT 0,42 ± 0,05 0,41 ± 0,08 0,58 ± 0,01 0,37 ± 0,04 0,42 ± 0,13 0,55 ± 0,11 0,41 ± 0,07 0,62 ± 0,18 0,50 ± 0,05
gamma-Terpinene MT 11,50 ± 1,36 12,40 ± 0,57 10,47 ± 1,14 11,17 ± 0,77 13,42 ± 0,84 10,30 ± 0,57 9,54 ± 0,96 10,24 ± 1,74 8,98 ± 0,16
(+)-4-Carene MT 0,99 ± 0,15 1,00 ± 0,68 1,21 ± 0,01 1,13 ± 0,10 1,38 ± 0,20 1,30 ± 0,10 0,90 ± 0,12 1,08 ± 0,22 1,01 ± 0,15
Isopropenyltoluene MT 0,17 ± 0,02 0,21 ± 0,05 0,26 ± 0,00 0,18 ± 0,02 0,15 ± 0,03 0,18 ± 0,01 0,35 ± 0,02 0,25 ± 0,09 0,25 ± 0,01
2,4,6-Octatriene, 2,6-dimethyl-, (E,Z)- MT 0,03 ± 0,01 0,02 ± 0,02 0,05 ± 0,01 0,02 ± 0,01 0,03 ± 0,01 0,04 ± 0,01 0,04 ± 0,01 0,07 ± 0,02 0,04 ± 0,01
2,6-Dimethyl-1,3,5,7-octatetraene, E MT 0,01 ± 0,00 0,02 ± 0,01 0,01 ± 0,00 0,01 ± 0,00 0,01 ± 0,00 0,01 ± 0,01 0,01 ± 0,01 0,01 ± 0,01 0,01 ± 0,00
2,4,6-Octatriene, 2,6-dimethyl MT 0,03 ± 0,01 0,04 ± 0,01 0,06 ± 0,01 0,03 ± 0,00 0,04 ± 0,01 0,05 ± 0,01 0,06 ± 0,01 0,06 ± 0,01 0,03 ± 0,01
Elixene SQ n.d. n.d. n.d. n.d. n.d. n.d. n.d. n.d. n.d.
alpha.-Bergamotene SQ 0,05 ± 0,01 0,07 ± 0,03 0,03 ± 0,03 0,03 ± 0,01 0,07 ± 0,01 0,06 ± 0,02 0,04 ± 0,01 0,05 ± 0,02 0,05 ± 0,02
beta.-Caryophyllene SQ 0,41 ± 0,13 0,51 ± 0,26 0,39 ± 0,23 0,27 ± 0,10 0,74 ± 0,07 0,39 ± 0,07 0,18 ± 0,04 0,26 ± 0,08 0,21 ± 0,05
trans-.alpha.-Bergamotene SQ 0,79 ± 0,07 1,01 ± 0,36 0,52 ± 0,28 0,44 ± 0,11 0,97 ± 0,11 0,89 ± 0,33 0,62 ± 0,16 0,74 ± 0,28 0,74 ± 0,30
Caryophyllene SQ 0,04 ± 0,01 0,05 ± 0,02 0,03 ± 0,02 0,02 ± 0,00 0,05 ± 0,01 0,05 ± 0,02 0,03 ± 0,01 0,04 ± 0,02 0,04 ± 0,02
Allo-Aromadendrene SQ 0,01 ± 0,01 0,01 ± 0,01 0,00 ± 0,00 0,00 ± 0,00 0,02 ± 0,01 0,00 ± 0,01 0,00 ± 0,00 0,00 ± 0,01 0,00 ± 0,00
beta.-Farnesene SQ 0,07 ± 0,01 0,09 ± 0,04 0,05 ± 0,03 0,03 ± 0,01 0,09 ± 0,01 0,08 ± 0,03 0,05 ± 0,01 0,06 ± 0,03 0,07 ± 0,03
alpha.-Caryophyllene SQ 0,03 ± 0,01 0,04 ± 0,02 0,03 ± 0,03 0,02 ± 0,01 0,06 ± 0,01 0,02 ± 0,01 0,01 ± 0,00 0,01 ± 0,01 0,01 ± 0,01
beta.-Santalene SQ 0,05 ± 0,01 0,06 ± 0,02 0,04 ± 0,03 0,03 ± 0,00 0,06 ± 0,01 0,07 ± 0,03 0,04 ± 0,01 0,05 ± 0,02 0,05 ± 0,02
beta.-Himachalene SQ 0,01 ± 0,01 0,02 ± 0,01 0,00 ± 0,00 0,01 ± 0,00 0,02 ± 0,01 0,01 ± 0,01 0,01 ± 0,01 0,01 ± 0,01 0,01 ± 0,01
alpha.-Curcumene SQ 0,02 ± 0,01 0,02 ± 0,01 0,03 ± 0,01 0,01 ± 0,01 0,02 ± 0,01 0,03 ± 0,01 0,03 ± 0,01 0,02 ± 0,01 0,03 ± 0,01
Isocaryophyllene SQ n.d. n.d. n.d. n.d. n.d. n.d. n.d. n.d. n.d.
Valencene SQ 0,45 ± 0,11 0,29 ± 0,17 0,99 ± 0,54 0,14 ± 0,06 0,21 ± 0,07 0,38 ± 0,11 0,38 ± 0,32 0,26 ± 0,09 0,48 ± 0,09
Eremophilene SQ 0,04 ± 0,01 0,04 ± 0,02 0,07 ± 0,04 0,00 ± 0,00 0,06 ± 0,02 0,04 ± 0,01 0,04 ± 0,02 0,03 ± 0,01 0,04 ± 0,01
Germacrene B SQ n.d. n.d. n.d. n.d. n.d. n.d. n.d. n.d. n.d.
.beta.-Bisabolene SQ 1,45 ± 0,16 1,77 ± 0,62 1,02 ± 0,56 0,69 ± 0,13 1,67 ± 0,10 1,47 ± 0,50 0,85 ± 0,37 0,64 ± 0,49 1,36 ± 0,41
(-)-.alpha.-Panasinsen SQ 0,02 ± 0,01 0,02 ± 0,01 0,05 ± 0,03 0,01 ± 0,01 0,01 ± 0,01 0,02 ± 0,01 0,02 ± 0,02 0,02 ± 0,01 0,02 ± 0,01
Humulene SQ 0,04 ± 0,01 0,06 ± 0,02 0,03 ± 0,01 0,02 ± 0,01 0,06 ± 0,01 0,06 ± 0,02 0,03 ± 0,01 0,04 ± 0,02 0,04 ± 0,01
Bornyl chloride OTHER 0,00 ± 0,00 0,11 ± 0,08 0,03 ± 0,01 0,07 ± 0,04 0,00 ± 0,01 0,00 ± 0,00 0,01 ± 0,01 0,02 ± 0,02 0,00 ± 0,00
Tridecane OTHER 0,00 ± 0,00 0,00 ± 0,00 0,00 ± 0,00 0,00 ± 0,00 0,01 ± 0,01 0,00 ± 0,00 0,00 ± 0,00 0,00 ± 0,00 0,00 ± 0,00
7-Tetradecene, (E) OTHER 0,01 ± 0,00 0,02 ± 0,01 0,00 ± 0,00 0,00 ± 0,01 0,02 ± 0,01 0,01 ± 0,00 0,00 ± 0,00 0,00 ± 0,00 0,01 ± 0,01
Tetradecane OTHER 0,02 ± 0,01 0,02 ± 0,01 0,01 ± 0,01 0,01 ± 0,01 0,02 ± 0,01 0,01 ± 0,00 0,04 ± 0,07 0,04 ± 0,04 0,01 ± 0,00
Hexadecane OTHER 0,00 ± 0,01 0,00 ± 0,00 0,00 ± 0,00 0,00 ± 0,00 0,00 ± 0,00 0,01 ± 0,01 0,01 ± 0,03 0,00 ± 0,00 0,00 ± 0,00

5. Appendix 2
Tab. 1. Confusion matrices generated by the different algorithms applied for the
treatments of EOS835 data

95
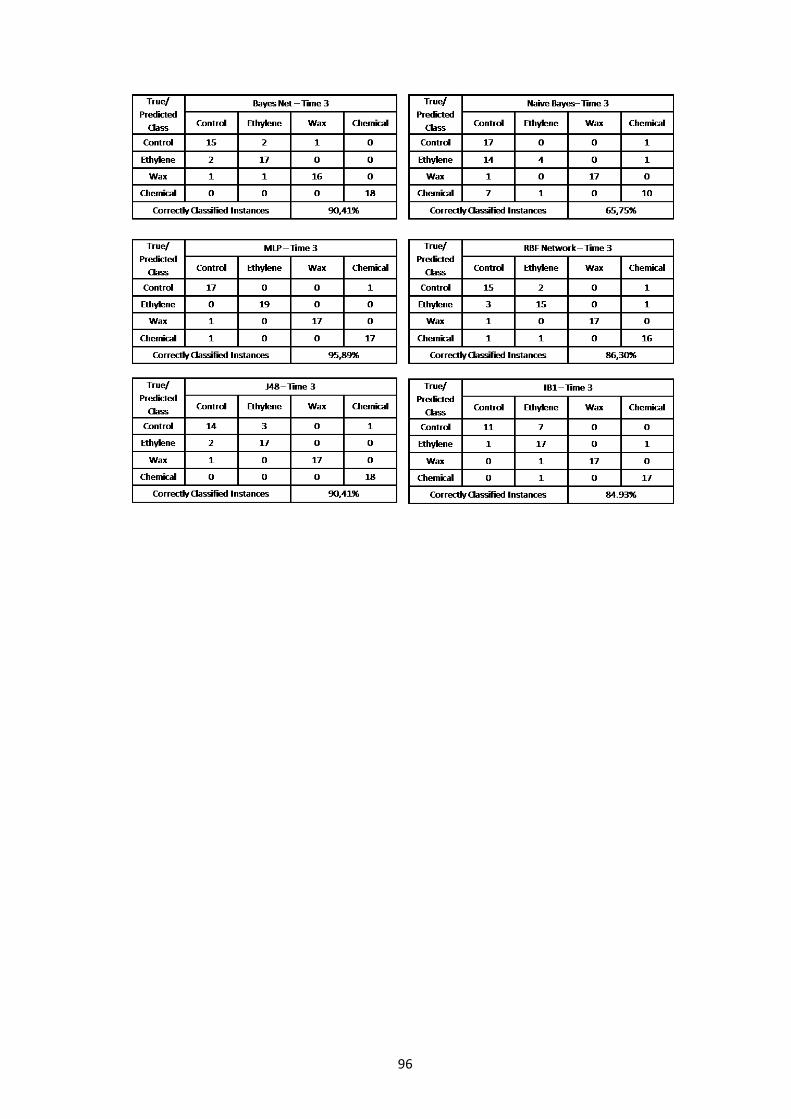
96

97
Tab. 2. Confusion matrices generated by the different algorithms applied for the
treatments of MOOSY32 data
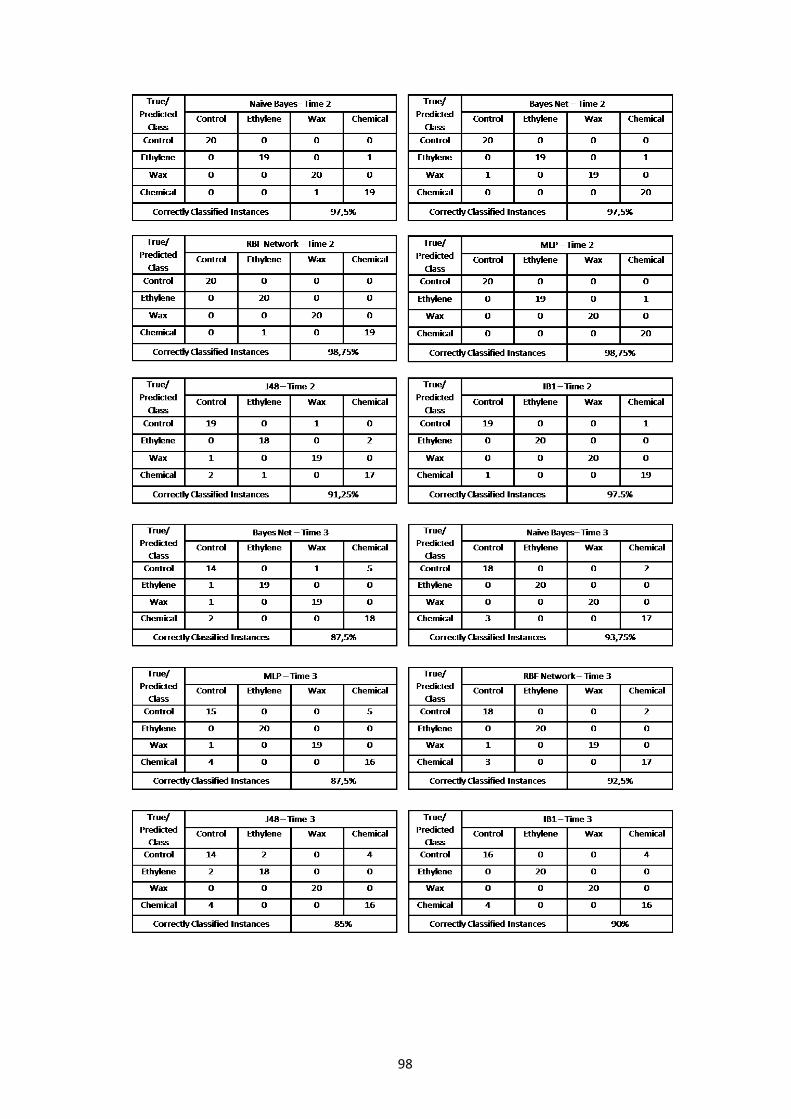
98

CHEMICAL CLASSES
TREATMENTS TIME Alcohols Aldehydes Esters Ketones Monoterpenes Sesquiterpenes Others
CONTROL
T0 5,46±1,27 4,41±2,79 0,08±0,01 0,22±0,03 88,81±4,03 1,21±0,02 0,01±0,01
T1 2,35±0,35 5,08±0,64 0,32±0,04 0,29±0,02 89,33±1,80 2,61±0,76 0,03±0,00
T2 1,61±0,50 2,69±1,17 029±0,06 0,27±0,03 91,52±1,50 3,57±0,27 0,05±0,01
T3 2,56±0,02 0,98±0,30 0,72±0,21 0,29±0,01 92,24±0,38 3,22±0,12 0,00±0,00
CHEMICAL
T0 3,22±0,35 6,42±0,51 0,61±0,09 0,30±0,07 88,27±1,08 1,17±0,06 0,01±0,01
T1 1,63±0,17 4,78±0,21 0,53±008 030±0,01 89,45±0,20 3,28±0,12 0,03±0,01
T2 1,79±0,00 0,74±0,00 2,80±0,00 0,31±0,00 91,08±0,00 3,28±0,00 0,00±0,00
T3 2,18±0,19 0,78±0,16 9,66±0,53 0,18±0,04 84,80±1,27 2,40±0,35 0,00±0,00
EHYLENE
T0 1,96±0,19 0,99±0,06 5,23±0,44 0,37±004 85,04±0,37 6,39±1,01 0,01±0,00
T1 2,50±0,34 1,40±0,33 3,22±0,53 0,52±0,03 83,49±0,38 8,77±1,57 0,11±0,02
T2 1,10±0,19 0,71±0,08 3,12±0,49 0,46±0,03 84,22±116 10,37±1,97 0,02±0,02
T3 1,15±0,09 0,46±0,11 8,05±2,34 0,32±0,08 82,53±3,37 7,49±1,13 0,00±0,00
WAX
T0 1,68±0,33 1,68±0,05 5,88±0,40 0,30±0,02 83,74±0,74 7,46±0,04 0,02±0,02
T1 1,62±0,27 0,92±0,13 6,19±0,55 0,43±0,02 82,30±0,68 8,45±0,32 0,09±0,02
T2 1,67±0,07 0,43±0,08 8,27±0,14 0,40±0,05 78,55±0,62 10,68±0,55 0,00±0,00
T3 1,75±0,00 0,39±0,00 17,49±0,00 0,39±0,00 71,35±0,00 8,63±0,00 0,00±0,00
Tab. 3. Variation of chemical composition of the volatile fraction of the juices in the four treatments at T0) after harvest; T1) after 4 weeks at
4°C; T2) after 8 weeks at 4°C; T3) after an additional week at 20 °C.
Data are arranged according to Chemical Groups, and represents the mean relative percentage of individual compounds from duplicate
experiments.

Molecules Chemical
Classes
CONTROL CHEMICAL ETHYLENE WAX
T 0 T1 T2 T3 T 0 T1 T2 T3 T 0 T1 T2 T3 T 0 T1 T2 T3
1-Butanol, 3-methyl AC 0,00 ± 0,00 0,00 ± 0,00 0,00 ± 0,00 0,04 ± 0,02 0,00 ± 0,00 0,00 ± 0,00 0,00 ± 0,00 0,06 ± 0,01 0,00 ± 0,00 0,00 ± 0,00 0,00 ± 0,00 0,02 ± 0,02 0,01 ± 0,01 0,00 ± 0,00 0,00 ± 0,00 0,27 ± 0,00
4-Hexen-1-ol, (Z) AC 0,00 ± 0,00 0,00 ± 0,00 0,00 ± 0,00 0,35 ± 0,02 0,00 ± 0,00 0,00 ± 0,00 0,00 ± 0,00 0,48 ± 0,01 0,00 ± 0,00 0,00 ± 0,00 0,00 ± 0,00 0,00 ± 0,00 0,00 ± 0,00 0,00 ± 0,00 0,00 ± 0,00 0,00 ± 0,00
3-Hexen-1-ol, (Z) AC 0,27 ± 0,25 0,11 ± 0,01 0,12 ± 0,04 0,00 ± 0,00 0,41 ± 0,02 0,07 ± 0,01 0,06 ± 0,00 0,00 ± 0,00 0,00 ± 0,00 0,00 ± 0,00 0,00 ± 0,00 0,06 ± 0,08 0,00 ± 0,00 0,00 ± 0,00 0,00 ± 0,00 0,00 ± 0,00
2-Hexen-1-ol, (Z) AC 0,19 ± 0,09 0,04 ± 0,01 0,07 ± 0,02 0,10 ± 0,01 0,08 ± 0,01 0,02 ± 0,00 0,04 ± 0,00 0,06 ± 0,01 0,07 ± 0,00 0,10 ± 0,02 0,00 ± 0,00 0,12 ± 0,01 0,03 ± 0,00 0,00 ± 0,00 0,00 ± 0,00 0,04 ± 0,00
1-Hexanol AC 0,35 ± 0,30 0,15 ± 0,01 0,16 ± 0,05 0,47 ± 0,02 0,39 ± 0,02 0,11 ± 0,01 0,13 ± 0,00 0,52 ± 0,04 0,12 ± 0,01 0,20 ± 0,05 0,04 ± 0,01 0,33 ± 0,05 0,09 ± 0,01 0,07 ± 0,01 0,05 ± 0,01 0,18 ± 0,00
1-Octanol AC 1,83 ± 0,04 0,53 ± 0,06 0,39 ± 0,11 0,42 ± 0,07 0,77 ± 0,08 0,41 ± 0,02 0,58 ± 0,00 0,29 ± 0,04 0,39 ± 0,05 0,90 ± 0,05 0,00 ± 0,00 0,10 ± 0,14 0,33 ± 0,03 0,58 ± 0,07 0,58 ± 0,03 0,38 ± 0,00
beta-Linalool AC 1,83 ± 0,52 0,57 ± 0,13 0,29 ± 0,13 0,33 ± 0,01 0,76 ± 0,19 0,42 ± 0,07 0,43 ± 0,00 0,29 ± 0,04 0,60 ± 0,07 0,59 ± 0,12 0,47 ± 0,07 0,23 ± 0,03 0,43 ± 0,10 0,34 ± 0,08 0,50 ± 0,01 0,40 ± 0,00
beta-Terpineol AC 0,00 ± 0,00 0,00 ± 0,00 0,00 ± 0,00 0,00 ± 0,00 0,01 ± 0,01 0,01 ± 0,01 0,00 ± 0,00 0,00 ± 0,00 0,01 ± 0,01 0,01 ± 0,01 0,00 ± 0,00 0,00 ± 0,00 0,01 ± 0,02 0,00 ± 0,00 0,00 ± 0,00 0,00 ± 0,00
Nonanol AC 0,05 ± 0,01 0,00 ± 0,00 0,00 ± 0,00 0,00 ± 0,00 0,00 ± 0,00 0,00 ± 0,00 0,00 ± 0,00 0,00 ± 0,00 0,00 ± 0,00 0,03 ± 0,00 0,02 ± 0,02 0,00 ± 0,00 0,00 ± 0,00 0,01 ± 0,00 0,03 ± 0,00 0,02 ± 0,00
4-Terpineol AC 0,91 ± 0,11 0,00 ± 0,00 0,56 ± 0,16 0,85 ± 0,01 0,75 ± 0,15 0,00 ± 0,00 0,54 ± 0,00 0,47 ± 0,04 0,72 ± 0,03 0,58 ± 0,07 0,55 ± 0,06 0,30 ± 0,00 0,00 ± 0,00 0,60 ± 0,12 0,51 ± 0,03 0,45 ± 0,00
3-Cyclohexen-1-ol, 4-methyl-1-(1-methylethyl) AC 0,00 ± 0,00 0,92 ± 0,12 0,00 ± 0,00 0,00 ± 0,00 0,00 ± 0,00 0,57 ± 0,07 0,00 ± 0,00 0,00 ± 0,00 0,00 ± 0,00 0,00 ± 0,00 0,00 ± 0,00 0,00 ± 0,00 0,75 ± 0,17 0,00 ± 0,00 0,00 ± 0,00 0,00 ± 0,00
beta-Citronellol AC 0,02 ± 0,02 0,00 ± 0,00 0,00 ± 0,00 0,00 ± 0,00 0,01 ± 0,01 0,00 ± 0,00 0,00 ± 0,00 0,00 ± 0,00 0,00 ± 0,00 0,04 ± 0,01 0,01 ± 0,01 0,00 ± 0,00 0,00 ± 0,00 0,00 ± 0,00 0,00 ± 0,00 0,00 ± 0,00
Carvacrol AC 0,01 ± 0,01 0,03 ± 0,01 0,03 ± 0,01 0,00 ± 0,00 0,04 ± 0,01 0,03 ± 0,01 0,00 ± 0,00 0,00 ± 0,00 0,04 ± 0,01 0,05 ± 0,01 0,00 ± 0,00 0,00 ± 0,00 0,03 ± 0,00 0,02 ± 0,00 0,00 ± 0,00 0,00 ± 0,00
Pentanal AD 0,11 ± 0,10 0,25 ± 0,02 0,10 ± 0,02 0,08 ± 0,00 0,20 ± 0,01 0,14 ± 0,01 0,07 ± 0,00 0,05 ± 0,00 0,12 ± 0,01 0,13 ± 0,08 0,07 ± 0,00 0,04 ± 0,02 0,21 ± 0,06 0,07 ± 0,01 0,03 ± 0,01 0,00 ± 0,00
Hexanal AD 3,57 ± 2,73 3,93 ± 0,46 1,89 ± 0,94 0,00 ± 0,00 5,14 ± 0,27 3,57 ± 0,19 0,00 ± 0,00 0,00 ± 0,00 0,00 ± 0,00 0,08 ± 0,02 0,00 ± 0,00 0,00 ± 0,00 0,00 ± 0,00 0,00 ± 0,00 0,00 ± 0,00 0,00 ± 0,00
2-Hexenal, (E) AD 0,16 ± 0,03 0,08 ± 0,02 0,05 ± 0,01 0,32 ± 0,06 0,16 ± 0,03 0,09 ± 0,00 0,00 ± 0,00 0,29 ± 0,07 0,15 ± 0,00 0,00 ± 0,00 0,03 ± 0,04 0,11 ± 0,15 0,07 ± 0,02 0,01 ± 0,01 0,00 ± 0,00 0,11 ± 0,00
Heptanal AD 0,21 ± 0,06 0,30 ± 0,06 0,14 ± 0,11 0,26 ± 0,15 0,46 ± 0,11 0,28 ± 0,04 0,09 ± 0,00 0,12 ± 0,02 0,22 ± 0,04 0,28 ± 0,14 0,16 ± 0,11 0,12 ± 0,10 0,22 ± 0,05 0,16 ± 0,06 0,08 ± 0,02 0,06 ± 0,00
Nonanal AD 0,14 ± 0,02 0,08 ± 0,02 0,08 ± 0,04 0,13 ± 0,08 0,10 ± 0,01 0,08 ± 0,01 0,10 ± 0,00 0,09 ± 0,04 0,09 ± 0,01 0,22 ± 0,08 0,14 ± 0,08 0,07 ± 0,01 0,08 ± 0,02 0,09 ± 0,02 0,08 ± 0,00 0,10 ± 0,00
2-Nonenal, (E) AD 0,00 ± 0,00 0,03 ± 0,01 0,00 ± 0,00 0,00 ± 0,00 0,00 ± 0,00 0,02 ± 0,00 0,00 ± 0,00 0,00 ± 0,00 0,01 ± 0,01 0,01 ± 0,02 0,00 ± 0,00 0,00 ± 0,00 0,00 ± 0,00 0,00 ± 0,00 0,00 ± 0,00 0,00 ± 0,00
Benzaldehyde, 2,4-dimethyl AD 0,00 ± 0,00 0,00 ± 0,00 0,37 ± 0,02 0,17 ± 0,00 0,00 ± 0,00 0,00 ± 0,00 0,38 ± 0,00 0,23 ± 0,01 0,00 ± 0,00 0,00 ± 0,00 0,25 ± 0,05 0,13 ± 0,05 0,00 ± 0,00 0,00 ± 0,00 0,24 ± 0,05 0,12 ± 0,00
Benzaldehyde, 3,4-dimethyl AD 0,11 ± 0,05 0,25 ± 0,02 0,00 ± 0,00 0,00 ± 0,00 0,21 ± 0,04 0,45 ± 0,02 0,00 ± 0,00 0,00 ± 0,00 0,20 ± 0,00 0,52 ± 0,01 0,00 ± 0,00 0,00 ± 0,00 0,14 ± 0,00 0,50 ± 0,02 0,00 ± 0,00 0,00 ± 0,00
3-Cyclohexene-1-acetaldehyde, .alpha.,4-dimethyl AD 0,03 ± 0,04 0,05 ± 0,01 0,01 ± 0,01 0,00 ± 0,00 0,06 ± 0,01 0,05 ± 0,00 0,04 ± 0,00 0,00 ± 0,00 0,06 ± 0,00 0,06 ± 0,02 0,04 ± 0,02 0,00 ± 0,00 0,08 ± 0,01 0,04 ± 0,00 0,02 ± 0,03 0,00 ± 0,00
Cumaldehyde AD 0,00 ± 0,00 0,04 ± 0,00 0,03 ± 0,01 0,00 ± 0,00 0,01 ± 0,01 0,04 ± 0,01 0,02 ± 0,00 0,00 ± 0,00 0,04 ± 0,01 0,05 ± 0,01 0,01 ± 0,01 0,00 ± 0,00 0,04 ± 0,01 0,04 ± 0,01 0,00 ± 0,00 0,00 ± 0,00
alpha-Citral AD 0,04 ± 0,00 0,00 ± 0,00 0,00 ± 0,00 0,00 ± 0,00 0,00 ± 0,00 0,00 ± 0,00 0,00 ± 0,00 0,00 ± 0,00 0,01 ± 0,01 0,00 ± 0,00 0,00 ± 0,00 0,00 ± 0,00 0,00 ± 0,00 0,00 ± 0,00 0,00 ± 0,00 0,00 ± 0,00
Perillaldehyde AD 0,05 ± 0,02 0,07 ± 0,01 0,03 ± 0,01 0,01 ± 0,02 0,08 ± 0,02 0,06 ± 0,00 0,03 ± 0,00 0,01 ± 0,01 0,10 ± 0,01 0,04 ± 0,01 0,00 ± 0,00 0,00 ± 0,00 0,08 ± 0,01 0,02 ± 0,00 0,00 ± 0,00 0,00 ± 0,00
Propanoic acid, ethyl ester ES 0,00 ± 0,00 0,00 ± 0,00 0,02 ± 0,01 0,02 ± 0,01 0,00 ± 0,00 0,01 ± 0,01 0,01 ± 0,00 0,03 ± 0,04 0,00 ± 0,00 0,02 ± 0,01 0,02 ± 0,02 0,04 ± 0,00 0,08 ± 0,07 0,05 ± 0,01 0,04 ± 0,01 0,05 ± 0,00
Butanoic acid, methyl ester ES 0,00 ± 0,00 0,00 ± 0,00 0,00 ± 0,00 0,03 ± 0,01 0,00 ± 0,00 0,01 ± 0,01 0,02 ± 0,00 0,07 ± 0,01 0,03 ± 0,00 0,02 ± 0,00 0,05 ± 0,01 0,06 ± 0,08 0,00 ± 0,00 0,07 ± 0,01 0,06 ± 0,00 0,14 ± 0,00
Butanoic acid, ethyl ester ES 0,00 ± 0,00 0,00 ± 0,00 0,00 ± 0,00 0,00 ± 0,00 0,00 ± 0,00 0,00 ± 0,00 2,41 ± 0,00 8,68 ± 0,36 4,47 ± 0,42 2,58 ± 0,47 2,79 ± 0,51 6,98 ± 1,83 5,13 ± 0,26 5,57 ± 0,47 7,64 ± 0,15 14,60 ± 0,00
2-Butenoic acid, ethyl ester ES 0,00 ± 0,00 0,00 ± 0,00 0,00 ± 0,00 0,04 ± 0,02 0,00 ± 0,00 0,00 ± 0,00 0,00 ± 0,00 0,09 ± 0,03 0,02 ± 0,00 0,00 ± 0,00 0,00 ± 0,00 0,12 ± 0,08 0,03 ± 0,02 0,04 ± 0,01 0,09 ± 0,01 0,46 ± 0,00
Butanoic acid, 2-methyl-, ethyl ester ES 0,00 ± 0,00 0,00 ± 0,00 0,00 ± 0,00 0,00 ± 0,00 0,00 ± 0,00 0,00 ± 0,00 0,00 ± 0,00 0,03 ± 0,04 0,00 ± 0,00 0,00 ± 0,00 0,00 ± 0,00 0,16 ± 0,15 0,00 ± 0,00 0,02 ± 0,00 0,00 ± 0,00 0,27 ± 0,00
Butanoic acid, propyl ester ES 0,00 ± 0,00 0,00 ± 0,00 0,00 ± 0,00 0,00 ± 0,00 0,00 ± 0,00 0,00 ± 0,00 0,00 ± 0,00 0,00 ± 0,00 0,00 ± 0,00 0,00 ± 0,00 0,01 ± 0,01 0,00 ± 0,00 0,00 ± 0,00 0,03 ± 0,01 0,03 ± 0,00 0,04 ± 0,00
Hexanoic acid, ethyl ester ES 0,00 ± 0,00 0,00 ± 0,00 0,00 ± 0,00 0,42 ± 0,17 0,29 ± 0,04 0,05 ± 0,07 0,00 ± 0,00 0,46 ± 0,01 0,28 ± 0,02 0,18 ± 0,01 0,03 ± 0,04 0,50 ± 0,21 0,29 ± 0,03 0,16 ± 0,01 0,22 ± 0,01 1,70 ± 0,00
Ethyl 2-hexenoate ES 0,00 ± 0,00 0,00 ± 0,00 0,00 ± 0,00 0,01 ± 0,02 0,00 ± 0,00 0,00 ± 0,00 0,00 ± 0,00 0,02 ± 0,00 0,00 ± 0,00 0,00 ± 0,00 0,00 ± 0,00 0,00 ± 0,00 0,02 ± 0,01 0,00 ± 0,00 0,00 ± 0,00 0,08 ± 0,00
n-Octyl acetate ES 0,06 ± 0,02 0,24 ± 0,02 0,18 ± 0,03 0,10 ± 0,02 0,25 ± 0,09 0,36 ± 0,02 0,24 ± 0,00 0,15 ± 0,01 0,36 ± 0,02 0,29 ± 0,02 0,13 ± 0,02 0,08 ± 0,02 0,24 ± 0,00 0,17 ± 0,03 0,08 ± 0,00 0,05 ± 0,00
Linalyl anthranilate ES 0,02 ± 0,01 0,03 ± 0,01 0,04 ± 0,01 0,04 ± 0,01 0,06 ± 0,02 0,04 ± 0,00 0,05 ± 0,00 0,07 ± 0,02 0,05 ± 0,01 0,06 ± 0,02 0,05 ± 0,01 0,08 ± 0,02 0,05 ± 0,01 0,04 ± 0,01 0,06 ± 0,00 0,04 ± 0,00
n-Decyl acetate ES 0,00 ± 0,00 0,05 ± 0,01 0,06 ± 0,01 0,06 ± 0,01 0,02 ± 0,02 0,06 ± 0,00 0,07 ± 0,00 0,06 ± 0,01 0,03 ± 0,00 0,07 ± 0,00 0,06 ± 0,01 0,04 ± 0,00 0,04 ± 0,01 0,05 ± 0,00 0,05 ± 0,01 0,04 ± 0,00
4-Acetyl-1-methylcyclohexene K 0,04 ± 0,00 0,04 ± 0,01 0,01 ± 0,01 0,00 ± 0,00 0,05 ± 0,01 0,03 ± 0,00 0,00 ± 0,00 0,00 ± 0,00 0,04 ± 0,00 0,05 ± 0,01 0,01 ± 0,01 0,00 ± 0,00 0,03 ± 0,01 0,03 ± 0,00 0,00 ± 0,00 0,00 ± 0,00
p-Methylacetophenone K 0,00 ± 0,00 0,04 ± 0,01 0,06 ± 0,01 0,04 ± 0,01 0,05 ± 0,02 0,04 ± 0,01 0,07 ± 0,00 0,02 ± 0,02 0,08 ± 0,01 0,07 ± 0,00 0,06 ± 0,01 0,02 ± 0,02 0,05 ± 0,00 0,07 ± 0,00 0,04 ± 0,01 0,03 ± 0,00
Dihydrocarvone K 0,01 ± 0,01 0,03 ± 0,00 0,00 ± 0,00 0,00 ± 0,00 0,04 ± 0,01 0,03 ± 0,00 0,02 ± 0,00 0,00 ± 0,00 0,03 ± 0,00 0,03 ± 0,00 0,00 ± 0,00 0,00 ± 0,00 0,03 ± 0,00 0,03 ± 0,01 0,00 ± 0,00 0,00 ± 0,00
Levo-carvone K 0,14 ± 0,02 0,13 ± 0,00 0,09 ± 0,01 0,06 ± 0,01 0,15 ± 0,04 0,12 ± 0,01 0,08 ± 0,00 0,04 ± 0,01 0,15 ± 0,00 0,15 ± 0,00 0,07 ± 0,01 0,03 ± 0,00 0,10 ± 0,01 0,12 ± 0,01 0,06 ± 0,01 0,04 ± 0,00
Continue
Tab. 4. Variation of chemical composition of the volatile fraction of the juices in the four treatments at T0) after harvest; T1) after 4 weeks at 4°C; T2) after 8 weeks at 4°C; T3) after an additional week at 20 °C.
Data are arranged according to Chemical Groups, and represents the mean relative percentage of individual compounds from duplicate experiments. Family code: AC, alcohols; AD, aldehydes; ES, esters; K, ketones; MT, monoterpenes; SQ, sesquiterpenes.

Molecules Chemical
Classes
CONTROL CHEMICAL ETHYLENE WAX
T 0 T1 T2 T3 T 0 T1 T2 T3 T 0 T1 T2 T3 T 0 T1 T2 T3
Nootkatone K 0,03 ± 0,01 0,05 ± 0,00 0,11 ± 0,00 0,19 ± 0,01 0,02 ± 0,00 0,08 ± 0,00 0,13 ± 0,00 0,12 ± 0,01 0,07 ± 0,03 0,22 ± 0,04 0,33 ± 0,03 0,26 ± 0,06 0,09 ± 0,01 0,18 ± 0,01 0,30 ± 0,03 0,31 ± 0,00
alpha thujene MT 0,04 ± 0,02 0,06 ± 0,01 0,07 ± 0,02 0,06 ± 0,01 0,07 ± 0,01 0,03 ± 0,01 0,03 ± 0,00 0,03 ± 0,00 0,06 ± 0,00 0,04 ± 0,01 0,05 ± 0,01 0,03 ± 0,00 0,05 ± 0,01 0,04 ± 0,01 0,03 ± 0,00 0,00 ± 0,00
alpha-Pinene MT 0,10 ± 0,06 0,07 ± 0,00 0,07 ± 0,01 0,07 ± 0,01 0,08 ± 0,00 0,08 ± 0,01 0,06 ± 0,00 0,08 ± 0,00 0,09 ± 0,02 0,07 ± 0,00 0,06 ± 0,01 0,05 ± 0,00 0,07 ± 0,01 0,07 ± 0,00 0,05 ± 0,00 0,03 ± 0,00
beta-Phellandrene MT 0,20 ± 0,17 0,11 ± 0,01 0,15 ± 0,04 0,25 ± 0,11 0,08 ± 0,00 0,05 ± 0,01 0,06 ± 0,00 0,09 ± 0,00 0,12 ± 0,04 0,06 ± 0,01 0,12 ± 0,02 0,13 ± 0,02 0,07 ± 0,01 0,08 ± 0,01 0,07 ± 0,02 0,04 ± 0,00
2-Menthene MT 0,21 ± 0,29 0,07 ± 0,01 0,03 ± 0,04 0,00 ± 0,00 0,10 ± 0,04 0,04 ± 0,01 0,00 ± 0,00 0,00 ± 0,00 0,04 ± 0,01 0,02 ± 0,02 0,03 ± 0,04 0,03 ± 0,04 0,07 ± 0,01 0,00 ± 0,00 0,00 ± 0,00 0,00 ± 0,00
3-Menthene MT 0,98 ± 1,39 1,04 ± 0,13 0,51 ± 0,19 0,38 ± 0,07 1,40 ± 0,51 0,73 ± 0,09 0,31 ± 0,00 0,35 ± 0,01 0,60 ± 0,02 0,50 ± 0,22 0,57 ± 0,31 0,41 ± 0,27 0,99 ± 0,06 0,37 ± 0,06 0,32 ± 0,02 0,24 ± 0,00
beta-Myrcene MT 3,98 ± 0,09 2,95 ± 0,25 2,52 ± 0,70 2,88 ± 0,86 2,72 ± 0,22 3,64 ± 0,41 2,76 ± 0,00 2,98 ± 0,04 3,19 ± 0,33 3,32 ± 0,12 2,84 ± 0,44 2,50 ± 0,92 2,11 ± 0,33 2,49 ± 0,10 2,35 ± 0,06 1,78 ± 0,00
3-Carene MT 0,00 ± 0,00 0,00 ± 0,00 1,09 ± 0,11 1,41 ± 0,22 0,00 ± 0,00 0,00 ± 0,00 1,07 ± 0,00 1,20 ± 0,03 0,00 ± 0,00 0,00 ± 0,00 1,16 ± 0,05 1,09 ± 0,14 0,00 ± 0,00 1,21 ± 0,09 1,04 ± 0,00 1,07 ± 0,00
2-Carene MT 0,00 ± 0,00 2,88 ± 2,77 4,16 ± 1,10 3,22 ± 0,31 0,00 ± 0,00 2,29 ± 2,41 3,78 ± 0,00 2,70 ± 0,30 0,00 ± 0,00 0,00 ± 0,00 3,53 ± 0,19 3,19 ± 1,59 0,29 ± 0,41 2,04 ± 2,88 2,96 ± 0,27 0,92 ± 0,00
D-Limonene MT 73,61 ± 2,43 72,98 ± 1,37 72,73 ± 0,10 74,16 ± 1,97 73,93 ± 1,11 73,10 ± 2,69 72,13 ± 0,00 69,48 ± 0,85 72,07 ± 0,06 70,36 ± 0,54 66,13 ± 1,11 70,76 ± 8,24 71,06 ± 1,50 66,24 ± 3,24 62,93 ± 1,33 59,40 ± 0,00
β-cis-Ocimene MT 0,09 ± 0,01 0,07 ± 0,01 0,06 ± 0,01 0,07 ± 0,03 0,06 ± 0,01 0,07 ± 0,01 0,07 ± 0,00 0,06 ± 0,00 0,05 ± 0,01 0,06 ± 0,00 0,07 ± 0,02 0,02 ± 0,02 0,05 ± 0,01 0,07 ± 0,01 0,06 ± 0,01 0,06 ± 0,00
Cyclopentene, 3-isopropenyl-5,5-dimethyl MT 0,00 ± 0,00 0,00 ± 0,00 0,08 ± 0,02 0,08 ± 0,01 0,00 ± 0,00 0,00 ± 0,00 0,08 ± 0,00 0,07 ± 0,00 0,00 ± 0,00 0,00 ± 0,00 0,08 ± 0,01 0,03 ± 0,04 0,00 ± 0,00 0,07 ± 0,01 0,07 ± 0,01 0,05 ± 0,00
β trans Ocimene MT 0,08 ± 0,01 0,09 ± 0,01 0,00 ± 0,00 0,00 ± 0,00 0,07 ± 0,01 0,08 ± 0,01 0,00 ± 0,00 0,00 ± 0,00 0,05 ± 0,00 0,07 ± 0,01 0,00 ± 0,00 0,00 ± 0,00 0,07 ± 0,00 0,00 ± 0,00 0,00 ± 0,00 0,00 ± 0,00
gamma-Terpinene MT 1,21 ± 0,27 0,99 ± 0,00 0,72 ± 0,09 0,79 ± 0,19 0,72 ± 0,02 0,86 ± 0,04 0,76 ± 0,00 0,61 ± 0,04 0,56 ± 0,02 0,58 ± 0,03 0,62 ± 0,09 0,21 ± 0,30 0,77 ± 0,09 0,73 ± 0,16 0,59 ± 0,05 0,43 ± 0,00
4-Carene MT 5,56 ± 0,55 5,00 ± 0,32 4,15 ± 1,02 4,25 ± 0,35 3,65 ± 0,44 4,92 ± 0,22 4,67 ± 0,00 3,66 ± 0,29 2,99 ± 0,02 3,49 ± 0,01 3,93 ± 0,03 1,67 ± 2,36 4,38 ± 0,20 3,89 ± 1,00 3,65 ± 0,19 2,87 ± 0,00
Styrene, 2,6-dimethyl MT 2,38 ± 0,87 2,95 ± 0,17 5,07 ± 0,32 4,53 ± 0,23 5,22 ± 0,82 3,42 ± 0,16 5,10 ± 0,00 3,43 ± 0,21 5,16 ± 0,10 4,81 ± 0,25 4,88 ± 0,07 2,34 ± 3,31 3,69 ± 0,21 4,83 ± 0,10 4,25 ± 0,11 4,36 ± 0,00
2,4,6-Octatriene, 2,6-dimethyl MT 0,09 ± 0,03 0,00 ± 0,00 0,04 ± 0,01 0,00 ± 0,00 0,10 ± 0,00 0,07 ± 0,01 0,07 ± 0,00 0,07 ± 0,00 0,00 ± 0,00 0,00 ± 0,00 0,06 ± 0,04 0,00 ± 0,00 0,00 ± 0,00 0,08 ± 0,04 0,09 ± 0,06 0,00 ± 0,00
2,4,6-Octatriene, 2,6-dimethyl-, (E,Z) MT 0,07 ± 0,02 0,06 ± 0,00 0,08 ± 0,00 0,09 ± 0,02 0,08 ± 0,01 0,07 ± 0,00 0,10 ± 0,00 0,00 ± 0,00 0,06 ± 0,00 0,10 ± 0,01 0,09 ± 0,01 0,08 ± 0,01 0,05 ± 0,00 0,09 ± 0,01 0,09 ± 0,01 0,09 ± 0,00
Copaene SQ 0,03 ± 0,00 0,04 ± 0,02 0,04 ± 0,02 0,01 ± 0,02 0,01 ± 0,01 0,07 ± 0,02 0,02 ± 0,00 0,02 ± 0,02 0,02 ± 0,00 0,06 ± 0,02 0,03 ± 0,01 0,02 ± 0,00 0,01 ± 0,01 0,02 ± 0,00 0,02 ± 0,00 0,02 ± 0,00
beta-Elemene, (-) SQ 0,02 ± 0,01 0,05 ± 0,01 0,07 ± 0,00 0,06 ± 0,00 0,02 ± 0,00 0,06 ± 0,00 0,05 ± 0,00 0,05 ± 0,01 0,14 ± 0,00 0,16 ± 0,04 0,18 ± 0,09 0,13 ± 0,01 0,15 ± 0,04 0,10 ± 0,00 0,13 ± 0,02 0,10 ± 0,00
Caryophyllene SQ 0,03 ± 0,00 0,00 ± 0,00 0,00 ± 0,00 0,00 ± 0,00 0,05 ± 0,01 0,00 ± 0,00 0,00 ± 0,00 0,00 ± 0,00 0,12 ± 0,01 0,00 ± 0,00 0,00 ± 0,00 0,00 ± 0,00 0,14 ± 0,00 0,17 ± 0,00 0,00 ± 0,00 0,00 ± 0,00
Alloaromadendrene SQ 0,03 ± 0,01 0,02 ± 0,02 0,04 ± 0,00 0,02 ± 0,03 0,01 ± 0,01 0,04 ± 0,01 0,03 ± 0,00 0,03 ± 0,00 0,13 ± 0,02 0,16 ± 0,02 0,17 ± 0,05 0,11 ± 0,03 0,13 ± 0,01 0,14 ± 0,01 0,18 ± 0,01 0,13 ± 0,00
alpha-Caryophyllene SQ 0,00 ± 0,00 0,00 ± 0,00 0,00 ± 0,00 0,00 ± 0,00 0,00 ± 0,00 0,00 ± 0,00 0,00 ± 0,00 0,00 ± 0,00 0,02 ± 0,01 0,03 ± 0,00 0,03 ± 0,01 0,01 ± 0,01 0,02 ± 0,00 0,02 ± 0,00 0,01 ± 0,02 0,02 ± 0,00
alpha-Gurjunene SQ 0,00 ± 0,00 0,03 ± 0,04 0,04 ± 0,01 0,03 ± 0,00 0,01 ± 0,01 0,04 ± 0,01 0,03 ± 0,00 0,01 ± 0,01 0,03 ± 0,01 0,06 ± 0,01 0,04 ± 0,00 0,02 ± 0,00 0,06 ± 0,01 0,06 ± 0,01 0,04 ± 0,01 0,03 ± 0,00
beta-Selinene SQ 0,00 ± 0,00 0,13 ± 0,01 0,00 ± 0,00 0,00 ± 0,00 0,00 ± 0,00 0,14 ± 0,00 0,00 ± 0,00 0,00 ± 0,00 0,16 ± 0,03 0,23 ± 0,03 0,00 ± 0,00 0,00 ± 0,00 0,00 ± 0,00 0,21 ± 0,01 0,00 ± 0,00 0,00 ± 0,00
Valencene SQ 0,99 ± 0,02 1,94 ± 0,53 2,76 ± 0,23 2,54 ± 0,07 0,95 ± 0,01 2,49 ± 0,10 2,58 ± 0,00 1,92 ± 0,32 5,17 ± 0,80 6,87 ± 1,30 8,55 ± 1,60 6,34 ± 0,96 6,05 ± 0,13 6,53 ± 0,21 8,89 ± 0,42 7,22 ± 0,00
beta-Humulene SQ 0,00 ± 0,00 0,00 ± 0,00 0,03 ± 0,00 0,02 ± 0,02 0,00 ± 0,00 0,00 ± 0,00 0,03 ± 0,00 0,00 ± 0,00 0,00 ± 0,00 0,18 ± 0,06 0,19 ± 0,08 0,11 ± 0,04 0,04 ± 0,06 0,15 ± 0,04 0,21 ± 0,01 0,14 ± 0,00
beta-Panasinsene SQ 0,11 ± 0,02 0,38 ± 0,09 0,52 ± 0,05 0,45 ± 0,02 0,13 ± 0,01 0,43 ± 0,00 0,46 ± 0,00 0,30 ± 0,02 0,60 ± 0,14 1,00 ± 0,19 1,08 ± 0,14 0,67 ± 0,10 0,80 ± 0,07 0,97 ± 0,04 1,11 ± 0,08 0,87 ± 0,00
Selina-3,7(11)-diene SQ 0,00 ± 0,00 0,02 ± 0,03 0,05 ± 0,01 0,03 ± 0,00 0,00 ± 0,00 0,02 ± 0,00 0,03 ± 0,00 0,03 ± 0,01 0,02 ± 0,02 0,00 ± 0,00 0,05 ± 0,00 0,03 ± 0,00 0,05 ± 0,00 0,06 ± 0,00 0,06 ± 0,01 0,04 ± 0,00
Eudalene SQ 0,00 ± 0,00 0,00 ± 0,00 0,03 ± 0,01 0,05 ± 0,01 0,00 ± 0,00 0,00 ± 0,00 0,04 ± 0,00 0,05 ± 0,00 0,00 ± 0,00 0,01 ± 0,01 0,05 ± 0,00 0,05 ± 0,01 0,00 ± 0,00 0,03 ± 0,01 0,04 ± 0,02 0,05 ± 0,00
Styrene OTHER 0,00 ± 0,00 0,00 ± 0,00 0,04 ± 0,02 0,00 ± 0,00 0,00 ± 0,00 0,00 ± 0,00 0,00 ± 0,00 0,00 ± 0,00 0,00 ± 0,00 0,09 ± 0,01 0,02 ± 0,02 0,00 ± 0,00 0,02 ± 0,02 0,08 ± 0,02 0,00 ± 0,00 0,00 ± 0,00
Benzene, 1,3-bis(1,1-dimethylethyl) OTHER 0,01 ± 0,01 0,03 ± 0,00 0,02 ± 0,01 0,00 ± 0,00 0,01 ± 0,01 0,03 ± 0,01 0,00 ± 0,00 0,00 ± 0,00 0,01 ± 0,00 0,02 ± 0,01 0,00 ± 0,00 0,00 ± 0,00 0,00 ± 0,00 0,01 ± 0,00 0,00 ± 0,00 0,00 ± 0,00
100
7. Acknowledgments
A special thank is due to my supervisors Prof. Maria Antonietta Germanà and Dr.
Pier Luigi San Biagio for their support and help. They gave me the opportunity to
take this path and all the tools to follow it in the best way by stimulating my
scientific motivation and skills.
I wish to thank Dr. Valeria Guarrasi, without her guidance my PhD would have been
so more difficult! With her knowledge she helped me to develop a critical approach
to research and always gave me logistical, technical and scientific support. She is the
example I would like to follow.
I thank Prof. Manuel Agustí Fonfrìa and Dr. Maria Del Carmen Reig Valor for their
kind welcome and collaboration during my research period in Valencia, Spain.
Prof. Jose Pelegrí-Sebastiá and his research group in the Universitat Politecnica de
Valencia, campus de Gandia, for receiving me in their laboratory and helped me to
develop and improve my research project. They contribute to my personal and
scientific grown.
I also want to kindly thank all the people of the CRA – ACM institute of Acireale,
especially Dr. Paolo Rapisarda and Dr. Margherita Ameta., for hosting me in their
laboratory and sharing their experience and know-how.
To carry out a PhD project, is required direct or indirect participation of many people
and institutions that I want to thank.
Prof. Riccardo Lo Bianco for his kind assistance in experiments and data analysis
The farmer cooperative RoccaCoop that kindly asked me a question I tried to answer
in this thesis, and to kindly provided lemon fruits to carry the project.
The company Emilio Esteve S.L. for kindly provided orange fruits and for their
helpfulness to carry the second experiment.
All the people of the Biophysics Institute of CNR, Palermo, for their friendly support
during these three years.

101
8. Scientific skills
8.1 List of paper and reports
Characterization of Fruits of Four Different Lemon Cultivars, Collected in the
Northern Coast of Sicily.
Authors: Cupane M., Guarrasi V., Palazzolo E., San Biagio P.L. and
Germanà M.A. Acta Horticolturae in press. Proceedings of International
Citrus Congress – Valencia 2012.
Contenuto in Polifenoli Totali del Succo di Tre Varietà di Limone (Citrus
limon L. Burm) Coltivate in Sicilia.
Authors: Cupane M., Guarrasi V., Germanà M.A. e San Biagio P.L. Meeting
IBIM-STEBICEF – Palermo 2013.
Electronic Nose to detect off-flavor of drinking water.
Authors: Cupane M., Pelegrì -Sebastia J., Guarrasi V., Chilo J. and Sogorb T.
SIBPA – Palermo 2014.
Contenuto in polifenoli totali di tre varietà di limone (Citrus limon L.Burm)
coltivate in Sicilia.
Authors: Cupane M., Guarrasi V., Germanà M.A. and San Biagio P.L.
Agricoltura, Cibo e Salute – Orto Botanico di Palermo, 2014.
Postharvest life and aroma quality of four lemon cultivars grown in Sicily.
Authors: Cupane M., Guarrasi V., Palazzolo E., San Biagio P.L. and
Germanà M.A. Agricoltura, Cibo e Salute – Orto Botanico di Palermo, 2014.
8.2 Stage and Collaborations
CRA – ACM. Centro di Ricerca per l’Agrumicoltura e le Colture
Mediterranee. Acireale, Catania. Acquisition of techniques to evaluate the
antioxidant potential of citrus fruits: Vitamin C content and ORAC assay.
Univesitat Politecnica de Valencia, Dept. Enginyeria Electrònica. Institut
d’Investigaciò per a la Gestiò Integrada de Zones Costaneres – IGIC. Escola
Politècnica Superior de Gandia. Improvement of a new Multysensory Odor
Olfactory System. Application on citrus quality control and water pollution.

102
8.3 Seminar participations
Thermo Scientific – Palermo. Sicurezza alimentare e difesa dell’autenticità
delle produzioni nazionali. Orto Botanico, Palermo, 2014
Epigenetics and hormone dynamics during pollen embryogenesis in crop
species and fruit tree. Dr. María-Carmen Risueño. Facoltà di Agraria,
Palermo, maggio 2013.
Dissecting pollen embryogenesis: a biotechnological tool for crop breeding,
potentials and limitations. Dr. Pilar S. Testillano. Facoltà di Agraria, Palermo,
maggio 2013.
Citrus breeding and the problem of HLB in Florida. Prof. F.G. Gmitter Jr.
Facoltà di Agraria, Palermo, 2013.
On farm water management for fruit crops in Mediterranean area. Prof.
Ahmed El-Araby. Facoltà di Agraria, Palermo, ottobre 2013.
Evoluzioni metodologiche sull’incapsulamento dell’olivo. Dr. Maurizio
Micheli. Facoltà di Agraria, Palermo, marzo 2014.
Crioconservazione e crioterapia per la salvaguardia della biodiversità
vegetale. Dr. M. Lambardi. Facoltà di Agraria, Palermo, aprile 2013.
Le malattie del legno della vite e il complesso di funghi associate: sintomi,
interazione ospite-patogeno, lotta e diagnosi. Prof. L. Mugnai. Facoltà di
Agraria, Palermo, aprile 2013.
La struttura delle argille e la sua influenza sui prodotti agricoli e alimentari.
Prof.ssa S. Petit. Facoltà di Agraria, Palermo, aprile 2013.
Fruit growth and root development relationships in loquat. Dr.ssa C. Reig.
Facoltà di Agraria, Palermo, gennaio 2013.
Do gibberellins regulate flowering in citrus?. Prof. M. Agustí. Facoltà di
Agraria, Palermo, gennaio 2013.
Aspetti nutrizionali e salutistici delle arance rosse. Dr. P. Rapisarda. Facoltà
di Agraria, Palermo, dicembre 2012.
Nutrizione degli agrumi in ambito biologico. Dr. G. Roccuzzo. Facoltà di
Agraria, Palermo, dicembre 2012.
Aspetti tecnici e fisiologici della nutrizione e della potatura. Dr. F. Intrigliolo.
Facoltà di Agraria, Palermo, dicembre 2012.
103
References
Abad-García B., Berrueta L.A., Garmón-Lobato S., Urkaregi A., Gallo B. and Vicente
F. 2012. Chemometric Characterization of Fruit Juices from Spanish Cultivars
According to Their Phenolic Compound Contents: I. Citrus Fruits. Journal of
Agricultural and Food Chemistry. 60:3635 – 3644
Achilea O., Chalutz, F., Fuchs, Y. and Rot, I. 1984. Ethylene biosynthesis and related
physiological changes in Penicillium digitatum-infected grapefruit (Citrus
paradisi). Physiological Plant Pathology. 26:125-134
Agocs A., Nagy V., Szabò Z., Mark L., Ohmacht R. and Deli J. 2007. Comparative
Study on the Carotenoid Composition of the Peel and the Pulp of Different Citrus
Species. Innovative Food Science and Emerging Technologies. 8:390 – 394
Aguglia L., Carrillo F., Madau F.A. and Perito M.A. 2008. La Commercializzazione
degli Agrumi Freschi e Trasformati. INEA. I quaderni del progetto Piano
Agrumi. 3:3 – 50
Agustí M. 2009. Fisiologia dello sviluppo. In: Vacante V. and Calabrese F. Citrus.
Trattato di Agrumicoltura. EdAgricole. 73 – 84
Aishima T. 1991. Aroma discrimination by pattern recognition analysis responses from
semiconductor gas sensor. Journal of Agricultural Food Chemistry. 39:752 – 756
Allegrone G., Belliardo F. and Cabella P. 2006. Comparison of volatile concentrations in
hand-squeezed juices of four different lemon varieties. Journal of Agricultural
Food Chemistry. 54:1844 – 1848
Alós E., Cercós M., Rodrigo M.J., Zacariás L. and Talón M. 2006. Regulation of color
break in citrus fruits. Changes in pigment profiling and gene expression induced
by gibberellins and nitrate, two ripening retardants. Journal of Agricultural and
Food Chemistry. 54:4888 – 4895
Arctander S. 1969. Perfume and Flavor Chemicals. Arctander S. Montclair, NJ, Vols. I
and II
Artés-Hernandez F., Rivera-Cabrera F. and Kader A.A. 2007. Quality retention and
potential shelf-life of fresh-cut lemons as affected by cut type and temperature.
Postharvest Biology and Technology 43:245 – 254
Arthur C.L. and Pawliszyn J. 1990. Solid Phase Microextraction with thermal desorption
using fused silica optical fibers. Analytical Chemistry. 62:2145-2148
104
Avsian-Kretchmer O., Gueta-Dahan Y., Lev-Yadun S., Gollop R. and Ben-Hayyim G.
2004. The salt-stress signal transduction pathway that activates the gpx1
promoter is mediated by intracellular H2O2, different from the pathway induced
by extracellular H2O2. Plant Physiology. 135:1685 – 1696
Bain J.M. 1958. Morphological anatomical and physiological changes in the developing
fruit of the Valencia orange Citrus sinensis L. Osbeck. Australian Journal of
Botany. 6:1 – 24
Bajwa, B.E. and Anjum, F.M. 2007. Improving storage performance of Citrus reticulate
Blanco mandarins by controlling some physiological disorders. International
Journal of Food Science and Technology. 42:495-501
Baker R.A. 1994. Potential Dietary Benefits of Citrus Pectin and Fiber. Food
Technology. 48:133 – 139
Baldi S. 2011. GAIN (Global Agricultural Information Network) Report: Italian Citrus
Fruit Outlook 2011/2012. USDA Staff, Rome
Baldwin E.A., Nisperos-Carriedo M., Shaw P.E. and Burns J.K. 1995. Effect of coatings
and prolonged storage conditions on fresh orange flavor volatiles, degrees Brix,
and ascorbic acid levels. Journal of Agricultural and Food Chemistry. 43:1321 –
1331
Barbagallo R.N., Palmeri R., Fabiano S., Rapisarda P. and Spagna G. 2007.
Characteristic of β-Glucosidase from Sicilian Blood Oranges in Relation to
Anthocyanin Degradation. Enzyme and Microbial Technology. 41:570 – 575
Barmore C.R. and Brown G.E. 1985. Influence of ethylene on increased susceptibility of
oranges to Diplodia natalensis. Plant Disease. 69:228 – 230
Barrueta L.A., Alonso.Salces R.M. and Héberger K. 2007. Supervised pattern
recognition in food analysis. Journal of Chromatography A. 1158:196 – 214
Batista B.L., da Silva L.R.S., Rocha B.A., Rodrigues J.L, Beretta-Silva A.A., Bonates
T.O., Gomes V.S.D., Barbosa R.M. and Barbosa F. 2012. Multi-element
determination in Brazilian honey samples by inductively coupled plasma mass
spectrometry and estimation of geographic origin with data mining techniques.
Food Research International. 49:209 – 215
Bazemore R. 2011. Sample preparation. In: Practical analysis of flavor and fragrance
materials. First Edition. Goodner K. and Rouseff R. (Eds). Blackwell publishing
Ltd.

105
Belitz H.D., Grosch W. and Schierberle P. 2009. Food Chemistry. Springer; Washington,
D.C.
Benavente-García O. and Castillo J. 2008. Update on uses and properties of citrus
flavonoids: new findings in anticancer, cardiovascular, and anti-inflammatory
activity. Journal of Agricultural and Food Chemistry. 56(15):6185 – 6205
Benedetti S., Mannino S., Sabatini G. and Marcazzan G.L. 2004. Electronic nose and
neural network use for the classification of honey. Apidologie. 35:1 – 6
Ben-Yehoshua S. 1969. Gas exchange, transpiration, and the commercial deterioration in
storage of orange fruit. Journal of American Society of Horticultural Science. 94:
524 – 528
Ben-Yehoshua S., Shapiro B, and Moran R. 1987. Individual seal packing enables the
use of curing at high temperatures to reduce decay and heal injury of citrus fruits.
Horticultural Science 22:777 – 783
Berger R.G. 2007. Flavors and Fragrances. Chemistry, bioprocessing and sustainability.
Berger R.G. (ed) Springer
Bermejo A. and Cano A. 2012. Analysis of nutritional constituents in twenty citrus
cultivars from the Mediterranean area at different stages of ripening. Food and
Nutritional Sciences. 3:639 – 650
Biale J.B. 1961. Postharvest physiology and chemistry. In. Sinclair W. (Ed), The orange.
Its biochemistry and physiology. University of California, Riverside, CA. 96 –
130
Biolatto A., Vasquez D.E., Sancho A.M., Carduza F.J. and Pensel N.A. 2005. Effect of
commercial conditioning and cold quarantine storage treatments on fruit of ‘La
Toma’ grapefruit (Citrus paradisi Macf.). Postharvest Biology and Technology.
35:167 – 176
Block R.J. and Bolling D. 1944. Nutritional Opportunities with Amino Acids. Journal of
American Diet Association. 20:69 – 76
Breitmaier E. 2007. Terpenes. Flavors, Fragrances, Pharmaca, Pheromones. Wiley –
VCH publication. ISBN- 3-527-31786-4
Brown G.E. and Chambers M. 1996. Evaluation of biological products for the control of
postharvest disease of Florida citrus. Proceedings of the Florida State
Horticultural Society. 109: 278 – 282
Bruckner B. 2008. Fruit and Vegetable Flavor: Recent Advances and Future Prospects.
Woodhead Publishing Limited: Abington Hall, Cambridge, UK

106
Bruemmer J.H. 1975. Aroma substances of citrus fruits and their biogenesis. In
Symposium on Fragrance and Flavour Sustances. Drawert F. (Ed) Verlag Hans
Carl: Nurnberg, Germany. 167 – 176
Buettner, A. and Schierberle, P. 1999. Identification of the most odor-active volatiles in
fresh hand squeezed juice of grapefruit (Citrus paradisi Macfadyen). Journal of
Agricultural and Food Chemistry. 47:5189 – 5193
Burdock G.A., Carabin I.G and Griffiths J.C. 2006. The importance of GRAS to the
functional food and nutraceutical industries. Toxicology. 221:17 – 27
Burke J.H. 1962. Citrus Industry if Italy. Foreign Agricultural Reports. 59
Calabrese F. 2009. Principali paesi produttori e destinazione del prodotto. In: Vacante V.
and Calabrese F. Citrus. Trattato di Agrumicoltura. EdAgricole. 17 – 26
Calabrese F. and Barone F. 2009. Limone e Limone-simili. In: Vacante V. and Calabrese
F. 2009. Citrus. Trattato di Agrumicoltura. EdAgricole. 85 – 93
Campagnoli A., Cheli F., Savoini G., Crotti A., Pastori A.G.M. and Dell’Orto V. 2009.
Application of an electronic nose to detection of aflatoxins in corm. Vet. Res.
Commun. 10: 9179 – 9193
Carvalho C.P., Salvador A., Navarro P., Monterde A. and Martinez-Javega J.M. 2008.
Effect of auxin treatments on calyx senescence in the degreening of four
mandarin cultivars. HortScience. 43:747 – 752
Chalutz, E., Waks, J. and Schiffmann-Nadel, M. 1985. Comparison of the response of
different citrus fruit cultivars to storage temperature. Scientia Horticulturae,
25:271 – 277
Chaudhary, P.R., Jayaprakasha, G.K., Patil, B.S. and Porat, R. 2012. Grapefruit
degreening influence on health promoting limonoids and flavonoids. Acta
Horticolturae (ISHS). 939:113-120
Cheli F., Campagnoli A., Pinotti L., Savoini G. and Dell’Orto V. 2009. Electronic nose
for determination of aflatoxins in maize. Biotechnology Agronomy Society. S273
– S275
Christie P.J., Alfenito M.R. and Walbot V. 1994. Impact of low temperature stress on
general phenylpropanoid and anthocyanin pathways: enhancement of transcript
abundance and anthocyanin pigmentation in maize seedlings. Planta. 194:541 –
549

107
CLAM (Comité de Liaison de l’Agrumiculture Méditerranéenne) (2007). Les
exportations d’agrumes du basin Méditerranéen. Statistiques, evaluations,
repartitions, situation 2006-2007
Clegg, K.M. and Morton, A.D. 1968. The phenolic compounds of blackcurrant juice and
their protective effect on ascorbic acid. International Journal of Food Science &
Technology. 3: 277–284.
Clements R.L. 1964. Organic Acids in Citrus Fruits. I. Varietal differences. Journal of
Food Science. 29:276 - 280
Cohen E. Shalom Y. and Rosenburger I. 1990. Postharvest ethanol buildup and off-
flavor in ‘Murcott’ tangerine fruits. Journal of the American Society for
Horticultural Science. 115:775 – 778
Costa, R., Dugo, P., Dugo, G. and Mondello, L. 2010. Headspace enrichment of
bergamot and mandarin juices by means of Monolithic Material Sorptive
Extraction (MMSE). 34th ISCC. Riva del Garda.
Cozzi R., Protti P. and Ruaro T. 1998. Elementi di analisi chimica strumentale.
Zanichelli Editore S.p.A.
Cupane M., Guarrasi V., Palazzolo E., San Biagio P.L. and M.A. Germanà. 2012.
Characterization of Fruits of Four Different Lemon Cultivars, Collected in the
Northern Coast of Sicily. Acta Horticolturae, in press. Proceedings of
International Citrus Congress – Valencia 2012.
Davey M.W., Van Montagu M., Inza D., Sanmartin M., Kanellis A., Smirnoff N., Benzie
I.J.J., Strain J.J., Favell D. and Fletcher J. 2000. Plant L-ascorbic acid:
Chemistry, function, metabolism bioavailability and effects of processing.
Journal of the Science of Food and Agriculture. 80:825 – 860
De Rovira D. 2008. Dictionary of flavor. Wiley-Blackwell publication. ISBN-13:978-0-
8138-2135-1
Del Caro A., Piga A., Vacca V. and Agabbio M. 2004. Changes of flavonoids, vitamin C
and antioxidant capacity in minimally processed citrus segments and juices
during storage. Food Chemistry. 84:99–105.
Del Cueto Belchi A., Rothpfeffer N., Pelegrí-Sebastia J., Chilo J., Garcia Rodriguez D.
and Sogorb T. 2013. Sensor characterization for multisensor odor-discrimination
system. Sensors and Actuators A. 191:68 – 71
108
Del Rio J.A., Fuster M.D., Gómez P., Porras I., García-Lidón A. and Ortuño A. 2004.
Citrus lemon: a source of flavonoids of pharmaceutical interest. Food Chemistry.
84:457 – 461
Del Rio M.A., Cuquerella J., and Ragone M.L. 1992. Effects of postharvest curing at
high temperature on decay and quality of Marsh grapefruit and Navel oranges. In:
Proceedings of the International Society of Citriculture, 7th Int. Citrus Congress.
Del Río M.A., Martínez-Jávega J.M., Navarro P. and Cuqurella J. 1999. Recubrimientos
para la comercializacíon de frutos cítricos. Tendencias actuales. Levant Agrícola.
348:301 – 311
Dharmawan J. 2008. Characterization of volatile compounds in selected Citrus fruits
from Asia. Doctoral thesis, National University of Singapore.
Dharmawan J., Kasapis S., Curran P. and Johnson J.R. 2007. Characterization of volatile
compounds in selected citrus fruits from Asia. Part I: freshly-squeezed juice.
Flavor and Fragrances Journal. 22:228–232.
Eaks, I.L. 1970. Respiratory response ethylene production and response to ethylene of
citrus fruits during ontogeny. Plant Physiology. 45:334 – 338
Eaks, I.L. 1980. Effect of chilling on respiration and volatiles of California lemon fruit.
Plant Physiology, 105:865-869
Echeverria E. and Valich J. 1989. Enzymes of sugar and acid metabolism in stored
Valencia oranges. Journal of the American Society for Horticultural Science.
114:445 – 449
El Hadi M.A.M., Zhang F.J., Wu F.F., Zhou C.H. and Tao J. 2013. Advances in fruit
aroma volatile research. Molecules. 18:8200 – 8229
Evenson, K., Bausher, M.G. and Biggs, R.H. 1981. Wound-induced ethylene production
in peel ex-plants of 'Valencia' orange fruit. HortScience. 16:43-44
Fallik E. 2004. Prestorage hot water treatments (immersion, rising and brushing).
Postharvest Biology and Technology. 32:125 – 134
Fernandez M.L., Sun D.M., Tosca M.A. and McNamara D.J. 1994. Citrus Pectin and
Cholesterol Interact to regulate hepatic cholesterol homeostasis and lipoprotein
Metabolism: a dose-response study in guinea pigs. American Journal of Clinical
Nutrition. 59:869 – 878
Gadjeva V., Kuchukova D. and Georgieva R. 2005. Vitamin combinations reduce
oxidative stress and improve antioxidant status in patients with iron deficiency
anemia. Comparative Clinical Pathology. 14:99 – 104

109
Gardner J.W. and Bartlett P.N. 1999. Electronic Noses. Principles and
Applications. Oxford University Press; Oxford, UK
Gardner P.T., White T.A.C. McPhail D.B. and Duthie G.G. 2000. The relative
contributions of vitamin C, carotenoids and phenolics to the antioxidant potential
of fruit juices. Food Chemistry. 68:471 – 474
Gattuso G., Barreca D., Gargiulli C., Leuzzi U. and Caristi C. 2007. Flavonoid
Composition of Citrus Juices. Molecules. 12: 1641 – 1673
Gey K.F., Stähelin H.B. and Eichholzer M. 1993. Poor plasma status of carotene and
vitamin C is associated with higher mortality from ischemic heart disease and
stroke: Basel Prospective Study. Journal of Clinical Investigation. 71:3-6
Goldschmidt E.E., Huberman M. and Goren R. 1993. Probing the role of endogenous
ethylene in the degreening of citrus fruit with ethylene antagonists. Plant Growth
Regulation. 12:325 – 329
González-Mas M.C., Rambla J.L., Alamar M.C., Gutiérrez A. and Granell A. 2011.
Comparative Analysis of the Volatile Fraction of Fruit Juice from Different
Citrus Species. PLos ONE 6:e22016. (doi: 10.1371/journal.pone.0022016)
González-Molina E., Domínguez-Perles R., Moreno D.A. and García-Viguera C. 2010.
Natural Bioactive Compounds of Citrus limon for Food and Health. Journal of
Pharmaceutical and Biomedical Analysis. 51:327 – 345
Goodner K. and Manthey J.A. 2005. Differentiating orange juice using fourier transform
infrared spectroscopy (FT-IR). Proceeding of Florida State Horticultural Society.
118:410 – 413
Goodner K.L., Rouseff R.L. and Hofsommer H.J. 2001. Orange, mandarin and hybrid
classification using multivariate statistics based on carotenoid profiles. Journal of
Agricultural and Food Chemistry. 49:1146 – 1150
Gorinstein S., Huang D., Leontowicz H., Yamamoto K., Soliva-Fortuny R., Martin
Belloso O., Martinez Ayala A. and Trakhtenberg S. 2006. Determination of
naringin and hesperidin in citrus fruit by high-performance liquid
chromatography. The antioxidant potential of citrus fruit. Acta
Chromatographica. No. 17
Gorinstein S., Martin-Belloso O., Park Y.S., Haruen it R., Lo e A., M., Caspi A.,
Libman I. and Trakhtenberg S. 2001. Comparison if Some Biochemical
Characteristics of Different Citrus Fruits. Food Chemistry. 74:309 – 315

110
Guthrie H.A., Picciano M.F. and Scott A. 1995. Human Nutrition . St. Louis, Miss.
Mosby
Hagenmaier R. and Goodner K. 2002. Storage of ‘Marsh’ grapefruit and ‘Valencia’
oranges with different coatings. Proceedings of the Florida State Horticultural
Society. 115:303 – 308
Hagenmaier R.D. 2000. Evaluation of a plyethylene-candelilla coating for ‘Valencia’
oranges. Postharvest Biology and Technology. 1:147 – 154
Hagenmaier R.D. 2002. The flavor of mandarin hybrids with different coatings.
Postharvest Biology and Technology. 24:79 – 87
Hagenmaier R.D. and Baker R.A. 1993. Cleaning method affects shrinkage rate of citrus
fruits. HortScience. 28:824 – 825
Hagenmaier R.D. and Baker R.A. 1993. Reduction on gas exchange of citrus fruit by
wax coatings. Journal of Agricultural and Food Chemistry. 41:283 – 287
Hagenmaier R.D. and Baker R.A. 1996. Internal gases, ethanol content and gloss of
citrus coated with polyethylene wax, carnauba wax, shellac or resin at different
application levels. Proceedings of the Florida State Horticultural Society.
107:261 – 265
Hagenmaier R.D. and Shaw P.E. 2002. Changes in volatile components of stored
tangerines and other specialty citrus fruits with different coatings. Journal of
Food Science. 67:1742 – 1745
Hagenmaier R.D., Goodner K., Rousseff R. and Dou H. 2002. Storage of ‘Marsh’
grapefruit and ‘Valencia’ oranges with different coatings. Proceedings of the
Florida State Horticultural Society. 115:303 – 308
Halliwell B. 1996. Antioxidants: The Basics-what are and how to Evaluate them.
Advances in Pharmacology. 38:3 – 20
Harker F.R., Marsh K.B., Young H., Murray S.H., Gunson F.A. and Walker S.B. 2002.
Sensory interpretation of instrumental measurements 2: sweet and acid taste of
apple fruit. Postharvest Biology Biology and Technology. 24:241 – 250
Harmon A.D. 2002. Solid Phase Micro Extraction for the analysis of aromas and
flavours. In: Marsili R. (ed). Flavour, Fragrance and Odor Analysis. New York:
Marcel Dekker, Inc. 75 – 106
Henriod R.E., Gibberd M.R. and Treeby M.T. 2005. Storage temperature effects on
moisture loss and the development of chilling injury in Lanes Late navel orange.
Australian Journal of Experimental Agriculture. 45:453 – 458

111
Hernández Gómez A., Wang J., Hu G. and García Pereira A. 2007. Discrimination of
storage shelf-life for mandarin by electronic nose technique. LWT - Food
Science and Technology. 40:681 – 689
Hill E.C., Attaway J.A. and Streiff R.R. 1971. Folic-acid – an essential vitamin present
in citrus fruit. Proceedings of the Florida State Horticultural Society. 84:238 –
241
Hirsch A.R., Carle R. and Neidhart S. 2012. Validation and applicability of a
standardized procedure for evaluating freshness of Citrus juices based on pectin
methylesterase activity quantitation. Journal of Applied Botany and Food
Quality. 85:6 – 16
Hodgson R.W. 1967. Horticultural Varieties of Citrus. In: Reuther W.; Webber H.J. and
Batchelor L.D. 1967. The Citrus Industry. Vol I: History World Distribution
Botany and Varieties. University of California Press. Division of Agricultural
Sciences (Eds)
Holden J.M., Elridge A.L., Beecher G.R., Buzzard I.M., Bhagwat S., Davis C.S.,
Douglass L.W., Gebhardt S., Haytowitz D. and Schakel S. 1999. Carotenoid
content of U.S. food: an update of the database. Journal of Food Composition and
Analysis. 12:169 – 196
Hong S.I., Lee H.H. and Kim D. 2007. Effects of hot water treatment on the storage
stability of Satsuma mandarin as a postharvest decay control. Postharvest
Biology and Technology. 43:271 – 279
Horvath G., Chilo J. and Lindblad T. 2010. Different volatile signals emitted by human
ovarian carcinoma and healthy tissue. Future Medicine. 6(6):1043 – 1049
http://www.colturaecultura.it/agrumi
Huang R., Xia R., Lu Y., Hu L. and Xu Y. 2008. Effect of pre-harvest salicilyc acid
spray treatment on post-harvest antioxidant in the pulp and peel of ‘Cara Cara’
navel orange (Citrus sinensis L. Osbeck). Journal of the Science of Food and
Agriculture. 88:229 – 236
Iglesias, J.D., Cercós, M., Colmenero-Flores, J.M., Naranjo, M.A., Ríos, G., Carrera, E.,
Ruiz-Rivero, O., Lliso, I., Morillon, R., Tadeo, F.R. and Talón, M. 2007.
Physiology of citrus fruiting. Brazilian Journal of Plant Physiology. 19:333-362
ISMEA. 2013. Superfici investite ad Agrumi in Italia.
112
Izquierdo L and Sendra JM. 1993. Citrus Fruits: Composition and Characterization. In:
Macrae R, Robinson RK and Sadler MJ. Encyclopaedia of Food Science, Food
Technology and Nutrition. London; San Diego: Academic Press. p. 999-1006
Jacob R., Hasegawa S. and Manners G. 2000. The potential of Citrus Limonoids as
Anticancer Agents. Perishables Handling Quarterly Issue. 102:6 – 8
Jönsson J.A. 1987. Chromatographyc Theory and Basic Principles. Marcel Dekker, Inc.
CRC press
Kader A.A. and Arpaia M.L. 2002. Postharvest handling systems: subtropical fruits. In
Kader A.A. (Ed). Postharvest technology of horticultural crops. University of
California, Publication. 3311:375-378
Kalt W., Forney C.F., Martin A. and Prior R. 1999. Antioxidant capacity, vitamin C,
phenolics, and anthocyanins after fresh storage of small fruits. Journal of
Agricultural Food Chemistry. 47:4638 – 4644
Karasec F.W. and Clement R.E. 1988. Basic Gas Chromatography-Mass Spectrometry:
Principle and techniques. Elsevier Science B.V. 5 – 40
Kato M. Ikoma Y., Matsumoro H., Sugiura M., Hyodo H. and Yano M. 2004.
Accumulation of caroteniods and expression of carotenoid biosynthetic genes
during maturation in citrus fruit. Plant Physiology. 134:824 – 837
Katz E., Lagunes P.M., Riov J., Weiss D. and Goldschmidt E.E. 2004. Molecular and
physiological evidence suggests the existence of a system II-like pathway of
ethylene production in non-climacteric Citrus fruit. Planta. 219:243 – 252
Kays S.J. and Paull R.E. 2004. Secondary metabolic processes and products. Postharvest
Biology. Exon Press, Athens, GA, USA. 137 – 232
Kefford JF. 1966. Citrus Fruits and Processed Citrus Products in Human Nutrition.
World review of nutrition and dietetics. 6:197-249
Kelebek H. and Selli S. 2011. Determination of volatile, phenolic, organic acid and sugar
components in a Turkish cv. Dortyol (Citrus sinensis L. Osbeck) orange juice.
Journal of the Science of Food and Agriculture. 91:1855 – 1862
Kertesz Z.I. 1951. The Pectic Substances. Interscience Publishers. New York
Klimczak I., Malecka M., Szlachta M. and Gliszczynska-Swiglo A. 2007. Effect of
storage on the content of polyphenols, vitamin C and the antioxidant activity of
orange juices. Journal of Food Composition and Analysis. 20:313–322

113
Kollmannsberger H. and Nitz S. 2007. Advanced instrumental analysis and Electronic
Noses. In: Flavours and Fragrances. Chemistry, bioprocessing and sustainability.
Berger R.G. (ed) Springer
Kumari S., Sarmah N. and Handique A.K. 2013. Antioxidant activities of the unripe and
ripen Citrus aurantifolia of Assan. International journal of innovative research in
science, engineering and technology. 2(9):4811 – 4816
Ladaniya M.S. and Singh S. 2001. Tray over-wrapping of ‘Mosambi’ sweet orange.
Journal of Food Science. 38(4):362 – 365
Ladaniya M.S. and Singh S. 2001. Use of ethylene gas for degreening of sweet oranges
(Citrus sinensis Osbeck) cv Mosambi. Journal of Scientific and Industrial
Research. 60:662 – 667
Larrauri J.A., Goñi I., Martin-Carron N., Ruperez P. and Saura-Calixto F. 1996.
Measurement of Health-Promoting Properties in Fruit Dietary Fibers:
Antioxidant Capacity, Fermentability and Glucose Retardation Index. Journal of
the Science of Food and Agriculture. 71:515 – 519
Lebrun M., Plotto A., Goodner K., Ducamp M.N. and Baldwin E. 2008. Discrimination
of mango fruit maturity by volatiles using the electronic nose and gas
chromatography. Postharvest Biology and Technology. 48:122 – 131
Lee S.K. and Kader A.A. 2000. Preharvest and Postharvest factors Influencing Vitamin
C content of Horticultural Crops. Postharvest Biology and Technology. 33:847 -
855
Leo A., Hansch C., and Elkins D. 1971. Partition Coefficients and their Uses. Chemical
Reviews. 71(6): 525 – 616
Lime B.J., Stephens T.S. and Griffiths F.P. 1954. Processing characteristics of colored
Texas grapefruit. I. Color and maturity studies of ruby red grapefruit. Food
Technology. 8:566 – 569
Lin J., Rexrode K., Hu F., Albert C.M., Chae C.U., Rimm E.B., Stampfer M.J. and
Manson J.E. 2007. Dietary intake of flavonols and flavones and coronary heart
disease in US women. American Journal of Epidemiology. 165:1305 – 1313
Liu Y.Q., Heying E. and Tanumihardjo A. 2012. History, Global Distribution, and
Nutritional Importance of Citrus Fruits. Comprehensive review in Food Science
and Food Saefty. 11:530 – 545

114
Lorente J., Vegara S., Martí N., Ibarz A., Coll L., Hernández J., Valero M. and Saura D.
2014. Chemical guide parameters for Spanish lemon (Citrus limon (L.) Burm.)
juices. Food Chemistry 162:186 – 191
Lötters J., Olthius W., Veltink P.H. and Bergveld P. 1997. The mechanical properties of
the rubber elastic polymer polydimethylsiloxane for sensor applications. Journal
of Micromechanics and Microengineering. 7(3):145 – 147
Luebke, W. The Good Scents Company. 1983
Luebke, W. The Good Scents Company. 1989
Luebke, W. The Good Scents Company. 1993
Manach C., Scalbert A., Morand C., Remesy C. and Jimenez C. 2004. Bioavailability
and bioefficacy of polyphenols in humans. American Journal of Clinical
Nutrition. 79:727 – 747
Manheim C.H. and Soffert T. 1996. Permeability of different wax coatings and their
effect on citrus fruit quality. Journal of Agricultural and Food Chemistry. 44:919
– 923
Marcilla A., Martínez M., Carot J.M., Palou L. and del Río M.A. 2009. Relationship
between sensory and physico-chemical quality parameters of cold stored
‘Clemenules’ mandarins coated with two commercial waxes. Spanish Journal of
Agricultural Research. 7(1):181 – 189
Marcilla A., Zarzo M. and del Río M.A. 2006. Effect of storage temperature on the
flavour of citrus fruit. Spanish Journal of Agricultural Research. 4:336–344
Martínez Jávega J.M., Cuqurella J., Mateos M. and. Del Río M.A. 1991. Coating
treatments in postharvest behavior of oranges. IFF-IR Commission C2, D1, D2/3.
Technical Innovation in Freezing of Fruit and Vegetables. Davis, California,
USA. 249 – 253
Martínez-Jáveca J.M., Cuquerella L., Mateos M. Del Río M.A. 1991. Coatings
treatments in postharvest behavior of oranges. IFF-IIR Commission C2, D1,
D2/3. Proc. Technical Innovations in Freezing of Fruit and Vegetables. Davis,
California, USA. 51 – 55
Martinez-Romero D., Valero D., Serrano M., Martinez-Sanchez F. and Riquelme F.
1999. Effects of post-harvest putrescine and calcium treatments on reducing
mechanical damage and polyamines and abscisic acid levels during lemon
storage. Journal of the Science of Food and Agriculture. 79:1589–1595

115
Martín-Hernández M.C. and Juárez M. 1993. In: Macrae R., Robinson R.K. and Sadler
M.J. Encyclopaedia of Food Science, Food Technology and Nutrition. London;
San Diego: Academic Press. 968 – 972
Matsui K. 2006. Green leaf volatiles: Hydroperoxide lyase pathway of oxylipin
metabolism. Current Opinions on Plant Biology. 9:274 – 280
Mayuoni L., Tietel Z., Patil B.S. and Portat R. 2011. Does ethylene degreening affect
internal quality of citrus fruit? Postharvest Biology and Technology. 62:50 – 58
McCollum, T.G. and McDonald, R.E. 1991. Electrolyte leakage, respiration, and
ethylene as indices of chilling injury in grapefruit. HortScience. 26:1191 - 1192
Merken H.M. and Beecher G.R. 2000. Measurement of Food Flavonoids by High-
Performance Liquid Chromatography: A Review. Journal of Agricultural and
Food Chemistry. 48:577 – 599
Miller E.G., Porter J.L., Binnie W.H., Guo I.Y. and Hasegawa S. 2004. Further Studies
on the Anticancer Activity of Citrus Limonoids. Journal of Agricultural and Food
Chemistry. 52:4908 – 4912
Mohammadian M.A., Mobrami Z. and Sajedi R.H. 2011. Bioactive compounds and
antioxidant capacities in the flavedo tissue of two citrus cultivars under low
temperature. Brazilian Journal of Plant Physiology. 3:203 – 208
Mosciano G. 1993. Perfumer & Flavorist. 18 No. 2(38)
Mosciano, G. 1985. Perfumer & Flavorist. 15 No. 2(69)
Mosciano, G. 1994. Perfumer & Flavorist. 19 No. 3(51)
Mosciano, G. 1996. Perfumer & Flavorist. 21 No. 1(33)
Mosciano, G. 1997. Perfumer & Flavorist. 22 No. 6(41)
Mosciano, G. 2001. Perfumer & Flavorist. 26 No. 3(80)
Moshonas M.G. and Shaw P.E. 1997. Quantitation of volatile constituents in mandarin
juices and its use for comparison with orange juices by multivariate analysis.
Journal of Agricultural and Food Chemistry. 45:3968 – 3972
Moufida S. and Marzouk B. 2003. Biochemical Characterization of Blood Orange,
Sweet Orange, Lemon, Bergamot and Bitter Orange. Phytochemistry. 62:1283 –
1289
Mozafar A. 1993. Nitrogen Fertilizers and the Amount of Vitamins in Plants: a review.
Journal of Plant Nutrition. 16:2479 – 2506

116
Mullins E.D., McCollum T.G., and McDonald R.E. 2000. Consequences on ethylene
metabolism of inactivating the ethylene receptor sites in diseased non-climacteric
fruit. Postharvest Biology and Technology. 19:155-164
Nagy S. and Shaw P.E. 1990. Factors Affecting Flavor of Citrus Fruit. In: Morton I.D.
and MacLeod A.J. (Eds.). Food Flavors, Part C, The Flavor of Fruits, Elsevier,
New York, 93 – 124
Nagy S., Nordby H.E. and Smoot J.M. 1978. Changing Lipid Class Patterns during
Maturation of Sweet Oranges. Journal of Agricultural and Food Chemistry.
26:838 – 842
Narisawa T., Fukaura Y., Oshima S. Inakuma T, Yano M. and Nishino H. 1999.
Chemoprevention by the oxygenated carotenoid beta-cryptoxanthin of N-
methylnitrosourea-induced colon carcinogenesis in F344 rats. Japanese Journal of
Cancer Research. 90:1061 – 1065
Navarro J.M., Perez-Perez J.G., Roero P. and Botia P. 2010. Analysis of the changes in
quality in mandrin fruit, produced by deficit irrigation treatments. Food
Chemistry. 119:1591 – 1596
Nicolosi-Asmundo C., Cataldi-Lupo C.M., Campisi S. and Russo C. 1987. Lipids in
Citrus Fruit Juice. 1. Lipid Content during Orange Ripening in Eastern Sicily.
Journal of Agricultural and Food Chemistry. 35:1023 – 1027
Nisperos-Carriedo M.O., Shaw P.E. and Baldwin E.A. 1990. Changes in volatile flavor
components of pineapple orange as influenced by the application of lipid and
composite films. Journal of Agricultural and Food Chemistry. 38:1328 – 1387
Nordby E. and Nagy S. 1971. Fatty acid profile of orange and tangor juice sac lipids.
Phytochemistry. 10:615 – 619
Nordby E. and Nagy S. 1974. Fatty acid composition of sterol esters from Citrus
sinensis, C. paradisi, C. limon, C. aurantifolia and C. limettoides Sacs.
Phytochemistry. 13:443 – 452
Nordby H.E. and Nagy S. 1971. Comparative Citrus Fatty Acid Profile of Triglycerides,
Monogalactosyl Diglycerides, Steryl Esters and Esterified Steryl Glucosides.
Lipids. 6(8):554 – 561
Norman S. and Craft C.C. 1968. Effects of ethylene on production of volatiles by
lemons. HortScience. 3:66 – 67
Obenland D., Collin S., Mackey B., Sievert J. and Arpaia M.L. 2011. Storage
temperature and time influences sensory quality of mandarins by altering soluble

117
solids, acidity and aroma volatile composition. Postharvest Biology and
Technology. 59:187–193
Obenland D., Collin S., Sievert J., Fjeld K., Doctor J. and Arpaia M.L. 2008.
Commercial packing and storage of navel oranges alters aroma volatiles and
reduces flavor quality. Postharvest Biology and Technology. 47:159 – 167
Obenland D., Collins S., Mackey B., Sievert J., Fjeld K. and Arpaia M.L. 2009.
Determinants of flavor acceptability during the maturation of navel oranges.
Postharvest Biology and Technology. 52:156 – 163
Olarte O., Chilo J., Pelegrí-Sebastia J., Barbé K. and Van Moer W. 2013. Glucose
detection in human sweat using an Electronic Nose. Annual International
Conference of the IEEE EMBS
Ortuño A., Reynaldo I., Fuster M.D., Botía J., Puig D.G., Sabater F., García-Lidón A.,
Porras I. and Del Rio J.A. 1997. Citrus cultivars with high flavonoid contents in
the fruits. Scientia Horticulturae. 68:231 – 236
Ozdemir A.E. and Dundar O. 2006. The effects of Fungicide and Hot Water Treatments
on the Internal Quality Parameters of Valencia Oranges. Asian Journal of Plant
Science. 5:142 – 146
Patil T.R. and Sherekar S.S. 2013. Performance analysis of Naïve Bayes and J48
classification algorithm for data classification. International Journal of Computer
Science and Applications. 6(2):256 – 261
Pawliszyn J. 1999. Quantitative Aspects of SPME. In: Pawliszny J. (ed). Applications of
Solid Phase Micro Extraction. Cambridge: The Royal Society of Chemistry. 3 –
21
Pawliszyn J. 2001. Solid Phase Micro Extraction. In: Rouseff R.L. and Cadwallader
K.R. (eds). Headspace analysis of Food and Flavors: Theory and Practice. New
York: Kluwer Academic/Plenum Publishers. 73 – 87
Pawliszyn, J. 1997. Solid Phase Microextraction: Theory and Practice. Publisher: VCH,
New York, N. Y.
Pennycooke J.C., Vepachedu R., Stushnoff C. and Jones M.L. 2004. Expression of an α-
galactosidase gene in petunia is up-regulated during low temperature
deacclimation. Journal of the American Society for Horticultural Science.
129:491 – 496

118
Pereira M.E., Sargent S.A. and Berry A.D. 2009. Use of an Electronic nose to classify
avocado pulp by maturity stage. Proceedings of the Florida State Horticultural
Society. 122:334 – 337
Pérez A.G., Luaces P. Oliva J., Ríos J.J. and Sanz C. 2005. Changes in vitamin C and
flavor components of mandarin juice due to curing of fruits. Food Chemistry.
91:19 – 24
Perez–Cacho P.R. and Rouseff R.L. 2008a. Fresh squeezed orange juice odor: a review.
Critical Reviews in Food Science and Nutrition. 48:681–695
Perez–Cacho P.R. and Rouseff R.L. 2008b. Processing and storage effects on orange
juice aroma: a review. Journal of Agricultural and Food Chemistry. 56:9785 –
9796
Pérez-Gago M.B., Rojas C. and del Rio M.A. 2002. Effect of lipid type and amount of
edible hydroxypropyl methylcellulose-lipid composite coatings used to protect
postharvest quality of mandarins cv. Fortune. Journal of Food Science. 8:2903 –
2910
Pergola M., D’Amico M., Celano G., Palese A.M., Scuderi A., Di Vita G., Pappalardo
G. and Inglese P. 2013. Sustainability evaluation of Sicily’s lemon and orange
production: An energy, economic and environmental analysis. Journal of
Environmental Management. 128:674 – 682
Peterson J.J., Beecher G.R., Bhagwat S.A., Dwyer J.T., Gebhardt S.E., Haytowitz D.B.
and Holden J.M. 2006. Flavanones in Grapefruit, Lemons, and Limes: A
Compilation and Review of the Data from the Analytical Literature. Journal of
Food Composition and Analysis. 19:S74 – S80
Petracek P.D., Kelsey D.F. and Davis C. 1998. Response of citrus to high-pressure
washing. Journal of the American Society for Horticultural Science. 123:661 –
667
Porat R. 2008. Degreening of citrus fruits. Tree and Forestry Science and Biotechnology.
2:71 – 76
Porat R., Pavoncello D., Peretz J., Ben-Yehoshua S and Lurie S. 2000. Effects of various
heat treatments on the induction of cold tolerance and on the postharvest qualities
of ‘Star Ruby’ grapefruit. Postharvest Biology and Technology. 18:159 – 165
Qin Z., Pang X., Chen D., Cheng H., Hu X. and Wu J., 2013. Evaluation of Chinese tea
by electronic nose and gas chromatography-mass spectrometry: Correlation with

119
sensory properties and classification according to grade level. Food Research
International. 53:864 – 874
Ramana K.V.R., Govindarajan V.S. and Ranganna S. 1981. Citrus fruits-varieties,
chemistry, technology, and quality evaluation. Part I: Varieties, production,
handling, and storage. Critical Reviews in Food Science and Nutrition. 15:353 –
431
Rampersaud G.C. 2007. A comparison of nutrient density scores for 100% fruit juices.
Journal of Food Science. 72:S261 – 266
Ranganna S., Govindarajan V.S. and Ramana K.V.R. 1986. Citrus Fruits: Varieties,
Chemistry, Technology, and Quality Evaluation. Part II, Chemistry, Technology,
and Quality Evaluation. A. Chemistry. Critical Reviews in Food Science and
Nutrition 18:313-386
Rangkadilok N., Sitthimonchai S., Worsuttayangkurn L., Mahidol C., Ruchirawat M.
and Satayavivad J. 2007. Evaluation of free radical scavenging and antityrosinase
activities of standardized longan fruit extract. Food Chem Toxicol. 45:328–336
Rapisarda P. and Intelisiano S. 1996. Sample preparation for vitamin C analysis of
pigmented orange juices. Italian Journal of Food Science. 251 – 256
Rapisarda P., Bellomo S.E. and Intelesiano S. 2001. Storage temperature effects on
blood orange fruit quality. Journal of Agricultural and Food Chemistry. 49:3230
– 3235
Rapisarda P., Lo Bianco M., Pannuzzo P. and Timpanaro N. 2008. Effect of cold storage
on vitamin C, phenolics and antioxidant activity of five orange genotypes [Citrus
sinensis (L.) Osbeck]. Postharvest Biology and Technology. 49:348 – 354
Rapisarda P., Tomaino A., LoCascio R., Bonina F., DePasquale A. and Saija A. 1999.
Antioxidant effectiveness as influenced by phenolic content of fresh orange
juices. Journal of Agricultural and Food Chemistry. 47:4718 – 4723
Rasmussen G.K. 1963. Seasonal changes in organic acid content of Valencia orange fruit
in Florida. Journal of the American Society for Horticultural Science. 84:181 –
187
Reforgiato G., Recupero G., Russo G., Recupero S. and Di Vaio C. 2010. The culture of
lemon in Italy. VI Simposio Internaccional Citricola
Reid L.M., O’Donnel C.P. and Downey G. 2006. Recent technological advances for the
determination of food authenticity. Trends in Food Science and Technology.
17:344 – 353
120
Reineccius G.A. 2006. Isolation Techniques, General. In. Flavors - Chemistry,
Technology and Resources, R. Berger, Ed. Springer Verlag, Berlin.
Reinhard H., Sager F. and Zoller O. 2008. Citrus juice classification by SPME-GC-MS
and electronic nose measurements. Food Science and Technology. 41:1906 –
1912
Rekha C., Poornima G., Manasa M., Abhipsa V., Pavithra Devi J., Vijay Kumar H.T.
and Prashith Kekuda T.R. 2012. Ascorbic acid, total phenol content and
antioxidant activity of fresh juices of four ripe and unripe citrus fruits. Chemical
Science Transaction. 1(2):303 – 310
Rice-Evans C. A., Spencer J. P. E., Schroeter H. and Rechner A. R. 2000. Bioavailability
of flavonoids and potential bioactive forms in vivo. Drug Metabolism and Drug
Interaction. 17:291–310
Robards K. and Antolovich M. 1997. Analytical chemistry of fruit bioflavonoids. A
review. Analyst. 122:11R – 34R
Rodov V., Ben-Yehoshua S., Albagli R. and Fang D.Q. 1995. Reducing chilling injury
and decay of stored citrus fruit by hot water dips. Postharvest Biology and
Technology. 5:119 – 127
Rodrigo M.J. and Zacariás L. 2007. Effect of postharvest ethylene treatment on
carotenoid accumulation and the expression of carotenoid biosynthetic flavedo
orange (Citrus sinensis L. Osbeck) fruit. Postharvest Biology and Technology.
43:14 – 22
Rodrigo M.J., Marcos J.F. and Zacariás L. 2004. Biochemical and molecular analysis of
carotenoid biosynthesis in flavedo of orange (Citrus sinensis L. Osbeck) during
fruit development and maturation. Journal of Agricultural and Food Chemistry.
52:6724 – 6731
Rouseff R. and Goodner K. 2011. Traditional Flavor and Fragrance Analysis of Raw
Materials and Finished Products. In: Goodner K. and Rouseff R. (eds). Practical
Analysis of Flavor and Fragrance Materials. Blackwell Publishing Ltd. 45 – 68
Rouseff R. and Perez-Cacho P.R. 2007. Citrus flavor. In: Flavors and Fragrances.
Chemistry, bioprocessing and sustainability. R.G. Berger ed. Springer
Rouseff R.L and Nagy S. 1994. Health and Nutritional Benefits of Citrus Fruit
Components. Food Technology. 48:125 – 132
Rowe D.J., Ko S., Tom X.M., Silverstein S.J. and Richards D.W. 1999. Enhanced
Production of Mineralized Nodules and Collagenous Proteins In Vitro by

121
Calcium Ascorbate Supplemented With Vitamin C Metabolites. Journal of
Periodontology. 70:992 – 999
Saidani Tounsi M. and Marzouk B. 2003. Biochemical Characterization of Blood
Orange, Sweet Orange, Lemon, Bergamot and Bitter Orange. Phytochemistry.
62:1283 – 1289
Saidani Tounsi M., Wannes W.A., Ouerghemmi I., Jegham S., Njima Y.B., Hamdaoui
G., Zemni H. and Marzouk B. 2011. Juice Components and Antioxidant Capacity
of Four Tunisian Citrus Varieties. Journal of the Science of Food and
Agriculture. 91:142 – 151
Saltveit, M.E. 1999. Effect of ethylene on quality of fresh fruits and vegetables.
Postharvest Biology and Technology. 15:279-292
Sanz C., Olias J.M. and Perez A.G. 1997. Aroma biochemistry of fruits and vegetables.
In Phytochemistry of Fruit and Vegetables; Oxford University Press Inc.: New
York, NY, USA. 125–155
Saraoglu H.M. and Kocan M. 2010. Determination of blood glucose level-based breath
analysis by a quartz microbalance sensor array. Sensors Journal, IEEE. 10(1):
104 – 109
Sass-Kiss A, Toth-Markus M and Sass M. 2004. Chemical Composition of Citrus Fruits
(Orange, Lemon and Grapefruit) with Respect to Quality Control of Juice
Products. In: Shahidi F (ed). Nutraceutical Beverages: Chemistry, Nutrition, and
Health Effects. Washington DC: American Chemical Society. p. 24-34
Saura D., Marti N., Valero M., Gonzalez E., Carbonell A. and Laencina J. 2012.
Separation of aromatics compounds during the clarification of lemon juice by
cross-flow filtration. Industrial Crops and Products. 36:543–548
Scelte Varietali in Agrumicoltura. 2006. MiPAF
Schimmenti E. 2009. Lo scenario economico in Italia. In: Vacante V. and Calabrese F.
2009. Citrus. Trattato di Agrumicoltura. EdAgricole. 27 – 38
Schirra M. and D’Hallewin G. 1997. Storage performance of Fortune mandarins
following hot water dips. Postharvest Biology and Technology. 20:287 – 294
Schirra M., Angioni A., Cabras P., D’Aquino S. and Palma A. 2011. Effects of
Postharvest Hot Water and Hot Air Treatments on Storage Decay and Quality
Traits of Kumquat (Fortunella japonica Lour. Swingle, cv. Ovale) Fruit. Journal
of Agricultural Science and Technology B. 1:89 – 94

122
Schirra M., Cabras P., Angioni A., D’Hallewin G. and Pala M. 2002. Residue upta e and
storage responses of Tarocco oranges after preharvest thiabendazole and
postharvest heat treatment. Journal of Agricultural and Food Chemistry. 50:2293
– 2296
Schirra M., Cabras P., D’allewin G., Angioni A. and Garau V.L. 1998. Seasonal
susceptibility to chilling in ury of ‘Tarocco’ oranges as affected by hot water and
thiabendazole postharvest dip treatments. Journal of Agricultural and Food
Chemistry. 46:1177-1180.
Schirra M., D’Hallewin G., Ben-Yehoshua S. and Fallik E. 2000. Host pathogen
interaction modulated by heat treatment. Postharvest Biology and Technology.
21:71 – 85
Schirra M., Mulas M., Fadda A. and Cauli E. 2004. Cold quarantine responses of blood
oranges to postharvest hot water and hot air treatments. Postharvest Biology and
Technology. 31:191 – 200
Schröeder H. 2007. Protective mechanism of the Mediterranean diet in obesity and type
2 diabetes. Journal of Nutritional Biochemistry. 18(3):149 – 160
Schwab W., Davidovich-Rikanati, R. and Lewinsohn, E. 2008. Biosynthesis of plant-
derived flavor compounds. Plant Journal. 54:712–732
Sdiri S., Navarro P., Monterde A., Benabda J. and Salvador A. 2012. Effect of
postharvest degreening followed by a cold-quarantine treatment on vitamin C,
phenolic compounds and antioxidant activity of early-season citrus fruit.
Postharvest Biology and Technology. 65:13 – 21
Selli S., Cabaroglu T. and Canbas A. 2004. Volatile flavor components of orange juice
obtained from the cv. Kozan of Turkey. Journal of Food Composition and
Analysis. 17:789 – 796
Shaw P.E. 1979. Review of quantitative analyses of citrus essential oils. Journal of
Agricultural and Food Chemistry. 27:246 – 257
Shaw P.E., Moshonas M.G. and Pesis E. 1991. Changes during storage of oranges
pretreated with nitrogen, carbon dioxide and acetaldehyde in air. Journal of Food
Science. 56:469 – 474
Shaw P.E., Rouseff R.L., Goodner K.L., Bazemore R., Nordby H.E. and Widmer W.W.
2000. Comparison of headspace GC and electronic sensor techniques for
classification of processed orange juice. Academic Press LWT. 33(5):331 – 334

123
Shi J.X., Goldshmidt E.E., Goren R. and Porat R. 2007. Molecular, biochemical and
anatomical factors governing ethanol fermentation metabolism and accumulation
of off-flavors in mandarins and grapefruit. Postharvest Biology and Technology.
46:242 – 251
Shi J.X., Porat R., Goren R. and Goldschmidt E.E. 2005. Physiological responses of
‘Murcott’ mandarins and ‘Star Ruby’ grapefruit to anaerobic stress conditions
and their relation to fruit taste, quality and emission of off-flavor volatiles.
Postharvest Biology and Technology. 38:99 – 105
Shirey R. 1999. Sample prep made easy. SPME Newsletter Winter 1999/2000
Simon I., Bârsan N., Bauer M. and Weimar U. 2001. Micro machined metal oxide gas
sensors: opportunities to improve sensor performance. Sensors and Actuators B:
Chemical. 73:1 – 26
Smilanick J., Sorenson D., Mansour M., Aieyabei J. and Plaza P. 2003. Impact of a
Brief Postharvest Hot Water Drench Treatment on Decay, Fruit Appearance, and
Microbe Populations of Lemons and Oranges. HortTechnology. 13:333 – 338
Smilanick J.L., Mackev B.E., Reese R., Usall J., and Margosan D.A. 1997. Influence of
the concentration of soda ash, temperature, and immersion period in the control
of postharvest green mold in oranges. Plant Disease. 81:379 – 382
Soini H.A., Bruce K.E., Wiesler D., David F., Sandra P. and Novotny M.V. 2005. Stir
bar sorptive extraction: a new quantitative and comprehensive sampling
technique for determination of chemical signal profiles from biological media.
Journal of Chemical Ecology. 31:377 – 392
Sousa W.R., da Rocha C., Cardoso C.L., Silva D.H.S., Valnice M. and Zanoni B. 2004.
Determination of the Phenolic Antioxidants in Orange Juice by Voltammetric
Methods. Journal of Food Composition and Analysis. 17:619 – 633
Sparkman D.O., Penton Z. and Kitson F.G. 2011. Gas Chromatography and Mass
Spetrometry: a practical guide. Academic Press.
Steine C., Beaucousin F., Siv C. and Peiffer G. 2001. Potential of semiconductor sensor
arrays for the origin authentication of pure Valencia orange juices. Journal of
Agricultural and Food Chemistry. 49:3151 – 3160
Stewart I. 1977. Provitamin A and Carotenoid Content of Citrus Juices. Journal of
Agricultural and Food Chemistry. 25:1132 – 1137
Strike D.J., Meijerink M.G.H. and Koudelka-Hep M. 1999. Electronic-noses – A mini-
review. Fresenius Journal of Analytical Chemistry. 364:499 – 505
124
Stumpe M. and Feussner I. Formation of oxylipins by CYP74 enzymes. Phytochemistry
Reviews. 5: 347 – 357
Tang K.T., Chiu S.W., Pan C.H., Hsieh H.Y., Liang Y.S. and Liu S.C. 2010.
Development of a portable electronic nose system for the detection and
classification of fruity odors. Sensors. 10:9179 – 9193
Taylor A.J. and Hort J. 2004. Measuring proximal stimuli involved in flavor perception.
In: Flavor perception. Blackewell publishing. ISBN-1-4051-1627-7
Testoni A., Cazzola R., Ragozza L. and Lanza G. 1992. Storage behavior of orange
‘Valencia Late’ in rooms with ethylene removal. Proceedings International
Society of Citriculture. 3:1092 – 1094
Tietel Z., Lewinsohn E., Fallik E. and Porat R. 2012. Importance of storage temperatures
in maintaining flavor and quality of mandarins. Postharvest Biology and
Technology. 64:175 – 182
Tietel Z., Plotto A., Fallik E., Lewinshon E. and Porat R. 2011. Taste and aroma of fresh
and stored mandarins. Journal of Food Agricultural Science. 91:14 – 23
Tietel Z., Porat R., Weiss K. and Ulrich D. 2011. Identification of aroma-active
compounds in fresh and stored ‘Mor’ mandarins. International Journal of Food
Science and Technology. 46:2225–2231
Ting S.V. 1980. Nutrients and nutrition in citrus fruits. In: S. Nagy, G.A. Attaway,
editors. Citrus Nutrition and Quality. Washington DC: American Chemical
Society. 3 – 24
Ting S.V. and Attaway J.A. 1971. Citrus Fruits. In: Hulme AC, editor. The Biochemistry
of Fruits and their Products. London: Academic Press. 107 – 179
Ting S.V. and Deszyck E.J. 1958. The internal color and carotenoid pigments of Florida
red and pink grapefruit. Proceedings of the American Society for Horticultural
Science. 71:271 – 277
Tiwari B.K, O’Donnel C.P., Muthu umarappam K. and Cullen P.J. 2009. Effect of
sonication on orange juice quality parameters during storage. International
Journal of Food Science and Technology. 44:586 – 595
Tounsi M.S., Wannes A.W., Ouerghemmi I., Jegham S., Njima Y.B., Hamdaoui G.,
Zemni H. and Marzouk B. 2011. Juice components and antioxidant capacity of
four Tunisian Citrus varieties. Journal of the Science of Food and Agriculture.
91:142–151
125
Tripoli E., La Guardia M., Giammanco S., Di Majo D. and Giammanco M. 2007. Citrus
Flavonoids: Molecular Structure, Biological Activity and Nutritional Properties:
A review. Food Chemistry. 104:466 – 479
Trumbo P.R. and Ellwood K.C. 2006. Lutein and zeaxanthin intakes and risk of age-
related macular degeneration and cataracts: An evaluation using the Food and
Drug Administration’s evidence-based review system for health claims. The
American Journal of Clinical Nutrition. 84(5):971 – 974
Tusa N., Abbate L., Renda A. and Ruberto G. 2007. Polyphenols distribution in juices
from Citrus allotetraploid somatic hybrids and their sexual hybrids. J. Agric.
Food Chemistry. 55: 9089 – 9094
Underhill, S.J.R., McLauchlan, R.L., Eaks, I.L. 1995. 'Eureka' lemon chilling injury.
HortScience, 30:309-312
Undurraga P.L., Olaeta J.A., Retamales J.B. and Toso A.M. 2007. Manifestacion de
peteca y perdida de calidad en limones Eureka bajo diferentes condiciones de
almacenamiento. Agrociencia 41:133–139. Colegio de postgraduados, Texcoco,
Mexico.
Vacante V. and Calabrese F. 2009. Citrus. Trattato di agrumicoltura. Il Sole 24 ore
Edagricole.
Vanamala J., Reddivari L., Yoo K.S., Pike L.M and Patil B.S. 2006. Variation in the
content of bioactive flavonoids in different brands of orange and grapefruit
juices. Journal of Food Composition and Analysis. 19:157 – 166
Vandercook C.E. 1977. Nitrogenous compounds. In: Nagy S., Shaw P.E. and Veldhuis
M.K. (Eds). Citrus Science and Technology. Vol. I. Westport, Conn.: AVI
Publishing Company. 229 – 265
Visser F.R. and Taylor M. 2007. Improved performance of the AromaScan A32
electronic nose and its potential for detecting aroma differences in dairy products.
Journal of Sensory Studies. 13(1):95 – 120
Voutilainen S., Nurmi T., Mursu J. and Rissanen T.H. 2006. Carotenoids and
cardiovascular health. American Journal of Clinical Nutrition. 83:1265 – 1271
Wampler T.P. 2002. Analysis of Food Volatiles Using Headspace-Gas Chromatographic
Techniques. In: Marsili R. (ed). Flavour, Fragrance and Odour Analysis. New
York: Marcel Dekker, Inc. 25 – 54
Wang Y.C., Chuang Y.C. and Ku Y.H. 2007. Quantitation of bioactive compounds in
citrus fruits cultivated in Taiwan. Food Chemistry. 124:1561 – 1566

126
Wills, R.B.H. and Warton, M.A. 2000. A new rating scale for ethylene action on
postharvest fruit and vegetables. In: Artes, F., Gil, M.I. and Conesa, M.A. (Eds.).
Improving Postharvest Technologies of Fruits, Vegetables and Ornamentals, IIR
Conference, Murcia, p. 43-47
Wills, R.B.H., Ku, V.V.V., Shohet, D. and Kim, G.H. 1999. Importance of low ethylene
levels to delay senescence of non-climacteric fruit and vegetables. Australian
Journal of Experimental Agriculture. 39:221-224
Wills, R.B.H., Warton, M.A., Mussa, D.M.D.N., Chew, L.P. 2001. Ripening of
climacteric fruits initiated at low ethylene levels. Australian Journal of
Experimental Agriculture. 41:89-92
Wilson A.D. 2012. Development of an electronic-nose technology for the rapid detection
of agricultural pesticide residues. Phytopathology
Win D.T. 2000. A six-sensor monitor for detection of off flavor in beers using an
artificial neural network. AU J.T. 4: 119 – 124
Win D.T. 2005. Electonic Nose: a big part of our future. Assumption University Journal
of Technology. 9(1):1 – 8
Winterhalter P. and Rouseff R. 2002. Carotenoid-Derived Aroma Compounds: An
Introduction. ACS Symposium Series. 802:1 – 17
Wyllie S.G., Leach D.N., Wang Y. and Shewfelt R.L. 1995. Key aroma compounds in
melons: their development and cultivar dependence. In: Fruit Flavors: biogenesis,
characterization, and authentication. Rouseff R.L. and Leahy M.M. (Eds).
American Chemical Society. 248 – 257
Yamada H. 1996. Contribution of Pectins to Health Care. In Pectins and Pectinases.
Visser J., Voragen A.G.J. Elsevier; New York (Eds) 173 – 190
Yo S.P. and Lin C.H. 2004. Qualitative and Quantitative Composition of the Flavour
Composition of Taiwan Calamondin and Philippine Calamansi Fruit. European
Journal of Horticultural Science. 69:117–124
Youseif S.H., El-Halwagi A., Sayed H.A. and El-Itriby H.A. Chemical analyses,
antibacterial activity and genetic diversity assessment of some Egyptian Citrus
spp. Cultivars. African Journal of Biotechnology. 13:2626 – 2636
Zakaria A., Shakaff A.Y., Masnan M.J., Ahmad Saad F.S., Adom A.H., Ahmad M.N.,
Jaafar M.N., Abdullah A.H. and Kamarudin L.M. 2011.Improved maturity and
ripeness classification of Mangifera Indica cv. Harumanis mangoes through
sensor fusion of an electronic nose and acoustic sensor. Sensors. 12:6923 – 6048
127
Zamorani A., Russo C., Lanza C.M. and Cataldi Lupo M.C. 1973. Research on Nitrogen
Compounds in Citrus Fruits. III. Free Amino Acids in the Juice of Clementines.
Essenze e Derivati Agrumari. 43:217 – 218
Zumreoglu-Karan B. 2006. The coordination chemistry of Vitamin C: An Overview.
Coordination Chemistry Reviewers. 250:2295 – 2307 r