el camino real bus rapid transit (brt)vtaorgcontent.s3-us-west-1.amazonaws.com/site_content/ecr...
TRANSCRIPT

S A N T A C L A R A Valley Transportation Authority
Prepared for:
Prepared by:
In association with
June 9, 2015
Response to Agency CommentsSubmitted on the Draft Environmental ImpactReport/Environmental Assessment
El Camino Real Bus Rapid Transit (BRT)
ICF InternationalDKS Associates


El Camino Real Bus Rapid Transit
Response to Agency Comments
Submitted on the
Draft Environmental Impact
Report/Environmental Assessment
June 9, 2015
Prepared by
Parsons Transportation Group Inc.
In Association with
ICF International
DKS Associates
For submittal to
Santa Clara Valley Transportation Authority


El Camino Real BRT Response to Agencies
i
El Camino Real Bus Rapid Transit
Response to Agencies
Table of Contents
1. INTRODUCTION ................................................................................................................. 1
1.1. Purpose of the Report ............................................................................................... 1
1.2. Organization of the Report ........................................................................................ 1
1.3. Project Description .................................................................................................... 1
1.4. Purpose and Need .................................................................................................... 2
2. GENERAL RESPONSES .................................................................................................... 4
2.1. The Travel Demand Model ........................................................................................ 4
2.2. Multi-level Traffic Analysis ......................................................................................... 5
2.3. Parking ...................................................................................................................... 6
2.4. Other Alternatives ...................................................................................................... 6
2.5. North-South Routes and Connections ....................................................................... 6
2.6. Landscaping/Trees .................................................................................................... 6
2.7. Selection of a Locally Preferred Alternative ............................................................... 7
3. RESPONSES TO STATE AGENCIES ................................................................................. 9
3.1. California Department of Transportation .................................................................... 9
4. RESPONSES TO SANTA CLARA COUNTY ..................................................................... 13
4.1. Santa Clara County Department of Health ............................................................... 13
4.2. Santa Clara County Department of Roads and Airports ........................................... 14
5. RESPONSES TO LOCAL CITIES...................................................................................... 15
5.1. City of Los Altos ...................................................................................................... 15
5.2. City of Mountain View .............................................................................................. 24
5.3. City of Palo Alto ....................................................................................................... 32
5.4. City of San José ...................................................................................................... 38
5.5. City of Santa Clara .................................................................................................. 41
5.6. City of Sunnyvale .................................................................................................... 47

El Camino Real BRT Response to Agencies
ii
APPENDIX Letter from California Department of Transportation Letter from Santa Clara County Department of Health Letter from Santa Clara County Department of Roads and Airports Letter from City of Los Altos Letter from City of Mountain View Letter from City of Palo Alto Letter from City of San José Letter from City of Santa Clara Letter from City of Sunnyvale
El Camino Real BRT Response to Agencies
1
1. INTRODUCTION The El Camino Real Bus Rapid Transit (BRT) Project is an enhancement of Santa Clara Valley Transportation Authority (VTA) bus service from downtown San José to the Palo Alto Transit Center. The Project was proposed in the 2009 BRT Strategic Plan. After Conceptual Engineering and receiving comments from the public and cities served by the project, the VTA Board of Directors in November 2012 decided to proceed with environmental analysis of dedicated lane alternatives in Santa Clara and from Santa Clara to Mountain View. Additional dedicated lane alternatives, including one extending into Palo Alto, were requested by Mountain View and Los Altos during the environmental scoping period. Thus a range of alternatives underwent environmental analysis in accordance with the California Environmental Quality Act (CEQA) and the National Environmental Policy Act (NEPA). The Draft Environmental Impact Report/Environmental Assessment (DEIR/EA) was issued October 29, 2014 and was available for public review and comment for 77 days, ending on January 14, 2015. VTA is now in the process of determining how to move the project forward.
1.1. Purpose of the Report When the DEIR/EA public comment period closed on January 14, 2015, VTA had received over 700 comment letters, emails, cards or oral statements—more than any other transit project proposed by VTA. It will take a good deal of time to assemble all those comments, catalogue them, and respond to them in the Final EIR/EA. In the interim, VTA has developed preliminary responses to comments from the public agencies as requested so that they can indicate a preference for the Locally Preferred Alternative, and these are presented in this report. The comments from public agencies (Caltrans, Santa Clara County and the cities along the corridor) represent most of the concerns expressed in comments received from business, organizations and members of the public. All comments will be answered fully in the Final EIR/EA, but this report serves as a preliminary response to the most frequently expressed questions. VTA has taken this highly unusual step of providing responses in advance of the Final EIR/EA because it values the collaboration of its partners along the corridor and recognizes that only through partnership will the transportation issues be resolved.
1.2. Organization of the Report Following this introduction, the report presents some general responses to many of the topics raised in the comments. These serve as partial responses to individual comments which will be answered more fully in the Final EIR/EA. The general responses are followed by specific responses to the comments by each agency. For brevity, each comment has been summarized in italics; the specific response follows each comment, although it sometimes refers back to one or more of the general comments. The full comment letters from state, regional and local agencies are included in the Appendix. Section, table, and figure numbers in the responses refer to the DEIR/EA, unless otherwise noted.
1.3. Project Description The El Camino Real Bus Rapid Transit (BRT) project is one of three potential BRT corridors being considered by the Santa Clara Valley Transportation Authority (VTA) to enhance transit service within the service area. The BRT Strategic Plan, completed in March 2009,

El Camino Real BRT Response to Agencies
2
recommended implementation of the El Camino Real BRT corridor along with the Santa Clara-Alum Rock and Stevens Creek BRT corridors. The El Camino Real BRT corridor is 17.6 miles through the cities of Palo Alto, Los Altos, Mountain View, Sunnyvale, Santa Clara, and San José. It may include some portions of dedicated, center-running transit lanes and some portions where the transit vehicles run in mixed flow lanes with automobile traffic. There could be up to 16 stations constructed with the Project, spaced approximately one-mile apart. Figure 1 shows the Project corridor. Seven alternatives have been studied in the environmental analysis to reflect the range of possibilities using three different conditions: no-build, building enhanced curbside bulbout stations with the bus operating in mixed flow traffic, or converting one lane in each direction to be used for buses (and emergency vehicles) only, with stations in the median. The alternatives differ in the application of these three conditions along the corridor, namely
• Alternative 1 – No Build
• Alternative 2 – Mixed flow with bulbout stations from San José to Palo Alto
• Alternative 3a – 3.0 miles of dedicated lanes from Lafayette Street in Santa Clara to
Halford Avenue in Santa Clara, with bulbout stations in San José and no improvements
west of Santa Clara
• Alternative 3b – 3.0 miles of dedicated lanes from Lafayette Street in Santa Clara to
Halford Avenue in Santa Clara, with bulbout stations in San José and from Santa Clara
to Palo Alto
• Alternative 4a – 7.0 miles of dedicated lanes from Lafayette Street in Santa Clara to
SR 85 in Mountain View, with bulbout stations in San José and from Mountain View to
Palo Alto
• Alternative 4b – 10.3 miles of dedicated lanes from Lafayette Street in Santa Clara to
Showers Drive in Los Altos, with bulbout stations in San José and in Palo Alto
• Alternative 4c – 13.9 miles of dedicated lanes from Lafayette Street in Santa Clara to
Embarcadero in Palo Alto, with bulbout stations in San José
1.4. Purpose and Need The purpose of the Project is to:
• Provide a competitive transit alternative to the automobile in the Project corridor.
• Increase the reliability, frequency, and travel speed of transit along the Project corridor.
• Improve transit amenities and facilities to provide greater passenger comfort and safety.
• Enhance the multi-modal character of El Camino Real with street improvements for
pedestrians and bicyclists.
• Provide the transit infrastructure to support the implementation of the transit goals and
objectives of the Grand Boulevard Initiative (for El Camino Real).
• Provide the transit infrastructure to support city general and specific plans that call for a
greater role for transit to complement their growth strategies.
• Improve efficiency and cost-effectiveness of transit services in the Project corridor.

El Camino Real BRT Response to Agencies
3
Santa Clara County is expected to experience substantial growth between 2010 and 2040, with population increasing by 36 percent and the number of jobs increasing by 33 percent. Growth concentrated in Priority Development Areas, including El Camino Real, will enhance the connection between homes and jobs, but will also concentrate traffic growth and transit demand in the same corridors. Transit service must be improved to provide more efficient ways to move this growing population and work force. The El Camino Real corridor currently has the highest bus ridership in the VTA system, carrying nearly one-fifth of all bus riders in Santa Clara County. In addition, these lines have similar ridership during midday and peak periods, which indicates that they serve a regular ridership with diverse needs. The all-day use along this corridor indicates that the corridor needs more frequent and higher quality service. Existing and future transit travel speeds are not attractive in comparison with the automobile. As growth along the corridor increases, traffic volumes are also expected to increase substantially, resulting in decreased travel speeds and increased delay for transit riders under the current service. Travel times increased steadily from the introduction of the Rapid 522 limited stop service in 2005 until the economic downturn at the end of 2007. With the recent improvement in the economy travel times are once again increasing, negatively affecting trip reliability for all users. Cities along the corridor, through their general plans and through the Grand Boulevard Initiative (GBI) collaboration, have expressed policies that encourage better coordination of land use, transportation and capital improvements along El Camino Real. The GBI vision is that “El Camino Real will achieve its full potential as a place for residents to live, work, shop and play, creating links between communities that promote walking and transit and an improved quality of life.” The Project would provide a concrete step toward realizing that vision and supporting regional and local planning efforts to address anticipated growth.
El Camino Real BRT Response to Agencies
4
2. GENERAL RESPONSES While this document provides individual responses to the comments submitted in letters from various agencies, several common themes appear. A great many of the comments focused on impacts to automobile traffic, but it must be remembered that El Camino Real BRT is a transit project and it is a project that will introduce elements of a “complete street” to El Camino Real, improving conditions for bicyclists and pedestrians. It is not intended to improve automobile traffic, or necessarily relieve automobile congestion. Neither does the Project add trips to El Camino Real in the way a development project does. Rather it redistributes trips to different modes and routes. An understanding of these broad issues may help the reader put the more detailed responses in context. Both general and detailed responses to traffic and transportation comments rely heavily on the Traffic Operations Analysis Report (TOAR) that was prepared to support the environmental process, as well as to support the Caltrans approval process. The TOAR is included in the DEIR/EA as part of Appendix H. The TOAR is frequently cited in the responses below and can be found on the VTA website at http://www.vta.org/sfc/servlet.shepherd/document/download/069A0000001fC26IAE. The appendices to the TOAR which are also cited below are also on the website at http://www.vta.org/sfc/servlet.shepherd/document/download/069A0000001fC21IAE.
2.1. The Travel Demand Model The VTA Countywide Travel Demand Model was used to generate transit and traffic forecasts. It is a traditional four-step model that uses the transportation network and socioeconomic inputs to predict future transportation conditions. The four steps include trip generation, trip distribution, mode choice, and transit and highway assignment. The base software used to create the model is CUBE, developed by CityLabs. This type of model has been used to analyze other BRT projects in the Bay Area, commuter rail projects, such as BART and Caltrain Electrification, and is used by most cities to assess the impacts of development projects. Some key features of the model include:
• Covers the nine-county Bay Area plus four external counties (San Joaquin, Santa Cruz, Monterey, and San Benito) with more detailed zone structure and network in Santa Clara and San Mateo Counties;
• Uses the 2013 Association of Bay Area Governments (ABAG) Projections for estimates of households, population and employment;
• Generates trips associated with eight trip purposes (home-based work trips, home-based shop and other trips, home-based social/recreational trips, non-home-based trips, home-based school trips, internal to internal zone truck trips, air-passenger trips, and external truck trips);
• Includes a mode choice step during which the passenger-trips are distributed to different travel modes, including drive-alone auto, shared-ride auto (HOV/carpool), transit (submodes), bicycle, and walk, and peak mode choice is based on AM peak period travel times;
• Provides AM and PM peak hour, 4-hr AM and PM peak period, midday and evening highway assignments that produce vehicle volumes, speeds and travel times by link; and
• Includes a transit assignment step that provides boardings/alightings by station/stop for each transit route, and passenger trips by link/segment for each transit route.
El Camino Real BRT Response to Agencies
5
The basic premise of the model is to provide the shortest duration trip for all users. Computer software allows it to quickly iterate multiple routings for thousands of trips to achieve this goal. The model was run for each of the horizon years (existing, that is, 2013; anticipated “opening day” in 2018; and the planning horizon of 2040) and for each of the seven alternatives.
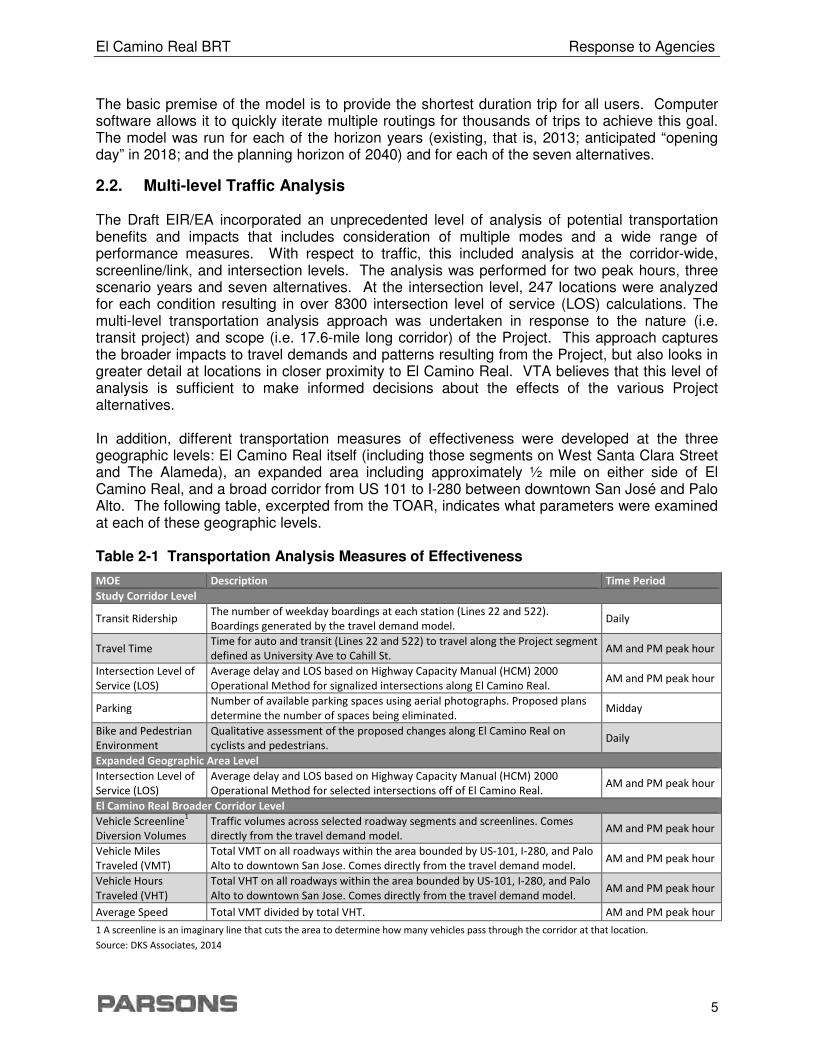
2.2. Multi-level Traffic Analysis The Draft EIR/EA incorporated an unprecedented level of analysis of potential transportation benefits and impacts that includes consideration of multiple modes and a wide range of performance measures. With respect to traffic, this included analysis at the corridor-wide, screenline/link, and intersection levels. The analysis was performed for two peak hours, three scenario years and seven alternatives. At the intersection level, 247 locations were analyzed for each condition resulting in over 8300 intersection level of service (LOS) calculations. The multi-level transportation analysis approach was undertaken in response to the nature (i.e. transit project) and scope (i.e. 17.6-mile long corridor) of the Project. This approach captures the broader impacts to travel demands and patterns resulting from the Project, but also looks in greater detail at locations in closer proximity to El Camino Real. VTA believes that this level of analysis is sufficient to make informed decisions about the effects of the various Project alternatives. In addition, different transportation measures of effectiveness were developed at the three geographic levels: El Camino Real itself (including those segments on West Santa Clara Street and The Alameda), an expanded area including approximately ½ mile on either side of El Camino Real, and a broad corridor from US 101 to I-280 between downtown San José and Palo Alto. The following table, excerpted from the TOAR, indicates what parameters were examined at each of these geographic levels. Table 2-1 Transportation Analysis Measures of Effectiveness
MOE Description Time Period
Study Corridor Level
Transit Ridership The number of weekday boardings at each station (Lines 22 and 522).
Boardings generated by the travel demand model. Daily
Travel Time Time for auto and transit (Lines 22 and 522) to travel along the Project segment
defined as University Ave to Cahill St. AM and PM peak hour
Intersection Level of
Service (LOS)
Average delay and LOS based on Highway Capacity Manual (HCM) 2000
Operational Method for signalized intersections along El Camino Real. AM and PM peak hour
Parking Number of available parking spaces using aerial photographs. Proposed plans
determine the number of spaces being eliminated. Midday
Bike and Pedestrian
Environment
Qualitative assessment of the proposed changes along El Camino Real on
cyclists and pedestrians. Daily
Expanded Geographic Area Level
Intersection Level of
Service (LOS)
Average delay and LOS based on Highway Capacity Manual (HCM) 2000
Operational Method for selected intersections off of El Camino Real. AM and PM peak hour
El Camino Real Broader Corridor Level
Vehicle Screenline1
Diversion Volumes
Traffic volumes across selected roadway segments and screenlines. Comes
directly from the travel demand model. AM and PM peak hour
Vehicle Miles
Traveled (VMT)
Total VMT on all roadways within the area bounded by US-101, I-280, and Palo
Alto to downtown San Jose. Comes directly from the travel demand model. AM and PM peak hour
Vehicle Hours
Traveled (VHT)
Total VHT on all roadways within the area bounded by US-101, I-280, and Palo
Alto to downtown San Jose. Comes directly from the travel demand model. AM and PM peak hour
Average Speed Total VMT divided by total VHT. AM and PM peak hour
1 A screenline is an imaginary line that cuts the area to determine how many vehicles pass through the corridor at that location.
Source: DKS Associates, 2014
El Camino Real BRT Response to Agencies
6
2.3. Parking A comprehensive parking survey and analysis was conducted providing an inventory of existing parking spaces on El Camino Real, on side streets within 500 feet of the corridor, and in off-street parking lots within 500 feet of the corridor. The inventory information was collected on the ground in segments on El Camino Real between major cross-streets, segregated by direction, and on the cross streets, also segregated by direction. The off-street parking facilities fronting The Alameda/El Camino Real that allow public parking were also surveyed. The survey included parking in shopping centers and other lots where the general public can generally find parking without a special permit. Occupancy was measured using aerial photographs taken at morning, noon, and early evening times; the highest occupancy period (noon) was reported in the DEIR/EA. Summary results are provided in the DEIR/EA that indicate overall parking spaces (total on- and off-street) were approximately 50 percent occupied. Parking spaces on El Camino Real experience an average occupancy level of 33 percent. Where individual segments reached high levels of occupancy, available spaces within the same segment could be found on cross-streets or off-street lots.
2.4. Other Alternatives Lines 22 and 522 together have the highest ridership of any corridor in the VTA bus system. Consistent with the purpose and need for the project to improve bus service on El Camino Real, other corridors were not examined as alternatives; this level of alternatives analysis had been conducted through the BRT Strategic Plan in 2009. The Strategic Plan identified El Camino Real as the most promising corridor for improvements after the Santa Clara-Alum Rock segment which is also served by Lines 22 and 522. The DEIR/EA also identified other alternatives that were considered, but not pursued in the environmental analysis. These included the possibility of light rail in the corridor, keeping six general purpose travel lanes and adding lanes for BRT, as well as other combinations of dedicated lane and mixed flow segments. Other suggestions that involved major new infrastructure on El Camino Real, such as monorail, tunnels, and grade separations were not included in early analysis for similar reasons as light rail—substantial right of way requirements and prohibitive costs.
2.5. North-South Routes and Connections Several comments have indicated a need for more north-south transit. VTA recently completed a study to determine how routes that traveled north/south in the study area and connected with the El Camino Real corridor may need to be adjusted or improved to better connect with a future BRT service. The scope of the study was expanded to also analyze how VTA's bus routes connect with new residential and office developments and to determine if changes in land use were shifting travel demand that would require an adjustment in VTA service. The results were published in the North Central County Bus Improvement Study, available on the VTA website at http://www.vta.org/projects-and-programs/transit/north-central-county-bus-improvement-plan. The study recommended several changes to north-south service, some of which will be implemented with the FY 16-17 Transit Service Plan, including the new Line 354 Limited service in the Sunnyvale/Saratoga Road-Mathilda Avenue corridor.
2.6. Landscaping/Trees An inventory of trees along the corridor in the vicinity of proposed construction was conducted as part of the environmental analysis. The inventory included identification of the tree species,

El Camino Real BRT Response to Agencies
7
size, and health. A total of 1,050 trees were catalogued; many trees would not be affected by the construction and were not included in the inventory. The analysis of potential tree removal has taken a conservative approach and identified trees for removal if they are adjacent to the construction. Detailed landscaping plans have not been developed, but there would be an opportunity for substantial new landscaping in the medians of dedicated lane segments. In mixed flow segments, the only construction occurs at the station locations, so existing trees and landscaping would remain outside of station locations. Trees removed by the Project would be replaced within the Project corridor, to the extent feasible. Trees with a diameter of less than 12 inches would be replaced at a 2:1 ratio. All trees with a diameter of 12 inches or more would be replaced at a 3:1 ratio. If urban trees (nonnatives and ornamentals) are replaced with native trees, a reduced mitigation ratio of 1:1 for all trees smaller than 12 inches in diameter, and 2:1 for all trees with a diameter of 12 inches or more, would be implemented. These trees would be irrigated and maintained for a period of not less than 3 years. With a more detailed design-level evaluation, many of the trees identified for removal may be able to be saved. In the design phase, VTA will work with each affected jurisdiction to develop a landscaping plan that provides details on locations of trees and other plantings to replace landscaping and trees removed during construction of the Project. A design exception may need to be approved by Caltrans to allow planting of trees in medians with less than five feet of horizontal clearance, as currently exists in some locations and has been done in Menlo Park under a recent demonstration project on El Camino Real, or closer than 100 feet from an intersection.
2.7. Selection of a Locally Preferred Alternative VTA has conducted numerous public meetings and presentations to interested groups both before and after the formal public comment period on the DEIR/EA. The input received in these many meetings, combined with the formal comments from stakeholders and the public, serve to inform the decision as to a Locally Preferred Alternative (LPA). In the federal environmental process, all viable alternatives are analyzed on an equal basis in the draft environmental document, and a preferred alternative is selected that becomes the basis for the final document. Over the summer, VTA staff will develop a recommendation to the VTA Board of Directors as to whether to proceed with the Project and, if a decision is made to proceed, which of the options analyzed in the DEIR/EA should be used as the basis for proceeding. This recommendation will be reviewed at the committee level and by VTA advisory bodies. After reviewing this input, the Board of Directors will make a decision. The Board may choose to proceed with one or another of the alternatives in the environmental document. If the choice is a Build alternative, staff would proceed to complete the environmental document on that basis.
If the Board selects a Build LPA, staff would also advance the application to the FTA for a rating in the Small Starts discretionary grant program. In addition, staff would complete a Project Report to obtain Caltrans’ approval of the Project.

El Camino Real BRT
Figure 1 El Camino Real Bus Rapid Transit Corridor
Escuela (optional)
Embarcadero/ Churchill (optional)
Rapid Transit Corridor
Response to Agencies
8

El Camino Real BRT Response to Agencies
9
3. RESPONSES TO STATE AGENCIES
Only one state agency responded to the Draft EIR/EA—the California Department of Transportation (Caltrans). Caltrans owns and operates El Camino Real as State Route 82.
3.1. California Department of Transportation S1-1. References to VTP 2035 should be updated to VTP 2040.
The Valley Transportation Plan 2035 (VTP 2030) was Santa Clara County’s current transportation plan at the time the Project’s Notice of Preparation (NOP) was released. The Valley Transportation Plan 2040 was adopted on October 2014, the same month that the Draft EIR/EA was released to the public. References will be updated in the FEIR/EA.
S1-2. Provide stop location analysis to ensure fewest stations necessary.
It is important to note that the service associated with this Project (Line 522) currently operates. The primary determinant for locating stations for the proposed BRT 522 service was based on the existing stop locations. Considerable planning, during the implementation of the Rapid 522 and through the 2009 BRT Strategic Plan, has previously gone in to defining these locations, taking into account factors such as major destination/activity centers, transfer locations and accessibility to different communities. As part of the proposed Project, some refinements of the station/stop locations were identified based on design/geometric considerations. Additional station locations were examined and tested for ridership as requested during Project Scoping. One or more of these optional station locations may be implemented as part of the Project.
S1-3. Expand the Caltrain description and impacts to Caltrain ridership.
While Line 522/BRT and Caltrain services operate in the same general corridor, there are several factors that suggest they serve different markets. There is typically between 0.5 and 1.0 mile between the two services. While Line 522/BRT is a limited stop service, it does not go outside of Santa Clara County and is intended to serve land uses along El Camino Real. Conversely, Caltrain is designed primarily to serve longer-distance regional trips with less frequent stops. The two services are complimentary and are currently used to move passengers. For the above reasons, the analysis provided in the Draft EIR/EA focused on transit ridership change along the El Camino Real corridor and not on the Caltrain corridor.
S1-4. Alternative 4c will allow fastest and most reliable travel time; center-running dedicated lanes provide most separation for bicyclists.
The comment regarding the faster and more reliable travel times and the more lateral separation from traffic for bicyclists provided by Alternative 4c is noted.
S1-5. Within the project limits, the BRT project shall be required to bring El Camino Real into compliance with the Americans with Disabilities Act (ADA) design standards.
The Project will comply with ADA requirements. Where there is new construction at curb returns, appropriate ADA-compliant curb ramps would be installed. Details on construction of curbs would be part of final design.
S1-6. Clarify if landscaping will vary between the alternatives, per the depictions in the typical sections.
Detailed landscaping plans have not been developed and so it cannot be said that there are differences in landscaping between the alternatives, except conceptually. Because the extensive construction that would take place under dedicated lane alternatives offers an opportunity for transformation of the street, the depictions of how the corridor could look show

El Camino Real BRT Response to Agencies
10
landscaping in the streetscape. In mixed flow segments, the only construction occurs at the station locations and thus no street trees are shown in the typical sections, although existing trees would remain outside of station locations.
S1-7. Revise cross-section titles to indicate all sections that include parking.
All mixed flow alternatives would include parking. Figure 3-4 of the DEIR/EA will be revised to show that the section in the lower right depicts mixed flow in San José.
S1-8. The Traffic Operations Analysis Report (TOAR) should include a queuing analysis.
It should be noted that the project does not add trips to El Camino Real or to the roadway network. Given the quantity of analysis in the multi-level transportation analysis described in the General Responses, a detailed queue analysis was not deemed necessary. The LOS gives a reasonable indication of the level of congestion and permits a comparison of the alternatives, whereas the amount of queuing would be evaluated for detailed design purposes. The outputs needed for queuing analysis were generated as part of the Synchro modeling and LOS analysis. This information would be utilized, as appropriate, in subsequent design stages after selection of the LPA. If the subsequent queuing analysis indicates that longer turn pockets are necessary, the design would be modified to accommodate that length, where feasible. At the current level of analysis, the impacts were captured in the LOS analysis by manually re-assigning trips from closed intersections to the adjacent intersections, as identified on the Project plans in Appendix B of the DEIR/EA. In 2018, the number of turns redistributed at an intersection was less than 60 in each AM peak hour scenario and in almost all of the PM peak hour scenarios. That number results in two or fewer cars added to a turn pocket in each signal cycle. There are four locations (WB at The Americana and EB at Maria Avenue in Sunnyvale, and EB at Flora Vista Avenue and WB at Calabazas Boulevard in Santa Clara) where more than 60 cars were reassigned, resulting in three or four cars are added per cycle, and only in the PM peak hour under Alternative 4c. Given the small increase in the demand for left turns at project intersections, VTA will not be conducting a detailed queue analysis at this time.
S1-9. Include the demand for the eliminated left turns in the adjacent intersections.
The turning movements affected by left turn closings were manually redistributed to adjacent intersections prior to making the intersection LOS calculations and thus are included in the analysis presented in the Draft EIR/EA. The conceptual alignment drawings provided in Appendix B of the EIR/EA include notes indicating where these left turns were reallocated.
S1-10. Alternatives with bulbout stations should be examined for impacts to emergency vehicles.
While the implementation of bulbout stations to varying degrees under different build alternatives could increase the occurrence of bus blockages along El Camino Real, the following factors suggest that the impact to emergency vehicle circulation would be minimal:
• Up to 16 bulbouts would be added over the 17.6 mile corridor (approximately 1 per mile on average).
• At some of these locations, buses currently impede traffic flow in the right lane when stopped due to space constraints.
• There would be a maximum of 10 blockages per hour (1 every 6 minutes on average) with average dwell time of 36 seconds. This includes no discount for times when the adjacent signal is red and therefore the bus would not affect the movement of other vehicles.
El Camino Real BRT Response to Agencies
11
• With exception of stations in San José, the majority of the Project corridor has three travel lanes which provide a high level of freedom for vehicles to maneuver around stopped buses.
• Blockages occur in the right lane, whereas emergency vehicles typically use the left lanes and all other traffic is required to move to the right and then stop. It is expected that cars would be able to behave in the required way during emergency vehicle operations, similarly to what they do today using the three lanes of traffic on El Camino Real.
S1-11. Discussion of fair share contribution should include difficulty of measuring incremental impacts since there is no incremental growth caused by the project on El Camino Real.
There are no feasible mitigation measures identified on El Camino Real for either 2018 or 2040 so “fair share” and “incremental growth” do not apply on El Camino Real. For intersections off El Camino Real, the concepts of “fair share” and “incremental growth” would apply to 2040 impacts and details of mitigation contributions would be negotiated with individual jurisdictions during the design phase after selection of the LPA. Since the intersections off of El Camino Real do not involve converting a lane of traffic, the “incremental growth” concept still applies. However, VTA recognizes that this concept is more applicable to land use projects than to transportation projects and may need to be adjusted accordingly.
S1-12. Tables should indicate type of intersection control (signal, all-way or two-way stop control).
Tables in the Final EIR/EA will be revised to denote the type of intersection control for each intersection.
S1-13. Mitigations should include signal timing and hardware upgrades.
For both 2018 and 2040, signal timing optimization was assumed as part of the LOS analysis for all alternatives. The impacted intersections are those where such improvements are not sufficient.
For 2018, new "opening day" (2018) timing plans, as well as appropriate hardware upgrades, would be funded and implemented as part of the Project for intersections along El Camino Real where dedicated lanes or transit signal priority (TSP) improvements are proposed. For locations along El Camino Real without dedicated lanes (where the Project is making no changes to the roadway) but which experience significant traffic impacts, optimization of signal timing would be funded as part of the project, but implemented as part of the responsible agencies' efforts to periodically update timings in response to growth and changing travel patterns. For the remaining locations unaffected by the Project, timing plans would be updated by the local agencies, separate from the Project, as part of these same efforts to periodically update timings.
For 2040, signal timing plans for signals along El Camino Real would be updated as part of the responsible agencies' efforts to periodically update timings in response to growth and changing travel patterns in the future with or without the Project.
S1-14. Mitigations should consider sliver takes of right of way as feasible.
VTA makes every effort to minimize the acquisition of right of way for a project. VTA carefully weighs the benefits to the public against the costs and injury to the property owners when deciding to use its powers of condemnation for acquiring property. In the case of the traffic mitigation for this project, VTA has decided not to take any right of way from property owners unless required to as a condition of a permit or approval authority over the project because it is not necessary to build or operate BRT and is not consistent with other project purpose and needs such as enhancing the multi-modal character of El Camino Real for pedestrians and

El Camino Real BRT Response to Agencies
12
bicyclists. If the cities, county, or state requests that VTA take right of way for traffic mitigation, VTA will consider it only if there is no displacement or minimal hardship inflicted on property owners or their tenants, and the benefits of the mitigation to the public are substantial. In the case of the locations identified in the comment, property acquisition at El Camino Real/Embarcadero could include recreational facilities (triggering a Section 4f impact) which could be considered less beneficial to the public than the benefit of the mitigation.
Right of way acquisition at El Camino Real/Kiely Boulevard could impact parking and circulation that could be considered a hardship for the affected businesses.
At El Camino Real/San Tomas Expressway the likely elimination of parking spaces could be considered a hardship for the affected businesses.
S1-15. Mitigation impacts for El Camino Real/Scott Blvd. intersection have directions reversed.
Table 4.12-21 will be revised to correct the description of the El Camino Real and Scott Boulevard intersection mitigations.
S1-16. Bus blockage should be included in several additional intersections affected by a nearby bulbout station.
Bus stop locations were reviewed and several intersections near stop locations where blockage factors might need to be added were identified. In general, the added delay was small, on the order of 0.1 seconds, and many intersections experienced no change in delay. The largest changes in delay were at Bernardo Avenue during the 2040 AM period for Alternatives 2 and 3b which had an increase of 1.8 seconds. Alternative 2 had the greatest number of changes in delay, especially in the 2040 PM period with 0.1 to 0.3 seconds change in delay at most new bus-blockage intersections. Ultimately, there was no change in LOS for any of the intersections where bus blockage was added.
S1-17. The project will need an encroachment permit from the State.
VTA would apply for an encroachment permit from the State at the completion of the design phase.

El Camino Real BRT Response to Agencies
13
4. RESPONSES TO SANTA CLARA COUNTY
Two responses from regional agencies were received—both from departments within Santa Clara County.
4.1. Santa Clara County Department of Health R1-1. Recommend consider only dedicated lane alternatives since these allow for multi-modal transportation and complete streets, which promote good health. Ensure diversion causes no unintended impacts to bicycles and pedestrians on side streets.
VTA acknowledges the County of Santa Clara Public Health Department’s recommendation to consider the dedicated lane alternatives and their support of the associated street improvements and more frequent transit connections.
Diversion to other routes is widely dispersed and generally no one route bears most of the diversion. Therefore, diversion impacts to bicycles and pedestrians on side streets are expected to be less than significant.
El Camino Real BRT Response to Agencies
14
4.2. Santa Clara County Department of Roads and Airports R2-1. Concern that the assumption of transit signal priority (TSP) at El Camino Real/San Tomas Expressway intersection would have negative impacts on San Tomas Expressway, and these have not been included in DEIR/EA.
For the purposes of the Draft EIR/EA, it was generally assumed that all build alternatives would include implementing transit signal priority (TSP) at all signalized intersections that do not currently have it. However, specific timing plans for TSP were not developed at this stage. During the design phase, a more detailed assessment of TSP at each location will be conducted
R2-2. The DEIR/EA should clarify which updates to signal timing were included in the analysis. The TOAR should include detailed LOS calculations for County expressway intersections.
For all future year alternatives, the LOS analysis assumed updated signal timings, keeping cycle lengths constant but optimizing the amount of green time for any one movement. The specific updates vary by location, alternatives and time period, and are reflected in the Synchro models and reports generated for this effort. Because the intersection analysis included over 8300 LOS calculations, the detailed signal timing parameters and LOS calculations were not included in the TOAR or Draft EIR/EA. However, this information has been made available to agencies in electronic format.
R2-3. The County disagrees with the mitigation strategies at certain expressway intersections in 2018 and advises consulting the Comprehensive County Expressway Planning Study—2008 Update. VTA should contribute a fair share contribution to improvements.
The analysis has determined what improvements may mitigate Project impacts based on the particular volumes on intersection approaches. If these mitigations can be implemented without right of way acquisition, VTA will fund 100 percent of the cost for near-term (2018) feasible improvements.
R2-4. The County disagrees with the mitigation strategies at certain expressway intersections in 2040 and advises consulting the Comprehensive County Expressway Planning Study—2008 Update. VTA should contribute a fair share contribution to improvements.
The analysis has determined what improvements may mitigate Project impacts based on the particular volumes on intersection approaches. If these mitigations can be implemented without right of way acquisition, VTA will fund a fair share contribution for long-term (2040) feasible improvements. The more recently proposed 2040 Expressway Plan includes a widening of Foothill Expressway from San Antonio Road to El Monte Road, as well as intersection improvements at Springer Road which could help alleviate congestion in the future.
R2-5. The project will need an encroachment permit from the County.
VTA would apply for an encroachment permit from the County at the completion of the design phase.

El Camino Real BRT Response to Agencies
15
5. RESPONSES TO LOCAL CITIES
Comment letters were received from each of the six cities through which El Camino Real passes. This report responds to the desire, expressed by several city council members, to know how the other cities had commented and how VTA would respond.
5.1. City of Los Altos L1-1. Provide responses to City of Los Altos’ letter of January 7, 2014.
Responses to the City of Los Altos’ comments on the Draft EIR/EA from January 7, 2014 are incorporated into responses below.
L1-2. Provide a tailored response and presentation to City.
In response to this request, VTA made a presentation to the Los Altos City Council on March 10, 2015. Other cities have received similar presentations upon request. VTA will continue to coordinate with the City of Los Altos, as they have with all affected jurisdictions within the Project corridor, on their Project-specific questions and concerns.
L1-3. Define the decision-making process VTA will use to arrive at a Locally Preferred Alternative (LPA).
Selection of the Locally Preferred Alternative (LPA) will be informed by written comments and public testimony from local agencies and public, and a staff recommendation will be presented that will go through VTA advisory bodies. Ultimately, the LPA will be decided upon by the VTA Board of Directors.
L1-4. Create a means for neighboring cities to work together to address common concerns about the Project.
VTA met almost monthly in Project Development Team (PDT) meetings with planning and engineering staff from each of the cities throughout the conceptual development of the BRT alternatives. In addition VTA receives input from its advisory bodies which include elected officials and staff representatives from each corridor city, the County, and Caltrans, and will continue to do so as the Project moves forward.
L1-5. How was diverted traffic determined? What is the current and projected growth in traffic? When does El Camino Real reach “full” capacity with the existing configuration? What data/assumptions were used to determine traffic diversion?
The diverted traffic volumes were taken from the trip assignment step of the VTA's Countywide Travel Demand Model. Since the model assigns trips to routes by giving the shortest travel time to all trips, it finds equilibrium between congested routes. Thus, these diverted volumes reflect changes in travel time over the transportation network resulting from project alternatives (removal of mixed flow lanes, for example). Additional detail can be found in Section 6.3 of the TOAR.
It is difficult to specify when El Camino Real reaches "capacity" as volumes and capacities (which, for a signalized arterial, are largely determined by amount of green time provided) vary throughout the corridor. Indeed, based on the intersection analysis, portions of El Camino Real already operate at capacity. With the Project, it is expected that some traffic will divert off of El Camino Real, but that some locations will continue to operate at capacity. On the basis of the ratio of volume of traffic to the theoretical capacity of an urban arterial street, according to observed volumes, El Camino Real, in the evening eastbound commute direction, currently operates at approximately 91 percent of its three-lane capacity just west of Page Mill Road, at

El Camino Real BRT Response to Agencies
16
approximately 94 percent just west of Shoreline Boulevard, at approximately 79 percent just west of Mathilda Avenue, and at approximately 57 percent of capacity just east of San Tomas Expressway. In 2018, according to the model, these same locations under Alternative 4c would operate at approximately 99 percent, 96 percent, 88 percent and 71 percent, respectively, of the two-lane capacity.
Tables 14 and 15 in the TOAR show the traffic volumes for the No Build Alternative on selected portions of El Camino Real. Detailed information on Average Daily Traffic (ADT) by vehicle class is included in Appendix D to the TOAR. Information on 2018 ADT by alternative is shown in Table 4.12-11, and will be augmented by 2040 ADT information.
The model operates on the principle that every trip should be made as short as possible. The model incorporates information regarding capacities and speeds on all facilities included in the model roadway network;
L1-6. What mitigations are proposed beyond 2018? Will impacts be considered when VTA awards grants?
Cities and transit users within the Project corridor would be the greatest beneficiaries of the Project. The Draft EIR/EA (Table 4.12-21 and Table 4.12-22) identifies mitigation measures for Project traffic impacts beyond 2018. VTA would provide fair share contributions for funding those feasible 2040 mitigations. The funds would be used to restripe and optimize signal timings as the need arises. VTA will work collaboratively with cities to evaluate grant applications and, where applicable, will consider the unmitigated impacts of the Project in this review.
L1-7. Was field validation of travel time conducted? What assumptions were used to determine the impact on travel time?
Limited automobile travel time runs were conducted along El Camino Real and used to check the reasonableness of model outputs against existing conditions. Existing transit travel times were derived from transit schedules which reflect actual operating conditions. For comparison of alternatives, existing and future automobile travel times were derived from the VTA Countywide Travel Demand Model. These values take into account assumed free flow speeds, roadway capacity, and forecasted travel demand (volume delay function). Transit operations in mixed flow were modeled by applying a factor to auto travel times that reflects the relationship between existing transit and existing auto travel times. Transit operations in dedicated lanes were computed based on average speed and dwell times.
L1-8. Will VTA “test” the dedicated lane alternative by installing temporary barriers on El Camino Real to determine impacts and measure diversion?
Possible scenarios for a demonstration project to test the effects of the dedicated lane alternatives were considered, but deemed impractical because of cost, inconvenience and inherent inability to accurately simulate the transit benefits while experiencing the automobile impacts. It is impractical to run buses in the median without median stations.
L1-9. What is VTA’s approach to evaluating significant and unavoidable impacts?
The DEIR/EA incorporated traffic analysis at the progressively more detailed corridor-wide, screenline/link, and intersection levels. Identification of mitigations also took a stepwise approach beginning with determination of significance of the impact. A significant impact at a signalized intersection is defined as 1) a decrease in level of service dropping below the standard (worse than LOS E for intersections in the Congestion Management Program [CMP], and worse than LOS D for non-CMP intersections), or 2) an increase in delay of 4 seconds or more for intersections already operating below the standard under No Build conditions. At an

El Camino Real BRT Response to Agencies
17
unsignalized intersection, an impact was determined to be significant if 1) intersection operations deteriorated to LOS D and the intersection met the warrant for a traffic signal, or 2) at an intersection already operating at LOS D or worse, intersection delay increased by 4 seconds or more and the intersection met the warrant for a traffic signal.
After determining significance, potential mitigations were considered in order of least disruption. Signal optimization was considered first, then solutions that would restripe or otherwise make improvements within the existing curb-to-curb width, followed by improvements to widen the roadway or to install a traffic signal.
Significant impacts were deemed unavoidable if mitigations would require right of way or, at an unisgnalized intersection, the intersection did not meet the signal warrant.
As noted, this analysis identifies significant and unavoidable impacts at numerous locations. Generally, these are locations where widening and right of way acquisition would be required. However, in the case of Springer Road at Cuesta Drive, the proposed mitigation measure is installation of a traffic signal. This measure would be fully funded by VTA as part of the Project and would reduce the impacts to less than significant. This applies only to Alternatives 4b and 4c. It should further be noted that while this measure is proposed to be funded as part of the Project, it would not be implemented without consultation with the cities of Los Altos and Mountain View.
L1-10. Will dedicated lanes result in an immediate gross imbalance in lane utilization causing vehicle traffic to divert during construction and stay diverted?
Converting one lane in each direction on El Camino Real to bus and emergency vehicle travel only would indeed result in some drivers choosing other routes. At the start of construction, the lane to be converted to a BRT lane would be closed to traffic and used as a construction area and staging area. Diversion of traffic would likely happen immediately upon the start of construction, and traffic would continue to divert during and after construction. While current projections suggest a 10-minute frequency would serve the demand in the corridor, if ridership increased faster than projected, as has been the case with the Orange Line BRT in Los Angeles and Eugene’s EmX, the interval between buses could be reduced without further impact to automobile traffic.
L1-11. Provide more information on current ridership including embark/disembark data, length of trips, peak hours, demographics.
Transit ridership forecasts were calculated by adding the change in ridership predicted by the Travel Demand Model to ridership data collected in November of 2013. The existing ridership data by station may be found in Appendix B of the TOAR. Ridership is measured in terms of boardings (embark data); disembark data is not available. Appendix C of the TOAR provides projected transit ridership in 2018 by line and station. In addition, general information on demographics and other parameters is available for core routes (which include Lines 22 and 522) and the entire VTA system, although not specific to El Camino Real. This information is reported in results from the system-wide ridership survey conducted by VTA in 2013, available on the VTA website at http://www.vta.org/sfc/servlet.shepherd/document/download/ 069A0000001OahEIAS. The average core route bus rider lives in a household of three to four people, and the household earns an average of $33,167 per year. The average age is 34.5 years old. VTA serves a diverse ridership. Nearly three-fourths (78 percent) are non-white, while 22 percent are white (only). When asked how well they speak English, 31 percent of riders say they speak it less than Very Well. Only 36 percent of VTA core bus riders have access to a vehicle.

El Camino Real BRT Response to Agencies
18
L1-12. What alternatives has VTA considered for increasing ridership? What effect would lower fares and free transfers to other transportation systems have? More frequent, smaller buses? Providing wi-fi?
VTA service improvements are guided by several Board-adopted policy documents and criteria, including the Transit Sustainability Policy, Service Design Guidelines and the Valley Transportation Plan. Service enhancements and changes are further informed by the analysis done to support the Comprehensive Operations Analysis (COA). The Bus Rapid Transit (BRT) Strategic Plan evolved from the COA and was approved by the Board of Directors in 2009. The BRT Strategic Plan identified El Camino Real as one of the top three most promising corridors for implementation of BRT. In the course of conceptual engineering alternatives to BRT in the El Camino Real corridor were considered, but discarded as documented in Section 3.5 of the DEIR/EA.
VTA regularly reviews its services for possible refinements and changes to service and or fare policies. Regarding fare policy, VTA, like the great majority of bus service providers, does not use distance pricing because distance pricing makes fare collection more complex for customers as well as staff, requires additional fare collection equipment, and increases the cost of fare collection. Regarding free transfer to other transit systems, the FY16/17 proposed budget includes a revision to fare policy which would establish a uniform transfer credit. VTA currently runs community buses on some routes, as appropriate. While the ridership on El Camino Real varies along the corridor, the ridership warrants full-size and articulated buses. Buses that will be running in the El Camino Real corridor in early 2016 will be equipped with passenger wi-fi.
L1-13. Has VTA considered service concepts, as SamTrans did, to reduce travel time and increase ridership?
The SamTrans El Camino Real Bus Rapid Transit Phasing Study (December 2014) examined service concepts to move from existing local bus service on El Camino Real in San Mateo County to a full BRT service. The study recommended two service strategies for further study. Option 1 consists of adding a Rapid bus overlay to the existing local bus service, then in the future, replacing the Rapid bus with BRT while keeping the local bus. Option 2 would upgrade the existing local bus to reduce the number of stops (a “Hybrid Rapid”), then in the future, adding BRT. VTA has already instituted the Rapid bus service plan—it’s the Rapid 522 that runs in the corridor now in addition to the local service by Line 22. The next step in service improvement, as SamTrans has identified, and as VTA identified in the 2009 BRT Strategic Plan, is to implement BRT.
L1-14. Has VTA considered alternatives that use Caltrain, that have BRT on Foothill Expressway with shuttles providing north/south connections, or that have north/south connections to Caltrain?
Alternatives studied in the DEIR/EA were intended to provide improved service on El Camino Real, which service on Caltrain or along Foothill Expressway would not do. While Line 522/BRT and Caltrain services operate in the same general corridor, albeit often as much as a mile apart, they serve different markets. Line 552/BRT is an express service similar to Caltrain, but it does not go outside of Santa Clara County and is intended to serve longer-distance regional trips with less frequent stops. The 522/BRT fare is $2.00 for a single ride whereas Caltrain fares range from $3.25 to $13.25 without a Clipper card depending on the number of zones traveled, As a result, the two services are considered complementary and not duplicative. For the above reasons, alternatives that include improvements to Caltrain were not evaluated.
Usually BRT is an enhancement of existing transit service because of increased demand for faster, more frequent service. At the time of the 2009 BRT Strategic Plan which examined the

El Camino Real BRT Response to Agencies
19
most promising corridors in Santa Clara County for implementation of BRT, Foothill Expressway did not have transit service that indicated potential for increased ridership with the implementation of BRT and it was not identified as a priority corridor for BRT. Foothill Expressway is not a Priority Development Area and is unlikely to develop the land uses necessary to support a BRT-level service.
North-south connections that intersect with El Camino Real, and thus could feed into and increase ridership in the El Camino Real corridor, have recently been studied in the North Central County Bus Improvement Plan, resulting in a new Line 354 service that is proposed to start in July 2016 and connect DeAnza College to business areas in north Sunnyvale. Numerous other existing bus lines provide north-south service across El Camino Real and serve Caltrain stations. Caltrain shuttles provide connections to and from major employment areas. VTA will continue to review the opportunity to increase and improve north-south connections before and after implementation of the BRT service.
L1-15. What are the projected and actual ridership and financial results of the Santa Clara-Alum Rock BRT project?
Ridership projections made during the environmental phase on the Santa Clara-Alum Rock BRT project indicated the BRT would increase weekday boardings by approximately 120percent by opening year of 2030. Updated forecasts based on more recent employment and population data project SCAR BRT ridership growing from the 2008 ridership by approximately 20 percent by 2018 under an El Camino Real BRT No Build situation. The Santa Clara-Alum Rock BRT service is slated to begin in early 2016; actual ridership counts will be available shortly thereafter.
L1-16. What cost/benefit analysis has been done? What is the funding source?
VTA typically measures cost-effectiveness against standards described in the Service Design Guidelines adopted by the Board of Directors in 2007. The standards include average boardings per revenue hour, boardings per station, and average boardings per route mile. The El Camino Real BRT alternatives with more dedicated lane perform the best against these guidelines and so are deemed cost-effective. In addition, it is VTA policy to seek a 20-25 percent farebox recovery rate, that is, the ratio of farebox revenue to the cost of operating the service. In 2018, under a No Build condition, VTA would recover approximately 15 percent of the BRT operational costs, under Alternative 2 (mixed flow with bulbout stations), VTA would recover approximately 19 percent of the costs, and under any of the dedicated lane alternatives, this rate increases with increasing length of dedicated lane to a projected rate of approximately 42 percent with Alternative 4c.
Capital costs would be funded through the 2000 Measure A Transit Improvement Program. VTA would also apply for a Small Starts grant from FTA.
L1-17. What is the timeline for the Stevens Creek Boulevard BRT project? What were the considerations in deciding which project to do first?
The Stevens Creek BRT project will implement TSP improvements later this year and will increase the frequency of service likely by 2017. In addition, a new Rapid 523 service will be operational when BART opens in 2017, and will be very similar to the current 323 service. A determination of future improvements along the Stevens Creek corridor will be made upon evaluating the effect of TSP and increased frequencies.

El Camino Real BRT Response to Agencies
20
L1-18. Trash receptacles shall have lids that are kept closed and prevent wind, animals or rain from transporting litter into the stormwater system.
Trash receptacles used at VTA’s transit facilities have lids. Trash receptacles installed as part of the Project will continue to have lids, which will prevent the wind, animals, or rain from transporting litter into stormwater systems, to the extent possible. Trash collection for VTA’s bus transit facilities along El Camino Real are the responsibility of VTA Bus Stop Maintenance, the local jurisdiction, or Clear Channel Communications, depending on agreements. Waste collected by VTA Bus Stop Maintenance is disposed of at VTA Operating and Maintenance Divisions,
L1-19. Trash receptacles shall be inspected and maintained to prevent overflow.
As described in the response to Comment L1-18, trash receptacle inspection and maintenance at new BRT stations constructed by the Project would continue to occur according to contractual agreements.
L1-20. VTA shall inspect the trash receptacles and stations daily to ensure that they are litter-free.
See the response to Comment L1-19.
L1-21. VTA shall coordinate with the City and the Santa Clara Valley Urban Runoff Pollution Prevention Program for litter/stormwater messaging at stations and bus stops.
VTA will continue to coordinate with the City of Los Altos and the Santa Clara Valley Urban Runoff Pollution Prevention Program (SCVUPPP) for litter/stormwater messaging at BRT stations, as it pertains to the Project.
L1-22. VTA shall provide a copy of the environmental document to SCVURPPP.
The EIR/EA was circulated to the appropriate agencies.
VTA specifically notified Santa Clara County, Santa Clara Valley Water District (SCVWD), and the six city jurisdictions (San José, Santa Clara, Sunnyvale, Mountain View, Los Altos, and Palo Alto) within the Project boundaries, of the circulation of the Draft EIR/EA. VTA also provided electronic copies of the Draft EIR/EA on VTA’s website to public agencies, and the public at large.
The Santa Clara Valley Urban Runoff Pollution Prevention Program did not comment or make recommendations on the Draft EIR/EA.
L1-23. VTA shall provide a construction schedule.
VTA will provide all jurisdictions along the Project corridor with a construction schedule prior to the commencement of construction activities. Construction schedules will be regularly updated.
L1-24. VTA shall coordinate with the City regarding sewer projects on El Camino Real and side streets.
VTA will coordinate with the City of Los Altos regarding Sewer Capital Improvement Program (CIP) Projects along El Camino Real and local side streets that are affected by the Project.
L1-25. What are the water quality impacts after construction (e.g., litter at stations)?
Impacts to hydrology and water quality during Project operation (after construction) are analyzed in Section 4.9, Hydrology and Floodplain/Water Quality and Storm Water Runoff of the DEIR/EA, and were determined to be less than significant. Specifically, there would be minimal permanent impacts on water quality because there would be a net reduction in paved area with

El Camino Real BRT Response to Agencies
21
a landscaped median extended across certain intersections. Additionally, the Project contains provisions for permanent pollution prevention design that would address potential impacts on water quality during Project operation. The potential provision of trash capture devices may be explored if requested by Caltrans as part of its strategy to meet trash capture reduction provisions.
L1-26. How will VTA select the Locally Preferred Alternative?
Selection of the Locally Preferred Alternative (LPA) will be informed by written comments and public testimony from local agencies and public, and a staff recommendation will be presented that will go through VTA advisory bodies. Ultimately, the LPA will be decided upon by the VTA Board of Directors.
L1-27. VTA shall provide and maintain trash cans at BRT stations and bus stops to prevent litter from entering the City storm drain system.
VTA will provide and maintain all trash receptacles at BRT stations along El Camino Real either with its Bus Stop Maintenance staff or through contractual agreements with Clear Channel Communications, or local jurisdictions. VTA will continue to provide solid waste services at its transit facilities, consistent with existing conditions. See also the responses to Comments L1-18 and L1-19.
L1-28. Provide a breakdown of utility impacts by city. Will there be impacts to the City by storm and sewer relocations?
An additional table will be added to the EIR/EA to provide more detail on utility impacts, including a breakdown by city. Storm and sanitary sewer manholes and pipes for which access is required would be relocated at BRT stations. Drainage inlets would be relocated to accommodate curb line construction. Utility impacts, including storm drains and sanitary sewers, will be further defined and coordinated with the cities in the final design phase.
L1-29. How will the BRT improvements impact access to sewer and storm drain manholes for pipe rehabilitation, repairs, maintenance, etc?
If manholes are located in station areas, they have been identified for relocation, along with the adjoining pipes, to more accessible areas.
L1-30. Replace “be” with “been” on page 3-27, Section 3.5.3 (last paragraph) of the DEIR/EA.
The EIR/EA will be revised as noted (replacing “be” with “been”).
L1-31. Should SCVURPPP be included in the list of regulatory agencies?
The EIR/EA will be revised to appropriately list the SCVURPPP in the regulatory setting of Section 4.9, Hydrology and Floodplain/Water Quality and Stormwater Runoff.
L1-32. The City of Los Altos does not support removing trees to accommodate bus facilities.
The comment stating that the City of Los Altos does not support tree removal to accommodate bus facilities is noted. In the design phase VTA will work with each affected jurisdiction to develop a landscaping plan that provides details on locations of trees and other plantings to replace landscaping and trees removed during construction of the Project. Trees removed by the Project would be replaced within the Project corridor, to the extent feasible. Trees with a diameter of less than 12 inches would be replaced at a 2:1 ratio. All trees with a diameter of 12 inches or more would be replaced at a 3:1 ratio. If urban trees (nonnatives and ornamentals) are replaced with native trees, a reduced mitigation ratio of 1:1 for all trees smaller than 12 inches in diameter, and 2:1 for all trees with a diameter of 12 inches or more, would be
El Camino Real BRT Response to Agencies
22
implemented. These trees would be irrigated and maintained for a period of not less than 3 years. With a more detailed design-level evaluation, trees identified for removal may be able to be preserved in place.
L1-33. Correct the spelling of San Antonio Road.
The spelling of San Antonio Road will be corrected (from San Antonia to San Antonio) on Figure 4.11-1.
L1-34. Before and after project construction, VTA shall inspect sanitary sewers and storm drains to ensure construction vibration did not damage the facilities.
VTA will determine the need for video inspection of subsurface facilities during the final design phase.
L1-35. Haul routes should comply with municipal codes.
VTA is not subject to municipal code requirements. However, to the extent feasible, VTA will coordinate with the City of Los Altos, and all other affected Project corridor jurisdictions, to eliminate potential conflicts with construction haul routes.
L1-36. Fire department stations are missing from Table 4.13-1.
The Almond Fire Station and the Loyola Fire Station in Los Altos are well over a mile away from El Camino Real and are not considered near to the corridor.
L1-37. The City has concerns about diversion and impacts at additional intersections. VTA should conduct outreach regarding a signal at Cuesta Road/Springer Road.
The Draft EIR/EA examined 247 intersections on and near El Camino Real. Intersections off of El Camino Real were analyzed for intersection level of service if they were in the model, within approximately ½ mile from El Camino Real, and experienced an increase in total intersection volume of 50 or more cars under any scenario. The particular intersections in the comment did not meet one or more of these criteria. If warranted, the analysis of additional intersections may be undertaken during the design phase.
It should further be noted that mitigation measures proposed to be funded as part of the Project, including signalization of the Cuesta/Springer intersection, would not be implemented without consultation with the relevant jurisdictions. Because the local jurisdiction is better able to ascertain the specific need, timing and public coordination for signal improvements, the implementation of this mitigation, although funded by VTA, would be the responsibility of the local jurisdiction.
L1-38. The City has concerns that some streets will be cut-through routes for diversion traffic and residents may request traffic calming improvements. What mitigations will VTA provide if cut-through traffic increases?
VTA would provide the mitigations identified in the FEIR/EA. Impacts to road segments adjacent to the affected intersections would need to be evaluated at the time the mitigation is readied for implementation, but impacts to the segments identified are expected to be less than significant. All of the locations cited, except Loucks Avenue between Los Altos Avenue and San Antonio Avenue are included in the VTA Countywide Travel Demand Model and it forecasts that the 2018 PM peak hour bi-directional volumes differ by less than 12 vehicles per hour between No build and Alternative 4c. If, after implementation of the Project, it is demonstrated that cut-through traffic resulting from the Project impacts neighborhood streets, VTA would work with cities to identify mitigation and VTA would fund mitigation.

El Camino Real BRT Response to Agencies
23
L1-39. How will VTA address unforeseen mitigation measures needed for impacts to bicycles and pedestrians?
Concurrent improvements to bicycle and pedestrian facilities on streets connecting to and around El Camino Real would be taken into account during the design phases. If new impacts from the Project are identified to City facilities that were planned or programmed at the time of the Project environmental scoping, VTA would work with cities to identify mitigation and VTA would fund feasible mitigation.
El Camino Real BRT Response to Agencies
24
5.2. City of Mountain View L2-1. Diversion of traffic graphic does not account for all vehicles taken off El Camino Real.
The "screenline" traffic volumes shown in the Draft EIR/EA only include the changes on the major "through" roads that are alternatives to El Camino Real. The total volume of vehicles diverted to these streets does not necessarily add up to the reduction on El Camino Real because it does not include those trips that shift to transit or other trip changes such as shifts to biking/walking, shifts to other minor routes because of local access choices, and shifts to travel at different times. The relevant figures/tables in the TOAR and EIR/EA will be updated to include all trips and the numbers will balance.
L2-2. Diversion has not taken into account the capacity of the parallel routes and if they have remaining capacity to accommodate diverted traffic.
The screenline link analysis presented in the Draft EIR/EA summarized the change in demand volumes for all primary alternative routes for traffic diverting off of El Camino Real. This analysis was performed for two time hours, three scenario years and seven alternatives. While the screenline analysis does not specifically include volume-to-capacity ratios, the volumes used in this analysis were based on traffic forecasts derived from VTA's Countywide Travel Demand Model. The model takes into account the capacity and relative speed/travel times for alternative routes in assigning trips.
L2-3. Need a map showing how trips are distributed across the entire street network, beyond the 0.5-mile distance from the corridor to determine number of trips per lane.
The re-distribution or diversion of trips was determined using VTA's Countywide Travel Demand Model. The model was run for each alternative (for two peak hours, for three analysis years), and the resulting demand volumes for each build alternative were then compared to the No Build Alternative (Alternative 1) to identify the change in volume or diversion. The screenline diversion figures presented in the TOAR illustrate the change in volume (i.e., diversion) expected at select locations on other key routes. As both the TOAR and DEIR/EA contain extensive and comprehensive analysis results, showing further details would significantly expand the documentation. However, plots showing the "volume difference" between the No Build (Alternative 1) and each Build alternative are available upon request by the city. These plots, generated directly from the Travel Demand Model, include all links in the model network. However, not all streets are included in the model network since some streets are small and/or discontinuous and would not provide reasonable alternative routes.
L2-4. Middlefield Road should be analyzed.
The multi-level traffic analysis approach captures the broader impacts to travel demands and patterns resulting from the Project, but also look in greater detail at locations in closer proximity to El Camino Real. Intersections were selected for additional analysis based on their inclusion in the VTA travel demand model network, proximity to El Camino Real (generally within 1/2 mile), and an increase in total intersection volume of 50 or more cars.
With respect to Middlefield Road, the expected changes in volume (i.e., diversion) were examined as part of the screenline analysis. This provides insights into potential impacts on Middlefield Road. However, Middlefield Road is over a mile away from El Camino Real in Mountain View; thus, the intersections on Middlefield Road did not meet the 1/2-mile criteria for which intersections were evaluated for level of service. Although the intersection analysis did not include locations along Middlefield Road within the City of Mountain View, impacts to
El Camino Real BRT Response to Agencies
25
Middlefield Road would be examined as part of subsequent phases if dedicated lanes in Mountain View are part of the LPA.
L2-5. What is the basis for the assumption that right of way would not be required for mitigation measures?
The DEIR/EA indicates that right of way would be required for mitigations that add lanes. All mitigation measures were examined at a planning level in order to identify the need for right of way acquisition or whether the improvements could be implemented with simple striping or widening within the current right of way. VTA makes every effort to minimize the acquisition of right of way for a project. VTA carefully weighs the benefits to the public against the costs and injury to the property owners when deciding to use its powers of condemnation for acquiring property. In the case of the traffic mitigation for this project, VTA has decided not to take any right of way from property owners unless required to as a condition of a permit or approval authority over the project because it is not necessary to build or operate BRT and is not consistent with other project purpose and needs such as enhancing the multi-modal character of El Camino Real for pedestrians and bicyclists. If the cities, county, or state requests that VTA take right of way for traffic mitigation, VTA will consider it only if there is no displacement or minimal hardship inflicted on property owners or their tenants, and the benefits of the mitigation to the public are substantial.
L2-6. VTA should implement all mitigation measures and not rely on local jurisdictions.
Because the local jurisdiction is better able to ascertain the specific need, timing and public coordination for street improvements off the El Camino Real corridor, the implementation of signal optimization, roadway striping and signal installations as mitigation, although funded by VTA, would be the responsibility of the local jurisdiction. These could be programmed in future cycles of capital improvement programs with the expectation of funding from VTA.
L2-7. Need analysis of congestion if some vehicles don’t divert.
The traffic forecasts are derived from VTA's Countywide Travel Demand Model which takes into account the capacity and relative speed/travel times for alternative routes in assigning trips, striving to give the shortest travel time to all vehicles. Given the nature and scope of the Project, the countywide model is the most appropriate tool for determining the re-distribution trips, and its use is consistent with applicable analysis requirements.
Auto travel times, which reflect congestion, do not vary much across Project alternatives because vehicles divert and the volume to capacity ratio stays approximately the same along El Camino Real. Detailed information about travel time, broken down by segment, can be found in Appendix F of the TOAR.
If fewer vehicles divert than projected by the model, impacts along El Camino Real may be somewhat worse than identified, and impacts on other routes may be somewhat less than identified. If more vehicles divert than projected by the model, impacts along El Camino Real may be somewhat less than identified, and impacts on other routes may be somewhat worse than identified. But, given that the model has already balanced the travel times throughout the system, it is unlikely that deviation from the model prediction will be substantial.
L2-8. Are remaining left turn pockets sufficient to handle additional U-turns due to removal of unsignalized and other left turns?
Where applicable, median closures were incorporated into the Travel Demand Model to capture potential diversion. In these cases, potential impacts are accounted for in the model outputs, the screenline analysis, the identification of impacted intersections, and the LOS analysis of
El Camino Real BRT Response to Agencies
26
those intersections. For minor streets and driveways not in the model, the turning movements affected by median closures were manually redistributed to adjacent intersections prior to making the intersection LOS calculations and thus are included in the analysis presented in the Draft EIR/EA.
Furthermore, details regarding LOS, delay, and queues by approach have been provided in the form of Synchro models and output reports to each city. However, given the quantity of analysis in the multi-level transportation analysis described in the General Responses, a detailed queue analysis in the DEIR/EA was considered impractical at this time. However, in 2018, the number of turns redistributed at an intersection was less than 60 in each AM peak hour scenario and in almost all of the PM peak hour scenarios. That number results in two or fewer cars added to a turn pocket in each signal cycle. There are four locations (WB at The Americana and EB at Maria Avenue in Sunnyvale, and EB at Flora Vista Avenue and WB at Calabazas Boulevard in Santa Clara) where more than 60 cars were reassigned, resulting in three or four cars are added per cycle, and only in the PM peak hour under Alternative 4c. Given the small increase in the demand for left turns at project intersections, VTA will not be conducting a detailed queue analysis at this time.
A more detailed examination of the remaining left-turn pockets, including queuing analysis, would take place during the design phase.
L2-9. Analyze impacts to cross streets beyond intersection LOS, including queuing on side streets and impacts to pedestrians and bicyclists crossing El Camino Real.
The extensive intersection LOS analysis included in the Draft EIR/EA is described in the General Responses. Due to the volume of this analysis, only the overall intersection LOS and delay was included in the documentation. The reporting of detailed LOS and queue results by approach and/or movement was considered unnecessary at this time for the purposes of CEQA. However, details regarding LOS, delay, and queues by approach have been provided to the stakeholder agencies along the corridor in the form of Synchro models and output reports. More detailed examination of operations by approach, including queuing analysis, would take place during the design phase.
L2-10. There will be aesthetic and noise impacts due to loss of trees. Does Caltrans approve of removal and replacement of trees?
Caltrans, as owner of El Camino Real and operator of the State Highway System—of which El Camino Real is State Route 82—would be responsible to review a Project Report which will describe the Project and any deviations from standard highway design, and incorporate the final EIR/EA as an attachment. Caltrans’ approval of the Project Report would represent approval of the impacts and mitigations identified in the final EIR/EA, including removal and replacement of trees. Caltrans will consider approval of the Project Report after the selection of a Locally Preferred Alternative and completion of the Final EIR/EA.
The visual analysis indicates that the potential long-term visual impacts associated with removal of a number of existing trees along the Project corridor would be addressed through replacement tree planting within medians and along sidewalks, where feasible. Trees removed by the Project would be replaced within the Project corridor, to the extent feasible. Trees with a diameter of less than 12 inches would be replaced at a 2:1 ratio. All trees with a diameter of 12 inches or more would be replaced at a 3:1 ratio. If urban trees (nonnatives and ornamentals) are replaced with native trees, a reduced mitigation ratio of 1:1 for all trees smaller than 12 inches in diameter, and 2:1 for all trees with a diameter of 12 inches or more, would be implemented. These trees would be irrigated and maintained for a period of not less than 3 years. Anticipated tree replacement could potentially result in an overall net gain of trees

El Camino Real BRT Response to Agencies
27
along the Project corridor and the long-term visual effect in some locations of trees and Project landscaping could result in an improvement of the visual character of the streetscape. Potential change in noise levels as result of tree loss, is anticipated to be negligible.
L2-11. Provide details of where the replacement trees would be located.
Trees would be replaced within the Project corridor, to the extent feasible. In the design phase, VTA will work with each City to develop a landscaping plan that provides details on locations of trees and other plantings to replace landscaping and trees removed during construction of the Project. With a more detailed design-level evaluation, many of the trees identified for removal may be able to be saved. With a net increase in pervious area/landscaped area, it is likely that all replacement trees can be planted within the corridor. A design exception may need to be approved by Caltrans to allow planting of trees in medians with less than five feet of horizontal clearance, as currently exists in some locations and has been done in Menlo Park under a recent demonstration project on El Camino Real, or closer than 100 feet from an intersection.
L2-12. Specific measures to protect existing planting and irrigation to remain should be included in the FEIR. What are impacts to existing planting and irrigation not removed and how will landscape maintenance be performed?
Specific measures for protection of existing facilities would be developed during design. In the design phase, VTA would examine in detail the connections and operations of the existing irrigation systems and ensure that irrigation design preserves existing systems, as appropriate. Construction specifications would require protection of facilities that are to remain in place. No impacts to plantings to remain are anticipated, as a very conservative approach was taken to identifying removals and areas where new landscaping would be placed.
The procedure for landscape maintenance and access would be similar to today—trucks deployed in the lane adjacent to the landscaping work. Where that lane is the BRT lane, the maintenance agency would need to coordinate with VTA to advise BRT drivers of work in the vicinity. BRT buses would need to leave the BRT lane for a short distance and reenter past the maintenance trucks. Landscape planting requiring immediately adjacent truck access (tree trimming) would not be installed within a certain distance of median stations to ensure that buses could get back into the BRT lane in advance of the station.
L2-13. What are the impacts to bicyclists from removal of left-turn pockets and to existing bicycle network crossings? How does the Project support City land use and policy related to pedestrians and bicyclists?
Under alternatives with dedicated lanes in the City of Mountain View, left turn pockets would be removed at a maximum of six locations (Crestview Drive, Dale Avenue, between Yuba Drive and State Route (SR) 85, between Mariposa Avenue and Pettis Avenue, Distel Drive, and Ortega Avenue). Of these, the first four of these involve turn bays for vehicles turning off of El Camino Real only (left turns onto El Camino Real and pedestrian crossing is currently prohibited), while at the last two existing signals would be removed. At the same time, new pedestrian crossings would be implemented at Crestview Drive and Mariposa Avenue/Pettis Avenue; and a new signal installed at Distel Circle between Distel Drive and Ortega Avenue. These improvements would minimize any impacts to bicyclists and improve pedestrian crossings. For locations where left turn bays are removed and a new pedestrian crossing is not provided, the distance to the nearest left turn is between 400 and 600 feet.
All of the alternatives include bicycle/pedestrian/streetscape improvements which would be generally supportive of bicycle/pedestrian goals in the relative policy documents. For example, the BRT vehicles would accommodate bicycles both inside and outside. New pedestrian

El Camino Real BRT Response to Agencies
28
signals would be installed in Mountain View at Crestview Drive for Alternatives 4a-4c and at Pettis Avenue under Alternatives 4b and c. New bicycle lanes along El Camino Real would also be constructed. None of the alternatives would interrupt or otherwise impact bicycle facilities that cross or connect to El Camino Real.
L2-14. Provide exhibits to show shortened crossing distances and pedestrian enhancements.
See Figures in Section 4.2 of the DEIR/EA that provide photosimulations of the stations, including depiction of crossings. Any further development of exhibits demonstrating pedestrian crossing amenities would take place as part of a subsequent design phase.
L2-15. Need more detail on loss of parking and impact to parking on side streets.
The 336 on-street spaces along El Camino Real in Mountain View are supplemented by approximately 3,500 off-street public spaces. Midday parking occupancy was observed at 8 percent for the on-street spaces, 51 percent for the cross-street spaces, and 46 percent for the off-street spaces. Because of the remaining off-street capacity and low utilization of spaces on El Camino Real, there should not be significant impacts to cross street parking. A more detailed examination of parking impacts may be conducted during the design phase.
If a city determines that parking is essential, it may coordinate with VTA to exclude bike lanes from the Project construction and retain parking.
L2-16. Need more detail on impact to businesses of loss of parking and need more outreach.
While the displacement of existing parking spaces is not considered a significant impact under CEQA, an aggregate level assessment of impacts to the parking supply was conducted as part of the Draft EIR/EA to allow for the comparison of Project alternatives. More focused analysis may take place after the selection of the LPA.
If a city determines that parking is essential, it may coordinate with VTA to exclude bike lanes from the Project construction and retain parking.
L2-17. What is the coordination with Caltrans? The City would like to participate in that.
VTA met almost monthly in Project Development Team (PDT) meetings with planning and engineering staff from each of the cities throughout the conceptual development of the BRT alternatives. Caltrans was frequently invited to those meetings as well, and other coordination meetings with Caltrans have taken place at Caltrans District 4 offices in Oakland. Caltrans approved a Project Study Report (Project Development Support) in February 2014, which was provided to the cities. As a responsible agency, Caltrans has reviewed and provided comments on the DEIR/EA. Going forward, VTA would submit to Caltrans a Project Report. Approval of the Project Report by Caltrans constitutes approval of the Project, although detailed coordination would continue throughout design and Caltrans would need to issue an encroachment permit for construction work in the State highway right of way. It is anticipated that PDT meetings would continue throughout design and would involve both Caltrans and the cities, as appropriate.
L2-18. How does the Project support local planning, particularly the City of Mountain View 2030 General Plan?
The City of Mountain View 2030 General Plan is discussed in detail in Appendix E, Regulatory Setting, of the EIR/EA. Goals and policies from the Mountain View 2030 General Plan that are relevant to the Project are described on Page E-40. As noted in Appendix E, at the time of the Draft EIR/EA, the San Antonio Precise Plan and the El Camino Real Price Plan had not yet been adopted and were, therefore, not described in detail.

El Camino Real BRT Response to Agencies
29
Similarly, the applicable General Plans of other jurisdictions along the Project corridor were included in Appendix E.
L2-19. ABAG population and employment data does not match what the City has used in the 2030 General Plan and so the Project may have underestimated cumulative growth.
As the Project is partially federally funded, it is required that the latest adopted regional forecasts be used in the forecast modeling process. Use of VTA's Countywide Travel Demand Model, which uses the ABAG 2013 land use projections, is consistent with this requirement.
L2-20. The Project should use the same assumptions for land use and development as the El Camino Real Precise Plan and 2030 General Plan.
See the response to Comment L2-19.
L2-21. Because it doesn’t use the same assumptions as the General Plan, the Project underestimates traffic volumes and intersection delays.
See the response to Comment L2-19.
L2-22. The Transportation Management Plan should describe specific details regarding maintaining access for all modes during construction.
The Project includes the development of a Transportation Management Plan (TMP). The TMP will include measures to reduce the temporary construction impact to pedestrian and bicycle facilities, as well as to automobiles, to a less-than-significant level. The details of these measures will be developed during the design phase as which time the requirements listed in the comment will be taking into consideration.
L2-23. Construction noise should be constrained to conform to the Mountain View City Code and specific measures are needed to protect nearby residential units from noise impacts.
VTA is not subject to municipal code requirements such as Section 8.70.1 Construction noise (Mountain View City Code). However, to the extent feasible, VTA will coordinate with the City of Mountain View, and all other affected Project corridor jurisdictions, to eliminate potential conflicts related to construction noise.
L2-24. Identify all “neighborhoods of concern,” including low-income block groups.
The statement that “no neighborhoods or communities of concern have been identified” was made in the Socioeconomics section (Chapter 5.14) and refers to areas within the study area that are differ significantly with respect to demographic characteristics from the study area cities or region. This is based on 2010 census data. The study area for socioeconomic analysis is defined as the 46 tracts in the 2010 U.S. census located in or adjacent to the El Camino Real corridor.
Census data for income statistics is only available at the census tract level. As discussed in the Community Impact Assessment supporting the DEIR/EA, within the City of Mountain View the study area has lower levels of low-income residents than the city as a whole. Approximately 3 percent of the study area population in Mountain View would be characterized as low-income compared to approximately 4 percent for the entire City. These statistics are based on 2010 census data. Six census tracts in Mountain View are identified as having “low-income environmental justice populations” defined conservatively as having low-income populations higher than the City of Mountain View’s low-income population. Of these six tracts, only one (Census Tract 5094.03) has a low-income population that is greater than 10 percent (rather it is 12.8 percent), which is well below the 38.2 percent to 64.7 percent of households cited in the comment.

El Camino Real BRT Response to Agencies
30
L2-25. VTA should clarify some of the varying ridership numbers expressed.
The transit ridership presented in Table 2-2 of the TOAR, taken from the VTA's Transit Service Plan 2014-2015, is the average weekday ridership for July - November 2012 (first and second quarters of fiscal year 2013) for the entire route (Eastridge to Palo Alto).
The transit ridership presented in Table 4.12-8 represents the average weekday ridership within the Project corridor only (Cahill to Palo Alto) based on data from November 2013. Thus, the ridership totals are not directly comparable. Table 4.12-1, however, presents November 2013 ridership data for both the Project corridor (12, 512) and the entire route (20,792). In this case, the latter is directly comparable to the information presented in Table 2.2 of the TOAR.
The reference to ridership of over 100,000 on page 3-2 should correctly refer to total system ridership not combined ridership on Lines 22 and 522. The total system ridership presented in the Transit Service Plan 2014-2015 is 105,348, of which the combined ridership for Lines 522 and 22 represents about 19 percent. This will be corrected in the final EIR/EA.
Note: A typographical error has been noted and will be corrected in Tables 4.12-1 and 4.12-8 (the number for the Line 522 ridership should be 3,287 rather than 3,278 and the total Line 522 ridership should be 12, 521 rather than 12, 512).
L2-26. Lane geometry appears to be modeled incorrectly at the El Camino Real intersections with Rengstorff Avenue, Escuela Avenue, and El Monte Avenue. In addition, signal cycle lengths were modeled incorrectly.
The geometry of the identified intersections was checked using aerial photographs available on-line.
• El Camino Real/Rengstorff Avenue: The coded geometry is consistent with observed striping. It appears that the northbound driveway is wide enough to allow for two lines of vehicles; however, it is not striped as such. Given the low volume of traffic on this approach, any change would have minimal impact.
• El Camino Real/Escuela Avenue: The northbound driveway is coded as a single lane but was modified in late 2011/early 2012 to include 2 lanes (left through and right-turn). This changed occurred after the initial field investigations to verify geometry. However, counts at this location were updated after this change. The Synchro model will be updated accordingly to indicate a slight reduction in average delay.
• El Camino Real/El Monte Avenue: The coded geometry is consistent with observed striping. In the field, the eastbound right turn occurs upstream of the intersection and is therefore coded as a free right. This is consistent with the coding in the CMP TRAFFIX database. The southbound driveway was not included as it appeared to be "in" only, there were no observed exiting vehicles, and the approach does not have a signal head.
The intersection analysis was initiated in 2012 and all scenarios completed in early summer 2014. This analysis was conducted using the signal timing plans provided by Caltrans (and other responsible agencies where applicable) at the time that analysis was initiated. The timing parameters used in the Synchro models have been checked to ensure consistency with the provided timing plans. It is important to note that because many intersections operate as uncoordinated, actuated signals, the average cycle length varies and depends on actual traffic volumes.

El Camino Real BRT Response to Agencies
31
L2-27. What is the current (2013 or 2014) travel speed for automobiles in the PM eastbound direction?
Current (2013) average travel speed for automobiles is 26.4 mph in the PM peak eastbound direction.
L2-28. The Grant Road “farm parcel” was developed for single family homes in 2008.
The description of historic and architectural resources in Santa Clara County in Section 4.5.2.2 will be revised to remove reference to the scattered areas of undeveloped land in Mountain View.
L2-29. The elevation on El Camino Real at Castro Street is approximately 106 feet above mean sea level.
Table 4.9-3 will be revised to show depth to water and groundwater elevation ranges based on information from the State Water Resources Control Board. These data accurately reflect the surface elevations in the area.
L2-30. The California Water Service Company serves a portion of the city of Mountain View. The City provides water for the remainder, purchases water from the SFPUC and SCVWD, and uses local groundwater.
The description of water use in the City of Mountain View will be revised to accurately update water supply in Mountain View.
L2-31. The City provided copies of written correspondence from members of the public.
The comment regarding the enclosed copies of e-mails and other written correspondence that the City of Mountain View has received is noted. VTA is responding to comments sent directly to VTA received during the extended Draft EIR/EA public comment period (October 29, 2014 to January 14, 2015). The comments attached to the City of Mountain View’s comment letter are included in the administrative record as attachments, but have not been formally responded to.

El Camino Real BRT Response to Agencies
32
5.3. City of Palo Alto
L3-1. Existing transit signal priority (TSP) equipment is not providing the benefit it was intended to provide. Queue Jump Lanes should be explored and tested.
To be effective in producing travel time improvements on a corridor-wide basis that are similar to dedicated lanes, it would likely be necessary to implement "true" queue jump lanes, as described in the comment, at many of the intersections along El Camino Real. Doing so would also involve many of the same trade-offs in terms of parking loss and conversion of existing travel lanes, such as the acquisition of right of way for additional lanes. Furthermore, the integration of the physical queue jump with TSP, or pre-emption as described in the comment, is likely to be unacceptable to those agencies responsible for traffic operations along the corridor. In developing the TSP parameters currently implemented, constraints were placed on the amount of "priority" (i.e. early green or extended green) allowed due to concerns about the impact to other vehicles. TSP was not implemented at some locations due to similar concerns. Based on this, further implementation of queue jump lanes and enhancement to TSP operations, within the likely constraints, would not produce the travel time improvements comparable to the dedicated lanes. It should be noted, however, that all Build alternatives do include enhancements to the current TSP system.
L3-2. The Project should not be limited exclusively to the El Camino Real corridor. Lower fares for shorter trips, free transfers to other systems and expanded use of the ECO Pass should be considered. VTA should take a leadership role in developing alternatives to private automobiles.
The Project purpose and need is essentially to improve bus service on El Camino Real. VTA completed the BRT Strategic Plan in 2009 which identified El Camino Real as one of the most promising bus corridors for improvements and therefore has limited the scope for this analysis to the El Camino Real corridor. VTA has also recently undertaken a study to examine north-south bus routes that cross El Camino Real and regularly reviews its service plan to identify other improvements. In addition, VTA has recently proposed to expand the youth discounted fares to include youths through age 18, to permanently reduce the standard pricing for bulk sales of Day Pass tokens, and provide a credit for transfers between transit systems that would be standardized throughout the Bay Area. While there are many worthy projects that could be considered, they are not the subject of this environmental analysis.
L3-3. Existing travel times for transit are overstated and for automobiles are understated.
The existing transit travel times reported are derived from the published transit schedules which are periodically revised based on actual travel times. The transit times in the base year Travel Demand Model are calibrated to these values.
L3-4. Request for raw data to validate travel times.
The auto travel times are derived primarily from the VTA Countywide Travel Demand Model, with limited validation to observed travel times. Because the objective was to use the expected difference in travel times (not necessarily the absolute travel time) as a basis for comparing alternatives, it was necessary to use a methodology that would allow for the forecasting of future year travel times. The model was validated at the countywide level.

El Camino Real BRT Response to Agencies
33
L3-5. Some bicycle facilities are incorrectly classified; project should extend bicycle facilities along side streets to El Camino Real.
The descriptions/classifications presented in Table 4.12-5 refer to the bike facilities on those streets, not specifically to the type of facility right at the intersection with El Camino Real. Text will be edited to clarify this. With respect to future improvements, the Project will be responsible for implementing bike lanes on El Camino Real in areas of dedicated lanes as shown on the Project plans in Appendix B of the DEIR/EA; however, bicycle facility improvements to cross-streets are not proposed as part of the Project. If the city desires to implement bike lane improvements on cross-streets, VTA would coordinate with city staff on improvements that could possibly be completed at the same time as construction on El Camino Real.
L3-6. Clarify why ridership increases in the near-term and if buses can accommodate that many passengers. Existing and projected peak hour boarding data is missing.
A near-term increase in ridership between 2013 and 2018 even in the No Build condition would likely occur as a result of the planned improvement in frequency of Line 522. With the implementation of the SCAR BRT, Line 522 will change from a 15-minute frequency to a 10-minute frequency in 2016. An assessment of the hourly load factors for the proposed BRT 522 line at screenline locations was conducted for Alternative 4C under 2018 and 2040 AM and PM peak hour conditions. Hourly BRT capacity was calculated by multiplying the assumed transit vehicle capacity (108 including seated passengers plus standees) by the number of buses per hour (6 based on 10 minute headway). A range of hourly BRT capacities was calculated to reflect different possible vehicle specifications. Transit load factors for 2018 were found to be below 50 percent in all cases. For 2040, average hourly load factors were calculated to reach as high as 96 percent. This analysis indicates that the proposed BRT service would be able to accommodate the projected levels of demand.
VTA measures and evaluates ridership on the basis of daily boardings rather than peak hour boardings.
L3-7. Clarify why ridership increases so much from 2013 to 2040.
A substantial increase in ridership is expected between 2013 and 2016 when the increased frequency on Line 522 is implemented. Annual increases after that are comparable to increases seen in the years preceding the analysis. Transit ridership forecasts were derived from the VTA Travel Demand Model. Similar to the traffic volume forecasts, the model's forecasted growth in transit ridership was added to the observed transit counts to produce forecasted transit ridership for the study corridor. The Travel Demand Model takes into account assumptions about population and employment growth, traveler mode choice preferences, transit service improvements, and relative modal travel times in determining transit ridership forecasts. Additional detail regarding the specific Travel Demand Model mode choice functions can be provided upon request.
L3-8. How do population/employment forecasts, travel time, and distance influence ridership/dedicated lane relationship assumptions? How do the percentage increases in ridership compare with existing ridership in each city?
The underlying demographic data used in the VTA Countywide Travel Demand Model is based on ABAG 2013 projections and do not change between alternatives within a given year. Since VTA plans to apply for federal funding the Project must use the accepted regional forecasts for employment and population; these are the ABAG 2013 projections. The change in ridership between alternatives is a function of operating characteristics, notably travel time. The presence of BRT lanes produces increased transit ridership by reducing the BRT travel times

El Camino Real BRT Response to Agencies
34
relative to mixed flow travel times for auto and transit. This results in increasing numbers of travelers choosing the BRT mode as the length of the dedicated lane segment increases. In 2018, BRT travel time decreases up to 45 percent in the eastbound direction during the PM peak hour, between the No Build (Alternative 1) and Alternative 4C. Figures 23 through 26 in the TOAR show the estimated 2018 westbound and eastbound travel times by mode for each alternative during the AM and PM peak hours. Similar information for 2040 is presented in Figure 34 through Figure 37 of the TOAR. Detailed information about travel time, broken down into segments, can be found in Appendix F of the TOAR. Existing (2013) ridership on Line 522 by stop can be found in Appendix B of the TOAR.
L3-9. The DEIR/EA should provide a link level of service analysis.
The multi-level transportation analysis approach was undertaken in response to the nature (i.e., transit project) and scope (i.e. 17.6-mile long corridor) of the Project. This approach captures the broader impacts to travel demands and patterns resulting from the Project, but also looks in greater detail at locations in closer proximity to El Camino Real. While the screenline analysis does not specifically include volume-to-capacity ratios, the volumes used in this analysis were based on traffic forecasts derived from VTA's Countywide Travel Demand Model and volume-to-capacity ratios can be calculated. The model takes into account the capacity and relative speed/travel times for alternative routes in assigning trips. Furthermore, operations on arterial streets are generally governed primarily by intersection operation and for that reason, the analysis focused on intersection rather than link level impacts.
L3-10. The DEIR/EA should include a Traffic Impacts on Residential Environments (TIRE) analysis.
Traffic Intrusion on Residential Environments (TIRE) analysis is most applicable to neighborhood residential streets, where the length of trip is approximately one mile or less. The average trip length of automobiles on El Camino Real is five to seven miles. Due to the non-contiguous nature of local residential streets, the diversion of these longer-distance trips to local streets, where TIRE analysis is applicable, is not expected. In addition, trips identified to take another route, mode or time would be dispersed to many streets if not to bikes, walking or transit. While a TIRE analysis might indicate perceptible levels of diversion on smaller streets, it is likely the resultant volumes are well within the typically acceptable capacity of residential streets.
L3-11. The DEIR/EA does not provide adequate mitigation for impacts along Alma Street and El Camino Real.
Mitigation measures that would reduce impacts to less than significant levels are identified for seven of the ten off-corridor Palo Alto locations listed in Table 4.12-22 (2040 impacts). Of these seven, four locations are also impacted in 2018. The proposed mitigation measures at these four locations would be funded for 2018 mitigation as part of the proposed Project and implemented by the city. For the other three locations with identified mitigation measures, the "fair share" approach was taken in recognition of the fact that the Project is but one factor in cumulative growth in traffic at these locations. Indeed, multiple intersections on Alma are forecasted to operate at LOS F under the 2040 No Build scenario. VTA has committed to contributing a fair share to future traffic mitigations, for their implementation as the needs arise. For the final three of ten locations, mitigation strategies are identified; however, the 2040 impacts are identified as "significant and unavoidable" because the potential strategies would require acquisition of right of way.

El Camino Real BRT Response to Agencies
35
L3-12. Mitigation on Alma Street should refer to Program T-39 rather than Policy T-8. The DEIR/EA should include a link level of service and progression analysis along Alma Street.
The statement regarding the current program of not adding traffic signals in certain segments of Alma Street will be revised to refer to Program T-39 instead of Policy T-8.
With respect to the request for additional analysis, specifically the link LOS, it is important to note that arterial operations are generally governed primarily by intersection operation. This intersection analysis was performed as part of the Draft EIR/EA to provide a means of comparing alternatives. Further study, including progression analysis, may be conducted, as appropriate, during future phases.
L3-13. The DEIR/EA should discuss grade-separating the Caltrain tracks at intersections along Alma Street to improve traffic operations and consider contributing to such projects as mitigation for cumulative impacts of the BRT and Caltrain Electrification projects.
The DRAFT EIR/EA does identify mitigations to address the impacts along Alma Street. As noted in the response to Comment L3-10, mitigation measures that would reduce impacts to less than significant levels are identified for seven of the ten Palo Alto locations listed in Table 4.12-22. For the final three locations, mitigation strategies are identified, however, the 2040 impacts are identified as "significant and unavoidable" because the potential strategies would require acquisition of right of way.
It should also be noted that several of the impacted intersections are currently unsignalized; therefore the LOS analysis methodology and results reflect the impact only to the minor street approach. In these cases, the primary Alma Street movements are not affected.
The consideration of possible grade separation along Alma Street to address long-term, cumulative growth is beyond the scope of the proposed Project. The Caltrain electrification project is included in the Travel Demand Model for cumulative (2040) impacts, but that project does not grade separate streets crossing the railroad.
L3-14. The DEIR/EA should include an analysis of Middlefield Road and Foothill Expressway as well as the cumulative impacts of the County project on Foothill Expressway.
The multi-level approach captures the broader impacts to travel demands and patterns resulting from the project, but also looks in greater detail at locations in closer proximity to El Camino Real. Although intersections along Middlefield and Foothill in Palo Alto were not included as part of the intersection analysis, since they did not meet all the criteria determining which intersections would be evaluated, these facilities are included in the screenline analysis. Intersections taken to the next level of the multi-level analysis had to be in the Travel Demand Model, be within approximately one-half mile of the El Camino Real corridor, and have an increase in total intersection volume of 50 or more cars. Middlefield Road is almost a mile away from El Camino Real in Palo Alto, and Foothill Expressway is over a mile away, so intersections on these facilities did not meet the distance criterion for evaluating intersections. Although the intersection analysis did not include locations along Middlefield Road and Foothill Expressway within the City of Palo Alto, impacts to these facilities would be examined as part of subsequent phases if dedicated lanes in Palo Alto are part of the LPA.
With respect to diversion from Alma, the assignment of trips was based on traffic forecasts derived from VTA's Countywide Travel Demand Model. The model takes into account the capacity and relative speed/travel times for alternative routes in assigning trips. As such, the model takes into account the level of congestion on various routes in re-assigning trips diverted from El Camino Real and seeks equilibrium among various congested routes.

El Camino Real BRT Response to Agencies
36
L3-15. The DEIR/EA should model boarding times, including seniors, bicycles, and passenger lift deployment and quantify the level of service impact.
Boarding time was taken into account in two different stages of the analysis. First, an average boarding time at the stations was used when applying the VTA’s Countywide Travel Demand Model. Second, in the intersection operational analysis, boarding times were taken into account as bus blockage factors in order to evaluate the impacts to corridor traffic as part of those alternatives with bulbout stations. Boarding dwell time at median stations does not affect intersection level of service. Detailed modeling of boarding activity at individual stops is not appropriate at this phase.
L3-16. The DEIR/EA should include a weaving analysis to examine vehicles moving from the #3 lane around a bus at a curbside station.
As noted in the response to Comment L3-15, boarding activity was taken into account in the form of bus blockages in the Synchro intersection analysis. Based on the limited number of buses (six per hour for Line 522 and four per hour for Line 22) and typical dwell time (average of 36 seconds), the impact of these blockages was found to be limited. In general, the added delay was small, on the order of 0.1 seconds, and many intersections experienced no change in delay. Ultimately, there was no change in LOS for any of the intersections where bus blockages were added. Detailed modeling of boarding activity at individual stops is not appropriate at this phase.
L3-17. Final design should consider innovative pedestrian and bicycle intersection treatments and station amenities.
The Project would be responsible implementing bike lanes on El Camino Real in areas of dedicated lanes (only Alternative 4C for Palo Alto). Under Alternative 4C, a number of modifications would also be made at the El Camino Real /Charleston-Arastradero intersection. These include removal of the free right turn pork chop islands on the northeast and southeast corners, and extension of the sidewalk area at the northwest corner. These modifications are illustrated in the conceptual layout drawings provided in Appendix B. However, because no modifications will be made to the cross-streets, bicycle facility improvements to those streets are beyond the scope of the proposed Project. Nevertheless, final design would be coordinated with the City and would detail the specific intersection treatments determined to be appropriate. Site-specific station design would need to balance the cost of providing amenities such as water fountains or bike servicing facilities with the potential for their use when patrons are at the BRT stations for short intervals. Stations would be designed to be well-lit and have trash receptacles.
L3-18. Improved transit facilities are needed at Page Mill Road. The project should include dedicated northbound right turn lanes in mixed flow conditions that could be used as a queue jump lane for transit; a similar treatment could be applied to NB/SB left turn lanes.
Providing improvements to local bus stops would be part of a different project for the VTA, undertaken as part of any of several studies that examines improvements to current services, such as the Transit Passenger Environment Plan. Currently queue jump facilities are provided at the Page Mill Road location. In addition, improvement measures requiring right of way acquisition, such as the suggested right-turn lanes which were considered as mitigation for Project impacts, were deemed infeasible.
El Camino Real BRT Response to Agencies
37
L3-19. VTA should consider place-making measures at the California Avenue location including signs and treatments similar to recent Stanford Avenue intersection improvements.
During the design phase, if the LPA includes construction of the California station, VTA would coordinate with the City to incorporate place-making measures undertaken by the City and to ensure that intersection improvements are consistent with the City’s other recent improvements and Caltrans standards, as appropriate.
L3-20. City supports addition of the Churchill Station for future or seasonal BRT service.
The comment regarding support for a future or seasonal Churchill BRT station is noted. A Churchill station would marginally increase ridership without detracting from ridership at other proposed BRT stations, but adds to the Project cost.
L3-21. VTA should consider tiered pricing with lower fares in town to increase ridership.
The Project proposes maintaining the same fares as the rest of the VTA transit system, which are some of the lowest in the Bay Area. However, VTA has recently proposed some modifications to the fares which would also apply to the BRT. VTA has recently proposed to expand the youth discounted fares to include youths through age 18, to permanently reduce the standard pricing for bulk sales of Day Pass tokens, and provide a credit for transfers between transit systems that would be standardized throughout the Bay Area.

El Camino Real BRT Response to Agencies
38
5.4. City of San José L4-1. City prefers Alternative 4c.
The City of San José’s preference for Alternative 4c and maximizing the length of dedicated lanes is noted.
L4-2. The City would like to explore consolidating bus stops between McKendrie and University to a BRT station at Hedding.
Station locations were chosen based on the level of use of the existing bus stops, proximity to major destinations, and concentration of commercial areas. These locations were confirmed in the 2009 BRT Strategic Plan and validated in the review of city general plans. Additional optional stations were examined as requested during the environmental document scoping process. The four bus stops between University Avenue and McKendrie Street serve as Line 22 stops. The ridership at each of these stops is not high and combined does not meet the Service Design Guidelines standards for BRT.
L4-3. The City will be modifying the intersection of Hedding and The Alameda to remove pork chop islands.
The comment regarding the modification to the intersection of Hedding and The Alameda with The Alameda Phase 2 Improvement Project is noted. Coordination with the city and refinements to specific intersection geometry to incorporate planned modifications would be undertaken during future design phases when detailed mapping is available.
L4-4. The intersection at The Alameda/Hanchett Avenue has been modified to include curb bulbouts.
The comment regarding the construction of the bulb-out at the intersection of Hanchett Avenue and The Alameda as part of The Alameda Phase I Project is noted. Coordination with the city and refinements to specific intersection geometry to incorporate planned modifications would be undertaken during future design phases when detailed mapping is available.
L4-5. Refer to The Alameda Phase I improvement plans for current curb geometry from Stockton to Fremont.
Drawings in Appendix B will be updated to reflect the as-built curb geometry from Stockton to Fremont.
L4-6. The Alameda Phase 1 was completed on 10/14/14.
The date that Phase 1 of The Alameda was completed (10/14/14) will be added to Chapter 3, Project Alternatives.
L4-7. Edit text to refer to Alameda Phase 2
The recommended text regarding The Alameda Phase 2 Improvements Project, indicating that the project is currently in design and that final design is anticipated to be complete by early 2015 and construction will begin in summer 2015, will be added to Chapter 3, Project Alternatives.
L4-8. Edit text to refer to completed improvements from The Alameda Phase I project.
Refer to Page 4.2-3. The recommended text regarding The Alameda Phase 1 will be added to Section 4.2, Aesthetics.
The comment regarding The Alameda Phase 2 extending improvements from Fremont Street to I-880 is noted.

El Camino Real BRT Response to Agencies
39
L4-9. Note that The Alameda west of I-880 was not relinquished to the City of San José and remains under Caltrans jurisdiction.
The text will be revised to indicate that the portion of The Alameda west of I-880 has not been relinquished and is under Caltrans’ jurisdiction.
L4-10. Verify whether or not the Project will install TVMs.
VTA has recently determined that ticket vending machines (TVMs) would not be installed on station platforms as part of the Project, and sections of the EIR/EA will be revised accordingly. VTA would install Clipper card readers on station platforms to provide off-board fare collection as part of the Project to speed up boarding. Clipper card readers will also be present on the buses, and those patrons without Clipper cards would have the option of paying cash on the buses.
L4-11. Please clarify the headways for operations.
Line 522 would operate at 10-minute headways. This was identified as the preferred operating plan in the VTA Bus Rapid Transit Strategic Plan from 2009, which post-dates the FEIR for the Santa Clara/Alum Rock BRT. More recently, VTA has confirmed this frequency in the FY 16-17 Transit Service Plan for Line 522 from Palo Alto to Eastridge. VTA updates the Transit Service Plan frequently in response to changing demands and ridership patterns. Major service changes are preceded by public review and input and are enacted with the approval of the VTA Board of Directors.
L4-12. Based on SCAR, City experience is that construction impacts are significant and largely unavoidable.
A Transportation Management Plan would be developed to minimize impacts to businesses and turning movements, but some disruption due to construction will occur. Impacts at individual locations where access and turning movements are temporarily restricted would be unavoidable.
L4-13. In Section 3, clarify the headways for operations
Regarding the headways for BRT, see the response to Comment L4-11.
L4-14. Recordation of the relinquishment of the subject portion of SR 82 to the City took place on December 28, 2011.
The date that The Alameda was relinquished will be clarified to identify the date of recordation on December 28, 2011.
L4-15. Edit text to be specific about coordination with individual jurisdictions.
The text will be to indicate that bike lane striping, crosswalk striping, and additionally pedestrian crossings would be provided in coordination with local jurisdictions. VTA will coordinate with each affected jurisdiction during the final design phase to develop appropriate details.
L4-16. The Project should consider shorter platform lengths through the design process.
As described in Chapter 3, Alternatives, median BRT stations would have 90-foot-long platforms for exclusive BRT use. In mixed flow segments, BRT curbside bulbout stations would be located along the curb and have approximately 160-foot-long curbside bulbouts to allow simultaneous use by a 60-foot BRT vehicle and a 40-foot local bus. The active platform area (area where station amenities and canopies would be installed) would be 90 feet for most curbside platforms; platforms at California and Race/Julian stations would be shorter. Adjustments to the platform lengths may be considered during future design phases.

El Camino Real BRT Response to Agencies
40
L4-17. What is the on-board payment system? Will on-board payment increase dwell times?
VTA has recently determined that ticket vending machines (TVMs) would not be installed on station platforms as part of the Project, and sections of the EIR/EA will be revised accordingly. VTA would install Clipper card readers on station platforms to provide off-board fare collection as part of the Project to speed up boarding. Clipper card readers will also be present on the buses, and those patrons without Clipper cards would have the option of paying cash on the buses. On-board fare collection is expected to be infrequent and, on average, would not affect the dwell times modeled.
L4-18. Is the acquisition of temporary construction easements included in the capital cost estimates?
Temporary construction easements have not been identified at this time. During final design, when elevation information is available, the need for and extent of temporary construction easements will be defined.
L4-19. The visual assessment should include that mature trees contribute to the character of the corridor.
The text regarding visual character of The Alameda will be revised to indicate that the mature trees contribute to the character of the corridor.
L4-20. To the extent possible, the Project should save as many trees as possible.
The comment regarding the City of San José’s request for the Project to save as many trees as possible within the station areas is noted. The analysis of potential tree removal has taken a conservative approach and identified trees for removal if they are adjacent to the construction. In the design phase, VTA will work with each affected jurisdiction to develop a landscaping plan that provides details on locations of trees and other plantings to replace landscaping and trees removed during construction of the Project. With a more detailed design-level evaluation, trees identified for removal may be preserved in place.
L4-21. Lafayette Street is in Santa Clara, not San José.
The text will be revised to indicate the Lafayette Street is in Santa Clara, not San José.
L4-22. Why are so many trees being removed for 74-foot platforms?
All eight trees would be removed between Shasta and Hanchett Avenues because the new BRT platform would also construct curbside bulbouts and curb improvements that would extend the length of the block in accordance with the City’s planned improvements on The Alameda. As identified in consultation with city staff, VTA would be responsible for construction of the bulbouts for the length of the block. Similarly, five trees would be removed at Julian Street to accommodate the curbside bulbout. However, in the design phase, VTA will work with each affected jurisdiction to develop a landscaping plan that provides details on locations of trees and other plantings to replace landscaping and trees removed during construction of the Project. With a more detailed design-level evaluation, trees identified for removal may be preserved in place.
L4-23. New bike lanes have been installed on Santa Clara Street and on Stockton Avenue, and are planned on Hedding Street.
Text will be revised to reflect that “new bike facilities have been installed in San José on Santa Clara Street between the Guadalupe River Trail and Stockton Avenue, and that bike lanes are planned on Stockton Avenue north of Santa Clara Street. An extension of the existing bike lane on Hedding Street, crossing The Alameda, is also planned.”
El Camino Real BRT Response to Agencies
41
5.5. City of Santa Clara L5-1. City would prefer replacement of trees in proximity to the corridor rather than in-lieu
payment. Clarify how median landscape maintenance will be accomplished in dedicated lane configurations when truck/equipment access is needed from adjacent lanes.
VTA will coordinate with the City of Santa Clara, as it will with all affected Project corridor jurisdictions, to identify appropriate locations for tree replacement, ideally in proximity to the Project corridor per the jurisdiction’s preference. The procedure for maintenance access would be similar to today—trucks deployed in the lane adjacent to the landscaping work. Where that lane is the BRT lane, the maintenance agency would need to coordinate with VTA to advise BRT drivers of work in the vicinity. BRT buses would need to leave the BRT lane for a short distance and reenter past the maintenance trucks. Landscape planting requiring immediately adjacent truck access (tree trimming) would not be installed within a certain distance of median stations to ensure that buses could get back into the BRT lane in advance of the station.
L5-2. City requests that noise coordinator contact number be answered live 24 hours a day during construction. City construction hours should be included in DEIR/EA.
VTA is not subject to municipal code requirements such as the Chapter 9.10 Regulation of Noise and Vibration (Santa Clara City Code). However, to the extent feasible, VTA will coordinate with the City of Santa Clara, and all other affected Project corridor jurisdictions, to eliminate potential conflicts related to construction noise. In addition, the DEIR/EA identifies that a Transportation Management Plan (TMP) would be developed for the Project in conjunction with Caltrans and each of the local municipalities prior to construction. The TMP would define the strategies to be used to keep the public informed during each stage of the project construction. Typical strategies that may be discussed in the TMP for reporting problems include a telephone hotline, a project website, and community meetings.
L5-3. VTA should consider using VISSIM since Synchro does not model TSP.
As the arterial operations are governed by the traffic controls at the intersections, Synchro was selected for evaluating arterial and local street traffic operations and potential impacts. Synchro is the industry standard for planning-level intersection LOS analysis. While TSP is not explicitly modeled in Synchro, TSP will have only an occasional effect on traffic as it is activated only when a bus approaches the intersection (6 times per hour per direction for BRT), only when needed, and only if it was not activated in a recent cycle (depending on final parameters). The number of bus blockages during each period was factored into the existing and future scenario models to reflect the number of buses per hour according to the respective service frequency for each scenario. A more detailed analysis, including visual simulation software such as VISSIM, may be provided during the design phase.
L5-4. The diversion criterion of 50 vehicles per hour (vph) increase is not consistent with VTA guidelines of 10 vehicles per lane.
The preliminary analysis investigated the increase of vehicle-trips per hour on intersections within the study area. The goal was to identify intersections along the main diversion routes, which were expected to serve the majority of diverting traffic. The Countywide Travel Demand Model was used for this preliminary analysis; however, the model is validated to reflect travel choices on a macroscopic scale. The criterion of 50 vph was developed in order to identify diversion routes. A more sensitive criterion would fall within the error percentage of the model and would not necessarily provide the needed information about diversion routes.
The study focused first on identifying major diversion routes, second on identifying intersections along those routes, and finally on conducting a detailed LOS analysis on those intersections.
El Camino Real BRT Response to Agencies
42
Given that the level of analysis conducted was intended to facilitate comparison among Project alternatives, these criteria were considered adequate for the purposes of CEQA.
L5-5. Additional roadways should have been included in the intersection analysis, especially north-south routes. The DEIR should consider impacts of diversion trips on streets with schools and senior facilities.
The multi-level analysis evaluated Homestead Road at the screenline level, indicating that the volume on Homestead Road remains well below its capacity. Intersections were selected for additional analysis based on their inclusion in VTA’s Countywide Travel Demand Model network, proximity to El Camino Real (generally within 1/2 mile), and the increase in vehicle approach volumes (50 vehicles per hour or more). Because intersections on Homestead Road did not meet one or more of these criteria–it is mostly more than 1/2 mile from El Camino Real–intersections along this route were not analyzed. North-south routes were analyzed at the intersection level according to the criteria noted above. This analysis included intersections on each of the other streets mentioned in the comment. Level of service impacts in 2018 were very few on these streets, suggesting that the volume of traffic added to the north-south routes would not cause other impacts.
L5-6. Parking analysis should not be aggregated but should be presented on a block by block basis. Analysis should include night-time parking. Blocks are too long to expect mid-block business patrons to park on cross streets.
A comprehensive parking survey and analysis was conducted providing an inventory of existing parking spaces on El Camino Real, on side streets within 500 feet of the corridor, and in off-street parking lots within 500 feet of the corridor. The information was collected in segments between major cross-streets. Occupancy was measured at morning, noon, and early evening times; the highest occupancy period (noon) was reported in the DEIR/EA. Summary results are provided in the Draft EIR/EA; however, this information would be utilized, as appropriate, in subsequent design stages after selection of the LPA. Many of the businesses along El Camino Real provide off-street parking that is underutilized which allows an alternative to parking on the street.
L5-7. Explain how the No Build BRT ridership was forecasted.
The transit ridership forecasts were estimated using the VTA Countywide Travel Demand Model, which is used by the VTA to develop forecasts of transit ridership to support a variety of different planning projects, including the long-range Countywide transportation plan VTP 2040, major transit and highway corridor studies, environmental analysis and Federal Transit Administration supported New Starts and Small Starts projects. The VTA Countywide Travel Demand Model is sensitive to transit level-of-service changes for different modes of transit, such as BART, commuter rail, light rail and bus. The socioeconomic data used as inputs into the VTA models for the years 2013, 2018 and 2040 were developed from the ABAG Projections 2013 series census tract data. Once the models were validated to year 2013 ridership counts, future forecasts were prepared for year 2018 and 2040 scenarios. Input assumptions for El Camino Real BRT operations include the walk, waiting and in-vehicle times, travel speed, fare cost and service frequency. The increase in frequency that will occur with the opening of the SCAR BRT project in early 2016 accounts for a substantial increase in ridership in the near term. With the Line 522 buses arriving more frequently than the local Line 22, many riders will shift from Line 22 to Line 522, as indicated by the drop in Line 22 ridership, producing more than half of the Line 522 ridership gain.

El Camino Real BRT Response to Agencies
43
L5-8. The number of diverted trips does not balance.
The diverted traffic volumes shown in the DRAFT EIR/EA plots reflect the trips shifting from El Camino Real to diversion routes because of the conversion of a lane of traffic to BRT operation. The positive and negative trips do not balance since the trips switching from auto to BRT are not shown. This switch makes up for the largest part of the difference. A small number of trips shifting to other modes (bicycle, pedestrian) or diverting to local streets not included in the model are also not shown and would make up the remaining balance. Figures 19 through 22 of the TOAR will be updated to include all diverted trips and the numbers will balance. The negative numbers on diversion routes show that more trips shift away from those routes than divert from El Camino Real. Some of these trips may shift to transit, other modes, other times, or to other routes that are faster as the model balances travel times for all users.
L5-9. Analysis should include diversion on north/south streets as well as parallel streets.
Similar to the 2018 diversion figures, Figures 30 through 33 of the TOAR will be updated to show diversion to transit and other trips so that the numbers balance.
Also, the study focused first on identifying major diversion routes, second on identifying intersections along those routes, and finally on conducting a detailed LOS analysis on those intersections. The level of analysis conducted facilitated comparison among Project alternatives. A more detailed analysis may be conducted in subsequent design stages after selection of the LPA. In addition, volume difference plots are available to agencies upon request.
L5-10. Bicycle assessment should include an evaluation of the bicycling environment and impacts on bicycles due to reduction in intersection crossings.
The analysis focused on the evaluation of bicycle circulation along El Camino Real for each alternative. The El Camino Real corridor does not currently have bicycle lanes and is not a classified bikeway, except on El Camino Real from Sunnyvale Avenue to Fair Oaks Avenue where Sunnyvale has recently striped bike lanes. The implementation of the project will reconfigure the streetscape to provide marked bike lanes in areas of dedicated BRT lane, consistent with the Grand Boulevard Initiative goal to make El Camino Real a multimodal corridor. In general, bike lanes are shown replacing on-street parking, but the choice between bike lanes and on-street parking is a city decision; bike lanes are not necessary for the transit project.
Working with staff from the City of Santa Clara early in the project, it was determined that dedicated lane configurations in Santa Clara would retain parking as well as provide bike lanes, achieved by reducing lane widths and median width. While the current environment is not inviting for bicyclists, the reduced width of lanes and the reduced number of general traffic lanes could contribute to a traffic calming effect. When coupled with striped bike lanes, these changes in the character of the roadway could lead to a better bicycle environment. Increased density along the El Camino Real corridor could also invite more cyclists to use available bike facilities as distances between home and work, shop, play destinations are decreased. Congestion on El Camino real itself, as measured by LOS, is not expected to increase greatly. While curbside local buses present a conflict for bicycles, even with the provision of a bike lane, VTA’s Bicycle Technical Guidelines cite that bus routes should not prevent the implementation of bike lanes on that roadway. With dedicated lanes there would be only four buses an hour at curbside stops, rather than the current nine buses an hour (five local and four Rapid), so while there would be an overall increase of one bus per hour (to four local and six BRT), the increase in bus traffic would be segregated from bicycle traffic. El Camino Real has numerous driveways and cross-streets that do present potential conflicts for bicycles, but the provision of adequate

El Camino Real BRT Response to Agencies
44
sight lines would help alleviate this situation. A more detailed analysis may be conducted in subsequent design stages after selection of the LPA.
There is no indication that the project would cause an increase in parking turnover or that traffic conflicts would increase because of fewer parking spaces. The Urban Land Institute identifies the optimal parking occupancy level at approximately 85 percent to 90 percent. Optimal parking occupancy is achieved when the land devoted to parking is well-utilized, but not so well-used that drivers are circling looking for an open parking space. Parking utilization that would be just over 50 percent with the Project would be unlikely to produce traffic conflicts.
With the closure of some unsignalized intersections or left turns (others would be signalized), some additional travel would be necessary. In Santa Clara, the additional distance traveled to the adjacent intersection and back ranges from approximately 0.13 mile to 0.38 mile. In return the cyclist gains a signalized movement.
For information on queuing, see Response to Comment L5-11.
L5-11. The TOAR is missing a queuing analysis.
The TOAR evaluated the operational impacts from the increase in left-turn volumes at specific intersections as a result of intersection closures. These impacts were captured in the LOS analysis by manually re-assigning trips from closed intersections to the adjacent intersections, as identified on the Project plans in Appendix B of the DEIR/EA. In 2018, the number of turns redistributed at an intersection was less than 60 in each AM peak hour scenario and in almost all of the PM peak hour scenarios. That number results in two or fewer cars added to a turn pocket in each signal cycle. There are four locations (WB at The Americana and EB at Maria Avenue in Sunnyvale, and EB at Flora Vista Avenue and WB at Calabazas Boulevard in Santa Clara) where more than 60 cars were reassigned, resulting in three or four cars are added per cycle, and only in the PM peak hour under Alternative 4c. Given the small increase in the demand for left turns at project intersections, VTA will not be conducting a detailed queue analysis at this time. A more detailed analysis will be provided in subsequent design stages after selection of the LPA.
L5-12. VTA should pay for all mitigations that result from the Project.
VTA would be responsible for funding and implementing during the project construction phase 100 percent of feasible near-term (2018) mitigations within the project limits; no mitigations of this type have been identified. VTA would be responsible for funding 100 percent of feasible near-term (2018) mitigations outside the project limits, but because the local jurisdiction is better able to ascertain the specific need, timing and public coordination for these improvements, the implementation of these mitigations would be the responsibility of the local jurisdiction.
VTA would be responsible for funding and implementing during the project construction phase 100 percent of feasible long-term (2040) mitigations within the project limits; no mitigations of this type have been identified. VTA would be responsible for funding a fair share of feasible long-term (2040) mitigations outside the project limits. VTA is responsible for a fair-share because these improvements are largely the result of background growth and it is only the cumulative effect of the Project that causes an impact. Because the local jurisdiction is better able to ascertain the specific need, timing and public coordination for these improvements, the implementation of these mitigations would be the responsibility of the local jurisdiction.
El Camino Real BRT Response to Agencies
45
L5-13. Removing unsignalized pedestrian crossings is contrary to the complete streets concept. The DEIR/EA should include a more detailed analysis of impacts to current and future pedestrian access.
Five unsignalized intersections, and one signalized left turn without a crosswalk, in Santa Clara will be eliminated within the dedicated lane segments, shifting pedestrians to adjacent signalized intersections. As existing unsignalized crossings on a major arterial facility are less safe than signalized crossings this is considered a positive impact. A figure summarizing the additional distance for pedestrians due to the elimination of the intersections will be provided in the TOAR. In addition, a signalized intersection would be added at Helen Avenue as part of the Project which will facilitate safe crossing for pedestrians. During the design phase more pedestrian crossings could be added. VTA would consider installing additional pedestrian signals if requested by the city.
L5-14. VTA should identify and implement feasible mitigations.
VTA has identified, and committed to undertake as part of the Project, feasible mitigations in many areas that reduce impacts of the Project to a level that is less than significant. In the area of traffic impacts, certain improvements that would mitigate a poor level of service were identified, but were conceptually identified as requiring right of way to construct. VTA makes every effort to minimize the acquisition of right of way for a project. VTA carefully weighs the benefits to the public against the costs and injury to the property owners when deciding to use its powers of condemnation for acquiring property. In the case of the traffic mitigation for this project, VTA has decided not to take any right of way from property owners unless required to as a condition of a permit or approval authority over the project because it is not necessary to build or operate BRT and is not consistent with other project purpose and needs such as enhancing the multi-modal character of El Camino Real for pedestrians and bicyclists. If the cities, county, or state requests that VTA take right of way for traffic mitigation, VTA will consider it only if there is no displacement or minimal hardship inflicted on property owners or their tenants, and the benefits of the mitigation to the public are substantial. At other locations, traffic impacts may be mitigated by installation of a traffic signal, possibly without the acquisition of right of way. Because the local jurisdiction is better able to ascertain the specific need, timing and public coordination for signal improvements, the implementation of this mitigation, although funded by VTA, would be the responsibility of the local jurisdiction. Since the implementation of such mitigation cannot be guaranteed, such an impact is considered significant and unavoidable.
L5-15. VTA should consider mitigating diverted trips to the freeway system through the voluntary contribution program.
VTA has considered this type of mitigation and determined that it would be an unwise use of public funds to administer this particular voluntary contribution in light of the small impact on the freeways, for example, the 16 cars added to over 7,500 cars on US 101 or the 6 cars added to nearly 8,000 cars on I-280 in the vicinity of San Tomas Expressway.
L5-16. VTA should consider funding traffic calming measures on diversion routes.
The analysis provided in the DRAFT EIR/EA identified several impacts and mitigations on the El Camino Real corridor and beyond. None of these mitigations involved traffic calming. If, after implementation of the Project, it is demonstrated that cut-through traffic resulting from the Project impacts neighborhood streets, VTA will work with cities to identify mitigation that could include traffic calming and VTA will fund mitigation.
El Camino Real BRT Response to Agencies
46
L5-17. Proposed optimization of traffic signals should be detailed.
Where coordinated systems exist today, coordination parameters were coded in the Synchro model and thus, where signal timing was optimized, it was done in a coordinated manner. The analysis optimized green splits and maintained cycle lengths. A footnote with the above clarification will be added to the TOAR.
L5-18. Project construction, mitigation implementation, and new operating costs should be borne by VTA. The DEIR/EA should discuss coordination required with Caltrans and local agencies.
VTA would be responsible for all project construction and operations costs, and for those mitigation costs identified in the final EIR/EA, but because the local jurisdiction is better able to ascertain the specific need, timing and public coordination for mitigation improvements, the implementation of these mitigations would be the responsibility of the local jurisdiction.
VTA met almost monthly in Project Development Team (PDT) meetings with planning and engineering staff from each of the cities throughout the conceptual development of the BRT alternatives. Caltrans was frequently invited to those meetings as well, and other coordination meetings with Caltrans have taken place at Caltrans District 4 offices in Oakland. Caltrans approved a Project Study Report (Project Development Support) in February 2014, which was provided to the cities. As a responsible agency, Caltrans has reviewed and provided comments on the DEIR/EA. Going forward, VTA would submit to Caltrans a Project Report. Approval of the Project Report by Caltrans constitutes approval of the Project, although detailed coordination would continue throughout design and Caltrans would need to issue an encroachment permit for construction work in the State highway right of way. It is anticipated that PDT meetings would continue throughout design and would involve both Caltrans and the cities, as appropriate. Maintenance responsibilities would be the subject of modified or new maintenance agreements between the responsible parties. Details regarding maintenance would be defined during future design phases.
L5-19. The DEIR/EA should discuss the process and responsiveness for reporting problems and concerns before, during and after construction, as well as recourse if VTA does not respond.
The DEIR/EA identifies that a Transportation Management Plan (TMP) would be developed for the Project in conjunction with Caltrans and each of the local municipalities prior to construction. The TMP would define the strategies to be used to keep the public informed during each stage of the Project construction. Typical strategies that may be discussed in the TMP for reporting problems include a telephone hotline, a project website, and community meetings. In addition, VTA’s Board of Directors welcomes public comment at their monthly meetings.
L5-20. The City reserves the right to make additional comments.
VTA will continue to coordinate with the affected Project corridor jurisdictions throughout the design process.

El Camino Real BRT Response to Agencies
47
5.6. City of Sunnyvale L6-1. The report does not provide LOS for all diversion routes.
The multi-level transportation analysis included diversion to US 101 and Central Expressway in the screenline analysis, which indicated small volumes of traffic divert to those routes relative to their respective capacities. As these locations did not meet the criteria for the more detailed LOS analysis, being more than 1/2 mile from El Camino Real, LOS was not evaluated at these locations. However, a more detailed analysis may be provided in subsequent design stages after selection of the LPA.
L6-2. Impacts on Evelyn and Fremont. Will traffic on congested diversion routes divert to other routes?
The analysis provided in the EIR identified impacts along the major traffic diversion routes. These routes were evaluated with the assistance of the VTA Countywide Travel Demand Model. The model balances the assignment of trips to various routes to achieve the shortest travel times for all users of the roadway network. Thus, the congestion experienced on any particular route is tolerable in comparison to congestion on others routes. While there may be some shifting from one route to another, the system tends to reach equilibrium. Evelyn and Fremont may experience more diversion than other routes because they are currently underutilized in comparison to other routes.
L6-3. Why would traffic divert to congested routes when El Camino Real is still functioning at an acceptable LOS?
Using a dedicated lane on El Camino Real for BRT operations will lead to a capacity reduction on the corridor along the segment with dedicated lanes. That will lead to a redistribution of trips in the vicinity of the corridor, until the travel times on parallel routes and El Camino Real become similar. Existing (2013) volumes on Evelyn and Fremont suggest that these streets have more available capacity than El Camino Real. While certain intersections along these routes may experience congestion, as evidenced by a poor LOS, the routes themselves may be viable alternatives to El Camino Real which has many cross streets and driveways.
L6-4. What north/south corridors will diverted traffic use and what is the LOS on these routes? Include Mathilda in analysis.
See the response to Comment L5-5. North-south routes were analyzed at the intersection level according to the criteria noted above. Impacts, if any, on north-south routes are indicated by poor levels of service at intersections along those routes. None of the intersections on Mathilda met these criteria.
L6-5. If diversion does not occur as modeled, what will be the LOS for intersections on El Camino Real?
It is expected that the lane reduction on El Camino Real will lead people to change their travel routes, as they would not tolerate long delays. As seen in similar transportation projects, gradually, trip diversion will reach equilibrium, so that diverted drivers do not experience very long delays due to traffic or detours. The diversion included in the traffic analysis represents the likely result of implementing the Project. The diversion analysis was based on estimates from the VTA Countywide Travel Demand Model that assume that the transportation network has reached that equilibrium. The travel model comprises the best source of information for evaluating travel patterns and diversion for each scenario. The LOS analysis results are based on that information. If less traffic than modeled were to divert from El Camino Real, then LOS on roads with diverted traffic would function better and the LOS on El Camino Real would be

El Camino Real BRT Response to Agencies
48
worse than estimated in the environmental document. However, this would only be a temporary effect before the transportation system would again reach equilibrium.
L6-6. How many additional left turn movements will be added to each intersection? Will the queuing create safety issues?
As part of the intersection analysis, turn movements were reallocated wherever there were intersection closures. The left-turning movements re-assigned to adjacent intersections will be shown in the TOAR. The traffic analysis takes into account the re-allocated turn movements and the mitigation measures identified in the Draft EIR/EA account for the additional left-turns added at intersections due to those closures. These impacts were captured in the LOS analysis by manually re-assigning trips from closed intersections to the adjacent intersections, as identified on the Project plans in Appendix B of the DEIR/EA. In 2018, the number of turns redistributed at an intersection was less than 60 in each AM peak hour scenario and in almost all of the PM peak hour scenarios. That number results in two or fewer cars added to a turn pocket in each signal cycle. There are four locations (WB at The Americana and EB at Maria Avenue in Sunnyvale, and EB at Flora Vista Avenue and WB at Calabazas Boulevard in Santa Clara) where more than 60 cars were reassigned, resulting in three or four cars are added per cycle, and only in the PM peak hour under Alternative 4c. Given the small increase in the demand for left turns at project intersections, VTA will not be conducting a detailed queue analysis at this time. A more detailed analysis would be provided in subsequent design stages after selection of the LPA.
L6-7. What mitigation measures should be implemented to accommodate additional left- and U-turns?
Study intersections on El Camino Real were evaluated for level of service while taking into account the additional left turns and U-turns that were reassigned from closures. The mitigation measures identified in the EIR already reflect improvements, where necessary, to lessen the impacts from those reassigned left turns as well.
L6-8. Off-street parking lots should not be counted toward parking inventory.
Off-street parking facilities fronting The Alameda/El Camino Real that allow public parking were included in the survey because these facilities serve the activities on the corridor. These included parking in shopping centers and other lots where the general public can generally find parking that does not require a special permit. However, lots associated with residential buildings or otherwise gated/signed for reserved use were excluded. The comment notes that off-street facilities are typically "designated" for corresponding employees and patrons. However, these groups (employees and patrons) are also those that are likely the primary users of on-street parking on El Camino Real.
L6-9. Parking analysis should not be aggregated but should be presented on a block by block basis. Parking in residential neighborhoods should not be assumed to be available for commercial uses.
The analysis conducted for the Draft EIR/EA aimed at facilitating comparison among Project alternatives rather than identifying every possible impact. A comprehensive parking survey and analysis was conducted providing an inventory of existing parking spaces on El Camino Real, on side streets within 500 feet of the corridor, and in off-street parking lots within 500 feet of the corridor. The information was collected in segments between major cross-streets. Occupancy was measured at morning, noon, and early evening times; the highest occupancy period (noon) was reported in the DEIR/EA. Summary results are provided in the Draft EIR/EA; however, we expect that the more detailed information will be utilized, as appropriate, in subsequent design stages after selection of the LPA.
El Camino Real BRT Response to Agencies
49
L6-10. Provide information on existing and projected ridership by station.
Appendix C of the TOAR includes summary tables showing the existing and projected transit ridership for Line 522/BRT by station under each Alternative and study year.
L6-11. Figure ES-2 does not identify all proposed stations.
Figure ES-2 (and Figure 3-2) will be updated. This figure illustrates the Project corridor, and as such, does not need to include markers of the BRT stations. To be consistent with information provided in text, the San José Diridon Station (Arena) and Palo Alto Transit Center are still shown, and the legend will be revised accordingly.
L6-12. The Hollenbeck station is an inferior location and the station should be moved closer to Sunnyvale Avenue.
Section 3.2 of the EIR/EA describes the station locations. Locations were chosen based on the level of use of the existing bus stations, proximity to major destinations such as schools, grocery stores, or other popular commercial areas, such as Showers Drive, Flora Vista Avenue, and proximity to existing multi-modal transit areas, such as Santa Clara Transit Center and Palo Alto Transit Center, or connecting transit lines. During conceptual engineering, several refinements of the Hollenbeck Station were discussed with City staff, but locations closer to downtown/Sunnyvale Avenue would be on a curved alignment making level boarding more difficult, would not have the good connections to north-south routes available with the Line 54 on Hollenbeck Avenue, or would have required right of way acquisition. If any of these issues can be overcome, further examination of a station location closer to Sunnyvale Avenue could be considered during the design phase. If the LPA includes construction in Sunnyvale, VTA would reanalyze the location of this station to facilitate transfers to the new Line 354.
L6-13. The Hollenbeck station is not within one of the nodes identified in the Sunnyvale Precise Plan for El Camino Real and should be moved. Enhanced north-south bus service should be considered for the Sunnyvale-Saratoga Avenue corridor.
Regarding station locations, see the response to Comment L6-12. VTA has recently conducted a study of north-south routes, documented in the North Central County Bus Improvement Study. This study recommended a new Line 354 service that is included in the proposed FY 16-17 Transit Service Plan and runs along the Mathilda/Sunnyvale-Saratoga corridor. As noted above, if impediments to locating a BRT station closer to this new route can be overcome, a revised station location could be examined during the design phase. If the LPA includes construction in Sunnyvale, VTA would reanalyze the location of this station to facilitate transfers to the new Line 354.
L6-14. Center-running dedicated lanes will have a visual impact on median landscaping.
While the visual simulations in the EIR/EA portray Project-related visual changes at stations, the overall analysis also considers the broader visual effects of landscaping and tree removal within the entire stretch of roadway, including medians, within the Project corridor. With respect to effects of median tree and landscaping removal, the visual analysis indicates that the potential long-term visual impacts associated with removal of a number of existing trees along the Project corridor would be addressed through replacement tree planting within medians and along sidewalks, where feasible. Anticipated tree replacement could potentially result in an overall net gain of trees along the Project corridor and the long-term visual effect in some locations of trees and Project landscaping could result in an improvement of the visual character of the streetscape along the Project corridor, including the Sunnyvale community.

El Camino Real BRT Response to Agencies
50
L6-15. The impact on aesthetics and visual quality of the corridor due to loss of trees should be determined.
The EIR/EA analysis considers visual effects associated with tree removal and states that the impact would be most noticeable during the initial period of construction. Within Sunnyvale potential visual effects of tree removal would be lessened to a degree because most of the trees to be removed are either a portions of larger clusters of trees to remain, and/or adjacent to areas of proposed new median landscaping that would include new trees. Mitigation would replace all urban trees that are to be removed or lost as a result of the Project. As a result, the Project could result in an overall net gain in the number of trees along the Project corridor in Sunnyvale. In addition, the tree inventory indicates that a portion of the existing trees to be removed are rated as being in either fair or poor condition and some of these trees would be among those replaced with new healthy trees. Finally, VTA would be responsible for irrigating and maintaining new trees for a period of not less than 3 years, which will ensure the beneficial visual effects of tree replacement in the longer term.
L6-16. Why are VTA TIA Guidelines not a regulatory document, but still used as guidance for some of the analysis?
The VTA Traffic Impact Assessment (TIA) Guidelines are used as guidance in some of the Draft EIR/EA analysis. However, the VTA TIA Guidelines are not a regulatory document applicable to this Project because they are intended for transportation analysis related to land development projects. The VTA TIA Guidelines have been used as a reference point for the analysis of transportation improvement projects. A number of the VTA TIA guidelines were applied in the Draft EIR/EA analysis, whereas certain guidelines were modified to better facilitate the purpose of the study. VTA staff has approved the applied methodology, which was reviewed with the cities at a Project Development Team meeting.
L6-17. Identify ridership by city.
For ridership by city, see the response to Comment L6-10.
L6-18. VTA bus 54 has connections at El Camino Real via Pastoria/Hollenbeck, not Mathilda.
A correction will be made to Table 4.12-3 to indicate connections at El Camino Real via Pastoria/Hollenbeck, not Mathilda. The proposed FY 16-17 Transit Service Plan includes realignment of Line 54 for 0.4 miles between Hollenbeck Avenue and Mathilda Avenue. The route would operate on El Camino Real instead of Olive Avenue to facilitate transfers with the planned Line 522 stop relocation.
L6-19. Why was the 2010 Highway Capacity Manual (HCM) not used rather than the 2000 HCM?
At the time the analysis was initiated in 2013, VTA was using the HCM 2000 methodology for impact analyses. The VTA TIA Guidelines call for HCM 2000 which was accepted practice within the county.
L6-20. Verify the variance between the VTA analysis and other recent studies at the El Camino Real/Mathilda Avenue intersection.
The variance in delay per vehicle between the VTA analysis and other recent studies is likely due to the fact that recently (June 2014) the signal timings at several intersections along El Camino Real were updated, while the VTA analysis was initiated prior to that time. The intersection analysis for the DEIR/EA was conducted using the signal timing plans provided by Caltrans at the time that analysis was initiated. It is recognized that signal plans were updated AFTER the analysis was completed. During the design phase this may be reevaluated.
El Camino Real BRT Response to Agencies
51
L6-21. Are intersections near bus stops ADA-compliant?
For compliance with ADA at intersections near bus stops, see the response to Comment S1-5.
L6-22. Class II bike lanes on Mathilda Avenue exist only south of El Camino Real. Include bike lanes on Cezanne Drive. Identify bike routes.
The descriptions/classifications presented in Table 4.12-5 refer to the bike facilities on those streets, not specifically to the type of facility right at the intersection with El Camino Real. Text will be edited to clarify this. Bike lanes on Cezanne will be included. No bike routes were identified on VTA’s bikeways map to connect with El Camino Real in the City of Sunnyvale and thus none are reflected in Table 4.12-5.
L6-23. Is VMT measured regionally, locally, or on the project corridor only?
Measures of effectiveness were evaluated at a broader corridor level for a more comprehensive analysis of area-wide transportation impacts. VMT were measured within that broader corridor which encloses El Camino Real and extends from US-101 in the north to I-280 in the south.
L6-24. Identify the version of the CA MUTCD used for signal warrants.
The analysis used the 2012 CA MUTCD which incorporated 2009 MUTCD signal warrant analysis guidance; it was the latest version available at the time.
L6-25. Did intersections have to meet all three criteria to be analyzed? Were any intersections analyzed that met the 50 vph threshold, but not in the travel demand model?
Intersections have to meet all three criteria items to be analyzed. The 50 vph growth data was generated using the VTA Countywide Travel Demand Model and thus intersections not included in the model could not be evaluated for the 50vph growth. Therefore, there are no intersections that met the 50 vph growth criterion but are not in the model.
L6-26. Signal coordination optimization should be applicable to all affected coordinated signals, not just those that are closely spaced intersections.
The text in the Draft EIR/EA will be revised to say: "In addition, for coordinated intersections and closely spaced intersections, optimizing the offset and better signal coordination would also reduce delay."
L6-27. Do post-project estimated parking occupancy rates consider a possible increase in parking demand or for potential park-n-ride for BRT?
Most uniformly accepted parking generation data deal with site-specific land uses, rather than practices for forecasting future general on-street parking demand in an urban area. Typically, new developments along the corridor would be required to provide parking as well. Current occupancy levels, averaging less than 50 percent throughout the corridor, suggest that there is adequate parking available for some increased demand. However, as a transit project, BRT may act to decrease demand for parking. Prior analysis indicated that BRT service of the nature proposed would not generate park-n-ride demand. Those using the proposed service would generally access the service via walking or bicycle. The Project would not provide park-n-ride facilities.
L6-28. The proposed development at 871 E. Fremont Avenue (Butcher’s Corner) should be included as part of the cumulative analysis.
The land use assumptions included in the horizon year analysis are based on the ABAG 2013 land use projections and reflect an economically constrained scenario. As the Project is expected to be partially federally funded, it is required that the latest adopted regional forecasts are used in the forecast modeling. The ABAG projections were used because ABAG is the
El Camino Real BRT Response to Agencies
52
comprehensive regional planning agency for the nine counties and 101 cities and towns of the San Francisco Bay region. Insofar as the proposed development at 871 E. Fremont Avenue in Sunnyvale (Butcher’s Corner) is consistent with ABAG 2013 land uses, it has been included in the cumulative project analysis.
L6-29. Will there be any headway reductions beyond the five minute reduction implemented under SC-AR BRT? How do No build travel times and ridership compare to existing?
The headway reduction to be implemented as part of the SCAR BRT project, and which is included in the VTA Transit Service Plan adopted by the Board in May 2105, would be the Project condition for the El Camino Real BRT for both No Build and Build scenarios; there would be no further reduction in the headways as part of the El Camino Real BRT. A footnote will be added to Table 2 of the TOAR to clearly state the following: "Because the SCAR BRT is the same service as El Camino Real BRT, there is no further headway change due to El Camino Real BRT."
Table 2 of the TOAR is used to compare the analysis results to the Project's purpose and thus provides only a comparison among alternatives. Segment travel times for the existing year as well as for future alternatives can be found under Appendix F of the TOAR. Existing and future transit ridership can be found in Tables 4.12-8 and 4.12-17 for 2018 and 2040, respectively. For Project purposes where there is a difference between 2018 and 2040, Table 2 of the TOAR provides separate lines for each analysis year; other purposes are addressed equally by either year.
L6-30. The TOAR should include why VTA TIA guidelines were not used, why Synchro was used, why HCM 2000 was used, and why signal optimization was done as part of the analysis rather than afterwards.
Explanations regarding the selected methodology are provided in Sections 4.12.1 and 4.12.2.3 of the Draft EIR/EA. VTA TIA Guidelines are used as guidance in some of the Draft EIR/EA analysis. However, the VTA TIA Guidelines are not a regulatory document applicable to this Project because they are intended for transportation analysis related to land development projects. A number of the VTA TIA guidelines were applied in the Draft EIR/EA analysis, whereas certain guidelines were modified to better facilitate the purpose of the study. An example of this application is the selection of Synchro, rather than TRAFFIX, as the software for intersection analysis (Synchro is better adapted to a corridor type analysis than is TRAFFIX), but the TIA Guidelines use HCM 2000 for level of service analysis criteria, in accordance with VTA practice.
Signal optimization was done as part of the analysis recognizing that signal timings are routinely updated to reflect changes in traffic patterns and volumes, and were expected to be updated by 2018 and 2040. This statement will be added in Section 2.3 of the TOAR.
L6-31. Sunnyvale does use the 4-second threshold for determining LOS impacts.
The Project team contacted the City to confirm their methodologies or requirements and was told at the time that the City of Sunnyvale does not use the 4-second threshold. However the sentence in question will be revised to reflect the comment. In any case, the 4-second threshold has been used to determine impacts.
L6-32. Existing LOS should be field-verified.
See the response to Comment L6-20. The variance in delay per vehicle between the VTA analysis and other recent studies is likely due to the fact that recently (June 2014) the signal timings at several intersections along El Camino Real were updated, while the VTA analysis was initiated prior to that time.
El Camino Real BRT Response to Agencies
53
L6-33. VTA should fully fund all mitigation measures. VTA should conduct pre-project and post-project traffic studies, and if post-project studies identify unanticipated traffic problems, VTA should commit to providing mitigation.
The analysis has determined what improvements may mitigate Project impacts. If these mitigations can be implemented without right of way acquisition, VTA will fund 100 percent of the cost for near-term (2018) feasible improvements and VTA will fund a fair share contribution for long-term (2040) feasible off-corridor improvements. VTA would provide the mitigations identified in the Final EIR/EA. If, after implementation of the Project, it is demonstrated that cut-through traffic resulting from the Project impacts neighborhood streets, VTA will work with cities to identify mitigation and VTA will fund mitigation.


APPENDIX Letter from California Department of Transportation Letter from Santa Clara County Department of Health Letter from Santa Clara County Department of Roads and Airports Letter from City of Los Altos Letter from City of Mountain View Letter from City of Palo Alto Letter from City of San José Letter from City of Santa Clara Letter from City of Sunnyvale


"Provide a safe, sustainable, integrated and efficient transportation
system to enhance California's economy and livability"
Letter S1 STATE OF CALIFORNIA={:ALIFORNIA STATE TRANSPORTATION AGENCY
DEPARTMENT OF TRANSPORTATION DISTRICT4 P.O. BOX 23660
OAKLAND, CA 94623-0660 PHONE (510) 286-5528
FAX (510) 286-5559
ITY 711 www .dot.ca.gov
Serious Drought.
Help save water!
January 14, 2015
FILE# SCLVAR044
SCH# 2013022003
Ms. Christina Jaworski
Senior Environmental Planner
Santa Clara Valley Transportation Authority
San Jose, CA 95134
Dear Ms. Jaworski:
Draft Environmental Impact Report/Environmental Assessment for the El Camino Real Bus Rapid Transit Project
Thank you for including the California Department of Transportation (Caltrans) in the review
process for the project referenced above. We have reviewed the El Camino Real (ECR) Bus
Rapid Transit (BRT) Draft Environmental Impact Report/Environmental Assessment (DEIR/EA)
and have the following comments to offer.
System & Regional Planning Comments
Page ES-2 references the Valley Transportation Plan 2035. Update all references for this
planning document to the current Valley Transportation Plan 2040 adopted in October 2014.
Page ES-5 and 6 provide alternative project descriptions. Please provide stop location analysis to
ensure speed and ridership are maximized with the least amount of stops. Stop location analysis
should consider major destination centers along the corridor.
Page 4.12-4 describes other transit systems in the project area. Given the close proximity and
nearly identical service corridors of Caltrain and El Camino Real, the Caltrain description should
be expanded to consider impacts to estimated ridership levels to both transit modes.
Bicycle and Pedestrian Planning Comment
Page 3-6, Alternative 4c - Long Dedicated Lane - Lafayette Street in Santa Clara to
Embarcadero Road in Palo Alto will allow for the fastest and most reliable transit travel times
because it has the longest dedicated bus lanes. Within Alternative 4c, the center-running
dedicated lanes with the buffered bike lanes will also provide more lateral separation from traffic
for bicyclists.
S1-1
S1-2
S1-3
S1-4

"Provide a safe, sustainable, integrated and efficient transportation
system to enhance California's economy and livability"
Ms. Jaworski, Santa Clara Valley Transportation Aurthority
January 14, 2015
Page2
Traffic Safety Comment Within the project limits, the BRT project shall be required to bring El Camino Real into
compliance with Americans with Disability Act (ADA) design standards. Specific details will be
addressed during the project development phase.
Highway Operations Comments
Figure 3-4, the cross-sections for dedicated lanes design on the left side of the figure have
tree/landscape strips on sidewalk adjacent to curb; however, there are no trees on the top two
cross-sections on the right for mixed flow design along the sidewalk. Alternative descriptions
should clarify if landscaping will vary between the various designs.
Figure 3-4, all 3 cross-sections for mixed flow design option on the right side of the figure
accommodate curb parking, but only the bottom one is labeled "with Parking." Revised the titles
to include "with Parking" for all alternatives with this feature.
Section 4.12- Transportation and Traffic and Appendix H- Traffic Operations Analysis Report
should have queuing analysis for traffic signals, AWSC (All Way Stop Control), and TWSC
(Two Way Stop Control) intersections. Intersection queues due to traffic signal, AWSC and
TWSC should be reported and compared to available storage distance to evaluate potential
operational safety issues such as queue spill backs that cause through lane blockage or
intersection grid lock for closely spaced intersections. As depicted in Table 4.12-13 and 4.12-20,
several intersections are concluded to operate poorly, and the queuing analysis should be
evaluated and disclosed in the environmental document.
Table 4.12-14- Locations of Existing Left-Tum Eliminated by Project Alternative. Because
traffic forecast is prepared by regional model at a macro scale, efforts should be taken to ensure
the demand ofthe eliminated left-tum is included in the left-tum movement of adjacent
intersections.
Page 4.12-37, section on "Impact TRA: Result in inadequate emergency vehicle circulation," the
analysis omitted potential impacts for Build with Mixed Flow lane alternatives with bulbout
stations that push out curb to edge of travelled way. When transit buses dwell at the bulbout
stations for boarding and alighting of passengers, the curb lane traffic would stop behind the bus
and impede through traffic movement. The impediment of curb lane traffic will create a
temporary choke point as vehicles attempt to move around the stopped bus. This traffic scenario
should be examined for impacts to emergency vehicle travel time and should be addressed in the
environmental document.
Page 4.12-45, the discussion on determining fair share contribution for cumulative impacts needs
to address the difficulty in measuring incremental impact. Most of the cumulative impacts occur
at intersections along El Camino Real with the dedicated lane alternatives. For dedicated lane
alternatives, the projected volumes for build alternatives are lower than No Build due to traffic
S1-5
S1-6
S1-7
S1-8
S1-9
S1-10
S1-11

"Provide a safe, sustainable, integrated and efficient transportation
system to enhance California's economy and livability"
Ms. Jaworski, Santa Clara Valley Transportation Aurthority
January 14, 2015
Page3
diversion. There is no incremental growth of volumes per se. The fair share contribution concept
typically used for land use development does not apply to transportation projects. Incremental
growth or impact for land use development can be measured, but it is difficult to measure
incremental impact for the BRT project on El Camino Real. The fair share contribution for
cumulative impacts needs to address this
Table 4.12-20 should add a column to denote type of intersection control (signal, TWSC,
AWSC) for clarity.
Table 4.12-21, Summary of2040 Intersection Mitigation Measures, should consider traffic signal
timing and controller hardware upgrades as feasible mitigation measures. Signal timing and
hardware upgrade may include signal coordination, timing optimization, and adaptive signal
control panel. Wherever geometry improvements are considered infeasible, signal timing and
hardware upgrade should be proposed and fully funded by the BRT project to reduce impacts on
El Camino Real.
Table 4.12-21 shows all geometry improvement mitigation as not feasible based on existing
ROW, without weighing in costs and secondary environmental impacts of ROW expansion and
benefits of mitigation. The Department does not advocate or recommend ROW expansion when
condemnation of homes or office buildings will cause displacement or hardship to residents or
business. A cursory review suggests the following improvements could be feasible by moderate
ROW takes without displacement or hardship, and should be evaluated as part of the scope of the
BRT project in the DEIR:
a) El Camino Real/Embarcadero: additions of eastbound and westbound right turn lanes
would only require expansion of ROW into landscaped areas. This could be feasible with
moderate ROW expansion.
b) El Camino Real/Kiely/Bowers: additions of eastbound right turn lane can be
implemented by expanding ROW into adjacent landscaped area of an oil change
business. It is not clear why that will affect the business operations as asserted. This
could be feasible with moderate ROW expansion.
c) El Camino Real/San Tomas: the potential loss oflandscaping and parking may not be
significant for EB and WB right turn lane improvements with proper design of parking
lots and circulation. This improvement could be feasible.
Table 4.12-21 has the description in the comment column for El Camino Real/Scott reversed.
The WESTBOUND right turn lane improvement may impact landscaping and a bank, and the
EASTBOUND right turn lane improvement may impact a new shopping center under
construction.
According to the Bus Blockage Factor in Synchro analysis, per HCM 2000, the bus blockage
adjustment factor accounts for the impacts of local transit buses that stop to discharge or pick up
S1-11, cont.
S1-12
S1-13
S1-14
S1-15
S1-16

"Provide a safe, sustainable, integrated and efficient transportation
system to enhance California's economy and livability"
Ms. Jaworski, Santa Clara Valley Transportation Aurthority
January 14, 2015
Page4
passengers at a near-side or far-side bus stop within 250ft of the stop line (upstream or
downstream). Recognizing that bus blockage can impact traffic operations in both approaching
leg (upstream), by a far-side station and receiving leg (downstream) by a near-side station, the
following intersection analysis will need additional input of bus stoppage frequency to properly
analyze reduced capacity in Mixed Flow alternatives:
a) WB at Cambridge/El Camino Real for the WB bulbout station at California/El Camino
Real,
b) WB at Charleston/El Camino Real for the WB bulbout station at the intersection,
c) EB and WB at Los Altos Square (Showers)/El Camino Real for the EB and WB bulbout
stations at the intersection,
d) WB at Bernardo/El Camino Real for the WB bulbout station at the intersection,
e) EB at Hollenbeck/El Camino Real for the EB bulbout station at the intersection, and
f) WB at Benton/El Camino Real and EB at Palm/El Camino for the EB and WB bulbout
stations at Santa Clara Transit Center. The two intersections are closely spaced and the
stations will impact both intersections.
Encroachment Permit
Please be advised that any work or traffic control that encroaches onto the State ROW requires
an encroachment permit that is issued by Caltrans. To apply, a completed encroachment permit
application, environmental documentation, and five (5) sets of plans clearly indicating State
ROW must be submitted to the following address: David Salladay, District Office Chief, Office
of Permits, California Department of Transportation, District 4, P.O. Box 23660, Oakland, CA
94623-0660. Traffic-related mitigation measures should be incorporated into the construction
plans prior to the encroachment permit process. See the website linked below for more
information: http://www.dot.ca.gov/hq/traffops/developserv/permits .
Should you have any questions regarding this letter, please contact Wingate Lew at
510-622-5432 or [email protected].
Sincerely,
PATRICIA MAURICE
Acting District Branch Chief
Local Development - Intergovernmental Review
c: State Clearinghouse
S1-16
cont.
S1-17

County of Santa Clara Public Health Department
Public Health Administration 976 Lenzen Avenue, 2nd Floor San José, CA 95126 408.792.5040
January 13, 2015
Honorable Members of the Santa Clara VTA Board of Directors 3331 North First Street San Jose, CA 95134-1927
RE: Comments on Draft Environmental Impact Report for El Camino BRT Project
Dear Chairperson Kalra, Honorable Members of the VTA Board of Directors, and General Manager Fernandez,
The Santa Clara County Public Health Department (SCCPHD) welcomes the opportunity to comment on the Draft Environmental Impact Report (DEIR) for the proposed El Camino Real (ECR) Bus Rapid Transit (BRT) Project, which will affect the cities of San Jose, Santa Clara, Sunnyvale, Mountain View, Los Altos and Palo Alto. As a member of the Grand Boulevard Initiative (GBI) Task Force, the Public Health Department recognizes that the El Camino Real BRT project aligns with the GBI vision as well as the air quality and transportation goals of Plan Bay Area.
Chronic disease, including obesity, diabetes, cardiovascular disease, cancer, and respiratory illnesses, are all affected by the environments that surround us. Healthy transportation and land use design can reduce injury and death, increase physical activity, decrease mental health stresses, strengthen community and reduce violence, provide fair access to services, education, and resources, expand access to healthy food, and minimize the effects of climate change. Complete streets support good health by providing safe and equitable access for all users, including walkers, bicyclists, transit users and drivers. They improve safety by reducing vehicular speeds and the risk of injury and fatalities. In 2012, 26% of motor vehicle collision deaths in Santa Clara County were among pedestrians, and 5% were among bicyclists. The number of motor vehicle traffic collisions involving bicyclists increased from 577 in 2002 to 825 in 2011, a 43% increase.i
Research has shown an association between time spent in cars and obesity.ii One Bay Area study concluded that active forms of transportation, including walking and bicycling, could substantially lower the burden of chronic disease.iii Nationwide, nearly one-third of transit users met the minimum daily requirement for physical activity during their commute.iv Walking and biking to school is an important source of routine physical activity for children and adolescents. Complete streets can increase levels of physical activity by encouraging active transportation, which in turn, helps to reduce air pollution (associated with cancer, heart disease, and respiratory illnesses such as asthma) and greenhouse gas emissions. Complete streets provide accessible connections between housing, schools, retail, community services, and recreation and improve economic conditions in a community. Low income populations, people of color, children, the elderly and the disabled are all more dependent on active modes of transportation, including public transportation. According to the VTA, large Board of Supervisors: Mike Wasserman, Cindy Chavez, Dave Cortese, Ken Yeager, S. Joseph Simitian County Executive: Jeffrey V. Smith
Letter R1

percentages of passengers walk to transit (51 percent) or walk from transit to their final destination (58 percent), and the ECR-BRT corridor (Rapid 522 and Local 22) has the highest bus ridership in the county transit system.
After reviewing the ECR BRT Draft Environment Impact Report, the Santa Clara County Department of Public Health recommends that VTA only consider the dedicated lane alternatives, which would allow for multi-modal transportation and complete streets. In addition, VTA should also ensure that communities along the route do not suffer adverse impacts from diverted traffic and examine whether unintended impacts to traffic diversion might have adverse impacts on pedestrian and bicycle use of side streets. The street improvements that would accompany these alternatives, including signal infrastructure upgrades, shortened crosswalks, street trees, and bicycle lanes, would help to create a safer, healthier, and more livable environment along the El Camino Real corridor. More frequent transit connections and safer walking and biking infrastructure will also strengthen community cohesiveness and allow people to more easily and safely access schools, health services, and businesses such as grocery stores.
Sincerely yours,
Dan Peddycord, RN, MPH/HA Public Health Director
i Traffic Safety and Active Transportation in Santa Clara County: A Data Brief on the Impact of Motor Vehicle Collisions, Active Transportation, and Air Quality, Santa Clara County Public Health Department, p. 3, 2014. http://www.sccgov.org/sites/sccphd/en-us/Partners/Data/Documents/Traffic%20safety%20and%20active%20transportation%202014/Traffic%20safety%20and%20active%20transportation_Final.pdf ii Frank, L, et al, Obesity Relationships with Community Design, Physical Activity and Times Spent in Cars, Am J Prev Med, 2004; 27(2) file://hhsisi001/ADUSER$/susan.stuart/My%20Documents/Downloads/ObesityRelationships.pdf iii Maizlish, N., et al, Health Cobenefits and Transportation-Related Reductions in Greenhouse Gas Emissions in the San Francisco Bay Area, Am J Pub Health, 2013 April; 103(4): 703–709. iv L. M. Besser and A.L. Dannenberg, Walking to Public Transit: Steps to Meet Physical Activity Recommendations, Am J Prev Med, 2005; 29 (4) http://www.cdc.gov/healthyplaces/articles/besser_dannenberg.pdf
R1-1

Letter R2
R2-1

R2-2
R2-3
R2-4
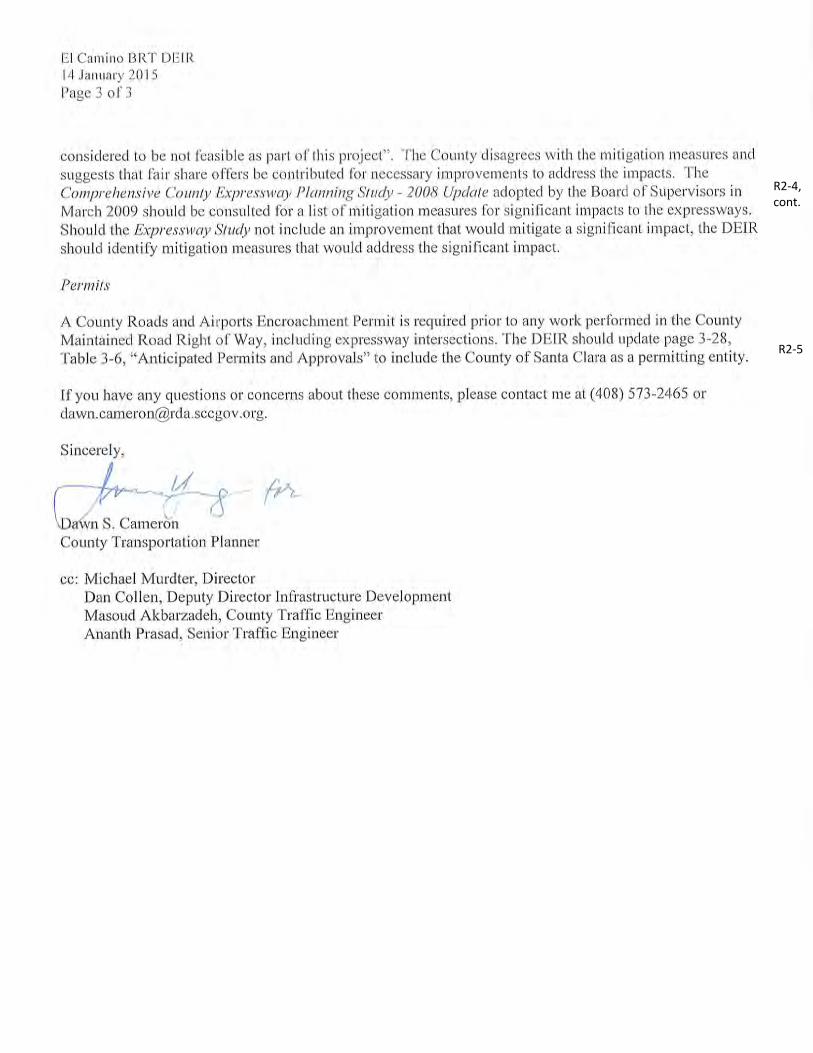
R2-4, cont.
R2-5

L1-1
L1-2
L1-3
L1-4
Letter L1

L1-5
L1-6
L1-7
L1-8
L1-9
L1-10
L1-11
L1-12
L1-13
L1-14
L1-15
L1-16
L1-17

L1-18
L1-19
L1-20
L1-21
L1-22
L1-23
L1-24
L1-25

L1-26
L1-27
L1-28
L1-29
L1-30
L1-31
L1-32
L1-33
L1-34
L1-35
L1-36

L1-37
L1-38
L1-39

Letter L2
L2-1

L2-1, cont.
L2-2
L2-3
L2-5
L2-4

L2-5, cont.
L2-6
L2-7

L2-8
L2-9
L2-9, cont.
L2-10
L2-11
L2-12

L2-12, cont.
L2-13
L2-14

L2-14 cont.
L2-15
L2-16
L2-17

L2-17, cont.
L2-18

L2-19
L2-20
L2-21

L2-22
L2-23
L2-24

L2-24, cont.
L2-25
L2-26

L2-27
L2-28
L2-29
L2-30
L2-31
Letter L3
L3-1

L3-1, cont.
L3-2
L3-3
L3-4
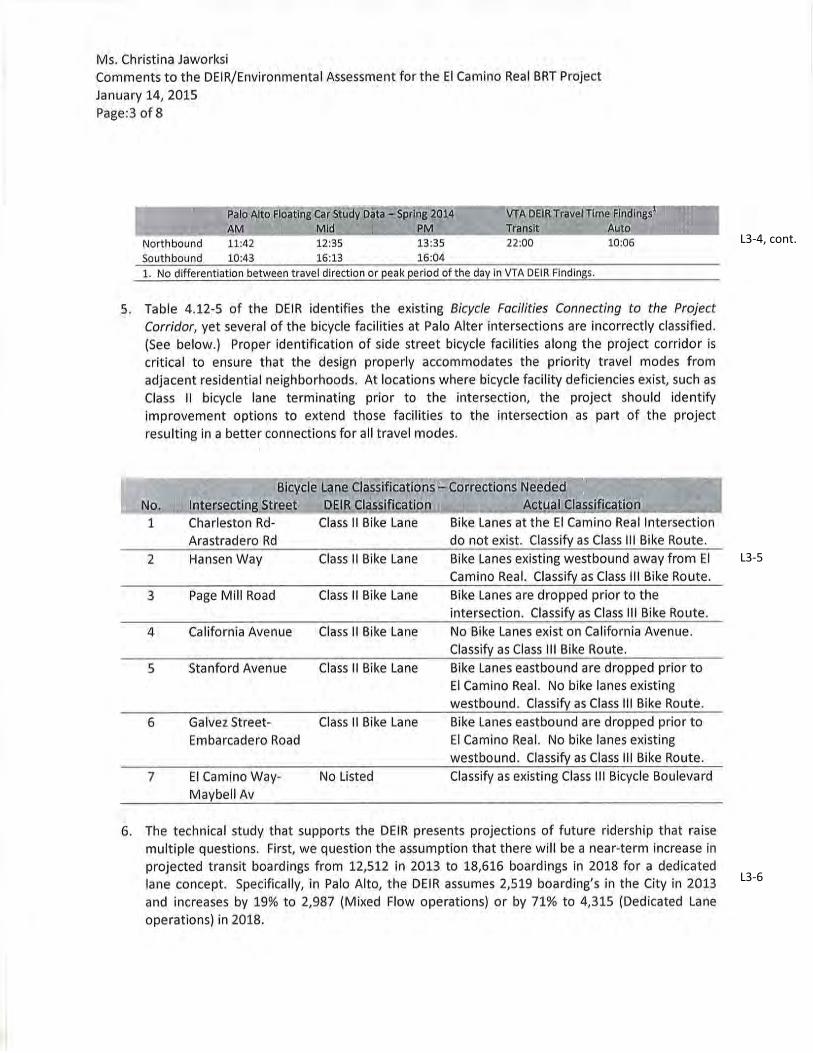
L3-4, cont.
L3-5
L3-6

L3-6, cont.
L3-7
L3-8
L3-9
L3-10
L3-11

L3-11, cont.
L3-12
L3-13
L3-14

L3-14, cont.
L3-15
L3-16
L3-17

L3-17, cont.
L3-18
L3-19
L3-20

L3-21

200 East Santa Clara Street, 3rd Floor Tower, San José, CA 95113 tel (408) 535-7800 fax (408) 292-6055 www.sanjoseca.gov
January 14, 2015
Ms. Christina Jaworski VTA Environmental Planning Department 3331 North First Street, Bldg. B San Jose, CA 95134-1927
SUBJECT: DRAFT ENVIRONMENTAL IMPACT REPORT / ENVIRONMENTAL ASSESSMENT FOR THE EL CAMINO BUS RAPID TRANSIT PROJECT
Dear Ms. Jaworski:
The City of San José appreciates the opportunity to comment on the Draft Environmental Impact Report/Environmental Assessment (DEIR/EA) for the EL Camino Bus Rapid Transit (BRT) Project. In the City of San José General Plan, Envision 2040, the City adopted ambitious goals for changing the way that people get around, including a goal that 20% of trips be made on transit. Extending the Santa Clara/Alum Rock BRT corridor (currently under construction) along El Camino Real has the potential to significantly advance this goal not only for the City, but for our region.
The City offers the following comments on the DEIR.
Preferred Alternative
Maximizing the length of the dedicated lanes (Alternative 4) is the preferred alternative for the City of San José. Today, it takes more than twice as long to travel the 17-mile corridor via bus rather than in a car (85 minutes on bus versus 40 minutes in a car). With dedicated lanes, transit could be time-competitive with the car, nearly halving the time required to take transit while adding less than 4 minutes to expected car travel times (48 minutes on BRT versus 43.7 minutes in a car, according to projections for 2018). Given our interest in improving transit access to, from and within San José, we urge VTA to proceed with the dedicated lane option for El Camino Real BRT.
Conceptual Drawings
1. Drawings, pages L-60MED and L-61MED. The City would like VTA to evaluate the sectionbetween McKendrie St and University Ave. There are existing four bus stops within this section. The project should investigate deleting the four bus stops and consolidating them to two BRT station platforms at Hedding St.
Letter L4
L4-1
L4-2
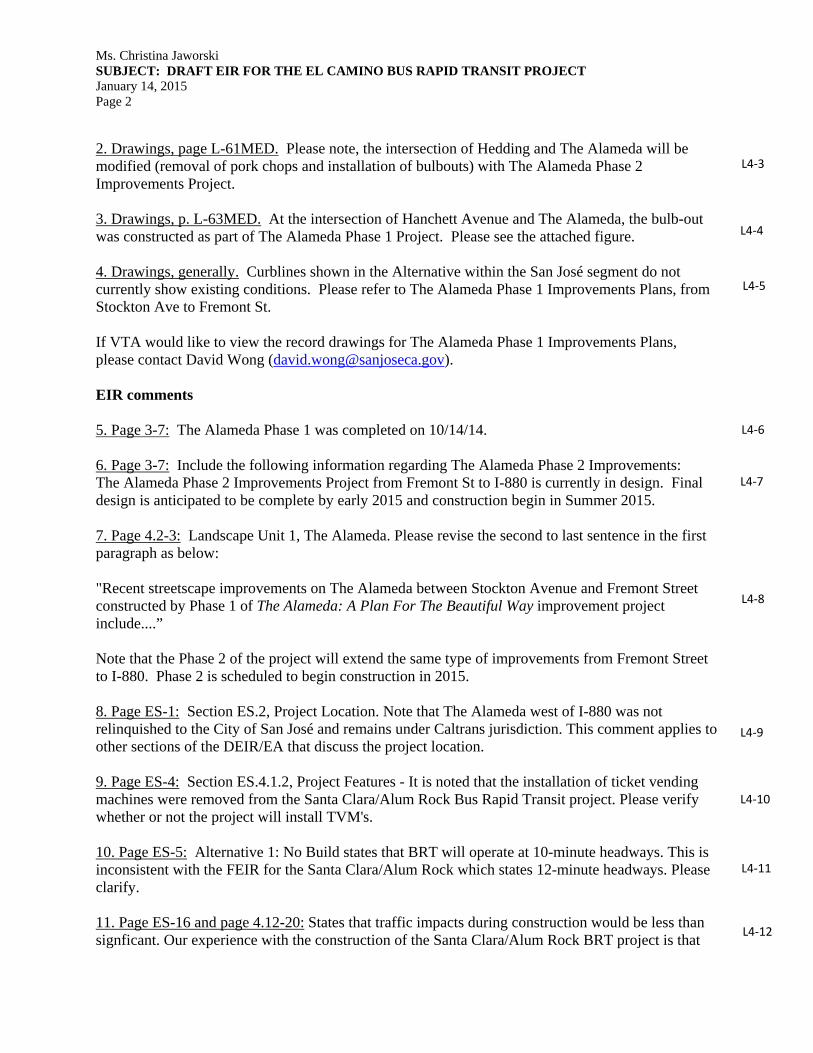
Ms. Christina Jaworski SUBJECT: DRAFT EIR FOR THE EL CAMINO BUS RAPID TRANSIT PROJECT January 14, 2015 Page 2
2. Drawings, page L-61MED. Please note, the intersection of Hedding and The Alameda will bemodified (removal of pork chops and installation of bulbouts) with The Alameda Phase 2 Improvements Project.
3. Drawings, p. L-63MED. At the intersection of Hanchett Avenue and The Alameda, the bulb-outwas constructed as part of The Alameda Phase 1 Project. Please see the attached figure.
4. Drawings, generally. Curblines shown in the Alternative within the San José segment do notcurrently show existing conditions. Please refer to The Alameda Phase 1 Improvements Plans, from Stockton Ave to Fremont St.
If VTA would like to view the record drawings for The Alameda Phase 1 Improvements Plans, please contact David Wong ([email protected]).
EIR comments
5. Page 3-7: The Alameda Phase 1 was completed on 10/14/14.
6. Page 3-7: Include the following information regarding The Alameda Phase 2 Improvements:The Alameda Phase 2 Improvements Project from Fremont St to I-880 is currently in design. Final design is anticipated to be complete by early 2015 and construction begin in Summer 2015.
7. Page 4.2-3: Landscape Unit 1, The Alameda. Please revise the second to last sentence in the firstparagraph as below:
"Recent streetscape improvements on The Alameda between Stockton Avenue and Fremont Street constructed by Phase 1 of The Alameda: A Plan For The Beautiful Way improvement project include....”
Note that the Phase 2 of the project will extend the same type of improvements from Fremont Street to I-880. Phase 2 is scheduled to begin construction in 2015.
8. Page ES-1: Section ES.2, Project Location. Note that The Alameda west of I-880 was notrelinquished to the City of San José and remains under Caltrans jurisdiction. This comment applies to other sections of the DEIR/EA that discuss the project location.
9. Page ES-4: Section ES.4.1.2, Project Features - It is noted that the installation of ticket vendingmachines were removed from the Santa Clara/Alum Rock Bus Rapid Transit project. Please verify whether or not the project will install TVM's.
10. Page ES-5: Alternative 1: No Build states that BRT will operate at 10-minute headways. This isinconsistent with the FEIR for the Santa Clara/Alum Rock which states 12-minute headways. Please clarify.
11. Page ES-16 and page 4.12-20: States that traffic impacts during construction would be less thansignficant. Our experience with the construction of the Santa Clara/Alum Rock BRT project is that
L4-3
L4-4
L4-5
L4-6
L4-7
L4-8
L4-9
L4-10
L4-11
L4-12

Ms. Christina Jaworski SUBJECT: DRAFT EIR FOR THE EL CAMINO BUS RAPID TRANSIT PROJECT January 14, 2015 Page 3
the impacts are significant and largely unavoidable, particularly as access to businesses and turning movements that are either temporarily, permanently and/or repeatedly restricted.
12. Page 3-1: Section 3-1 - See comment #10 regarding headways.
13. Page 3-3: Footnote 3 - Recordation of the relinquishment of the subject portion of SR 82 to theCity took place on December 28, 2011.
14. Page 3-7: 4th paragraph, first sentence states that "The Project would provide bike lane striping,enhanced crosswalk…". This should be revised to state that "In accordance with each jurisdiction's applicable bicycle and pedestrian improvement plan, the Project would provide...". The statement is too general as there are locations along the corridor that will not have bike lanes, enhanced crosswalks, etc.
15. Page 3-9: 5th bullet, Parking - states that bus bulbouts would be approximately 160-feet long tosimultaneously accommodate a 60-foot and 40-foot bus. It is requested that the project consider shorter platform lengths through the design process.
16. Page 3-9: 1st bullet, BRT vehicles: states buses will be equipped with on-bus payment system.Does this refer to the Clipper card? If TVM’s are removed from the platform, as with the Santa Clara Alum Rock BRT project, then will patrons also have the option of paying upon boarding? If so, then this could potentially increase the dwell time at the stations and overall travel times.
17. Page 3-22: Capital Costs - states that "no right of way acquisition is required for the project."Please clarify whether the acquisition of temporary construction easements for construction of the project was considered.
18. Page 4.2-3: Landscape Unit 1; The Alameda – The last paragraph of the section should includethe fact that the mature trees significantly contribute to the character of the corridor.
19. Page 4.2-9: Summary of Simulation, Landscape Unit 1: The Alameda - states that the visualeffect of the removal of trees "represents a noticeable and minor incremental change…" The tree canopy is a significant element of the character of the corridor. To the extent possible, the Project should save as many of the trees within the station areas as possible. This has been achieved in the Santa Clara/Alum Rock BRT project.
20. Page 4.2-15: Continuing the sentence from previous page, note that Lafayette Street is in SantaClara, not San José.
21. Page 4.4-7: Table 4.4-1 indicates that 21 trees will be removed in the City of San José. Why areall eight trees, five of which are classified as Heritage trees, being removed between Shasta and Hanchett for a 74-foot long platform? Similarly, why are all five trees for the WB station area being removed when the platform is only 74-feet long? See also Comment # 19.
22. Page 4.12-11: Table 4.12-5, Note that new bike facilities have been installed on Santa ClaraStreet between the Guadalupe River Trail and Stockton Avenue, and that bike lanes are planned on
L4-12, cont.
L4-13
L4-14
L4-15
L4-16
L4-17
L4-18
L4-19
L4-20
L4-21
L4-22
L4-23
L4-23, cont.

Letter L5
L5-2
L5-1

3. Section 2.3, TIA uses Synchro to analyze LOS for the corridor, and works well for closely spaced, coordinated, congested arterials, but the software does not model impacts due to TSP or transit to side streets, and left turn traffic on main street or main street traffic due to curbside bus stops. VT A should consider using analysis software such as VISSIM, which is capable of identifying transit caused impacts since this is a transit project.
4. Section 2.3, the diversion criteria of 50 vph increase on streets in order to be studied off ECR is not consistent with VTA's CMP Guidelines of studying intersections with increase of 10 or more vehicles per lane.
5. Figure 7, Diversion study intersections; Homestead Road is a regionally significant roadway that connects San Jose, Santa Clara, Sunnyvale, and Los Altos. This roadway should have been included in the study intersections. Project should also consider north/south roadways to be included in the study, such as Pomeroy Avenue, Kiely Boulevard, Lincoln Street, Calabazas Boulevard, Lawrence Expressway, San Tomas Expressway, Scott Boulevard, Momoe Street and Lafayette Street. Traffic will need to travel north/south to get to diversion streets. Diverted trips will be placed onto streets with residential frontages, elementary and middle schools, senior facilities, and libraries. VTA should consider impacts to these sensitive areas.
6. Section 3.5 and 9.1, parking inventory and use should not be aggregated into an entire segment within a City as it does not adequately show use and or impacts. Parking analysis should be presented in a block by block basis. Also, identifY study periods, as some peak usage for some businesses in Santa Clara are at night when residential parking is heavily used. Expecting mid-block business patrons to park on cross streets will be umealistic since ECR blocks are so long.
7. Section 5, the No Build Travel Forecast shows a 148% increase in 522/BRT ridership. Please explain how this estimate was forecasted.
8. Section 6.3 Figure 19, Diversion in Santa Clara, the number of diversion trips does not balance. It appears that there are approximately 30 northbound ECR diverted trips and approximately 200 southbound ECR diverted trips that are missing. Also, please clarify why some streets (Scott Boulevard and Walsh Avenue) have negative diverted trips. Saratoga Avenue is shown to have 23 diverted southbound trips; however, they are not assigned to any parallel streets further to the south. Please identify where these trips would be distributed.
9. Section 7.3, Figure 30, recheck diversion numbers. Assignments to parallel streets do not balance diverted trips. Also, analysis should show diversion expected on north/south streets. Many of these streets have residential frontages, schools or other uses that are not tolerant to increases in diverted trips.
L5-3
L5-4
L5-5
L5-6
L5-7
L5-8
L5-9

10. Section 9.3, Bicycle Assessment should include an evaluation of the bicycling environment due to increase in density, congestion, bus stops, associated turning traffic into properties, increase in parking space turnover traffic conflicts due to decrease in parking spaces overall, and increase in bus traffic. Assessment should also discuss impacts to bicyclists due to reduction in intersection crossings and increase of queuing at remaining left turn pockets.
11. The TIA is missing a discussion on queuing analysis due to reduction in number of cross street intersections to make U-turns or places to cross ECR. This analysis would potentially identify safety problems associated with overflow of left turn pockets. We request that a queuing analysis be done for all ECR intersections and diverted trip intersections.
12. The DEIR MM TRA-A states that VTA will be responsible for major intersection and roadway improvements, but that local jurisdictions will be responsible for minimal changes such as signal optimization or restriping that results from the project. The City believes that VT A should pay for all Mitigation Measures or improvements that result from the Project. The City does not have funding budgeted for any future improvements related to BRT.
13. The DEIR TRA-3b states that there will be a beneficial impact on pedestrian safety and environment. From Appendix H, it appears that seven existing pedestrian crossings (unsignalized) will be removed as part of the Project. The City's 2010-2035 General Plan has identified El Camino Real as a Focus Area for redevelopment to mixed-use and multifamily residential (19-50 units per acre). Development has been initiated and continues to further this vision and with it there has been a corresponding increase in pedestrian traffic. The City is concerned that removing existing pedestrian facilities will substantially impact pedestrian movement now and in the future, and that removing crossings is contrary to the Complete Streets (Full Service Streets) concept identified for El Camino Real in the City's General Plan. VTA should prepare a more detailed analysis of how removal of these crossings affect current and future pedestrian ability to cross El Camino Real as well as consistency with the City's General Plan. The analysis should include data on existing and future pedestrian travel time, study of existing and future pedestrian desire lines, study of signalizing pedestrian crossings, and study of potential safety issues resulting from illegal crossings on large blocks without mid-block pedestrian access.
14. Section 10, we encourage VTA to work with the City and Caltrans to identify feasible mitigation and to mitigate all impacts caused by the proposed BRT project. The City has not been provided any information regarding potential mitigation, so we cam1ot concur with VIA's statement of whether or not potential mitigations are feasible or not. It is essential that all feasible mitigations be identified and included to ensure that impacts from the project on the transportation network are reduced or eliminated. This will be impmiant to the success of the project. We request that VTA work with the City and Caltrans to identify and implement feasible measures for construction and/or implementation.
L5-10
L5-11
L5-12
L5-13
L5-14

15. VTA should also consider mitigating diverted trips to the freeway system through VTA's own voluntary contribution program to help mitigate for increases in delay on the freeway system. As a regional agency, VT A should implement all mitigation measures identified and not rely on the local agency to implement identified measures.
16. The diversion of vehicle trips onto streets with residential frontage or schools will cause potential safety problems. It will also increase requests from residents for implementation of the City's Traffic Calming Program. VTA will need to consider funding the implementation of traffic calming measures on sensitive roadways impacted by the Project.
17. Proposed optimization of traffic signals should be clearly described as all signals are already coordinated and optimized. Optimization of one signal will impact the entire corridor. This should be indicated in the mitigation.
18. Project construction, mitigation implementation, and new operating costs should be borne by VT A. The EIR should discuss coordination required with Caltrans and local agencies. Implementation of the Project will cause an increase of responsibility and maintenance costs for Caltrans and local agencies (maintenance of pavement, BRT lanes, landscaping, storm laterals/catchbasins, striping, new traffic signals, street sweeping, etc.). This should be discussed detail.
19. The EIR should discuss the process and responsiveness of Project implementer to any reports of problems or concerns before, during and after construction of Project. Reported problems and concerns should be addressed in a defined timely manner and alternative options should be identified ifVTA does not respond.
20. The City reserves the right to make additional comments on the Project as further analysis and project design raises new issues.
Should you have questions or require additional information, please contact Debby Fernandez at 408-615-2450 or Dennis Ng at 408-615-3000.
Respectfully,
Julio J. Fuentes City Manager
L5-15
L5-16
L5-17
L5-18
L5-19
L5-20

Letter L6

L6-1
L6-2
L6-3
L6-4
L6-5
L6-6
L6-7
L6-8
L6-9
L6-10

L6-11
L6-12
L6-13

L6-13 , cont.
L6-14
L6-15
L6-16
L6-17
L6-18
L6-19
L6-20

L6-20, cont.
L6-21
L6-22
L6-23
L6-24
L6-25
L6-26
L6-27
L6-28
L6-29

L6-29, cont.
L6-30
L6-31
L6-32
L6-33

