elberde nutrion assessment - december 2006 - fsnau
TRANSCRIPT
NUTRITION ASSESSMENT REPORT
EL BARDE DISTRICTS BAKOOL REGION
SOMALIA.
Food Security Analysis Unit (FSAU/UNFAO) International Medical Corps (IMC) United Nations Children’s Fund (UNICEF) World Food Programme (WFP)
December 2006
El Barde District Nutrition Assessment, December 2006 FSAU, IMC, UNICEF and WFP
TABLE OF CONTENT
ABBREVIATIONS AND ACRONYMS............................................................................................. 3
ACKNOWLEDGEMENTS ............................................................................................................... 4
EXECUTIVE SUMMARY ................................................................................................................ 5
1.0 INTRODUCTION............................................................................................................. 7
2.0 BACKGROUND INFORMATION: ................................................................................... 9
3.0 METHODOLOGY.......................................................................................................... 11
4 ASSESSMENT RESULTS ............................................................................................ 16
5.0 DISCUSSION................................................................................................................ 29
6.0 RECOMMENDATIONS................................................................................................. 31
7.0 APPENDICES ............................................................................................................... 32
8.0 REFERENCES AND BIBLIOGRAHY............................................................................ 47
2
El Barde District Nutrition Assessment, December 2006 FSAU, IMC, UNICEF and WFP
Abbreviations and acronyms
ARI Acute Respiratory Infections FAO Food and Agriculture Organisation FSAU Food Security Analysis Unit GAM Global Acute Malnutrition GIT Gastrointestinal Tract HAZ Height- for- Age Z scores HDDS Household Dietary Diversity Score HFA Height for Age IDP Internally Displaced Person KM Kilo Metres MCH Maternal and Child Health MT Metric Tonnes MUAC Mid Upper Arm Circumference NCHS National Centre for Health Statistics NGOs Non-Governmental Organisations NRC Norwegian Refugee Council PWA Post War Average LEZ Livelihood Economic Zones LNGO Local Non-Governmental Organisation INGO International Non-Governmental Organisation NIDs National Immunisation Days OR Odds Ratio RR Relative Risk SACB Somalia Aid Coordination Body SMART Standardised Monitoring & Assessment of Relief and Transitions UN United Nations UNDP United Nations Development Programme UNHCR United Nations High Commission of Refugees VAD Vitamin A Deficiency UNICEF United Nations Children’s Fund WAZ Weight for Age Z Scores WFP World Food Programme WHO World Health Organisation WHZ Weight for Height Z scores
3
El Barde District Nutrition Assessment, December 2006 FSAU, IMC, UNICEF and WFP
ACKNOWLEDGEMENTS The Nutrition Surveillance Project of the Food Security Analysis Unit (FSAU) and the International Medical Corps (IMC) acknowledge the participation WFP and UNICEF in the El Barde Districts Nutrition Assessment. FSAU provided technical support including the assessment coordinator and a supervisor while IMC financed the cost of transport, supervisors, enumerators and data entry clerks as well as logistic coordination. UNICEF provided one supervisor and a vehicle while WFP provided one assessment coordinator. Special thanks goes to the mothers, caregivers, leaders and the community as a whole in the El Barde district for their cooperation, time and for providing information individually and in focus group discussions that helped the survey team to get a better understanding of the nutrition situation in the area. Comments from partners in Bakool Region and members of the Nutrition Working Group in Nairobi on the preliminary results are also highly appreciated. FSAU and IMC also express sincere appreciation to the assessment team for their high level of commitment demonstrated during all stages of this assessment.
4
El Barde District Nutrition Assessment, December 2006 FSAU, IMC, UNICEF and WFP
EXECUTIVE SUMMARY El Barde district is one of the five districts in Bakool region. It lies the north of the region and neighbours Afder and Godey regions of Ethiopia. About 95% of district population is pastoral (who rear mainly camel and goats and sheep with few of them having cattle) while the rest are agro-pastoralists and urban population living in El Barde town. For the last three years the district has experienced successive droughts that have undermined the resilience and coping mechanism of the livelihood groups in the area. In Deyr 05 and Gu 06 due to failed rains, pasture and water resources were severely depleted leading to high livestock mortalities, particularly cattle and shoats. In addition, chronic insecurity in the area contributes to human and asset losses disrupt market access and humanitarian response because of limited access. Past nutrition assessments have indicated a persistent critical nutrition situation in the district with global acute malnutrition of 15-19.9%. This underscores the need for constant monitoring of the nutrition situation in the district. Between 15th and 25th December 2006, a joint nutrition assessment using a 2- stage cluster sampling methodology, was conducted by FSAU, IMC, UNICEF and WFP in 430 households where 934 children aged 6-59 months and measuring 65-109.9cm were sampled. Concurrent mortality survey was conducted in 900 households. The aim of the survey was to determine the nutritional status of children between 6-59 months or 65-109.9 cm using weight for height index and to establish underlying causes of malnutrition. Data quality was ensured by close supervision, review and control during data collection, entry and analysis (in EPI info and Excel).
The assessment results indicate Global Acute Malnutrition (WHZ<-2 or oedema) of 17.7% (CI: 13.7-21.6) and Severe Acute Malnutrition of 3.2% (CI: 1.4-4.9). The GAM rate is an indication of critical nutrition situation (WHO). The rates are slightly higher compared to the rate reported in the last nutrition assessment conducted in Jilaal March 2004 which reported a GAM of 15.7% and SAM of 1.3%. It should however be noted that the two assessments were conducted in different seasons, Jiaal and Gu and hence direct comparison is not feasible. The persistence of a critical nutrition situation could be explained by cumulative impact of inadequate food intake, water and pasture shortages resulting from past poor rainfall outcomes in the previous seasons (Deyr/Gu ’05 and Gu ’06) in addition to high morbidity levels and poor child feeding practices. Results showed that 44.4% of the children aged 6-24 months were not breastfeeding at the time of assessment with almost half (48.8%) of those not breastfeeding having stopped at the age of 6-11 months. Most of the children in this age category were reported to have been introduced to complimentary food at the age of 0 to 3 months and only 10.3% of the children were fed for the recommended five times in a day. The retrospective crude and under five mortality rates were 0.64 (CI: 0.39 – 1.68) and 1.03 (CI: 0.39 – 1.68) deaths/10,000/day respectively and indicate an alert situation (Sphere 2004). Malaria, diarrhoea, ARI and complications at birth were the common reported causes of death among children. Maternal care services as well as general health services are limited in the district. Morbidity was high with 34.3% of the assessed children reportedly having suffered from one or more communicable diseases two weeks prior to the assessment which included diarrhoea 18.6%, ARI 20.3% suspected malaria/febrile illness and measles 5.3%. Malnutrition was significantly associated with morbidity as it was higher among those who had been ill (p=0.0004) Children who fell ill were 1.5 times more likely to be malnourished than those who were well two weeks prior to assessment (RR=1.45). In particular, ARI and measles had a significant association with malnutrition (p<0.05). Health programme (vitamin A supplementation, polio immunization, measles vaccination) coverage was notable below the recommended coverage of 95% (Sphere 2004). Water quality and sanitation were poor with 95.3% of the sampled households drawing water from unprotected sources and 81.2% using bush for disposal of human waste. This may have
5
El Barde District Nutrition Assessment, December 2006 FSAU, IMC, UNICEF and WFP
exacerbated diarrhea cases where the human waste is washed by rain water into the unprotected water sources. About 66% of the households had consumed 4 or more food groups reflecting a good dietary diversity. Following discussions held after sharing the results with partners and detailed data analysis, both short- and long-term recommendations were made: Short term recommendations
1. Enhance delivery of basic health services including intensifying EPI services. 2. Rehabilitation and treatment of severely and moderately malnourished children through
existing feeding centres, strengthened outreach mechanisms to reach malnourished children and refer them for rehabilitation and use of community based care.
3. Intensify nutrition and health education targeting children care givers with messages on breastfeeding, child-feeding, health-seeking behaviour, hygiene and sanitation.
Long-term Recommendations 1. To enhance access to health services, there is need for support by agencies to re-
establish and re-open health posts and centres that already exist but are not operational as well as establishing others in areas where there are no health facilities.
2. Enhance nutrition and health education programmes with a specific focus on good sanitation; hygiene, child feeding practices and health seeking practices.
3. Re-stocking programme to support the poor households that lost livestock during the drought.
4. Measures for brokering lasting peace in the district are needed to avoid recurring disruption of livelihood and enhance humanitarian response.
5. Rehabilitation of existing boreholes and wells, construction of new ones and establishment of mechanism for routine water treatment/chlorination to enhance water quality.
6. Regular and massive environmental cleaning to enhance hygiene and sanitation 7. Provision of sanitary facilities including building of latrine for appropriate disposal of
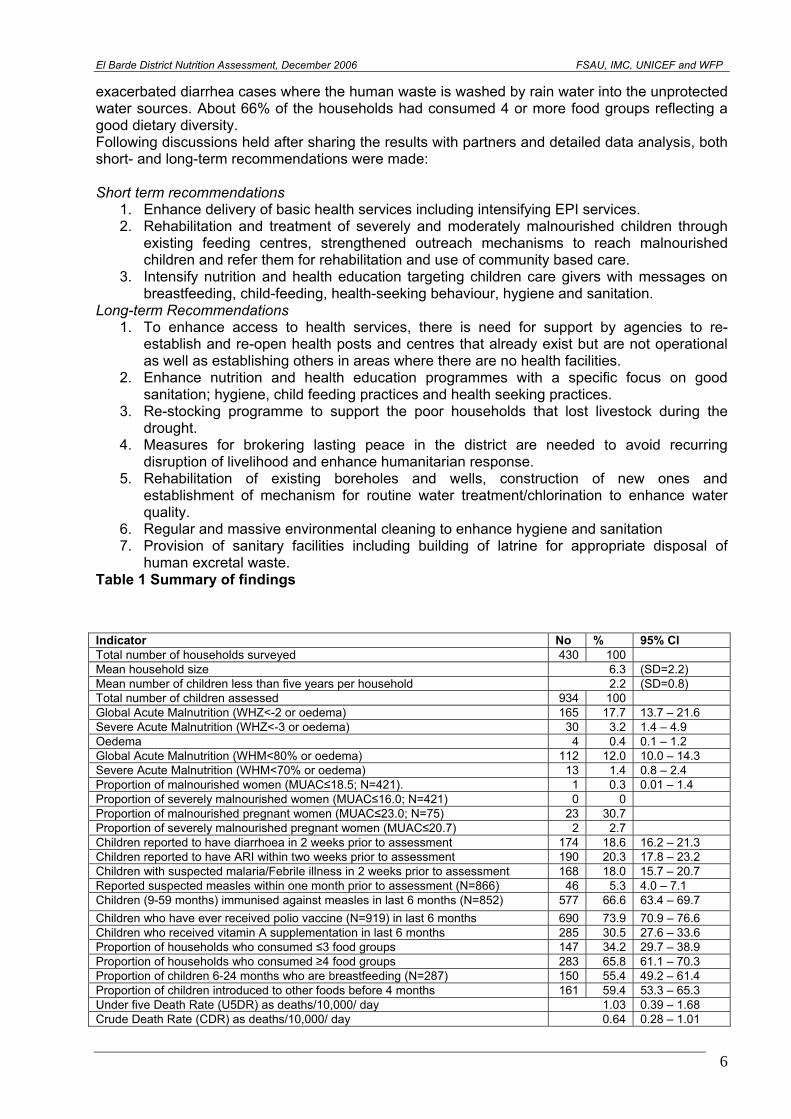
human excretal waste. Table 1 Summary of findings
Indicator No % 95% CI Total number of households surveyed 430 100 Mean household size 6.3 (SD=2.2) Mean number of children less than five years per household 2.2 (SD=0.8) Total number of children assessed 934 100 Global Acute Malnutrition (WHZ<-2 or oedema) 165 17.7 13.7 – 21.6 Severe Acute Malnutrition (WHZ<-3 or oedema) 30 3.2 1.4 – 4.9 Oedema 4 0.4 0.1 – 1.2 Global Acute Malnutrition (WHM<80% or oedema) 112 12.0 10.0 – 14.3 Severe Acute Malnutrition (WHM<70% or oedema) 13 1.4 0.8 – 2.4 Proportion of malnourished women (MUAC≤18.5; N=421). 1 0.3 0.01 – 1.4 Proportion of severely malnourished women (MUAC≤16.0; N=421) 0 0 Proportion of malnourished pregnant women (MUAC≤23.0; N=75) 23 30.7 Proportion of severely malnourished pregnant women (MUAC≤20.7) 2 2.7 Children reported to have diarrhoea in 2 weeks prior to assessment 174 18.6 16.2 – 21.3 Children reported to have ARI within two weeks prior to assessment 190 20.3 17.8 – 23.2 Children with suspected malaria/Febrile illness in 2 weeks prior to assessment 168 18.0 15.7 – 20.7 Reported suspected measles within one month prior to assessment (N=866) 46 5.3 4.0 – 7.1 Children (9-59 months) immunised against measles in last 6 months (N=852) 577 66.6 63.4 – 69.7 Children who have ever received polio vaccine (N=919) in last 6 months 690 73.9 70.9 – 76.6 Children who received vitamin A supplementation in last 6 months 285 30.5 27.6 – 33.6 Proportion of households who consumed ≤3 food groups 147 34.2 29.7 – 38.9 Proportion of households who consumed ≥4 food groups 283 65.8 61.1 – 70.3 Proportion of children 6-24 months who are breastfeeding (N=287) 150 55.4 49.2 – 61.4 Proportion of children introduced to other foods before 4 months 161 59.4 53.3 – 65.3 Under five Death Rate (U5DR) as deaths/10,000/ day 1.03 0.39 – 1.68 Crude Death Rate (CDR) as deaths/10,000/ day 0.64 0.28 – 1.01
6
El Barde District Nutrition Assessment, December 2006 FSAU, IMC, UNICEF and WFP
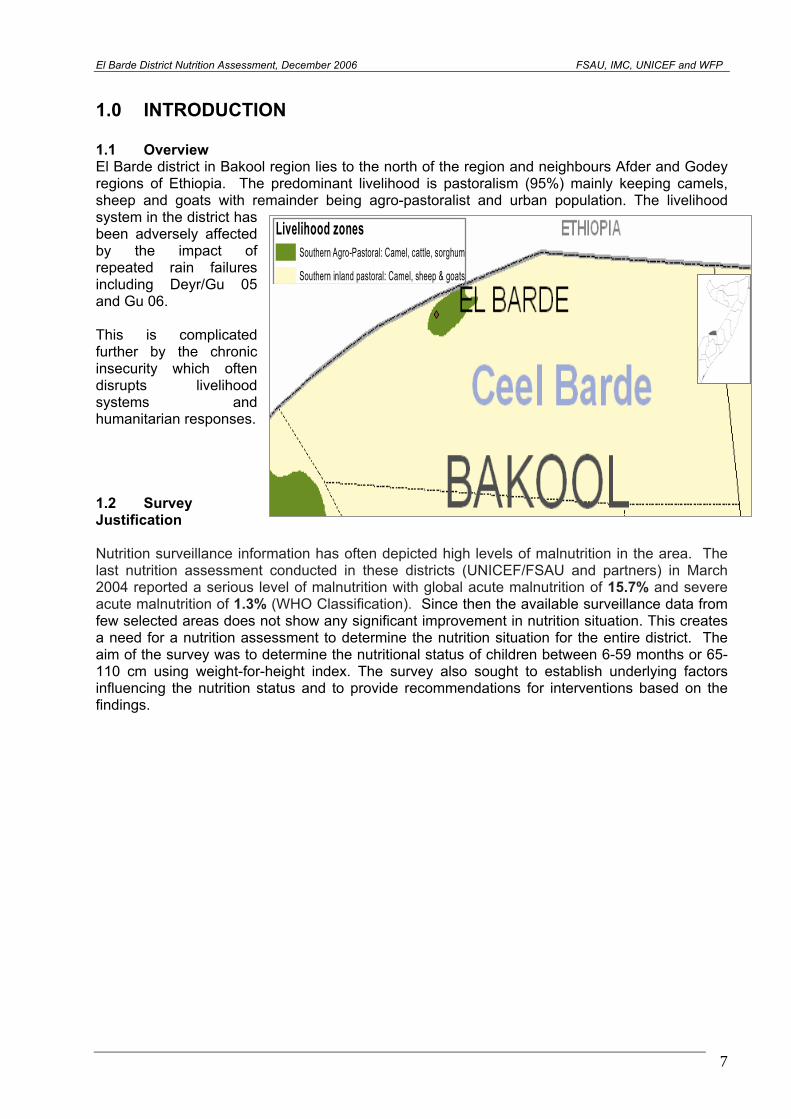
1.0 INTRODUCTION 1.1 Overview El Barde district in Bakool region lies to the north of the region and neighbours Afder and Godey regions of Ethiopia. The predominant livelihood is pastoralism (95%) mainly keeping camels, sheep and goats with remainder being agro-pastoralist and urban population. The livelihood system in the district has been adversely affected by the impact of repeated rain failures including Deyr/Gu 05 and Gu 06. This is complicated further by the chronic insecurity which often disrupts livelihood systems and humanitarian responses.
Livelihood zonesSouthern Agro-Pastoral: Camel, cattle, sorghum
Southern inland pastoral: Camel, sheep & goats
1.2 Survey Justification Nutrition surveillance information has often depicted high levels of malnutrition in the area. The last nutrition assessment conducted in these districts (UNICEF/FSAU and partners) in March 2004 reported a serious level of malnutrition with global acute malnutrition of 15.7% and severe acute malnutrition of 1.3% (WHO Classification). Since then the available surveillance data from few selected areas does not show any significant improvement in nutrition situation. This creates a need for a nutrition assessment to determine the nutrition situation for the entire district. The aim of the survey was to determine the nutritional status of children between 6-59 months or 65-110 cm using weight-for-height index. The survey also sought to establish underlying factors influencing the nutrition status and to provide recommendations for interventions based on the findings.
7
El Barde District Nutrition Assessment, December 2006 FSAU, IMC, UNICEF and WFP
1.3 Objectives of the study
1. To estimate the prevalence of acute malnutrition and nutritional oedema among children
aged 6-59 months or with height/length of 65-109.5 cm. 2. To estimate the level of malnutrition among adult women aged 15-49 years in the district 3. To identify underlying causes of malnutrition in young children in the area of assessment 4. To estimate the prevalence of some common diseases (measles, diarrhoea, suspected
malaria/febrile illness, and ARI) in the district 5. To estimate measles and polio vaccination and Vitamin A supplementation coverage
among children in the district 6. To estimate the crude and under-five mortality rates in the area of assessment
8
El Barde District Nutrition Assessment, December 2006 FSAU, IMC, UNICEF and WFP
2.0 BACKGROUND INFORMATION: 2.1 General overview The food security and nutrition situation in El Barde district has remained precarious for a long time now. FSAU Post Gu’06 analysis classified parts of El Barde district as faced with humanitarian emergency while the rest in Acute Food and Livelihood Crisis with moderate risks of deterioration. The situation of concern is attributed to the recurring drought situation including very poor GU’06 rains. The impact of drought together with constant insecurity has adversely disrupted the livelihood system in the district. The insecurity has also led to limitation of humanitarian intervention in most parts of the district. 2.2 Humanitarian Interventions Humanitarian activities are minimal in the district and are often disrupted by frequent episodes of insecurity in area. In 2000 ADRA started water projects with activities such as rehabilitation of boreholes and deepening shallow wells. IMC plays important role in the health sector with one MCH in El Barde town and five health posts, SFP activities and community therapeutic sites. MSF-B also manages one health post while WHO/UNICEF supports polio immunization activities. WFP has been supporting families with malnourished children admitted in the feeding programme with family rations to each recipient consisting of 2 bags of maize, 10kgs of beans and 4litres of oil. 2.3 Nutrition El Barde district has experienced a critical nutrition situation according to the FSAU long term malnutrition estimates for 1999-2005. The last nutrition assessment conducted in the districts in March 2004 reported a critical (WHO Classification) level of malnutrition with global acute malnutrition of 15.7% and severe acute malnutrition of 1.3%. Prior to this, in August 2000, an assessment which coved both neighbouring Rab Dhure and El Barde (both similar livelihoods) reported a GAM of 13.7% and a SAM of 3.8%. The differing times of year do not make a direct comparison feasible however it is useful in indicating a slight increase in the recent trends of acute malnutrition.
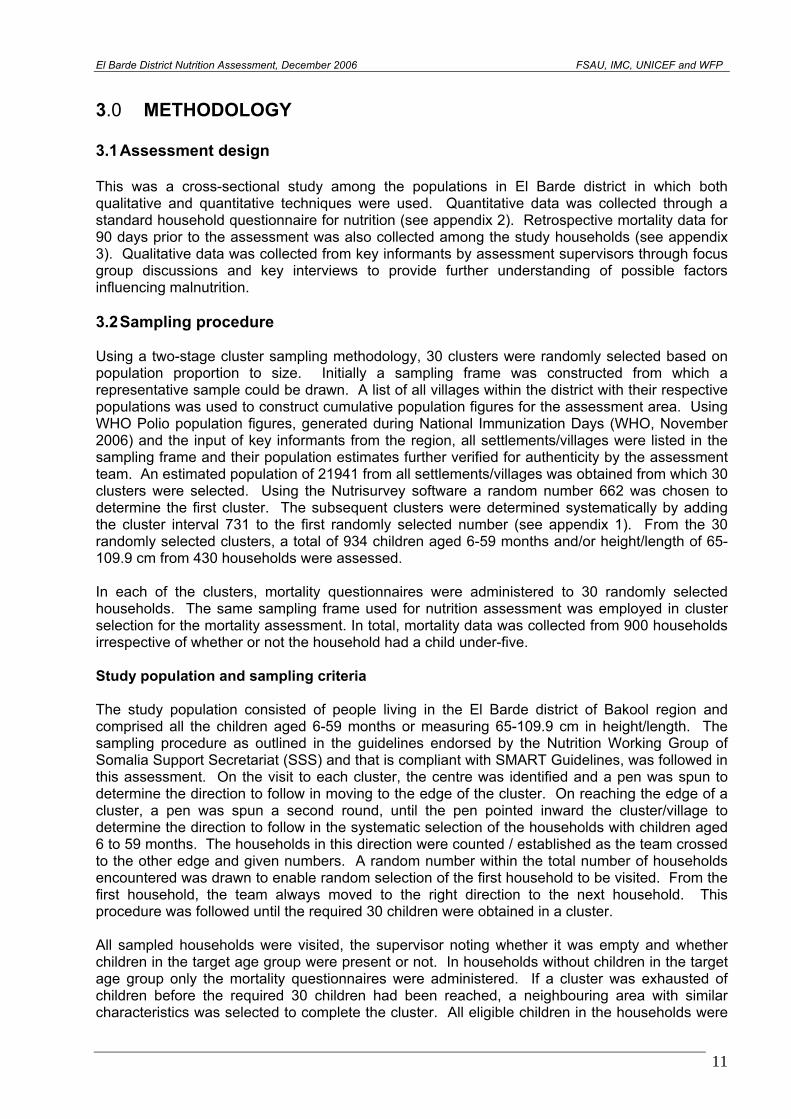
The FSAU sentinel sites surveillance system started in 2006 records high levels of acute of malnutrition, over the year though the trend is declining in the recent rounds (see graph). The feeding centres in the El Barde town and Qurajome village have also been recording a high admission. Data from the Health Information System (HIS) data for the months of September to November 2006 showed that 39% to 45% of the screened children were identified as acutely malnourished. The morbidity
(especially diarrhea and suspected malaria) and poor dietary diversity and sub-optimal child care practices are the main factor associated with malnutrition.
01020304050
Perc
enta
ge
Jan.
06Fe
b.06
Mar
.06
May
.06
Jun.
06Au
g.06
Nov
.06
Jan.
06Fe
b.06
Mar
.06
May
.06
Jun.
06Au
g.06
N0v
.06
Abeesaale Qurajome
Sites
P ro po rt io n o f malno urushed children in sent inel s ites in Elberde D istrict
2.4 Water and Environmental Sanitation
The main sources of water in the district are shallow wells and water catchments. With the frequent drought conditions experienced in the district, these sources dry up leading to acute
9
El Barde District Nutrition Assessment, December 2006 FSAU, IMC, UNICEF and WFP
water shortage for both the people and livestock. During dry spells people have to cover long distance to get water, alternatively they spend large amount of money to purchase water. The water shortage often leads to out-migration to other regions in search of water and pasture for the livestock. Quality of water is another challenge in the district given that water is hardly treated leading to water born diseases. Environmental sanitation is also generally poor in the areas with the majority of the households using bush to dispose human waste. This is a health hazard that has been associated with seasonal increase of diarrhea during rainy seasons. 2.5 Health issues Health services are provided by the only one MCH managed by IMC and six health posts five of which are under management of IMC and the other one by MSF-B. Public health facilities are very limited hence inaccessible to the majority of rural population who have to trek for long distance to seek health services. Consequently, sick people resort to traditional healers, reading Koran or purchase of medicines from pharmacies. In other cases, people would seek for medical attention when their conditions have deteriorated which may result in an extended recovery period or even death. Common illness reported in the MCH, health posts and sentinel sites include diarrhea, suspected malaria, ARI which are common during the wet seasons. Others health problems are intestinal parasite, anemia, skin and ear infection, wound and trauma and conjunctivitis. 2.6 Food security El Barde district is predominantly pastoral mainly relying on camel and shoats for their livelihood. The past drought conditions have adversely affected the livelihood resulting to loss of livestock and hence exposing the majority of the population to food insecurity. The FSAU Post Gu’06 analysis classified part of El Barde district as faced with humanitarian emergency while the rest with Acute Food and Livelihood Crisis with moderate risks of deterioration. This was mainly attributed to the impact of very poor or failed Gu’05, Deyr’05/06 and Gu’06 rains and the resultant pasture and water scarcity, poor livestock body condition, low milk production and even death of livestock. With poor livestock body conditions, the animal can fetch very low prices in the market, making it hard to purchase the staple cereals. The remaining livestock were reported to have out-migrated to the neighboring areas of Ethiopia and to Juba regions hence depriving members of household milk for consumption and income. Even among the few agro-pastoral communities in the district, rain failure resulted in crop failures, meaning that they had to rely on food purchase or such means as food aid and informal support for food. However, the situation is likely to be reversed given good Deyr ’06 rains received in the area but it would take more than one season to recover because of high depletion of productive assets.
10
El Barde District Nutrition Assessment, December 2006 FSAU, IMC, UNICEF and WFP
3.0 METHODOLOGY 3.1 Assessment design This was a cross-sectional study among the populations in El Barde district in which both qualitative and quantitative techniques were used. Quantitative data was collected through a standard household questionnaire for nutrition (see appendix 2). Retrospective mortality data for 90 days prior to the assessment was also collected among the study households (see appendix 3). Qualitative data was collected from key informants by assessment supervisors through focus group discussions and key interviews to provide further understanding of possible factors influencing malnutrition. 3.2 Sampling procedure Using a two-stage cluster sampling methodology, 30 clusters were randomly selected based on population proportion to size. Initially a sampling frame was constructed from which a representative sample could be drawn. A list of all villages within the district with their respective populations was used to construct cumulative population figures for the assessment area. Using WHO Polio population figures, generated during National Immunization Days (WHO, November 2006) and the input of key informants from the region, all settlements/villages were listed in the sampling frame and their population estimates further verified for authenticity by the assessment team. An estimated population of 21941 from all settlements/villages was obtained from which 30 clusters were selected. Using the Nutrisurvey software a random number 662 was chosen to determine the first cluster. The subsequent clusters were determined systematically by adding the cluster interval 731 to the first randomly selected number (see appendix 1). From the 30 randomly selected clusters, a total of 934 children aged 6-59 months and/or height/length of 65-109.9 cm from 430 households were assessed. In each of the clusters, mortality questionnaires were administered to 30 randomly selected households. The same sampling frame used for nutrition assessment was employed in cluster selection for the mortality assessment. In total, mortality data was collected from 900 households irrespective of whether or not the household had a child under-five. Study population and sampling criteria The study population consisted of people living in the El Barde district of Bakool region and comprised all the children aged 6-59 months or measuring 65-109.9 cm in height/length. The sampling procedure as outlined in the guidelines endorsed by the Nutrition Working Group of Somalia Support Secretariat (SSS) and that is compliant with SMART Guidelines, was followed in this assessment. On the visit to each cluster, the centre was identified and a pen was spun to determine the direction to follow in moving to the edge of the cluster. On reaching the edge of a cluster, a pen was spun a second round, until the pen pointed inward the cluster/village to determine the direction to follow in the systematic selection of the households with children aged 6 to 59 months. The households in this direction were counted / established as the team crossed to the other edge and given numbers. A random number within the total number of households encountered was drawn to enable random selection of the first household to be visited. From the first household, the team always moved to the right direction to the next household. This procedure was followed until the required 30 children were obtained in a cluster. All sampled households were visited, the supervisor noting whether it was empty and whether children in the target age group were present or not. In households without children in the target age group only the mortality questionnaires were administered. If a cluster was exhausted of children before the required 30 children had been reached, a neighbouring area with similar characteristics was selected to complete the cluster. All eligible children in the households were
11
El Barde District Nutrition Assessment, December 2006 FSAU, IMC, UNICEF and WFP
measured and if a child or primary caregiver was absent, an appointment was booked for a later visit in the course of the assessment. 3.3 Data collection. 3.3.1 Anthropometric measurements. The anthropometric data were collected using the procedure stipulated by the WHO (1995) for taking anthropometric measurements. It was ensured that this procedure was adhered to. The protocol used was as follows: Weight: Salter Scale with calibrations of 100g-unit was used. This was adjusted before weighing every child by setting it to zero. The female children would be lightly dressed before having the weight taken while clothes for the male children were removed. Two readings were taken for each child, shouted loudly and the average recorded on the questionnaire. Height: For height, a vertical or horizontal measuring board reading a maximum of 130 cm and accurate to 0.1cm was used to take the height or length of a child. The child would stand on the measuring board barefooted; have hands hanging loosely with feet parallel to the body, and heels, buttocks, shoulders and back of the head touching the board. The head would be held comfortably erect with the lower border of the orbit of the eye being in the same horizontal plane as the external canal of the ear. The headpiece of the measuring board was then pushed gently, pressing the hair and making contact with the top of the head. Height/length was then read to the nearest 0.1cm. Two readings were recorded and the computed average used in the analysis. Length: For children aged 6 to 24 months or between 65cm to 84.5cm length instead of height was taken. The child was made to lie flat on the length board. The sliding piece was placed at the edge of the bare feet as the head (with crushing of the hair) touched the other end of the measuring device. Then two readings were taken and the average computed. Arm Circumference: The Mid Upper Arm Circumference was measured using a MUAC tape to the nearest 0.1 cm left arm. Two readings were taken and the average recorded for each child. 3.3.2 Child age determination Where useful documents like growth monitoring/clinic attendance cards and birth certificates were available, they were used to determine the child’s age. A calendar of events (appendix 5) was also used to estimate the age of the child. Though not entirely accurate, ages were still regarded as important indicators and were approximate/average pointers for identification. 3.3.3 Oedema Oedema, defined as bilateral oedema on the lower limbs was assessed by gently pressing the feet to check if a depression is left after at least three seconds. It was confirmed, if present, by the supervisor and then recorded. 3.3.4 Morbidity Morbidity pattern was assessed by asking about incidences of common communicable diseases i.e. diarrhoea, acute respiratory infection, suspected malaria/ febrile illness and measles in the two weeks prior to the assessment. Diarrhoea: Diarrhoea was defined as ‘three or more loose or watery stools per day’. Measles: Defined as ‘more than three signs of the following: fever, and skin rash, runny nose or red eyes, and/or mouth infection, or chest infection.
12
El Barde District Nutrition Assessment, December 2006 FSAU, IMC, UNICEF and WFP
Acute Respiratory Infection (ARI): Asked as oof wareen or wareento. Defined as ‘cough, rapid breathing and fever’. Suspected malaria/acute febrile illness: Defined as ‘periodic chills, fever, sweating or coma. 3.3.5 Mortality The mortality assessment was done concurrently with nutrition assessment in which a 30 by 30 cluster sampling methodology was used. The assessment methodology used for the nutrition assessment was adopted with the exception that households were selected as the final sampling unit. At least 30 households were randomly selected in each cluster and the mortality questionnaire (appendix 3) administered to a responsible member of that household. All households within the selected cluster were eligible for inclusion in the mortality assessment, whether there was a child under the age of five or not. Households were systematically surveyed until the 30th household. Each household surveyed was asked the composition of their members in two parts- those members less than 5 years and the total number of household members. The household was then asked how many if any of the household members had died, left or arrived in the last three months. A total of 900 households were included in the assessment. The crude and under five mortality rates were generated automatically by the Nutrisurvey software as deaths per 10,000 persons per day using a recall period of 90 days. If a household member had died, the respondent was asked to describe the suspected causes or signs and symptoms of the illness likely to have caused the death and these were recorded. Whereas mortality rates have previously been interpreted according to the WHO reference below
• For under-five years old children -Under-five mortality rates >= 2 deaths/10,000/day indicate a situation of alert -Under five mortality rate >=4 deaths/10,000 children/day indicate an emergency
• For the total population -Mortality rates >=1 deaths/10,000 persons/day indicate an alert situation -Mortality rates >=2 deaths/10,000 persons/day indicate an emergency,
Sphere 2004 recommends levels below 0.44/10,000/day as acceptable for the Sub-Saharan African countries. In this assessment, Sphere 2004 recommendation is used in the analysis. 3.3.6 Dietary Diversity Dietary diversity (when households consume four or more food groups) was determined by taking a simple count of various food groups consumed in a given household over the past twenty four hours. A total of 12 FAO recommended food groups were considered which included Cereals & cereal products; Roots & tubers; Vegetables; Fruits; Meat and meat products, Eggs; Fish; Legumes; Milk & its products; Fats & oil; Sugar & honey and Miscellaneous. 3.3.7 Vitamin A Deficiency During the assessment, Vitamin A deficiency (VAD) prevalence was estimated by assessing if any member(s) of the households experienced night blindness.
13
El Barde District Nutrition Assessment, December 2006 FSAU, IMC, UNICEF and WFP
3.4 Description of assessment activities Six teams each consisting of two enumerators; one team leader and one supervisor conducted the assessment with each team handling one cluster in a day. An elder from each village/cluster assisted the teams in ground identification of the cluster and introduction to the community, its centre and boundaries. Team leaders and Supervisors were seconded from the participating partners namely; FSAU, IMC, UNICEF and WFP. The enumerators, team leaders and supervisors were selected on the basis of their experience with previous assessments, need for participation in future nutrition activities and ability to learn nutrition assessment procedures during training. Table 2: Chronology of activities for the El Barde District Nutrition Assessment Major Activity Dates Preparation of tools, methodology & review of secondary data (Nairobi) Resource mobilization; Joint planning meetings with partners
November 2006
Training of enumerators, pre-testing questionnaire and cluster Identification
December 16th-19th, 2006
Collection of data December 20th-25th, 2006 Entry of data December 21st-26th, 2006 Data cleaning and analysis December 26th-28th, 2006 Presentation of preliminary results to partners January 4th , 2007 Circulation of draft report to partners February 19th, 2007 Circulation of final report 6th, March, 2007 3.5 Quality Control Procedures A comprehensive training of enumerators and supervisors was conducted covering interviewing techniques, sampling procedure, inclusion and exclusion criteria, sources and reduction of errors, taking of measurements, standardisation of questions in the questionnaire, levels of precision required in measurements, diagnosis of oedema and measles, verification of deaths within households, handling of equipment, and the general courtesy during the assessment. Standardisation of measurement and pre-testing of the questionnaire and equipment was carried out in the villages in the outskirts of El Barde town. These villages were not selected clusters for the actual assessment. Pre-testing involved familiarising assessment teams with village/cluster entry; administering the questionnaire, sampling procedure, correct taking of measurements and recording. After the field exercise, views were exchanged to address the difficulties identified; appropriateness of the questions reviewed and necessary changes made. Quality of data was also ensured through (i) crosschecking of completed questionnaires on daily basis and recording of observations and confirmation of measles, severe malnutrition and death cases by supervisors. All households sampled were visited and recorded including households without anyone present at the time (ii) daily review undertaken with the teams to address any difficulties encountered, (iii) progress evaluation was carried out according to the time schedule and progress reports shared with partners on regular basis, (iv) continuous data cleaning upon and after entry which made it easy to detect any outliers/ mistakes and to replace or repeat households depending on magnitude of error (v) monitoring accuracy of equipment (weighing scales) by regularly measuring objects of known weights and (vi) continuous reinforcement of good practices. Moreover, the CHECK program of EPI 6 computer package was used to control and eliminate errors during data entry by setting conditions such that any data outside the range was automatically rejected e.g. a child’s age was set to have values from 6 to 59 and values outside this range were automatically rejected. All measurements were loudly shouted by both the enumerators reading and recording them to reduce errors during recording.
14
El Barde District Nutrition Assessment, December 2006 FSAU, IMC, UNICEF and WFP
3.6 Data Processing & Analysis 3.6.1 Data entry, cleaning, processing and analysis Data was entered and analysed using Nutrisurvey and EPI6 computer based packages. Running and tabulating all variable frequencies was carried out as part of data cleaning. The Nutrisurvey Anthropometry and EPINUT programmes were used to convert the measurements (weight and height) into nutritional indicators and comparison made with the National Centre for Health Statistics (NCHS) references as designed by WHO (1983). Cleaning and analysis of certain variables was undertaken in Microsoft Excel. 3.6.2 Characteristics of assessment population and other variables Frequencies and cross-tabulations were used to give percentages, confidence intervals, means, standard deviations and associations in the descriptive and statistical analysis and presentation of general household and child characteristics. 3.6.3 Creation of nutritional status indices The anthropometric measurement of weight and height were used to compute the WFH nutritional status indicators of the studied children. Weight for Height (WFH) expressed the weight of the child as a percentage of the expected weight for the standard child of that height as given by NCHS. WFH measures acute malnutrition or wasting. Using EPINUT, Z-scores were generated and the anthropometric indicator, WFH, was used to classify children into categories of nutritional status as follows: < -3 Z-Scores or oedema = Severe acute malnutrition -3 Z-Scores ≤WFH< -2 Z-Scores = Moderate acute malnutrition <-2 Z-score or oedema = Global/total acute malnutrition ≥ -2Z-Scores = Normal Similarly, MUAC measurements were also used to classify children into categories of nutritional status and mortality risks as follows according SACB Nutrition assessment guidelines:
<11.0 cm = Severe malnutrition >=11.0 < 12.5 = Moderate malnutrition >=12.5 -- < 13.5 = At risk of Malnutrition >=13.5 cm = Normal
For adults, the following categories (WHO) were used:
a) For non pregnant women: < 16.0 cm = Severe Acute malnutrition < 18.5 cm (with oedema) = Severe acute Malnutrition ≤ 18.5 cm = Global (Total) Acute Malnutrition > 18.5 cm = Normal
b) For pregnant women: ≤ 20.7 cm = severely at risk ≤ 23.0 cm = Total at risk > 23.0 cm = Normal
15
El Barde District Nutrition Assessment, December 2006 FSAU, IMC, UNICEF and WFP
4 ASSESSMENT RESULTS
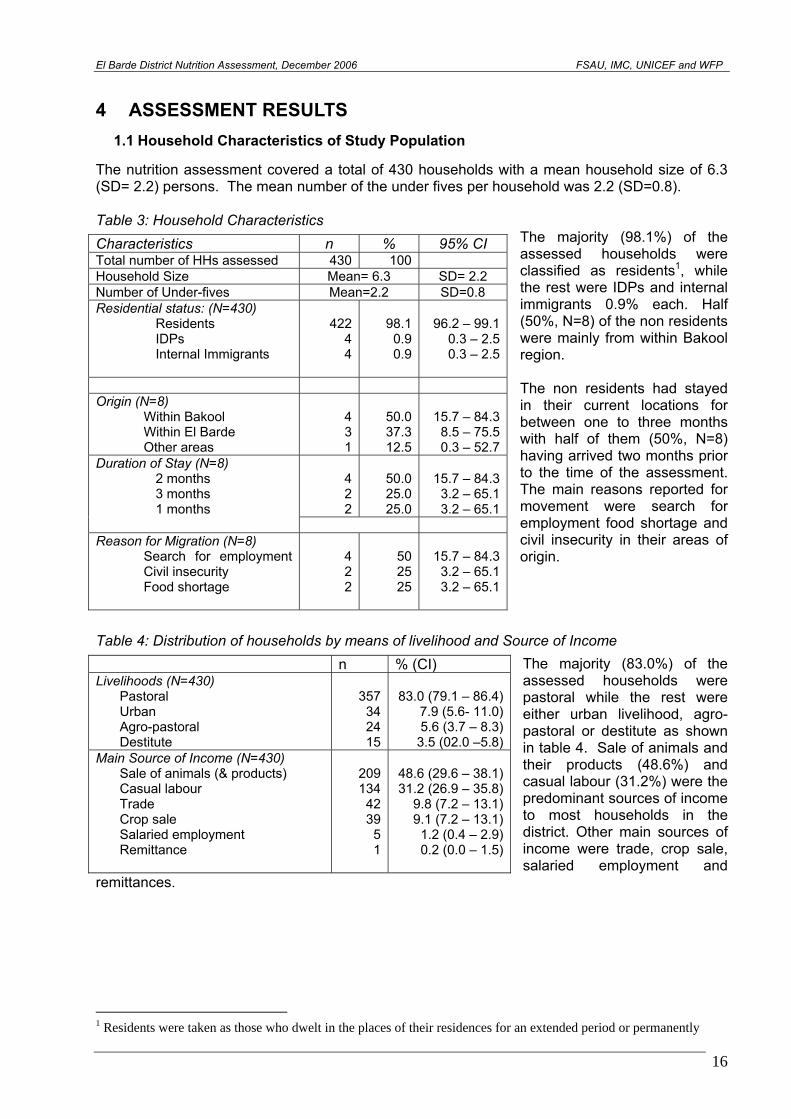
1.1 Household Characteristics of Study Population The nutrition assessment covered a total of 430 households with a mean household size of 6.3 (SD= 2.2) persons. The mean number of the under fives per household was 2.2 (SD=0.8).
The majority (98.1%) of the assessed households were classified as residents1, while the rest were IDPs and internal immigrants 0.9% each. Half (50%, N=8) of the non residents were mainly from within Bakool region. The non residents had stayed in their current locations for between one to three months with half of them (50%, N=8) having arrived two months prior to the time of the assessment. The main reasons reported for movement were search for employment food shortage and civil insecurity in their areas of origin.
Table 3: Household Characteristics
Characteristics n % 95% CI Total number of HHs assessed 430 100Household Size Mean= 6.3 SD= 2.2 Number of Under-fives Mean=2.2 SD=0.8 Residential status: (N=430)
Residents IDPs Internal Immigrants
42244
98.10.90.9
96.2 – 99.10.3 – 2.50.3 – 2.5
Origin (N=8)
Within Bakool Within El Barde Other areas
431
50.037.312.5
15.7 – 84.38.5 – 75.50.3 – 52.7
Duration of Stay (N=8) 2 months 3 months 1 months
422
50.025.025.0
15.7 – 84.33.2 – 65.13.2 – 65.1
Reason for Migration (N=8)
Search for employment Civil insecurity Food shortage
422
502525
15.7 – 84.33.2 – 65.13.2 – 65.1
Table 4: Distribution of households by means of livelihood and Source of Income
The majority (83.0%) of the assessed households were pastoral while the rest were either urban livelihood, agro-pastoral or destitute as shown in table 4. Sale of animals and their products (48.6%) and casual labour (31.2%) were the predominant sources of income to most households in the district. Other main sources of income were trade, crop sale, salaried employment and
remittances.
n % (CI) Livelihoods (N=430)
Pastoral Urban Agro-pastoral Destitute
357342415
83.0 (79.1 – 86.4)7.9 (5.6- 11.0)5.6 (3.7 – 8.3)
3.5 (02.0 –5.8)Main Source of Income (N=430)
Sale of animals (& products) Casual labour Trade Crop sale Salaried employment Remittance
209134
4239
51
48.6 (29.6 – 38.1)31.2 (26.9 – 35.8)
9.8 (7.2 – 13.1)9.1 (7.2 – 13.1)
1.2 (0.4 – 2.9)0.2 (0.0 – 1.5)
1 Residents were taken as those who dwelt in the places of their residences for an extended period or permanently
16
El Barde District Nutrition Assessment, December 2006 FSAU, IMC, UNICEF and WFP
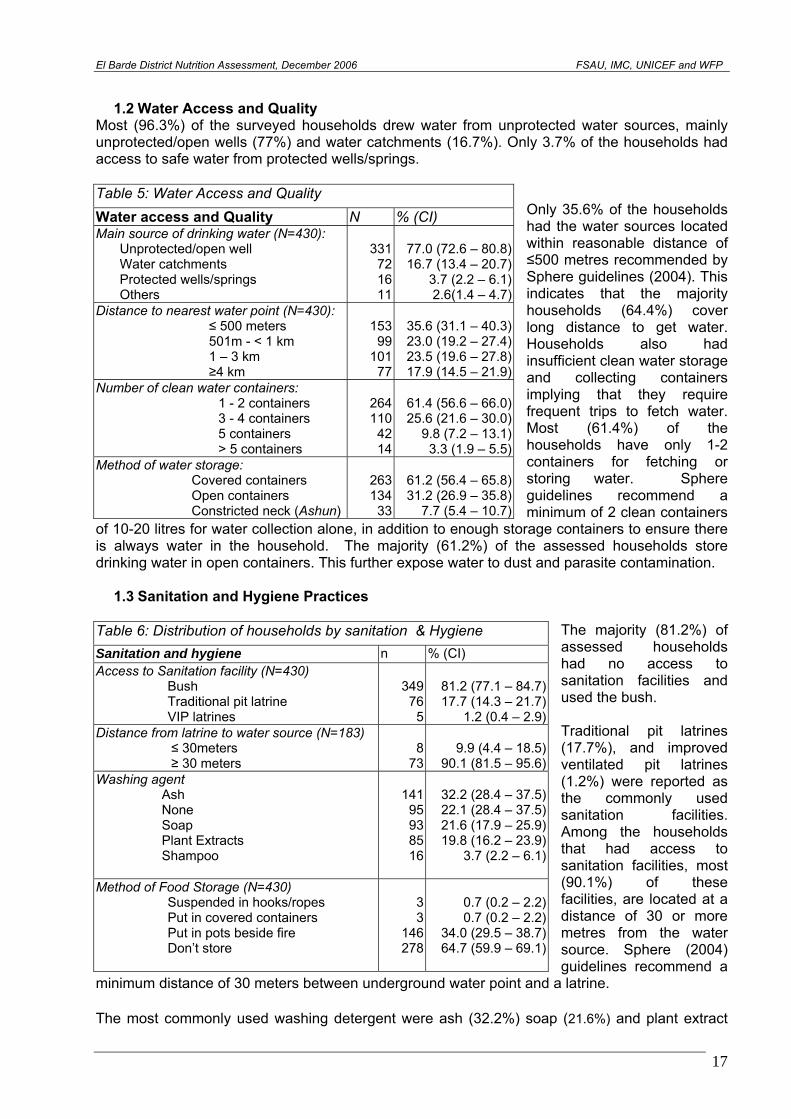
1.2 Water Access and Quality
Most (96.3%) of the surveyed households drew water from unprotected water sources, mainly unprotected/open wells (77%) and water catchments (16.7%). Only 3.7% of the households had access to safe water from protected wells/springs.
Only 35.6% of the households had the water sources located within reasonable distance of ≤500 metres recommended by Sphere guidelines (2004). This indicates that the majority households (64.4%) cover long distance to get water. Households also had insufficient clean water storage and collecting containers implying that they require frequent trips to fetch water. Most (61.4%) of the households have only 1-2 containers for fetching or storing water. Sphere guidelines recommend a minimum of 2 clean containers
of 10-20 litres for water collection alone, in addition to enough storage containers to ensure there is always water in the household. The majority (61.2%) of the assessed households store drinking water in open containers. This further expose water to dust and parasite contamination.
Table 5: Water Access and Quality
Water access and Quality N % (CI) Main source of drinking water (N=430):
Unprotected/open well Water catchments Protected wells/springs Others
331721611
77.0 (72.6 – 80.8)16.7 (13.4 – 20.7)
3.7 (2.2 – 6.1)2.6(1.4 – 4.7)
Distance to nearest water point (N=430): ≤ 500 meters 501m - < 1 km 1 – 3 km ≥4 km
15399
10177
35.6 (31.1 – 40.3)23.0 (19.2 – 27.4)23.5 (19.6 – 27.8)17.9 (14.5 – 21.9)
Number of clean water containers: 1 - 2 containers 3 - 4 containers 5 containers > 5 containers
264110
4214
61.4 (56.6 – 66.0)25.6 (21.6 – 30.0)
9.8 (7.2 – 13.1)3.3 (1.9 – 5.5)
Method of water storage: Covered containers Open containers Constricted neck (Ashun)
263134
33
61.2 (56.4 – 65.8)31.2 (26.9 – 35.8)
7.7 (5.4 – 10.7)
1.3 Sanitation and Hygiene Practices
The majority (81.2%) of assessed households had no access to sanitation facilities and used the bush. Traditional pit latrines (17.7%), and improved ventilated pit latrines (1.2%) were reported as the commonly used sanitation facilities. Among the households that had access to sanitation facilities, most (90.1%) of these facilities, are located at a distance of 30 or more metres from the water source. Sphere (2004) guidelines recommend a
minimum distance of 30 meters between underground water point and a latrine.
Table 6: Distribution of households by sanitation & Hygiene
Sanitation and hygiene n % (CI) Access to Sanitation facility (N=430)
Bush Traditional pit latrine VIP latrines
34976
5
81.2 (77.1 – 84.7)17.7 (14.3 – 21.7)
1.2 (0.4 – 2.9)Distance from latrine to water source (N=183)
≤ 30meters ≥ 30 meters
873
9.9 (4.4 – 18.5)90.1 (81.5 – 95.6)
Washing agent Ash None Soap Plant Extracts Shampoo
14195938516
32.2 (28.4 – 37.5)22.1 (28.4 – 37.5)21.6 (17.9 – 25.9)19.8 (16.2 – 23.9)
3.7 (2.2 – 6.1)
Method of Food Storage (N=430) Suspended in hooks/ropes Put in covered containers Put in pots beside fire Don’t store
33
146278
0.7 (0.2 – 2.2)0.7 (0.2 – 2.2)
34.0 (29.5 – 38.7)64.7 (59.9 – 69.1)
The most commonly used washing detergent were ash (32.2%) soap (21.6%) and plant extract
17
El Barde District Nutrition Assessment, December 2006 FSAU, IMC, UNICEF and WFP
(19.8%). A significant 22.1% of the households were reportedly not using any washing detergent which may compromise the hygiene requirements. The majority of the households (64.7%) were reportedly not storing any food while 34% stored food in pots beside fire. The remainder stored food either in covered containers or suspended in hooks/ropes.
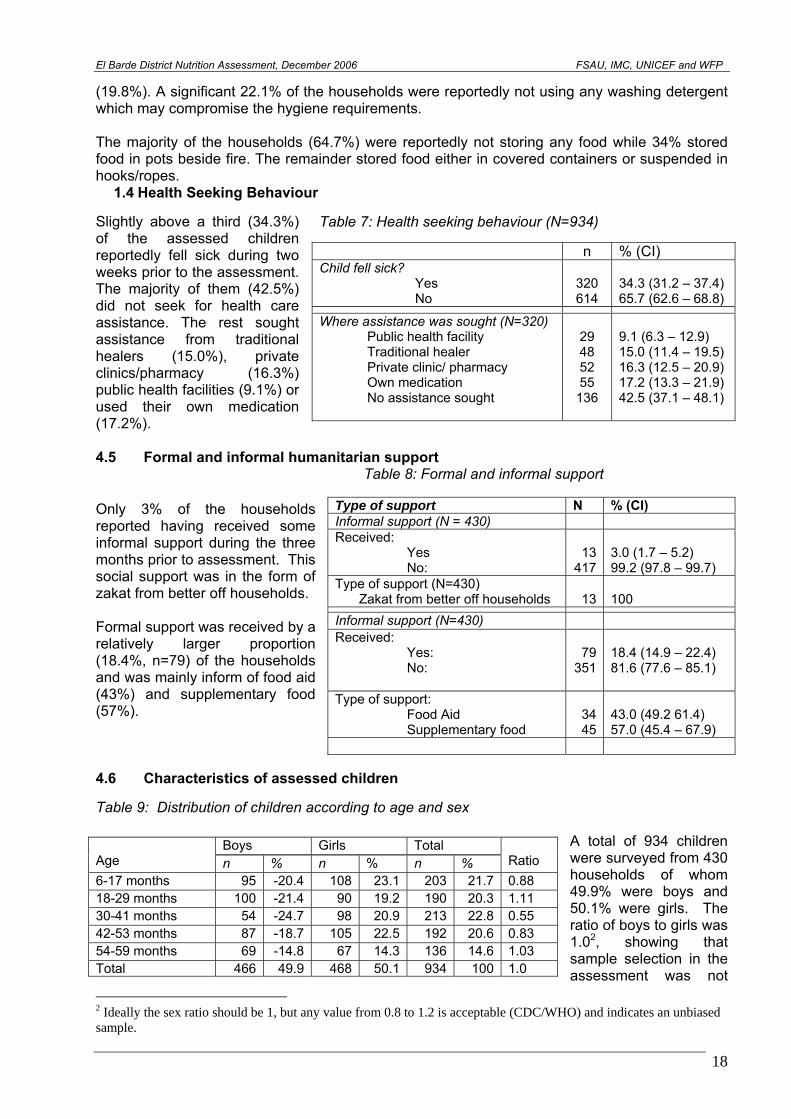
1.4 Health Seeking Behaviour Slightly above a third (34.3%) of the assessed children reportedly fell sick during two weeks prior to the assessment. The majority of them (42.5%) did not seek for health care assistance. The rest sought assistance from traditional healers (15.0%), private clinics/pharmacy (16.3%) public health facilities (9.1%) or used their own medication (17.2%).
Table 7: Health seeking behaviour (N=934) n % (CI) Child fell sick?
Yes No
320 614
34.3 (31.2 – 37.4) 65.7 (62.6 – 68.8)
Where assistance was sought (N=320) Public health facility Traditional healer Private clinic/ pharmacy Own medication No assistance sought
29 48 52 55
136
9.1 (6.3 – 12.9) 15.0 (11.4 – 19.5) 16.3 (12.5 – 20.9) 17.2 (13.3 – 21.9) 42.5 (37.1 – 48.1)
4.5 Formal and informal humanitarian support
Table 8: Formal and informal support Only 3% of the households reported having received some informal support during the three months prior to assessment. This social support was in the form of zakat from better off households. Formal support was received by a relatively larger proportion (18.4%, n=79) of the households and was mainly inform of food aid (43%) and supplementary food (57%).
Type of support N % (CI) Informal support (N = 430) Received:
Yes No:
13
417
3.0 (1.7 – 5.2) 99.2 (97.8 – 99.7)
Type of support (N=430) Zakat from better off households
13
100
Informal support (N=430) Received:
Yes: No:
79
351
18.4 (14.9 – 22.4) 81.6 (77.6 – 85.1)
Type of support: Food Aid Supplementary food
34 45
43.0 (49.2 61.4) 57.0 (45.4 – 67.9)
4.6 Characteristics of assessed children Table 9: Distribution of children according to age and sex
A total of 934 children were surveyed from 430 households of whom 49.9% were boys and 50.1% were girls. The ratio of boys to girls was 1.02, showing that sample selection in the assessment was not
Boys Girls Total Age n % n % n %
Ratio
6-17 months 95 -20.4 108 23.1 203 21.7 0.88 18-29 months 100 -21.4 90 19.2 190 20.3 1.11 30-41 months 54 -24.7 98 20.9 213 22.8 0.55 42-53 months 87 -18.7 105 22.5 192 20.6 0.83 54-59 months 69 -14.8 67 14.3 136 14.6 1.03 Total 466 49.9 468 50.1 934 100 1.0
2 Ideally the sex ratio should be 1, but any value from 0.8 to 1.2 is acceptable (CDC/WHO) and indicates an unbiased sample.
18
El Barde District Nutrition Assessment, December 2006 FSAU, IMC, UNICEF and WFP
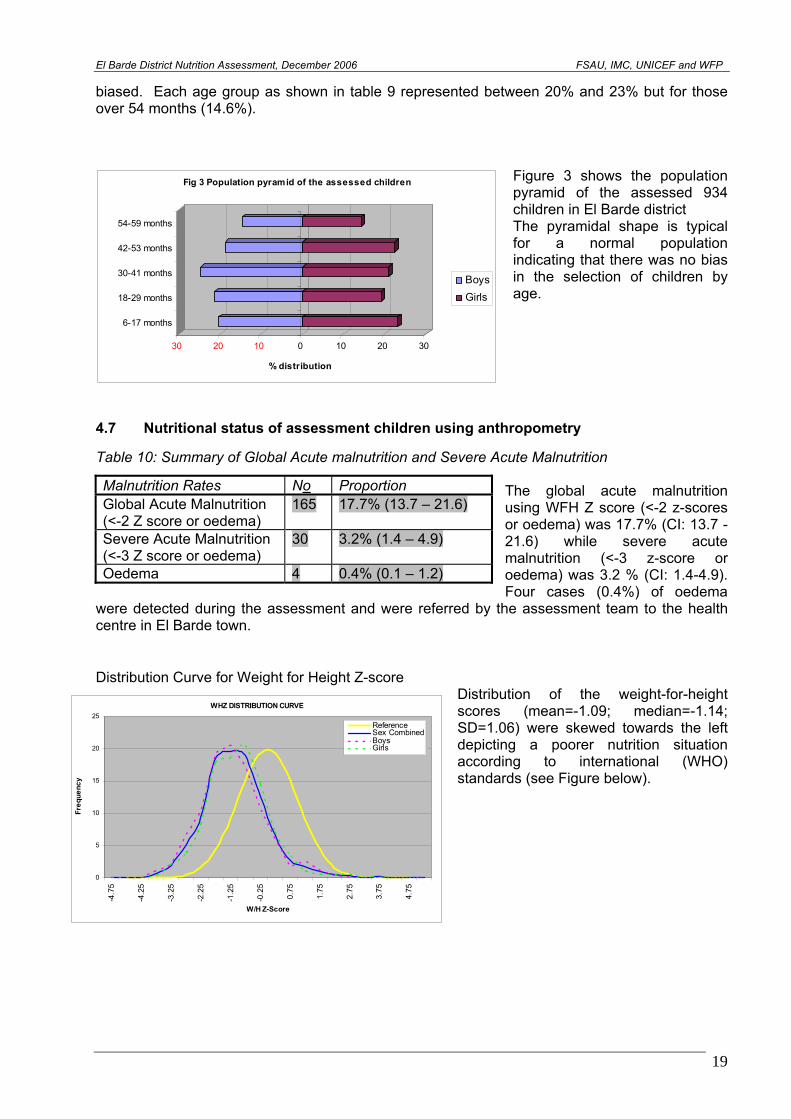
biased. Each age group as shown in table 9 represented between 20% and 23% but for those over 54 months (14.6%).
Figure 3 shows the population pyramid of the assessed 934 children in El Barde district The pyramidal shape is typical for a normal population indicating that there was no bias in the selection of children by age. 30 20 10 0 10 20 30
% distribution
6-17 months
18-29 months
30-41 months
42-53 months
54-59 months
Fig 3 Population pyramid of the assessed children
BoysGirls
4.7 Nutritional status of assessment children using anthropometry Table 10: Summary of Global Acute malnutrition and Severe Acute Malnutrition
The global acute malnutrition using WFH Z score (<-2 z-scores or oedema) was 17.7% (CI: 13.7 -21.6) while severe acute malnutrition (<-3 z-score or oedema) was 3.2 % (CI: 1.4-4.9). Four cases (0.4%) of oedema
were detected during the assessment and were referred by the assessment team to the health centre in El Barde town.
Malnutrition Rates No Proportion Global Acute Malnutrition (<-2 Z score or oedema)
165 17.7% (13.7 – 21.6)
Severe Acute Malnutrition (<-3 Z score or oedema)
30 3.2% (1.4 – 4.9)
Oedema 4 0.4% (0.1 – 1.2)
Distribution Curve for Weight for Height Z-score
Distribution of the weight-for-height scores (mean=-1.09; median=-1.14; SD=1.06) were skewed towards the left depicting a poorer nutrition situation according to international (WHO) standards (see Figure below).
WHZ DISTRIBUTION CURVE
0
5
10
15
20
25
-4.7
5
-4.2
5
-3.2
5
-2.2
5
-1.2
5
-0.2
5
0.75
1.75
2.75
3.75
4.75
W/H Z-Score
Freq
uenc
y
ReferenceSex CombinedBoysGirls
19
El Barde District Nutrition Assessment, December 2006 FSAU, IMC, UNICEF and WFP
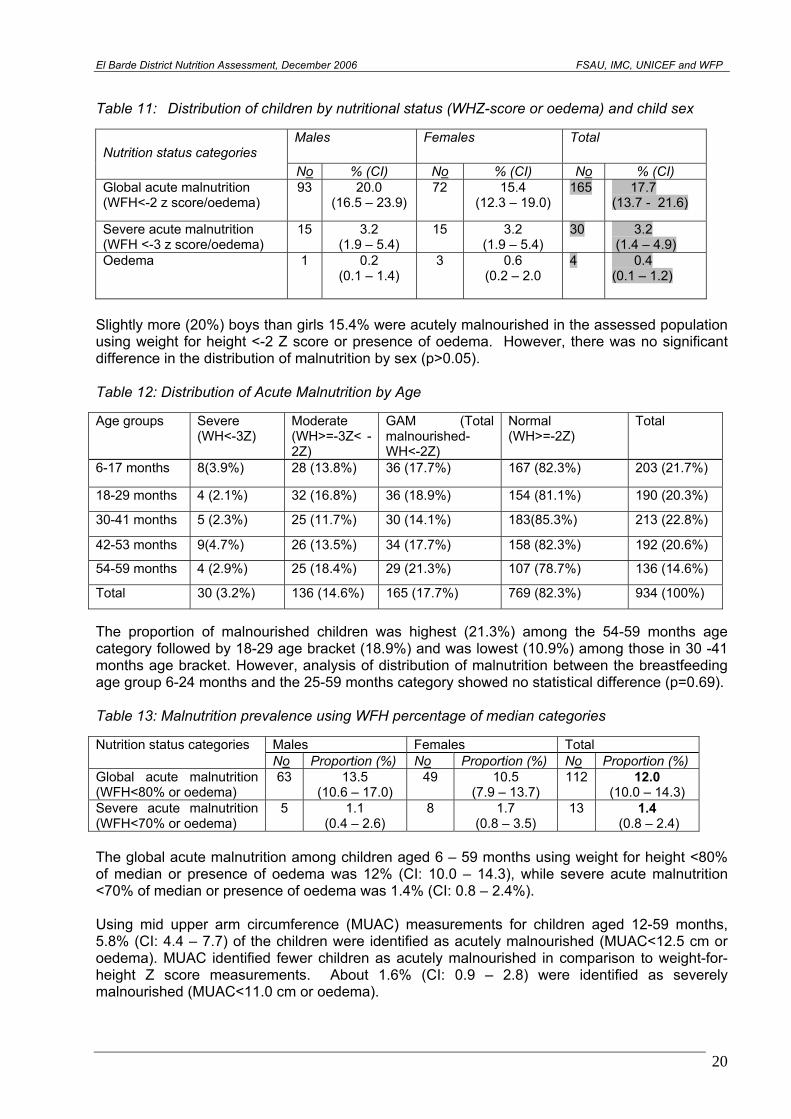
Table 11: Distribution of children by nutritional status (WHZ-score or oedema) and child sex
Males Females Total Nutrition status categories
No % (CI) No % (CI) No % (CI) Global acute malnutrition (WFH<-2 z score/oedema)
93 20.0 (16.5 – 23.9)
72 15.4 (12.3 – 19.0)
165 17.7 (13.7 - 21.6)
Severe acute malnutrition (WFH <-3 z score/oedema)
15 3.2 (1.9 – 5.4)
15 3.2 (1.9 – 5.4)
30 3.2 (1.4 – 4.9)
Oedema 1 0.2 (0.1 – 1.4)
3 0.6 (0.2 – 2.0
4 0.4 (0.1 – 1.2)
Slightly more (20%) boys than girls 15.4% were acutely malnourished in the assessed population using weight for height <-2 Z score or presence of oedema. However, there was no significant difference in the distribution of malnutrition by sex (p>0.05). Table 12: Distribution of Acute Malnutrition by Age Age groups Severe
(WH<-3Z) Moderate (WH>=-3Z< -2Z)
GAM (Total malnourished-WH<-2Z)
Normal (WH>=-2Z)
Total
6-17 months 8(3.9%) 28 (13.8%) 36 (17.7%) 167 (82.3%) 203 (21.7%)
18-29 months 4 (2.1%) 32 (16.8%) 36 (18.9%) 154 (81.1%) 190 (20.3%)
30-41 months 5 (2.3%) 25 (11.7%) 30 (14.1%) 183(85.3%) 213 (22.8%)
42-53 months 9(4.7%) 26 (13.5%) 34 (17.7%) 158 (82.3%) 192 (20.6%)
54-59 months 4 (2.9%) 25 (18.4%) 29 (21.3%) 107 (78.7%) 136 (14.6%)
Total 30 (3.2%) 136 (14.6%) 165 (17.7%) 769 (82.3%) 934 (100%)
The proportion of malnourished children was highest (21.3%) among the 54-59 months age category followed by 18-29 age bracket (18.9%) and was lowest (10.9%) among those in 30 -41 months age bracket. However, analysis of distribution of malnutrition between the breastfeeding age group 6-24 months and the 25-59 months category showed no statistical difference (p=0.69). Table 13: Malnutrition prevalence using WFH percentage of median categories
Males Females Total Nutrition status categories No Proportion (%) No Proportion (%) No Proportion (%)
Global acute malnutrition (WFH<80% or oedema)
63 13.5 (10.6 – 17.0)
49 10.5 (7.9 – 13.7)
112 12.0 (10.0 – 14.3)
Severe acute malnutrition (WFH<70% or oedema)
5 1.1 (0.4 – 2.6)
8 1.7 (0.8 – 3.5)
13 1.4 (0.8 – 2.4)
The global acute malnutrition among children aged 6 – 59 months using weight for height <80% of median or presence of oedema was 12% (CI: 10.0 – 14.3), while severe acute malnutrition <70% of median or presence of oedema was 1.4% (CI: 0.8 – 2.4%). Using mid upper arm circumference (MUAC) measurements for children aged 12-59 months, 5.8% (CI: 4.4 – 7.7) of the children were identified as acutely malnourished (MUAC<12.5 cm or oedema). MUAC identified fewer children as acutely malnourished in comparison to weight-for-height Z score measurements. About 1.6% (CI: 0.9 – 2.8) were identified as severely malnourished (MUAC<11.0 cm or oedema).
20
El Barde District Nutrition Assessment, December 2006 FSAU, IMC, UNICEF and WFP
Table 14: Nutrition status of Children (12-59 months) by MUAC
Males Females Total (N=805) Malnutrition N % N % N % (95% CI)
Severe (MUAC <11 cm or oedema)
5 1.2 (0.4 – 3.0)
8 2.0 (0.9 – 4.1)
13 1.6 (0.9 -2.8)
Moderate (11≤MUAC<12.5 cm) 19 4.6 (2.9 – 7.3)
15 3.8 (2.2 – 6.3)
34 4.2 (3.0 – 5.9)
Total (MUAC <12.5 cm or oedema)
24 5.9 (3.9 – 8.7)
23 5.8 (3.8 – 8.7)
47 5.8 (4.4 – 7.7)
At risk (MUAC 12.5- <13.5 cm) 13 3.2 (1.8 – 5.5)
9 2.3 (1.8 – 5.5)
22 2.7 (1.8 – 4.2)
Normal (MUAC >=13.5 cm) 305 74 (69.8 – 78.5)
314 79.5 (75.1 – 83.3)
619 76.9 (73.8-79.9)
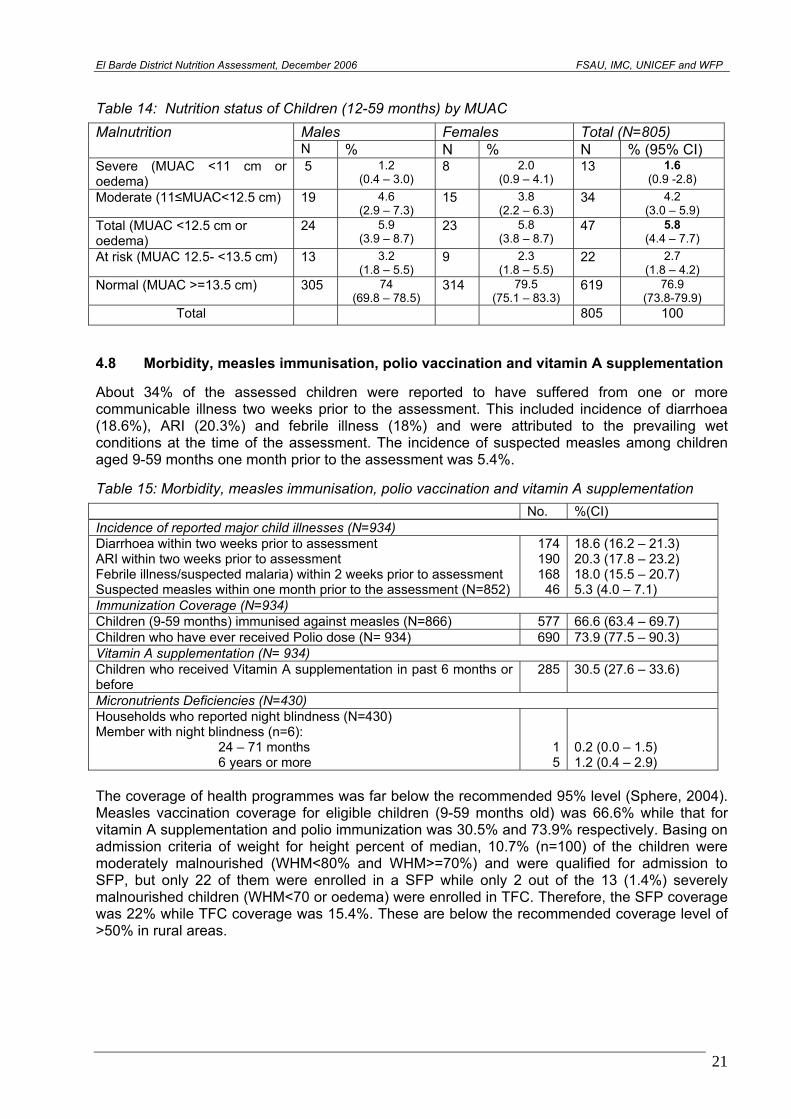
Total 805 100 4.8 Morbidity, measles immunisation, polio vaccination and vitamin A supplementation About 34% of the assessed children were reported to have suffered from one or more communicable illness two weeks prior to the assessment. This included incidence of diarrhoea (18.6%), ARI (20.3%) and febrile illness (18%) and were attributed to the prevailing wet conditions at the time of the assessment. The incidence of suspected measles among children aged 9-59 months one month prior to the assessment was 5.4%. Table 15: Morbidity, measles immunisation, polio vaccination and vitamin A supplementation
No. %(CI) Incidence of reported major child illnesses (N=934) Diarrhoea within two weeks prior to assessment ARI within two weeks prior to assessment Febrile illness/suspected malaria) within 2 weeks prior to assessment Suspected measles within one month prior to the assessment (N=852)
174 190 168
46
18.6 (16.2 – 21.3) 20.3 (17.8 – 23.2) 18.0 (15.5 – 20.7) 5.3 (4.0 – 7.1)
Immunization Coverage (N=934) Children (9-59 months) immunised against measles (N=866) 577 66.6 (63.4 – 69.7) Children who have ever received Polio dose (N= 934) 690 73.9 (77.5 – 90.3) Vitamin A supplementation (N= 934) Children who received Vitamin A supplementation in past 6 months or before
285 30.5 (27.6 – 33.6)
Micronutrients Deficiencies (N=430) Households who reported night blindness (N=430) Member with night blindness (n=6):
24 – 71 months 6 years or more
1 5
0.2 (0.0 – 1.5) 1.2 (0.4 – 2.9)
The coverage of health programmes was far below the recommended 95% level (Sphere, 2004). Measles vaccination coverage for eligible children (9-59 months old) was 66.6% while that for vitamin A supplementation and polio immunization was 30.5% and 73.9% respectively. Basing on admission criteria of weight for height percent of median, 10.7% (n=100) of the children were moderately malnourished (WHM<80% and WHM>=70%) and were qualified for admission to SFP, but only 22 of them were enrolled in a SFP while only 2 out of the 13 (1.4%) severely malnourished children (WHM<70 or oedema) were enrolled in TFC. Therefore, the SFP coverage was 22% while TFC coverage was 15.4%. These are below the recommended coverage level of >50% in rural areas.
21
El Barde District Nutrition Assessment, December 2006 FSAU, IMC, UNICEF and WFP
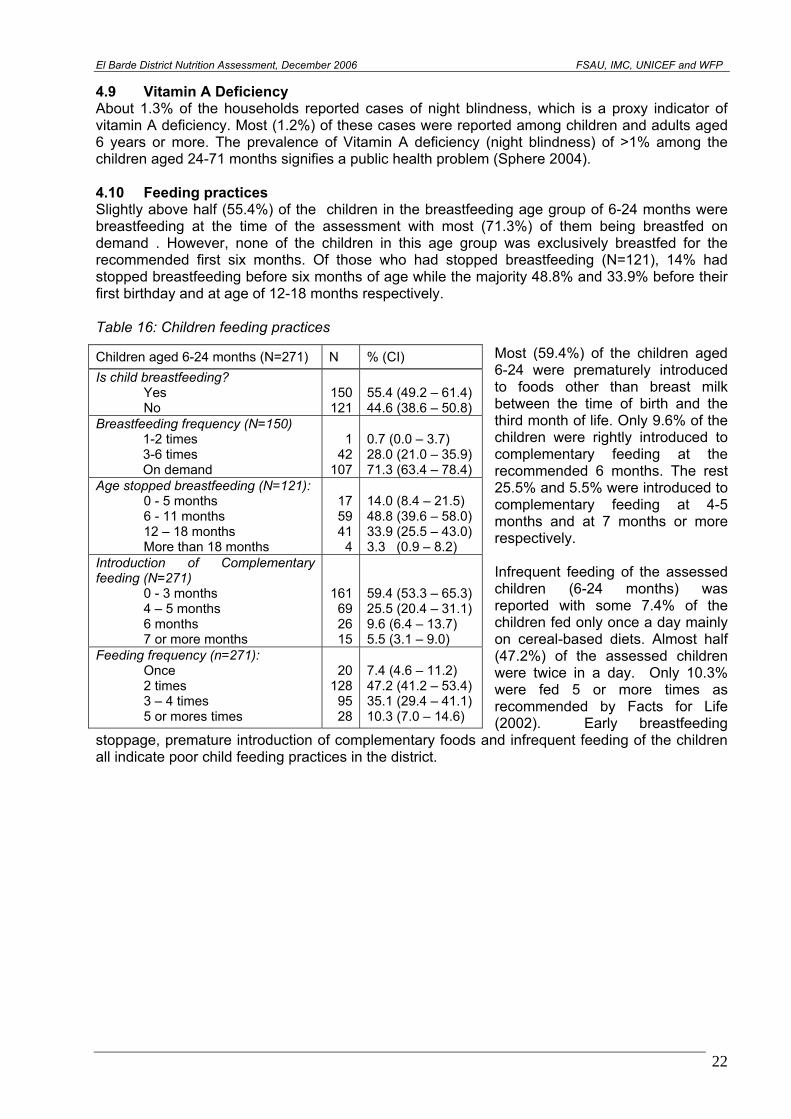
4.9 Vitamin A Deficiency About 1.3% of the households reported cases of night blindness, which is a proxy indicator of vitamin A deficiency. Most (1.2%) of these cases were reported among children and adults aged 6 years or more. The prevalence of Vitamin A deficiency (night blindness) of >1% among the children aged 24-71 months signifies a public health problem (Sphere 2004). 4.10 Feeding practices Slightly above half (55.4%) of the children in the breastfeeding age group of 6-24 months were breastfeeding at the time of the assessment with most (71.3%) of them being breastfed on demand . However, none of the children in this age group was exclusively breastfed for the recommended first six months. Of those who had stopped breastfeeding (N=121), 14% had stopped breastfeeding before six months of age while the majority 48.8% and 33.9% before their first birthday and at age of 12-18 months respectively. Table 16: Children feeding practices
Most (59.4%) of the children aged 6-24 were prematurely introduced to foods other than breast milk between the time of birth and the third month of life. Only 9.6% of the children were rightly introduced to complementary feeding at the recommended 6 months. The rest 25.5% and 5.5% were introduced to complementary feeding at 4-5 months and at 7 months or more respectively. Infrequent feeding of the assessed children (6-24 months) was reported with some 7.4% of the children fed only once a day mainly on cereal-based diets. Almost half (47.2%) of the assessed children were twice in a day. Only 10.3% were fed 5 or more times as recommended by Facts for Life (2002). Early breastfeeding
stoppage, premature introduction of complementary foods and infrequent feeding of the children all indicate poor child feeding practices in the district.
Children aged 6-24 months (N=271) N % (CI) Is child breastfeeding?
Yes No
150121
55.4 (49.2 – 61.4) 44.6 (38.6 – 50.8)
Breastfeeding frequency (N=150) 1-2 times 3-6 times On demand
142
107
0.7 (0.0 – 3.7) 28.0 (21.0 – 35.9) 71.3 (63.4 – 78.4)
Age stopped breastfeeding (N=121): 0 - 5 months 6 - 11 months 12 – 18 months More than 18 months
175941
4
14.0 (8.4 – 21.5) 48.8 (39.6 – 58.0) 33.9 (25.5 – 43.0) 3.3 (0.9 – 8.2)
Introduction of Complementary feeding (N=271)
0 - 3 months 4 – 5 months 6 months 7 or more months
161692615
59.4 (53.3 – 65.3) 25.5 (20.4 – 31.1) 9.6 (6.4 – 13.7) 5.5 (3.1 – 9.0)
Feeding frequency (n=271): Once 2 times 3 – 4 times 5 or mores times
20128
9528
7.4 (4.6 – 11.2) 47.2 (41.2 – 53.4) 35.1 (29.4 – 41.1) 10.3 (7.0 – 14.6)
22
El Barde District Nutrition Assessment, December 2006 FSAU, IMC, UNICEF and WFP
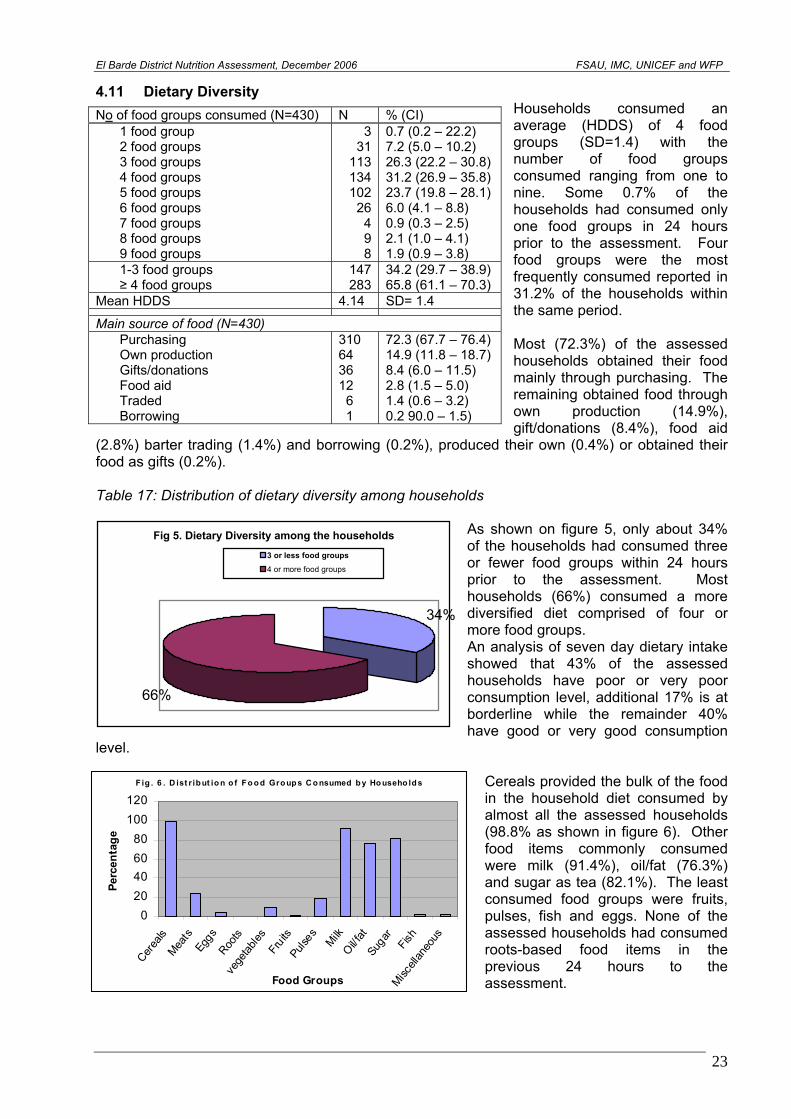
4.11 Dietary Diversity Households consumed an average (HDDS) of 4 food groups (SD=1.4) with the number of food groups consumed ranging from one to nine. Some 0.7% of the households had consumed only one food groups in 24 hours prior to the assessment. Four food groups were the most frequently consumed reported in 31.2% of the households within the same period. Most (72.3%) of the assessed households obtained their food mainly through purchasing. The remaining obtained food through own production (14.9%), gift/donations (8.4%), food aid
(2.8%) barter trading (1.4%) and borrowing (0.2%), produced their own (0.4%) or obtained their food as gifts (0.2%).
No of food groups consumed (N=430) N % (CI) 1 food group 2 food groups 3 food groups 4 food groups 5 food groups 6 food groups 7 food groups 8 food groups 9 food groups
331
113134102
26498
0.7 (0.2 – 22.2) 7.2 (5.0 – 10.2) 26.3 (22.2 – 30.8) 31.2 (26.9 – 35.8) 23.7 (19.8 – 28.1) 6.0 (4.1 – 8.8) 0.9 (0.3 – 2.5) 2.1 (1.0 – 4.1) 1.9 (0.9 – 3.8)
1-3 food groups ≥ 4 food groups
147283
34.2 (29.7 – 38.9) 65.8 (61.1 – 70.3)
Mean HDDS 4.14 SD= 1.4
Main source of food (N=430) Purchasing Own production Gifts/donations Food aid Traded Borrowing
310 64 36 12 6 1
72.3 (67.7 – 76.4) 14.9 (11.8 – 18.7) 8.4 (6.0 – 11.5) 2.8 (1.5 – 5.0) 1.4 (0.6 – 3.2) 0.2 90.0 – 1.5)
Table 17: Distribution of dietary diversity among households
As shown on figure 5, only about 34% of the households had consumed three or fewer food groups within 24 hours prior to the assessment. Most households (66%) consumed a more diversified diet comprised of four or more food groups. An analysis of seven day dietary intake showed that 43% of the assessed households have poor or very poor consumption level, additional 17% is at borderline while the remainder 40% have good or very good consumption
level.
Fig 5. Dietary Diversity among the households
34%
66%
3 or less food groups
4 or more food groups
Cereals provided the bulk of the food in the household diet consumed by almost all the assessed households (98.8% as shown in figure 6). Other food items commonly consumed were milk (91.4%), oil/fat (76.3%) and sugar as tea (82.1%). The least consumed food groups were fruits, pulses, fish and eggs. None of the assessed households had consumed roots-based food items in the previous 24 hours to the assessment.
F ig . 6 . D ist r ibut io n o f Fo o d Group s C o nsumed b y Ho useho ld s
020406080
100120
Cerea
lsMea
tsEg
gsRoo
tsve
getab
lesFr
uits
Pulse
sMilk
Oil/ fat
Suga
rFis
hMisc
ellan
eous
Food Groups
Perc
enta
ge
23
El Barde District Nutrition Assessment, December 2006 FSAU, IMC, UNICEF and WFP
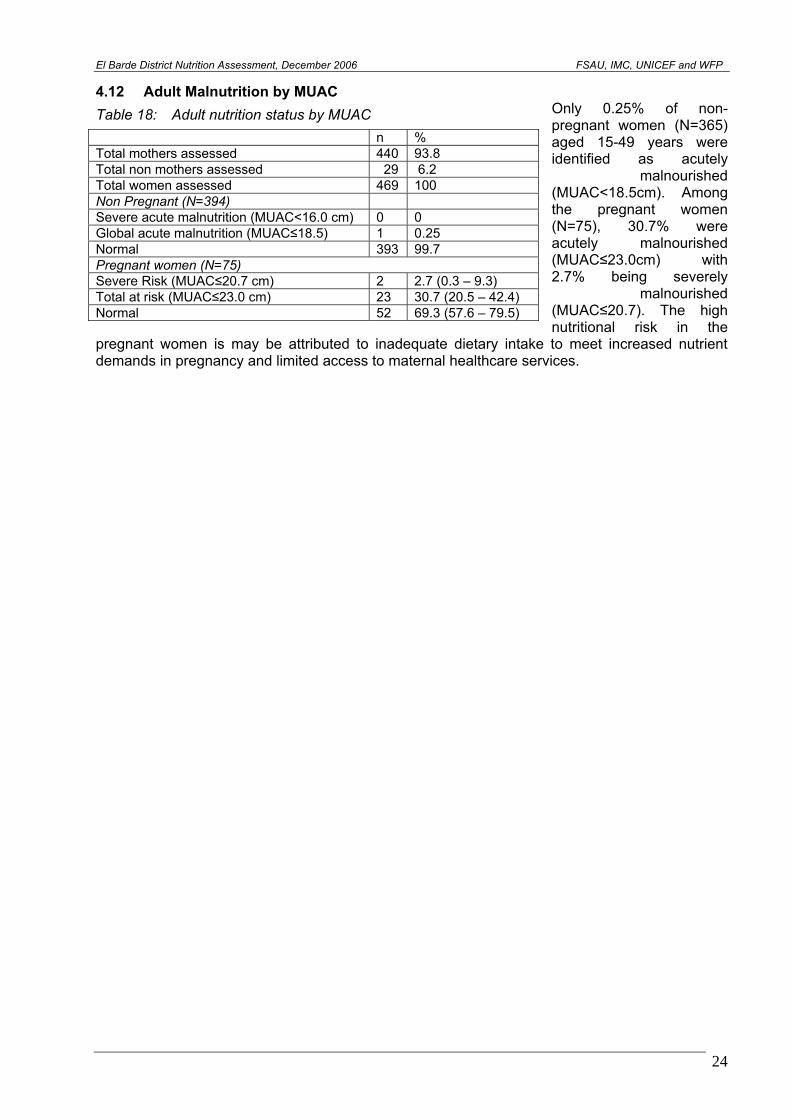
4.12 Adult Malnutrition by MUAC Only 0.25% of non-pregnant women (N=365) aged 15-49 years were identified as acutely
malnourished (MUAC<18.5cm). Among the pregnant women (N=75), 30.7% were acutely malnourished (MUAC≤23.0cm) with 2.7% being severely
malnourished (MUAC≤20.7). The high nutritional risk in the
pregnant women is may be attributed to inadequate dietary intake to meet increased nutrient demands in pregnancy and limited access to maternal healthcare services.
Table 18: Adult nutrition status by MUAC
n % Total mothers assessed 440 93.8 Total non mothers assessed 29 6.2 Total women assessed 469 100 Non Pregnant (N=394) Severe acute malnutrition (MUAC<16.0 cm) 0 0 Global acute malnutrition (MUAC≤18.5) 1 0.25 Normal 393 99.7 Pregnant women (N=75) Severe Risk (MUAC≤20.7 cm) 2 2.7 (0.3 – 9.3) Total at risk (MUAC≤23.0 cm) 23 30.7 (20.5 – 42.4) Normal 52 69.3 (57.6 – 79.5)
24
El Barde District Nutrition Assessment, December 2006 FSAU, IMC, UNICEF and WFP
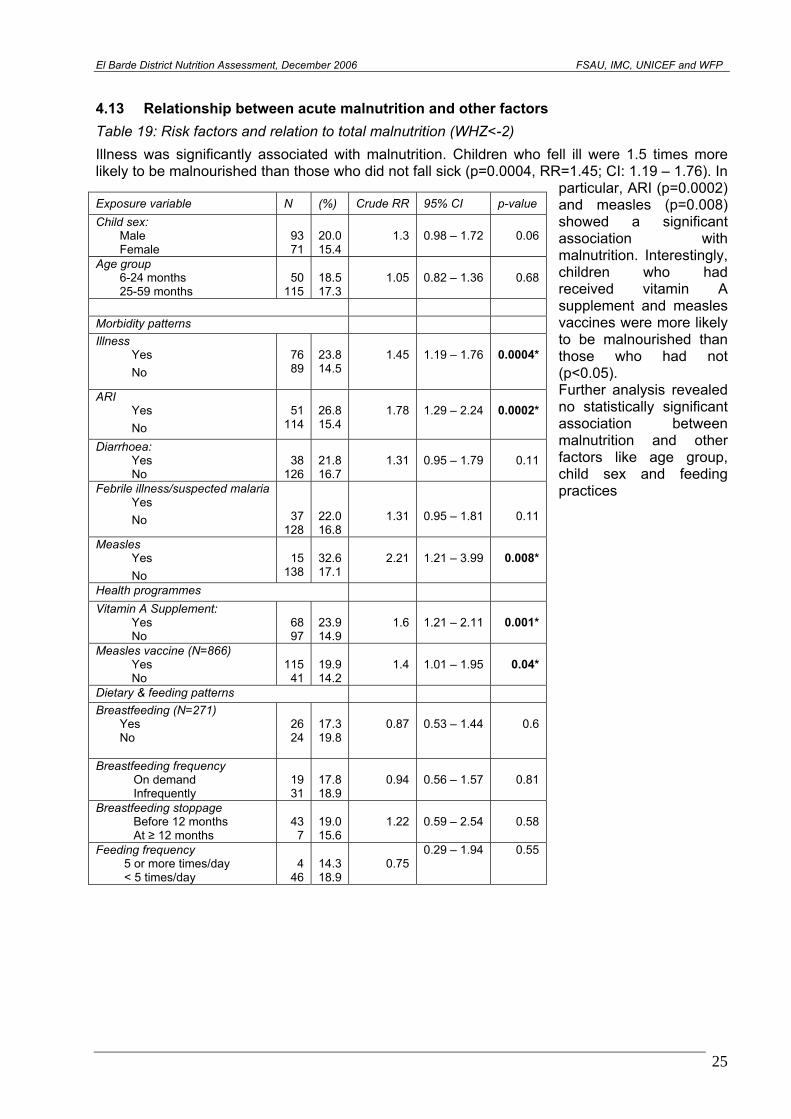
4.13 Relationship between acute malnutrition and other factors
Table 19: Risk factors and relation to total malnutrition (WHZ<-2)
Illness was significantly associated with malnutrition. Children who fell ill were 1.5 times more likely to be malnourished than those who did not fall sick (p=0.0004, RR=1.45; CI: 1.19 – 1.76). In
particular, ARI (p=0.0002) and measles (p=0.008) showed a significant association with malnutrition. Interestingly, children who had received vitamin A supplement and measles vaccines were more likely to be malnourished than those who had not (p<0.05). Further analysis revealed no statistically significant association between malnutrition and other factors like age group, child sex and feeding practices
Exposure variable N (%) Crude RR 95% CI p-value Child sex:
Male Female
93 71
20.0 15.4
1.3
0.98 – 1.72
0.06
Age group 6-24 months 25-59 months
50
115
18.5 17.3
1.05
0.82 – 1.36
0.68
Morbidity patterns Illness
Yes No
76 89
23.8 14.5
1.45
1.19 – 1.76
0.0004*
ARI Yes No
51
114
26.8 15.4
1.78
1.29 – 2.24
0.0002*
Diarrhoea: Yes No
38
126
21.8 16.7
1.31
0.95 – 1.79
0.11
Febrile illness/suspected malaria Yes No
37 128
22.0 16.8
1.31
0.95 – 1.81
0.11
Measles Yes No
15
138
32.6 17.1
2.21
1.21 – 3.99
0.008*
Health programmes Vitamin A Supplement:
Yes No
68 97
23.9 14.9
1.6
1.21 – 2.11
0.001*
Measles vaccine (N=866) Yes No
115 41
19.9 14.2
1.4
1.01 – 1.95
0.04*
Dietary & feeding patterns Breastfeeding (N=271)
Yes No
26 24
17.3 19.8
0.87
0.53 – 1.44
0.6
Breastfeeding frequency On demand Infrequently
19 31
17.8 18.9
0.94
0.56 – 1.57
0.81
Breastfeeding stoppage Before 12 months At ≥ 12 months
43 7
19.0 15.6
1.22
0.59 – 2.54
0.58
Feeding frequency 5 or more times/day < 5 times/day
4
46
14.3 18.9
0.75
0.29 – 1.94 0.55
25
El Barde District Nutrition Assessment, December 2006 FSAU, IMC, UNICEF and WFP
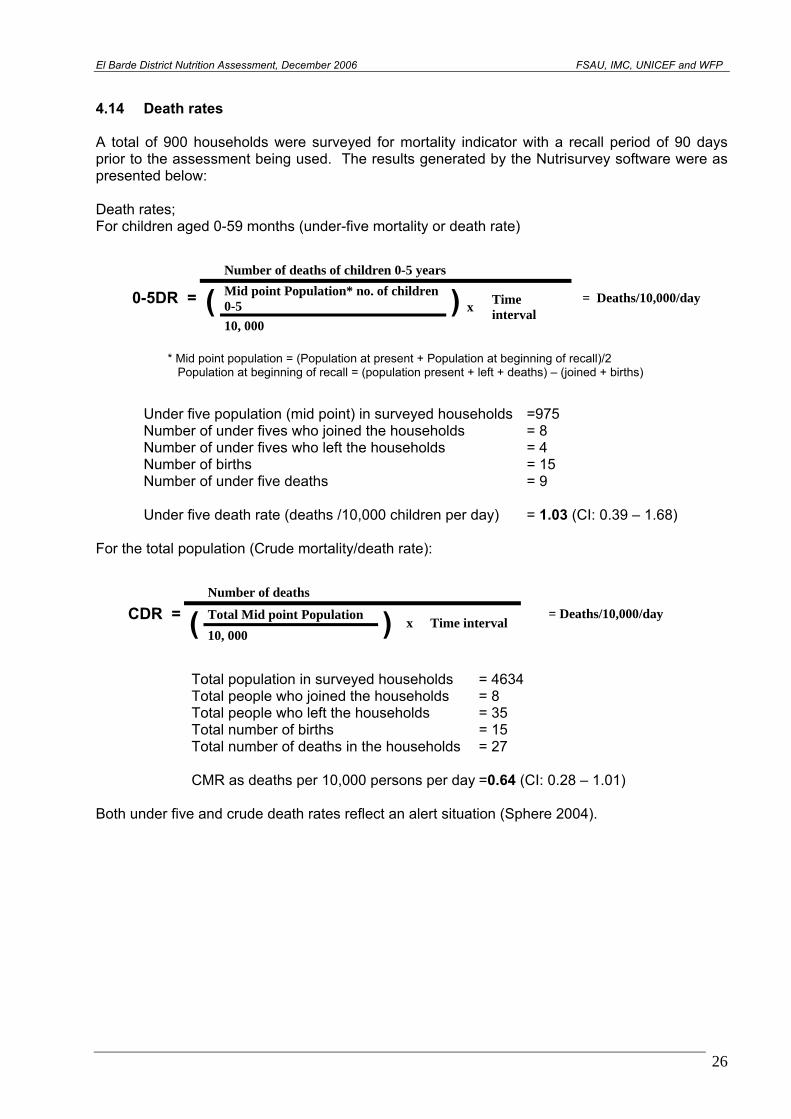
4.14 Death rates A total of 900 households were surveyed for mortality indicator with a recall period of 90 days prior to the assessment being used. The results generated by the Nutrisurvey software were as presented below: Death rates; For children aged 0-59 months (under-five mortality or death rate)
Number of deaths of children 0-5 years Mid point Population* no. of children 0-5 0-5DR = ( 10, 000
) x Time interval
= Deaths/10,000/day
* Mid point population = (Population at present + Population at beginning of recall)/2 Population at beginning of recall = (population present + left + deaths) – (joined + births)
Under five population (mid point) in surveyed households =975 Number of under fives who joined the households = 8 Number of under fives who left the households = 4 Number of births = 15 Number of under five deaths = 9 Under five death rate (deaths /10,000 children per day) = 1.03 (CI: 0.39 – 1.68) For the total population (Crude mortality/death rate):
Number of deaths
Total Mid point Population CDR = ( 10, 000 ) x Time interval = Deaths/10,000/day
Total population in surveyed households = 4634 Total people who joined the households = 8 Total people who left the households = 35 Total number of births = 15 Total number of deaths in the households = 27 CMR as deaths per 10,000 persons per day =0.64 (CI: 0.28 – 1.01) Both under five and crude death rates reflect an alert situation (Sphere 2004).
26
El Barde District Nutrition Assessment, December 2006 FSAU, IMC, UNICEF and WFP
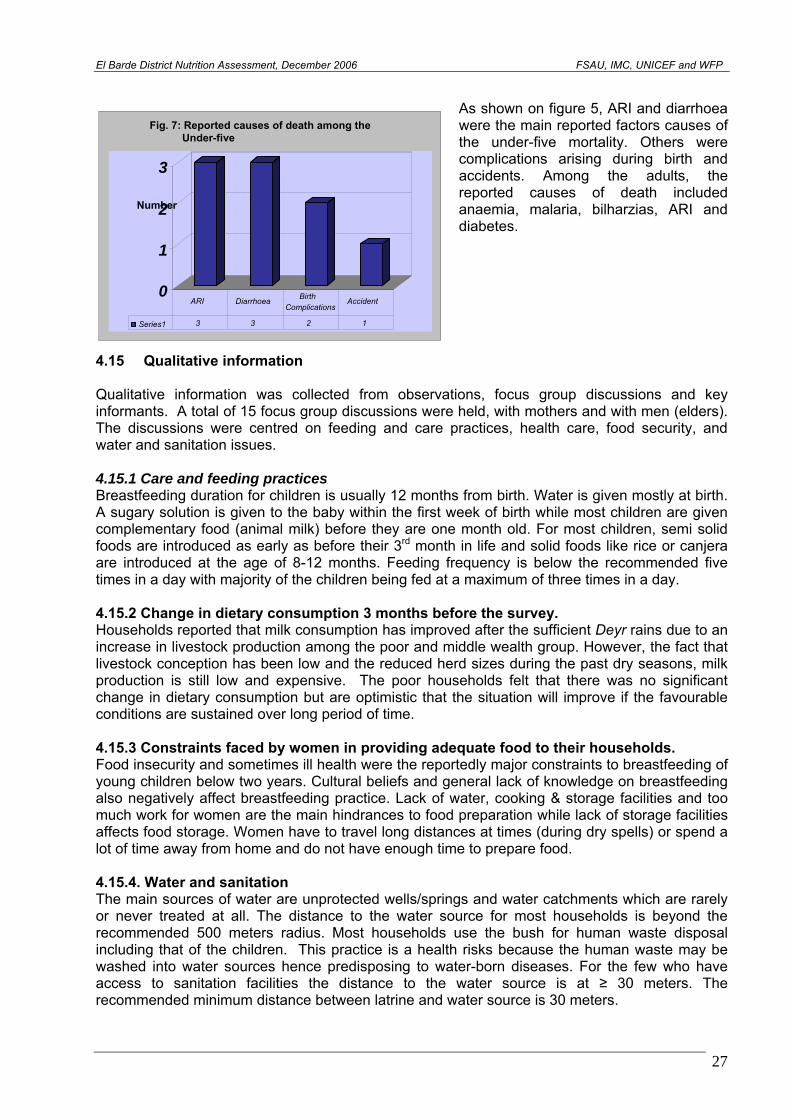
As shown on figure 5, ARI and diarrhoea were the main reported factors causes of the under-five mortality. Others were complications arising during birth and accidents. Among the adults, the reported causes of death included anaemia, malaria, bilharzias, ARI and diabetes.
Fig. 7: Reported causes of death among the Under-five
3
2 Number
1
0 ARI Birth Diarrhoea
Complications
3 3 2 1Series1
Accident
4.15 Qualitative information Qualitative information was collected from observations, focus group discussions and key informants. A total of 15 focus group discussions were held, with mothers and with men (elders). The discussions were centred on feeding and care practices, health care, food security, and water and sanitation issues. 4.15.1 Care and feeding practices Breastfeeding duration for children is usually 12 months from birth. Water is given mostly at birth. A sugary solution is given to the baby within the first week of birth while most children are given complementary food (animal milk) before they are one month old. For most children, semi solid foods are introduced as early as before their 3rd month in life and solid foods like rice or canjera are introduced at the age of 8-12 months. Feeding frequency is below the recommended five times in a day with majority of the children being fed at a maximum of three times in a day. 4.15.2 Change in dietary consumption 3 months before the survey. Households reported that milk consumption has improved after the sufficient Deyr rains due to an increase in livestock production among the poor and middle wealth group. However, the fact that livestock conception has been low and the reduced herd sizes during the past dry seasons, milk production is still low and expensive. The poor households felt that there was no significant change in dietary consumption but are optimistic that the situation will improve if the favourable conditions are sustained over long period of time. 4.15.3 Constraints faced by women in providing adequate food to their households. Food insecurity and sometimes ill health were the reportedly major constraints to breastfeeding of young children below two years. Cultural beliefs and general lack of knowledge on breastfeeding also negatively affect breastfeeding practice. Lack of water, cooking & storage facilities and too much work for women are the main hindrances to food preparation while lack of storage facilities affects food storage. Women have to travel long distances at times (during dry spells) or spend a lot of time away from home and do not have enough time to prepare food. 4.15.4. Water and sanitation The main sources of water are unprotected wells/springs and water catchments which are rarely or never treated at all. The distance to the water source for most households is beyond the recommended 500 meters radius. Most households use the bush for human waste disposal including that of the children. This practice is a health risks because the human waste may be washed into water sources hence predisposing to water-born diseases. For the few who have access to sanitation facilities the distance to the water source is at ≥ 30 meters. The recommended minimum distance between latrine and water source is 30 meters.
27
El Barde District Nutrition Assessment, December 2006 FSAU, IMC, UNICEF and WFP
4.15.5. Main income sources. Most households in the district are relying on sale of livestock, other products such milk or ghee. Other households depend on sale of crops, casual labour, petty trades and sale collection and sale of resins/gum for income 4.15.6. Common illnesses Among the adults in the region the most common reported illnesses include suspected malaria, Bilhazia, anaemia and diarrhoea. For children the most common illnesses are diarrhoea, Acute Respiratory Infection (ARI) malaria and skin infections. Few measles cases are often reported in the district. The presence of stagnant water, especially during the rainy seasons forms ideal breeding site for mosquitoes and therefore contribute to the seasonal increase in malaria prevalence. Moreover poor sanitation leads to increased morbidity particularly diarrhoea. 4.15.7 Food security situation Impact of Deyr 06 rains on livestock and crop fields Overall Deyr 06/07 rain was above average resulting into increased water availability, pasture regeneration and return of the livestock that had migrated to Ethiopia. However, the pastoral area on the south east of the district received poor rainfall, thus poor water availability and pasture condition. Although the impact of rains on the crop was positive and good harvest is anticipated, the crop fields in the district are very small. In general livestock body condition significantly improved and water sources are adequately replenished. The only exception is in some areas including Salkudhooble and Figta where water in the catchments may not be sustained until the next Gu season. Notable still is the impact of the drought as reflected by very low or no livestock births especially for camel and cattle and limited milk production. In addition, there are reports of high camel mortalities (due to an unknown disease) during the months of Ramadan and Idd-Alfitr. Rate of death is however reported to have significantly declined in the month of December. On the positive side, the rate of livestock conception for all livestock is very good. Market access and commodity prices Access to market was reported to have improved following the resolution of the conflict among the warring clans. The people and livestock who had migrated to other areas in search of pasture and water and freeing from insecurity are returning into the district. Cereal price in the month of December dropped by about 30% (from 3,000 to 2,000 SSH). This is possibly attributed to food relief distribution in most villages in the district during that time. Livestock prices over the last few months have increased due improved livestock conditions and high demand. This has enhanced pastoralist’s access to food and income. Income from milk, which is an important part of the annual income basket is however low due to low milk production, thus milk prices are very high about 8,000 SSH which is about 100% higher than prices at this time of the year. Food security and Coping strategies Poor and parts of the middle wealth groups were worst affected by the successive droughts in resulting to asset losses, limited production of milk, limited labour and self-employment opportunities and reduced social support. Among the current coping strategies used by these groups include increased reliance on food aid, collection and sale of resins/gum and increased sales of their few remaining livestock.
28
El Barde District Nutrition Assessment, December 2006 FSAU, IMC, UNICEF and WFP
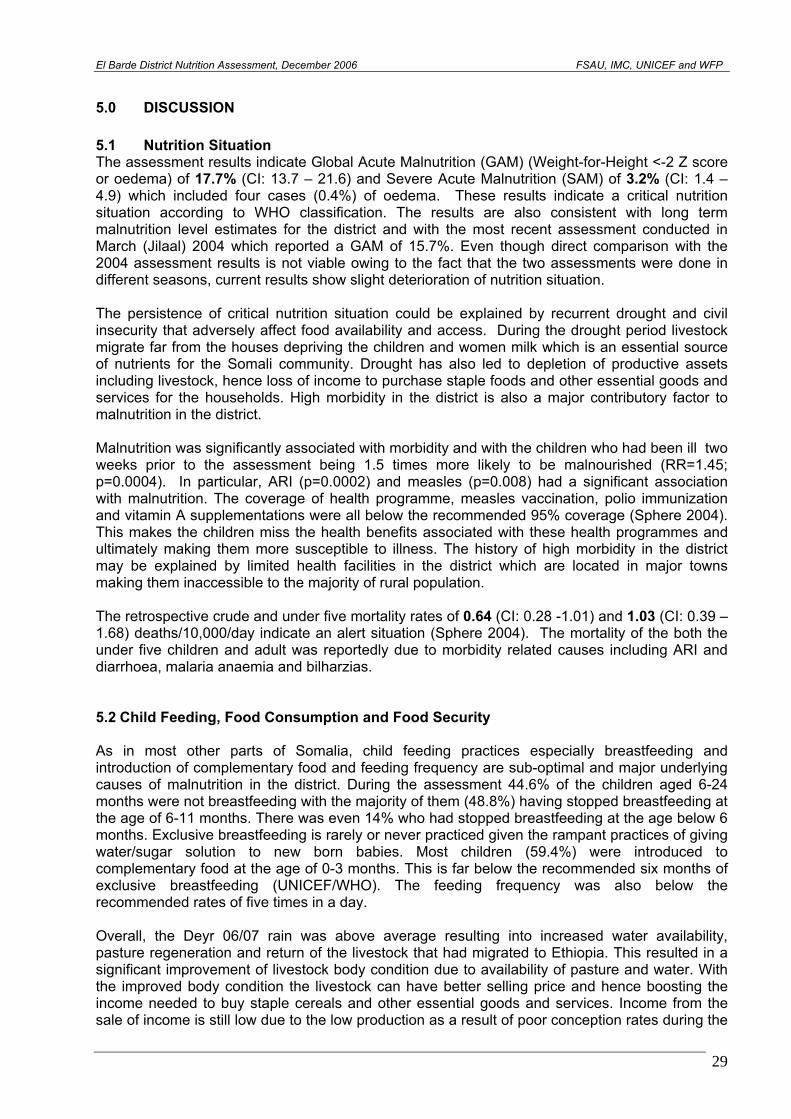
5.0 DISCUSSION 5.1 Nutrition Situation The assessment results indicate Global Acute Malnutrition (GAM) (Weight-for-Height <-2 Z score or oedema) of 17.7% (CI: 13.7 – 21.6) and Severe Acute Malnutrition (SAM) of 3.2% (CI: 1.4 – 4.9) which included four cases (0.4%) of oedema. These results indicate a critical nutrition situation according to WHO classification. The results are also consistent with long term malnutrition level estimates for the district and with the most recent assessment conducted in March (Jilaal) 2004 which reported a GAM of 15.7%. Even though direct comparison with the 2004 assessment results is not viable owing to the fact that the two assessments were done in different seasons, current results show slight deterioration of nutrition situation. The persistence of critical nutrition situation could be explained by recurrent drought and civil insecurity that adversely affect food availability and access. During the drought period livestock migrate far from the houses depriving the children and women milk which is an essential source of nutrients for the Somali community. Drought has also led to depletion of productive assets including livestock, hence loss of income to purchase staple foods and other essential goods and services for the households. High morbidity in the district is also a major contributory factor to malnutrition in the district. Malnutrition was significantly associated with morbidity and with the children who had been ill two weeks prior to the assessment being 1.5 times more likely to be malnourished (RR=1.45; p=0.0004). In particular, ARI (p=0.0002) and measles (p=0.008) had a significant association with malnutrition. The coverage of health programme, measles vaccination, polio immunization and vitamin A supplementations were all below the recommended 95% coverage (Sphere 2004). This makes the children miss the health benefits associated with these health programmes and ultimately making them more susceptible to illness. The history of high morbidity in the district may be explained by limited health facilities in the district which are located in major towns making them inaccessible to the majority of rural population. The retrospective crude and under five mortality rates of 0.64 (CI: 0.28 -1.01) and 1.03 (CI: 0.39 – 1.68) deaths/10,000/day indicate an alert situation (Sphere 2004). The mortality of the both the under five children and adult was reportedly due to morbidity related causes including ARI and diarrhoea, malaria anaemia and bilharzias. 5.2 Child Feeding, Food Consumption and Food Security As in most other parts of Somalia, child feeding practices especially breastfeeding and introduction of complementary food and feeding frequency are sub-optimal and major underlying causes of malnutrition in the district. During the assessment 44.6% of the children aged 6-24 months were not breastfeeding with the majority of them (48.8%) having stopped breastfeeding at the age of 6-11 months. There was even 14% who had stopped breastfeeding at the age below 6 months. Exclusive breastfeeding is rarely or never practiced given the rampant practices of giving water/sugar solution to new born babies. Most children (59.4%) were introduced to complementary food at the age of 0-3 months. This is far below the recommended six months of exclusive breastfeeding (UNICEF/WHO). The feeding frequency was also below the recommended rates of five times in a day. Overall, the Deyr 06/07 rain was above average resulting into increased water availability, pasture regeneration and return of the livestock that had migrated to Ethiopia. This resulted in a significant improvement of livestock body condition due to availability of pasture and water. With the improved body condition the livestock can have better selling price and hence boosting the income needed to buy staple cereals and other essential goods and services. Income from the sale of income is still low due to the low production as a result of poor conception rates during the
29
El Barde District Nutrition Assessment, December 2006 FSAU, IMC, UNICEF and WFP
past dry seasons. With the low supply of milk, the price is high making it inaccessible to poor households. However, milk production is expected to improve due to good conception rate that occurred during the Deyr ’06/07season. The dietary diversity is fairy good with about 66% of the assessed households having consumed meals comprised of four or more food groups in the last 24 hours prior to the assessment. 5.3. Water, Sanitation and Health issues Overall, water availability and access for both human and livestock has greatly improved following the sufficient Deyr rains. Most of the population draw water from unprotected water catchments or wells. Most of these catchments that had dried up during the drought are now replenished with water. This has reduced the time spent in search of water as well as the income used to purchase water during dry seasons. However the quality of water, especially for human consumption, is poor because water from these sources are not protected from contamination and are rarely or never treated. Moreover households had insufficient water holding containers implying that they would require frequent trips to water sources. Where water sources are located far, taking frequent trips to fetch water may consume substantial amount of time for the household members. About 61% of the households have only 1-2 containers of 10-20 litres capacity for fetching or storing water. Sphere (2004) guidelines recommend a minimum of 2 clean containers of 10-20 litres for water collection alone, in addition to enough storage containers to ensure sufficient water in the household for use by each household member. With limited water collection and storage facilities household hygiene may be comprised. The general sanitation of the population’s residential areas is poor. Access to sanitation facilities is extremely low with majority (81.2%) using bush for both adult and child waste disposal. Open disposal of human waste is a health risk when washed by rain waters into predominant unprotected water sources. The use of washing agent is also low with about 22% of assessed households reportedly not using any washing agent. This, together with poor drinking water quality is likely to have contributed to incidences of diarrhoea.
30
El Barde District Nutrition Assessment, December 2006 FSAU, IMC, UNICEF and WFP
6.0 RECOMMENDATIONS Following discussions held after sharing the results with partners and detailed data analysis, both short- and long-term recommendations were made: Short term recommendations
1. Enhance delivery of basic health services including intensifying EPI services. 2. Rehabilitation and treatment of severely and moderately malnourished children through
existing feeding centres, strengthened outreach mechanisms to reach malnourished children and refer them for rehabilitation and use of community based care.
3. Intensify nutrition and health education targeting children care givers with messages on breastfeeding, child-feeding, health-seeking behaviour and hygiene and sanitation.
Long-term Recommendations
1. To enhance access to health services, there is need for support by agencies to re-establish and re-open health posts and centres that already exist but are not operational as well as establishing others in areas where there are no health facilities.
2. Enhance nutrition and health education programmes with a specific focus on good sanitation; hygiene, child feeding practices and health seeking practices.
3. Re-stocking programme to support the poor households that lost livestock during the drought.
4. Measures for brokering lasting peace in the district are needed to avoid recurring disruption of livelihood and enhance humanitarian response.
5. Rehabilitation of existing boreholes and wells, construction of new ones and establishment of mechanism for routine water treatment/chlorination to enhance water quality.
6. Regular and massive environmental cleaning to enhance hygiene and sanitation 7. Provision of sanitary facilities including building of latrine for appropriate disposal of
human excretal waste.
31
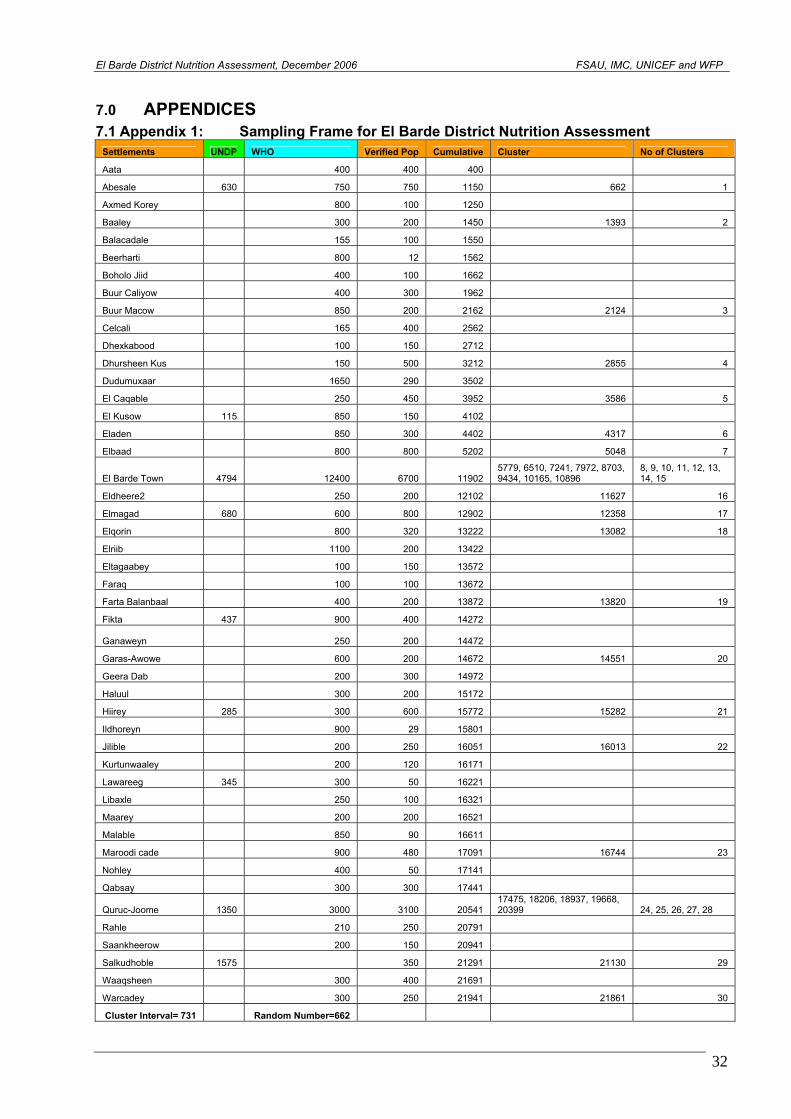
El Barde District Nutrition Assessm
ent, December 2006 FSAU, IMC, UNICEF and WFP
32
7.0 APPENDICES 7.1 Appendix 1: Sampling Frame for El Barde District Nutrition Assessment
Settlements UNDP WHO Verified Pop Cumulative Cluster No of Clusters
Aata 400 400 400
Abesale 630 750 750 1150 662 1
Axmed Korey 800 100 1250
Baaley 300 200 1450 1393 2
Balacadale 155 100 1550
Beerharti 800 12 1562
Boholo Jiid 400 100 1662
Buur Caliyow 400 300 1962
Buur Macow 850 200 2162 2124 3
Celcali 165 400 2562
Dhexkabood 100 150 2712
Dhursheen Kus 150 500 3212 2855 4
Dudumuxaar 1650 290 3502
El Caqable 250 450 3952 3586 5
El Kusow 115 850 150 4102
Eladen 850 300 4402 4317 6
Elbaad 800 800 5202 5048 7
El Barde Town 4794 12400 6700 11902 5779, 6510, 7241, 7972, 8703, 9434, 10165, 10896
8, 9, 10, 11, 12, 13, 14, 15
Eldheere2 250 200 12102 11627 16
Elmagad 680 600 800 12902 12358 17
Elqorin 800 320 13222 13082 18
Elriib 1100 200 13422
Eltagaabey 100 150 13572
Faraq 100 100 13672
Farta Balanbaal 400 200 13872 13820 19
Fikta 437 900 400 14272
Ganaweyn 250 200 14472
Garas-Awowe 600 200 14672 14551 20
Geera Dab 200 300 14972
Haluul 300 200 15172
Hiirey 285 300 600 15772 15282 21
Ildhoreyn 900 29 15801
Jilible 200 250 16051 16013 22
Kurtunwaaley 200 120 16171
Lawareeg 345 300 50 16221
Libaxle 250 100 16321
Maarey 200 200 16521
Malable 850 90 16611
Maroodi cade 900 480 17091 16744 23
Nohley 400 50 17141
Qabsay 300 300 17441
Quruc-Joome 1350 3000 3100 20541 17475, 18206, 18937, 19668, 20399 24, 25, 26, 27, 28
Rahle 210 250 20791
Saankheerow 200 150 20941
Salkudhoble 1575 350 21291 21130 29
Waaqsheen 300 400 21691
Warcadey 300 250 21941 21861 30
Cluster Interval= 731 Random Number=662
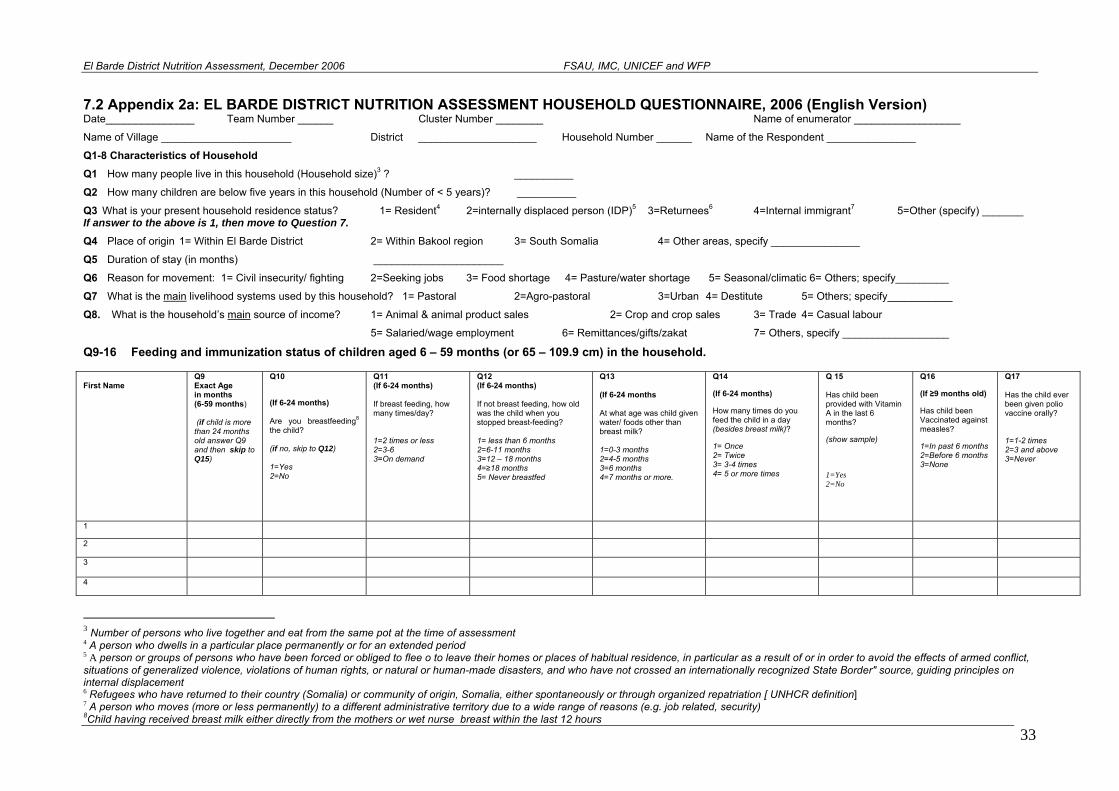
El Barde District Nutrition Assessment, December 2006 FSAU, IMC, UNICEF and WFP
33
7.2 Appendix 2a: EL BARDE DISTRICT NUTRITION ASSESSMENT HOUSEHOLD QUESTIONNAIRE, 2006 (English Version) Date_______________ Team Number ______ Cluster Number ________ Name of enumerator __________________
Name of Village ______________________ District ____________________ Household Number ______ Name of the Respondent _______________
Q1-8 Characteristics of Household Q1 How many people live in this household (Household size)3 ? __________
Q2 How many children are below five years in this household (Number of < 5 years)? __________
Q3 What is your present household residence status? 1= Resident4 2=internally displaced person (IDP)5 3=Returnees6 4=Internal immigrant7 5=Other (specify) _______ If answer to the above is 1, then move to Question 7.
Q4 Place of origin 1= Within El Barde District 2= Within Bakool region 3= South Somalia 4= Other areas, specify _______________
Q5 Duration of stay (in months) ______________________
Q6 Reason for movement: 1= Civil insecurity/ fighting 2=Seeking jobs 3= Food shortage 4= Pasture/water shortage 5= Seasonal/climatic 6= Others; specify_________
Q7 What is the main livelihood systems used by this household? 1= Pastoral 2=Agro-pastoral 3=Urban 4= Destitute 5= Others; specify___________ Q8. What is the household’s main source of income? 1= Animal & animal product sales 2= Crop and crop sales 3= Trade 4= Casual labour
5= Salaried/wage employment 6= Remittances/gifts/zakat 7= Others, specify __________________
Q9-16 Feeding and immunization status of children aged 6 – 59 months (or 65 – 109.9 cm) in the household. First Name
Q9 Exact Age in months (6-59 months) (if child is more than 24 months old answer Q9 and then skip to Q15)
Q10
(If 6-24 months) Are you breastfeeding8 the child? (if no, skip to Q12) 1=Yes 2=No
Q11 (If 6-24 months) If breast feeding, how many times/day? 1=2 times or less 2=3-6 3=On demand
Q12 (If 6-24 months) If not breast feeding, how old was the child when you stopped breast-feeding? 1= less than 6 months 2=6-11 months 3=12 – 18 months 4=≥18 months 5= Never breastfed
Q13 (If 6-24 months At what age was child given water/ foods other than breast milk? 1=0-3 months 2=4-5 months 3=6 months 4=7 months or more.
Q14
(If 6-24 months)
How many times do you feed the child in a day (besides breast milk)?
1= Once 2= Twice 3= 3-4 times 4= 5 or more times
Q 15 Has child been provided with Vitamin A in the last 6 months?
(show sample)
1=Yes 2=No
Q16
(If ≥9 months old)
Has child been Vaccinated against measles?
1=In past 6 months 2=Before 6 months 3=None
Q17 Has the child ever been given polio vaccine orally? 1=1-2 times 2=3 and above 3=Never
1
2
3
4
3 Number of persons who live together and eat from the same pot at the time of assessment 4 A person who dwells in a particular place permanently or for an extended period 5 A person or groups of persons who have been forced or obliged to flee o to leave their homes or places of habitual residence, in particular as a result of or in order to avoid the effects of armed conflict, situations of generalized violence, violations of human rights, or natural or human-made disasters, and who have not crossed an internationally recognized State Border" source, guiding principles on internal displacement 6 Refugees who have returned to their country (Somalia) or community of origin, Somalia, either spontaneously or through organized repatriation [ UNHCR definition] 7 A person who moves (more or less permanently) to a different administrative territory due to a wide range of reasons (e.g. job related, security) 8Child having received breast milk either directly from the mothers or wet nurse breast within the last 12 hours
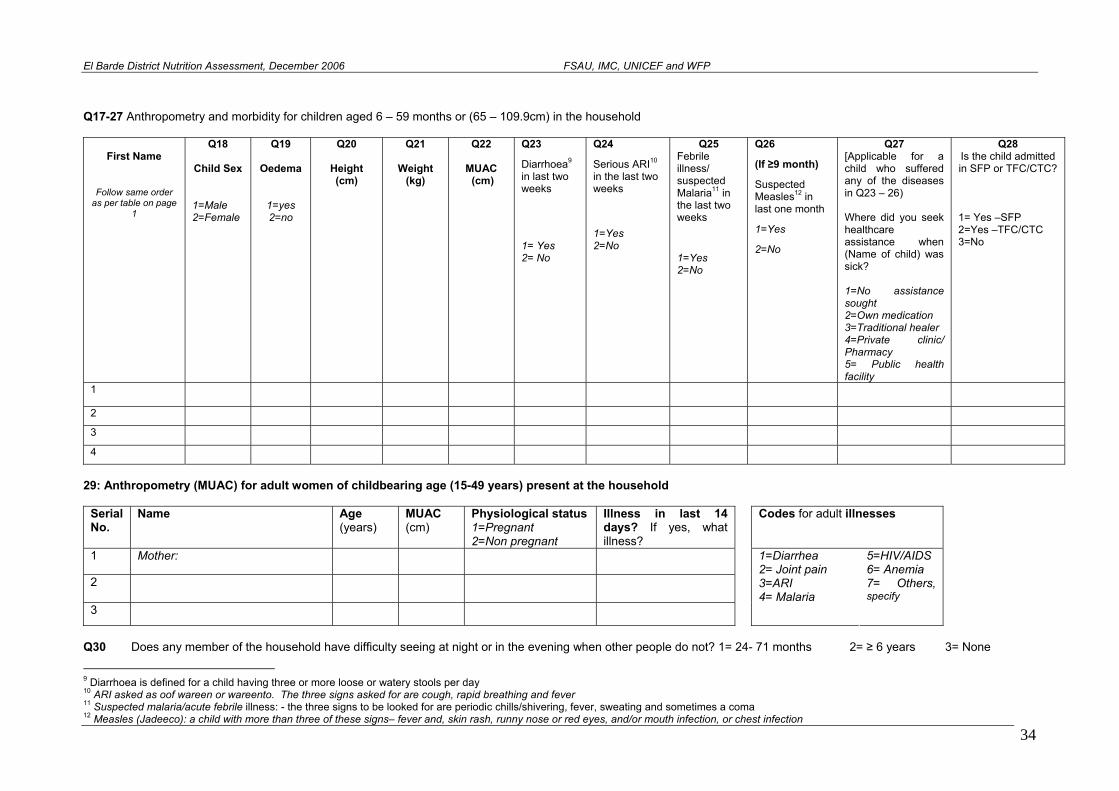
El Barde District Nutrition Assessment, December 2006 FSAU, IMC, UNICEF and WFP
Q17-27 Anthropometry and morbidity for children aged 6 – 59 months or (65 – 109.9cm) in the household
First Name
Follow same order as per table on page
1
Q18
Child Sex
1=Male 2=Female
Q19
Oedema
1=yes 2=no
Q20
Height (cm)
Q21
Weight (kg)
Q22
MUAC (cm)
Q23
Diarrhoea9 in last two weeks
1= Yes 2= No
Q24
Serious ARI10 in the last two weeks
1=Yes 2=No
Q25 Febrile illness/ suspected Malaria11 in the last two weeks
1=Yes 2=No
Q26
(If ≥9 month)
Suspected Measles12 in last one month
1=Yes
2=No
Q27 [Applicable for a child who suffered any of the diseases in Q23 – 26) Where did you seek healthcare assistance when (Name of child) was sick? 1=No assistance sought 2=Own medication 3=Traditional healer 4=Private clinic/ Pharmacy 5= Public health facility
Q28 Is the child admitted in SFP or TFC/CTC?
1= Yes –SFP 2=Yes –TFC/CTC 3=No
1 2 3 4
29: Anthropometry (MUAC) for adult women of childbearing age (15-49 years) present at the household
Serial No.
Name Age MUAC (years) (cm)
Physiological status 1=Pregnant 2=Non pregnant
Illness in last 14 days? If yes, what illness?
Codes for adult illnesses
1 Mother:
2
3 4= Malaria
1=Diarrhea 2= Joint pain 3=ARI
5=HIV/AIDS 6= Anemia 7= Others, specify
Q30 Does any member of the household have difficulty seeing at night or in the evening when other people do not? 1= 24- 71 months 2= ≥ 6 years 3= None
9 Diarrhoea is defined for a child having three or more loose or watery stools per day 10 ARI asked as oof wareen or wareento. The three signs asked for are cough, rapid breathing and fever 11 Suspected malaria/acute febrile illness: - the three signs to be looked for are periodic chills/shivering, fever, sweating and sometimes a coma
34 12 Measles (Jadeeco): a child with more than three of these signs– fever and, skin rash, runny nose or red eyes, and/or mouth infection, or chest infection
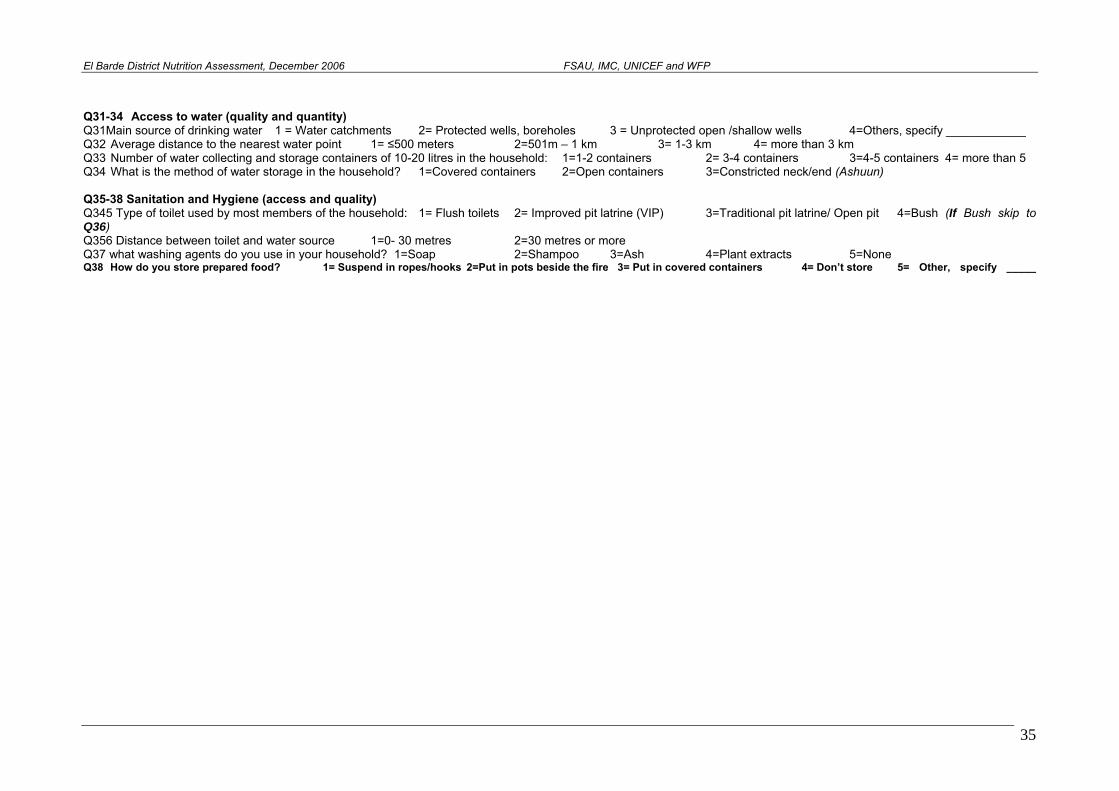
El Barde District Nutrition Assessment, December 2006 FSAU, IMC, UNICEF and WFP
Q31-34 Access to water (quality and quantity) Q31Main source of drinking water 1 = Water catchments 2= Protected wells, boreholes 3 = Unprotected open /shallow wells 4=Others, specify ____________ Q32 Average distance to the nearest water point 1= ≤500 meters 2=501m – 1 km 3= 1-3 km 4= more than 3 km Q33 Number of water collecting and storage containers of 10-20 litres in the household: 1=1-2 containers 2= 3-4 containers 3=4-5 containers 4= more than 5 Q34 What is the method of water storage in the household? 1=Covered containers 2=Open containers 3=Constricted neck/end (Ashuun) Q35-38 Sanitation and Hygiene (access and quality) Q345 Type of toilet used by most members of the household: 1= Flush toilets 2= Improved pit latrine (VIP) 3=Traditional pit latrine/ Open pit 4=Bush (If Bush skip to Q36) Q356 Distance between toilet and water source 1=0- 30 metres 2=30 metres or more Q37 what washing agents do you use in your household? 1=Soap 2=Shampoo 3=Ash 4=Plant extracts 5=None Q38 How do you store prepared food? 1= Suspend in ropes/hooks 2=Put in pots beside the fire 3= Put in covered containers 4= Don’t store 5= Other, specify _____
35
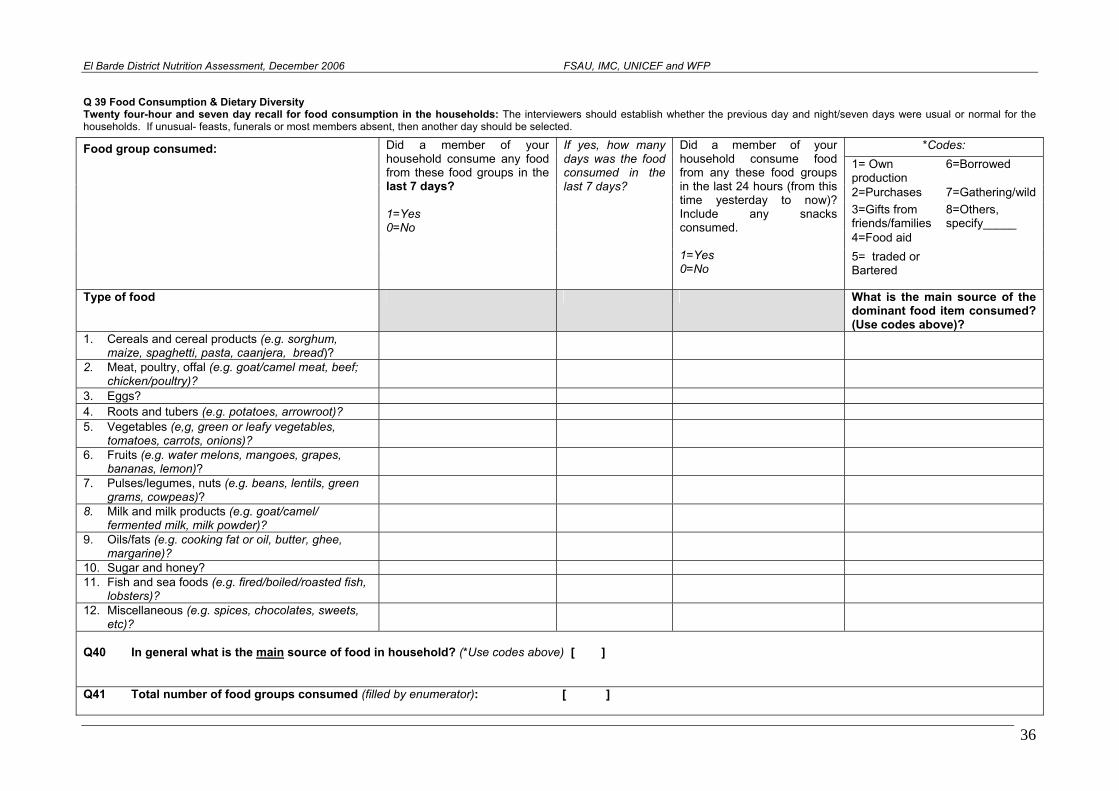
El Barde District Nutrition Assessment, December 2006 FSAU, IMC, UNICEF and WFP
Q 39 Food Consumption & Dietary Diversity Twenty four-hour and seven day recall for food consumption in the households: The interviewers should establish whether the previous day and night/seven days were usual or normal for the households. If unusual- feasts, funerals or most members absent, then another day should be selected.
*Codes: 1= Own production
6=Borrowed
2=Purchases 7=Gathering/wild 3=Gifts from friends/families
8=Others, specify_____
4=Food aid
Food group consumed:
Did a member of your household consume any food from these food groups in the last 7 days? 1=Yes 0=No
If yes, how many days was the food consumed in the last 7 days?
Did a member of your household consume food from any these food groups in the last 24 hours (from this time yesterday to now)? Include any snacks consumed. 1=Yes 0=No
5= traded or Bartered
Type of food What is the main source of the dominant food item consumed? (Use codes above)?
1. Cereals and cereal products (e.g. sorghum, maize, spaghetti, pasta, caanjera, bread)?
2. Meat, poultry, offal (e.g. goat/camel meat, beef; chicken/poultry)?
3. Eggs? 4. Roots and tubers (e.g. potatoes, arrowroot)? 5. Vegetables (e,g, green or leafy vegetables,
tomatoes, carrots, onions)?
6. Fruits (e.g. water melons, mangoes, grapes, bananas, lemon)?
7. Pulses/legumes, nuts (e.g. beans, lentils, green grams, cowpeas)?
8. Milk and milk products (e.g. goat/camel/ fermented milk, milk powder)?
9. Oils/fats (e.g. cooking fat or oil, butter, ghee, margarine)?
10. Sugar and honey? 11. Fish and sea foods (e.g. fired/boiled/roasted fish,
lobsters)?
12. Miscellaneous (e.g. spices, chocolates, sweets, etc)?
Q40 In general what is the main source of food in household? (*Use codes above) [ ] Q41 Total number of food groups consumed (filled by enumerator): [ ]
36
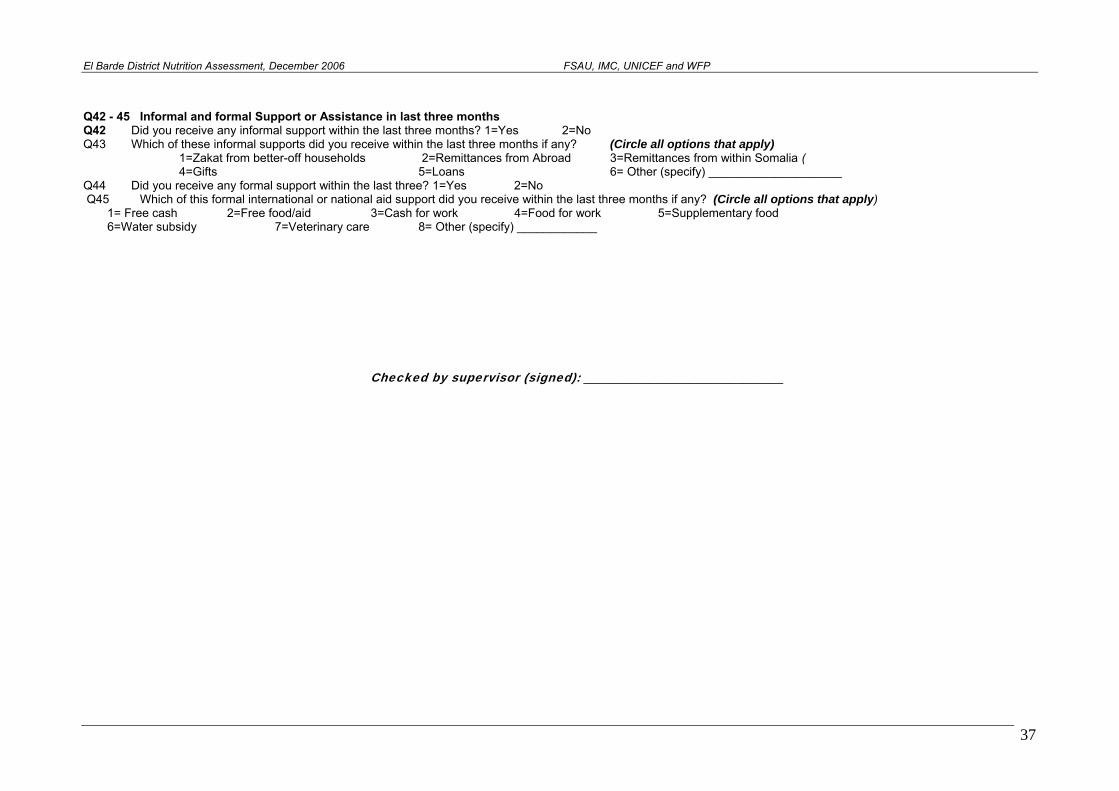
El Barde District Nutrition Assessment, December 2006 FSAU, IMC, UNICEF and WFP
Q42 - 45 Informal and formal Support or Assistance in last three months Q42 Did you receive any informal support within the last three months? 1=Yes 2=No Q43 Which of these informal supports did you receive within the last three months if any? (Circle all options that apply) 1=Zakat from better-off households 2=Remittances from Abroad 3=Remittances from within Somalia ( 4=Gifts 5=Loans 6= Other (specify) ____________________ Q44 Did you receive any formal support within the last three? 1=Yes 2=No Q45 Which of this formal international or national aid support did you receive within the last three months if any? (Circle all options that apply) 1= Free cash 2=Free food/aid 3=Cash for work 4=Food for work 5=Supplementary food 6=Water subsidy 7=Veterinary care 8= Other (specify) ____________ Checked by supervisor (signed): ______________________________
37
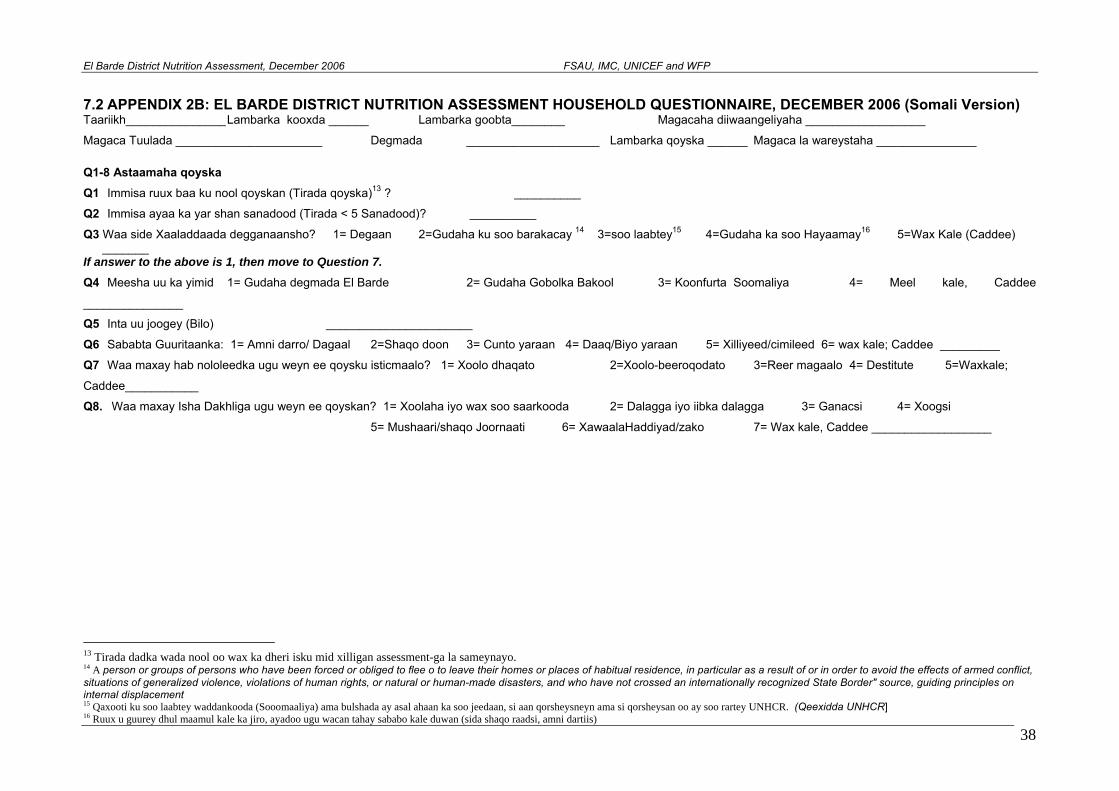
El Barde District Nutrition Assessment, December 2006 FSAU, IMC, UNICEF and WFP
7.2 APPENDIX 2B: EL BARDE DISTRICT NUTRITION ASSESSMENT HOUSEHOLD QUESTIONNAIRE, DECEMBER 2006 (Somali Version) Taariikh_______________ Lambarka kooxda ______ Lambarka goobta________ Magacaha diiwaangeliyaha __________________
Magaca Tuulada ______________________ Degmada ____________________ Lambarka qoyska ______ Magaca la wareystaha _______________
Q1-8 Astaamaha qoyska Q1 Immisa ruux baa ku nool qoyskan (Tirada qoyska)13 ? __________
Q2 Immisa ayaa ka yar shan sanadood (Tirada < 5 Sanadood)? __________
Q3 Waa side Xaaladdaada degganaansho? 1= Degaan 2=Gudaha ku soo barakacay 14 3=soo laabtey15 4=Gudaha ka soo Hayaamay16 5=Wax Kale (Caddee) _______
If answer to the above is 1, then move to Question 7.
Q4 Meesha uu ka yimid 1= Gudaha degmada El Barde 2= Gudaha Gobolka Bakool 3= Koonfurta Soomaliya 4= Meel kale, Caddee
_______________
Q5 Inta uu joogey (Bilo) ______________________
Q6 Sababta Guuritaanka: 1= Amni darro/ Dagaal 2=Shaqo doon 3= Cunto yaraan 4= Daaq/Biyo yaraan 5= Xilliyeed/cimileed 6= wax kale; Caddee _________
Q7 Waa maxay hab nololeedka ugu weyn ee qoysku isticmaalo? 1= Xoolo dhaqato 2=Xoolo-beeroqodato 3=Reer magaalo 4= Destitute 5=Waxkale;
Caddee___________ Q8. Waa maxay Isha Dakhliga ugu weyn ee qoyskan? 1= Xoolaha iyo wax soo saarkooda 2= Dalagga iyo iibka dalagga 3= Ganacsi 4= Xoogsi
5= Mushaari/shaqo Joornaati 6= XawaalaHaddiyad/zako 7= Wax kale, Caddee __________________
13 Tirada dadka wada nool oo wax ka dheri isku mid xilligan assessment-ga la sameynayo. 14 A person or groups of persons who have been forced or obliged to flee o to leave their homes or places of habitual residence, in particular as a result of or in order to avoid the effects of armed conflict, situations of generalized violence, violations of human rights, or natural or human-made disasters, and who have not crossed an internationally recognized State Border" source, guiding principles on internal displacement 15 Qaxooti ku soo laabtey waddankooda (Sooomaaliya) ama bulshada ay asal ahaan ka soo jeedaan, si aan qorsheysneyn ama si qorsheysan oo ay soo rartey UNHCR. (Qeexidda UNHCR]
38 16 Ruux u guurey dhul maamul kale ka jiro, ayadoo ugu wacan tahay sababo kale duwan (sida shaqo raadsi, amni dartiis)
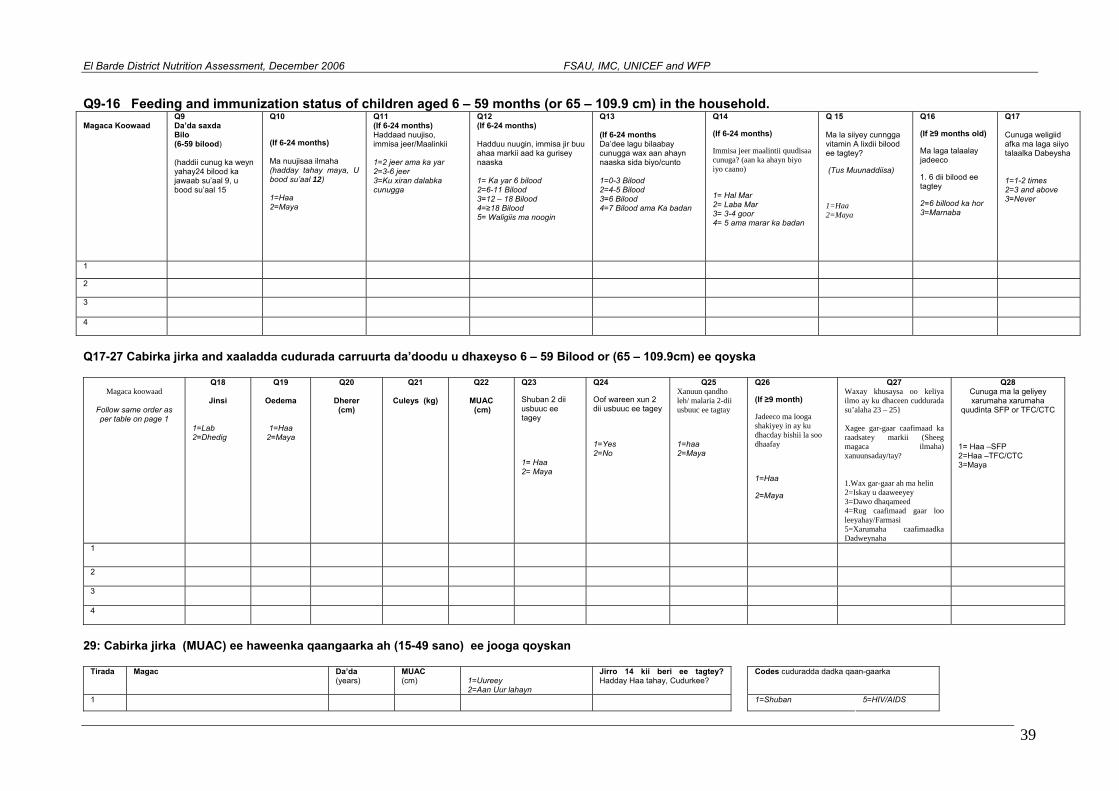
El Barde District Nutrition Assessment, December 2006 FSAU, IMC, UNICEF and WFP
Q9-16 Feeding and immunization status of children aged 6 – 59 months (or 65 – 109.9 cm) in the household. Magaca Koowaad
Q9 Da’da saxda Bilo (6-59 bilood) (haddii cunug ka weyn yahay24 bilood ka jawaab su’aal 9, u bood su’aal 15
Q10
(If 6-24 months) Ma nuujisaa ilmaha (hadday tahay maya, U bood su’aal 12) 1=Haa 2=Maya
Q11 (If 6-24 months) Haddaad nuujiso, immisa jeer/Maalinkii 1=2 jeer ama ka yar 2=3-6 jeer 3=Ku xiran dalabka cunugga
Q12 (If 6-24 months) Hadduu nuugin, immisa jir buu ahaa markii aad ka gurisey naaska 1= Ka yar 6 bilood 2=6-11 Bilood 3=12 – 18 Bilood 4=≥18 Bilood 5= Waligiis ma noogin
Q13 (If 6-24 months Da’dee lagu bilaabay cunugga wax aan ahayn naaska sida biyo/cunto 1=0-3 Bilood 2=4-5 Bilood 3=6 Bilood 4=7 Bilood ama Ka badan
Q14
(If 6-24 months)
Immisa jeer maalintii quudisaa cunuga? (aan ka ahayn biyo iyo caano)
1= Hal Mar 2= Laba Mar 3= 3-4 goor 4= 5 ama marar ka badan
Q 15 Ma la siiyey cunngga vitamin A lixdii bilood ee tagtey?
(Tus Muunaddiisa)
1=Haa 2=Maya
Q16
(If ≥9 months old)
Ma laga talaalay jadeeco
1. 6 dii bilood ee tagtey
2=6 billood ka hor 3=Marnaba
Q17 Cunuga weligiid afka ma laga siiyo talaalka Dabeysha 1=1-2 times 2=3 and above 3=Never
1
2
3
4
Q17-27 Cabirka jirka and xaaladda cudurada carruurta da’doodu u dhaxeyso 6 – 59 Bilood or (65 – 109.9cm) ee qoyska
Magaca koowaad
Follow same order as per table on page 1
Q18
Jinsi
1=Lab 2=Dhedig
Q19
Oedema
1=Haa 2=Maya
Q20
Dherer (cm)
Q21
Culeys (kg)
Q22
MUAC (cm)
Q23
Shuban 2 dii usbuuc ee tagey
1= Haa 2= Maya
Q24
Oof wareen xun 2 dii usbuuc ee tagey
1=Yes 2=No
Q25 Xanuun qandho leh/ malaria 2-dii usbuuc ee tagtay
1=haa 2=Maya
Q26
(If ≥9 month)
Jadeeco ma looga shakiyey in ay ku dhacday bishii la soo dhaafay
1=Haa
2=Maya
Q27 Waxay khusaysa oo keliya ilmo ay ku dhaceen cuddurada su’alaha 23 – 25} Xagee gar-gaar caafimaad ka raadsatey markii (Sheeg magaca ilmaha)xanuunsaday/tay?
1= Haa –SFP
1.Wax gar-gaar ah ma helin 2=Iskay u daaweeyey 3=Dawo dhaqameed 4=Rug caafimaad gaar loo leeyahay/Farmasi 5=Xarumaha caafimaadka Dadweynaha
Q28 Cunuga ma la geliyey xarumaha xarumaha
quudinta SFP or TFC/CTC
2=Haa –TFC/CTC 3=Maya
1
2
3
4
29: Cabirka jirka (MUAC) ee haweenka qaangaarka ah (15-49 sano) ee jooga qoyskan
Tirada Magac Da’da(years)
MUAC (cm)
1=Uureey 2=Aan Uur lahayn
Jirro 14 kii beri ee tagtey? Hadday Haa tahay, Cudurkee?
Codes cuduradda dadka qaan-gaarka
1 1=Shuban 5=HIV/AIDS
39
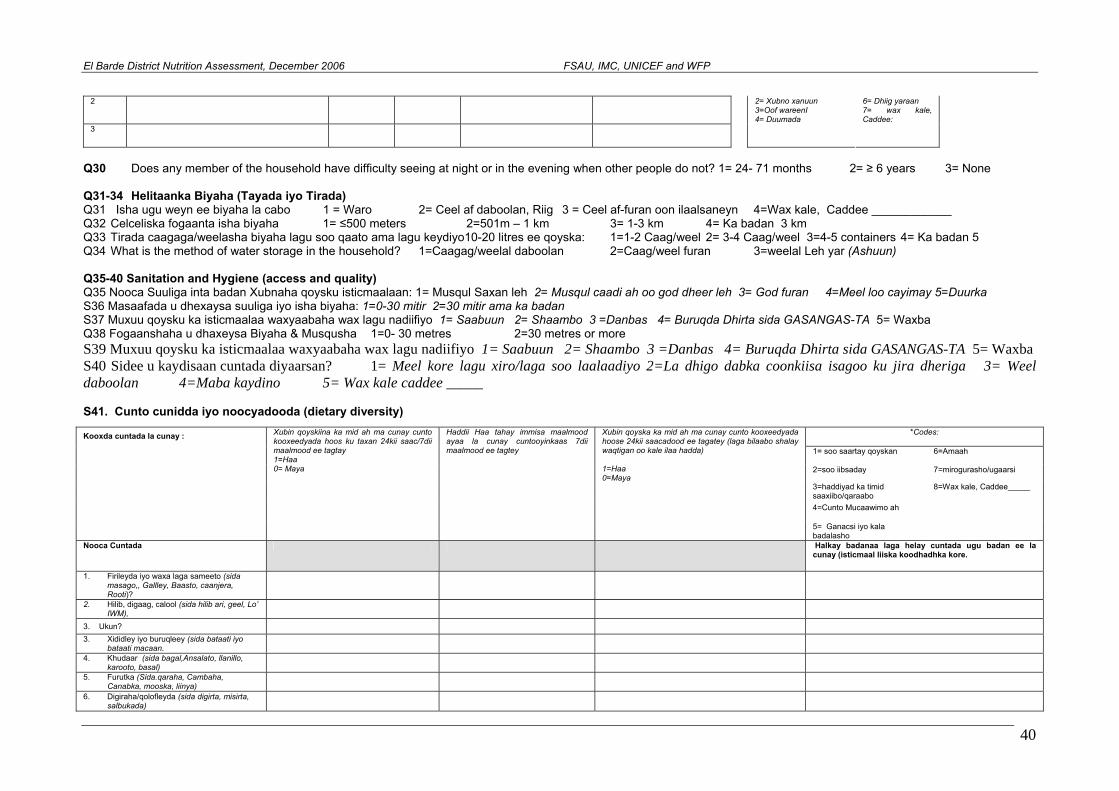
El Barde District Nutrition Assessment, December 2006 FSAU, IMC, UNICEF and WFP
2
3 4= Duumada
2= Xubno xanuun 3=Oof wareenI
6= Dhiig yaraan 7= wax kale, Caddee:
Q30 Does any member of the household have difficulty seeing at night or in the evening when other people do not? 1= 24- 71 months 2= ≥ 6 years 3= None Q31-34 Helitaanka Biyaha (Tayada iyo Tirada) Q31 Isha ugu weyn ee biyaha la cabo 1 = Waro 2= Ceel af daboolan, Riig 3 = Ceel af-furan oon ilaalsaneyn 4=Wax kale, Caddee ____________ Q32 Celceliska fogaanta isha biyaha 1= ≤500 meters 2=501m – 1 km 3= 1-3 km 4= Ka badan 3 km Q33 Tirada caagaga/weelasha biyaha lagu soo qaato ama lagu keydiyo10-20 litres ee qoyska: 1=1-2 Caag/weel 2= 3-4 Caag/weel 3=4-5 containers 4= Ka badan 5 Q34 What is the method of water storage in the household? 1=Caagag/weelal daboolan 2=Caag/weel furan 3=weelal Leh yar (Ashuun) Q35-40 Sanitation and Hygiene (access and quality) Q35 Nooca Suuliga inta badan Xubnaha qoysku isticmaalaan: 1= Musqul Saxan leh 2= Musqul caadi ah oo god dheer leh 3= God furan 4=Meel loo cayimay 5=Duurka S36 Masaafada u dhexaysa suuliga iyo isha biyaha: 1=0-30 mitir 2=30 mitir ama ka badan S37 Muxuu qoysku ka isticmaalaa waxyaabaha wax lagu nadiifiyo 1= Saabuun 2= Shaambo 3 =Danbas 4= Buruqda Dhirta sida GASANGAS-TA 5= Waxba Q38 Fogaanshaha u dhaxeysa Biyaha & Musqusha 1=0- 30 metres 2=30 metres or more S39 Muxuu qoysku ka isticmaalaa waxyaabaha wax lagu nadiifiyo 1= Saabuun 2= Shaambo 3 =Danbas 4= Buruqda Dhirta sida GASANGAS-TA 5= Waxba S40 Sidee u kaydisaan cuntada diyaarsan? 1= Meel kore lagu xiro/laga soo laalaadiyo 2=La dhigo dabka coonkiisa isagoo ku jira dheriga 3= Weel daboolan 4=Maba kaydino 5= Wax kale caddee _____ S41. Cunto cunidda iyo noocyadooda (dietary diversity)
*Codes:
1= soo saartay qoyskan 6=Amaah
2=soo iibsaday 7=mirogurasho/ugaarsi
3=haddiyad ka timid saaxiibo/qaraabo
8=Wax kale, Caddee_____
4=Cunto Mucaawimo ah
Kooxda cuntada la cunay :
Xubin qoyskiina ka mid ah ma cunay cunto kooxeedyada hoos ku taxan 24kii saac/7dii maalmood ee tagtay 1=Haa 0= Maya
Haddii Haa tahay immisa maalmood ayaa la cunay cuntooyinkaas 7dii maalmood ee tagtey
Xubin qoyska ka mid ah ma cunay cunto kooxeedyada hoose 24kii saacadood ee tagatey (laga bilaabo shalay waqtigan oo kale ilaa hadda) 1=Haa 0=Maya
5= Ganacsi iyo kala badalasho
Nooca Cuntada Halkay badanaa laga helay cuntada ugu badan ee la cunay (isticmaal liiska koodhadhka kore.
1. Firileyda iyo waxa laga sameeto (sida masago,, Gallley, Baasto, caanjera, Rooti)?
2. Hilib, digaag, calool (sida hilib ari, geel, Lo’ IWM),
3. Ukun?
3. Xididley iyo buruqleey (sida bataati iyo bataati macaan.
4. Khudaar (sida bagal,Ansalato, llanillo, karooto, basal)
5. Furutka (Sida.qaraha, Cambaha, Canabka, mooska, liinya)
6. Digiraha/qolofleyda (sida digirta, misirta, salbukada)
40
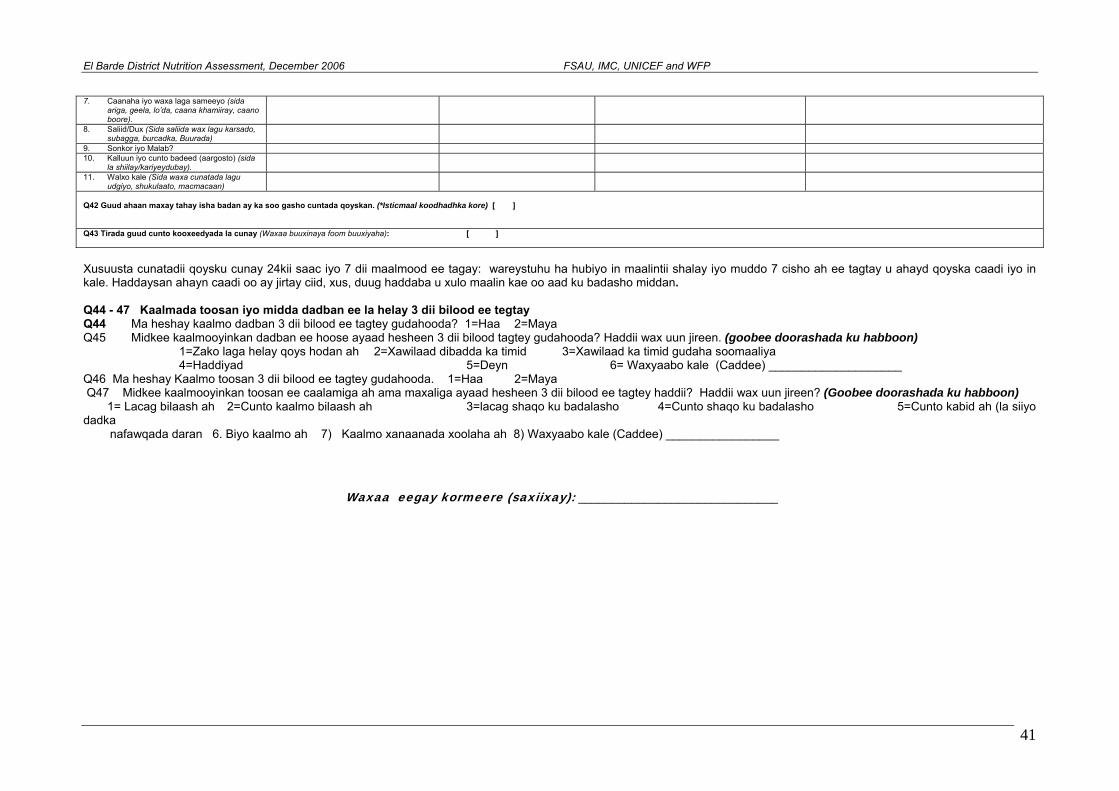
ent, December 2006 FSAU, IMC, UNICEF and WFP
41
Xusuusta cunatadii qoysku cunay 24kii saac iyo 7 dii maalmood ee tagay: wareystuhu ha hubiyo in maalintii shalay iyo muddo 7 cisho ah ee tagtay u ahayd qoyska caadi iyo in kale. Haddaysan ahayn caadi oo ay jirtay ciid, xus, duug haddaba u xulo maalin kae oo aad ku badasho middan. Q44 - 47 Kaalmada toosan iyo midda dadban ee la helay 3 dii bilood ee tegtay Q44 Ma heshay kaalmo dadban 3 dii bilood ee tagtey gudahooda? 1=Haa 2=Maya Q45 Midkee kaalmooyinkan dadban ee hoose ayaad hesheen 3 dii bilood tagtey gudahooda? Haddii wax uun jireen. (goobee doorashada ku habboon) 1=Zako laga helay qoys hodan ah 2=Xawilaad dibadda ka timid 3=Xawilaad ka timid gudaha soomaaliya 4=Haddiyad 5=Deyn 6= Waxyaabo kale (Caddee) ____________________ Q46 Ma heshay Kaalmo toosan 3 dii bilood ee tagtey gudahooda. 1=Haa 2=Maya Q47 Midkee kaalmooyinkan toosan ee caalamiga ah ama maxaliga ayaad hesheen 3 dii bilood ee tagtey haddii? Haddii wax uun jireen? (Goobee doorashada ku habboon) 1= Lacag bilaash ah 2=Cunto kaalmo bilaash ah 3=lacag shaqo ku badalasho 4=Cunto shaqo ku badalasho 5=Cunto kabid ah (la siiyo dadka nafawqada daran 6. Biyo kaalmo ah 7) Kaalmo xanaanada xoolaha ah 8) Waxyaabo kale (Caddee) _________________
Waxaa eegay kormeere (saxiixay): ______________________________
El Barde District Nutrition Assessm
7. Caanaha iyo waxa laga sameeyo (sida ariga, geela, lo’da, caana khamiiray, caano boore).
8. Saliid/Dux (Sida saliida wax lagu karsado, subagga, burcadka, Buurada)
9. Sonkor iyo Malab? 10. Kalluun iyo cunto badeed (aargosto) (sida
la shiilay/kariyeydubay).
11. Walxo kale (Sida waxa cunatada lagu udgiyo, shukulaato, macmacaan)
Q42 Guud ahaan maxay tahay isha badan ay ka soo gasho cuntada qoyskan. (*Isticmaal koodhadhka kore) [ ] Q43 Tirada guud cunto kooxeedyada la cunay (Waxaa buuxinaya foom buuxiyaha): [ ]
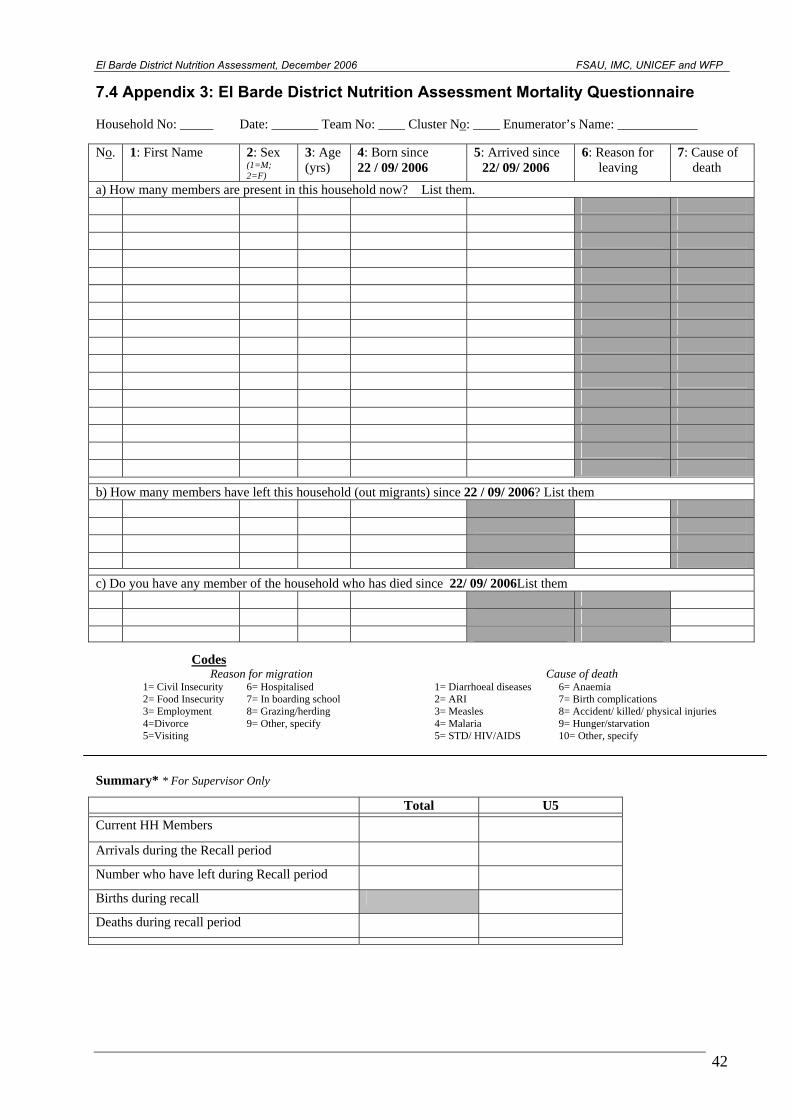
El Barde District Nutrition Assessment, December 2006 FSAU, IMC, UNICEF and WFP
7.4 Appendix 3: El Barde District Nutrition Assessment Mortality Questionnaire Household No: _____ Date: _______ Team No: ____ Cluster No: ____ Enumerator’s Name: ____________ No. 1: First Name 2: Sex
(1=M; 2=F)
3: Age (yrs)
4: Born since 22 / 09/ 2006
5: Arrived since 22/ 09/ 2006
6: Reason for leaving
7: Cause of death
a) How many members are present in this household now? List them.
b) How many members have left this household (out migrants) since 22 / 09/ 2006? List them
c) Do you have any member of the household who has died since 22/ 09/ 2006List them
Codes Reason for migration Cause of death
1= Civil Insecurity 6= Hospitalised 2= Food Insecurity 7= In boarding school 3= Employment 8= Grazing/herding 4=Divorce 9= Other, specify 5=Visiting
1= Diarrhoeal diseases 2= ARI 3= Measles 4= Malaria 5= STD/ HIV/AIDS
6= Anaemia 7= Birth complications 8= Accident/ killed/ physical injuries 9= Hunger/starvation 10= Other, specify
Summary* * For Supervisor Only
Total U5
Current HH Members
Arrivals during the Recall period
Number who have left during Recall period
Births during recall
Deaths during recall period
42
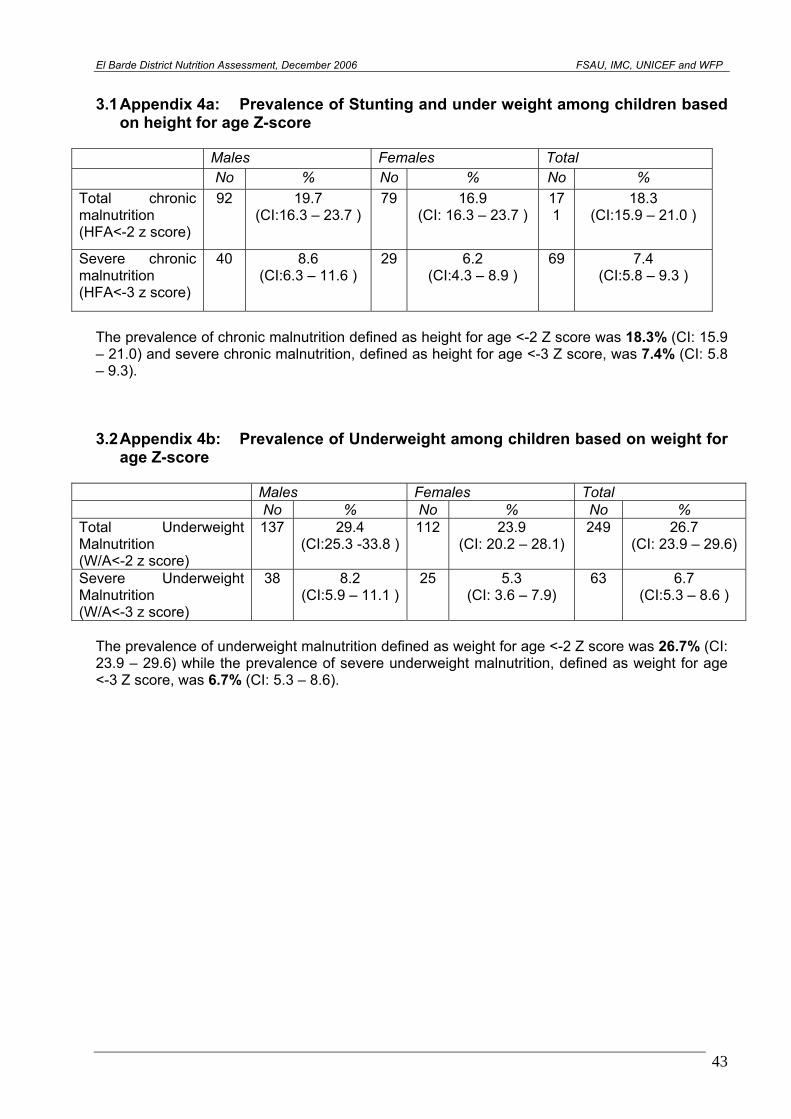
El Barde District Nutrition Assessment, December 2006 FSAU, IMC, UNICEF and WFP
3.1 Appendix 4a: Prevalence of Stunting and under weight among children based
on height for age Z-score
Males Females Total No % No % No % Total chronic malnutrition (HFA<-2 z score)
92
19.7 (CI:16.3 – 23.7 )
79
16.9 (CI: 16.3 – 23.7 )
171
18.3 (CI:15.9 – 21.0 )
Severe chronic malnutrition (HFA<-3 z score)
40
8.6 (CI:6.3 – 11.6 )
29
6.2 (CI:4.3 – 8.9 )
69
7.4 (CI:5.8 – 9.3 )
The prevalence of chronic malnutrition defined as height for age <-2 Z score was 18.3% (CI: 15.9 – 21.0) and severe chronic malnutrition, defined as height for age <-3 Z score, was 7.4% (CI: 5.8 – 9.3). 3.2 Appendix 4b: Prevalence of Underweight among children based on weight for
age Z-score
Males Females Total No % No % No % Total Underweight Malnutrition (W/A<-2 z score)
137
29.4 (CI:25.3 -33.8 )
112
23.9 (CI: 20.2 – 28.1)
249
26.7 (CI: 23.9 – 29.6)
Severe Underweight Malnutrition (W/A<-3 z score)
38
8.2 (CI:5.9 – 11.1 )
25
5.3 (CI: 3.6 – 7.9)
63
6.7 (CI:5.3 – 8.6 )
The prevalence of underweight malnutrition defined as weight for age <-2 Z score was 26.7% (CI: 23.9 – 29.6) while the prevalence of severe underweight malnutrition, defined as weight for age <-3 Z score, was 6.7% (CI: 5.3 – 8.6).
43
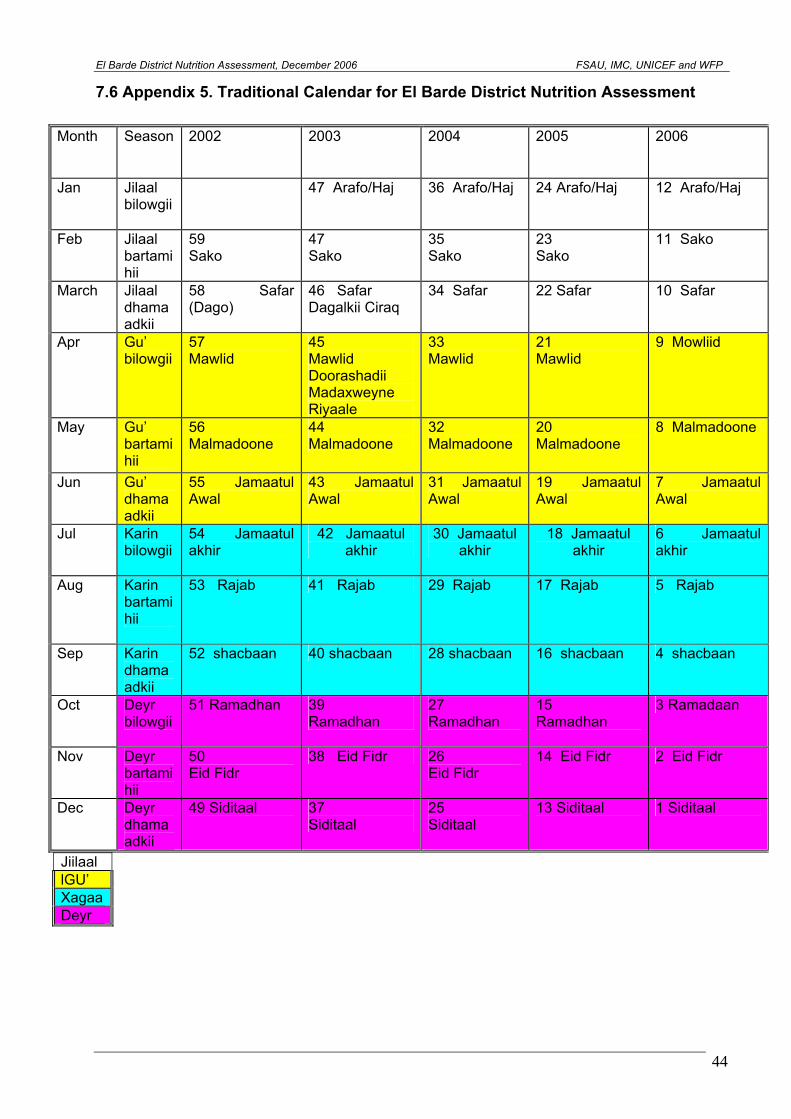
El Barde District Nutrition Assessment, December 2006 FSAU, IMC, UNICEF and WFP
7.6 Appendix 5. Traditional Calendar for El Barde District Nutrition Assessment
Jiilaal lGU’ Xagaa Deyr
Month
Season 2002 2003 2004 2005 2006
Jan
Jilaal bilowgii
47 Arafo/Haj 36 Arafo/Haj 24 Arafo/Haj 12 Arafo/Haj
Feb
Jilaal bartamihii
59 Sako
47 Sako
35 Sako
23 Sako
11 Sako
March
Jilaal dhamaadkii
58 Safar (Dago)
46 Safar Dagalkii Ciraq
34 Safar 22 Safar 10 Safar
Apr Gu’ bilowgii
57 Mawlid
45 Mawlid Doorashadii Madaxweyne Riyaale
33 Mawlid
21 Mawlid
9 Mowliid
May
Gu’ bartamihii
56 Malmadoone
44 Malmadoone
32 Malmadoone
20 Malmadoone
8 Malmadoone
Jun
Gu’ dhamaadkii
55 Jamaatul Awal
43 Jamaatul Awal
31 Jamaatul Awal
19 Jamaatul Awal
7 Jamaatul Awal
Jul
Karin bilowgii
54 Jamaatul akhir
42 Jamaatul akhir
30 Jamaatul akhir
18 Jamaatul akhir
6 Jamaatul akhir
Aug
Karin bartamihii
53 Rajab 41 Rajab 29 Rajab 17 Rajab 5 Rajab
Sep
Karin dhamaadkii
52 shacbaan 40 shacbaan 28 shacbaan 16 shacbaan 4 shacbaan
Oct
Deyr bilowgii
51 Ramadhan 39 Ramadhan
27 Ramadhan
15 Ramadhan
3 Ramadaan
Nov
Deyr bartamihii
50 Eid Fidr
38 Eid Fidr 26 Eid Fidr
14 Eid Fidr 2 Eid Fidr
Dec
Deyr dhamaadkii
49 Siditaal 37 Siditaal
25 Siditaal
13 Siditaal 1 Siditaal
44
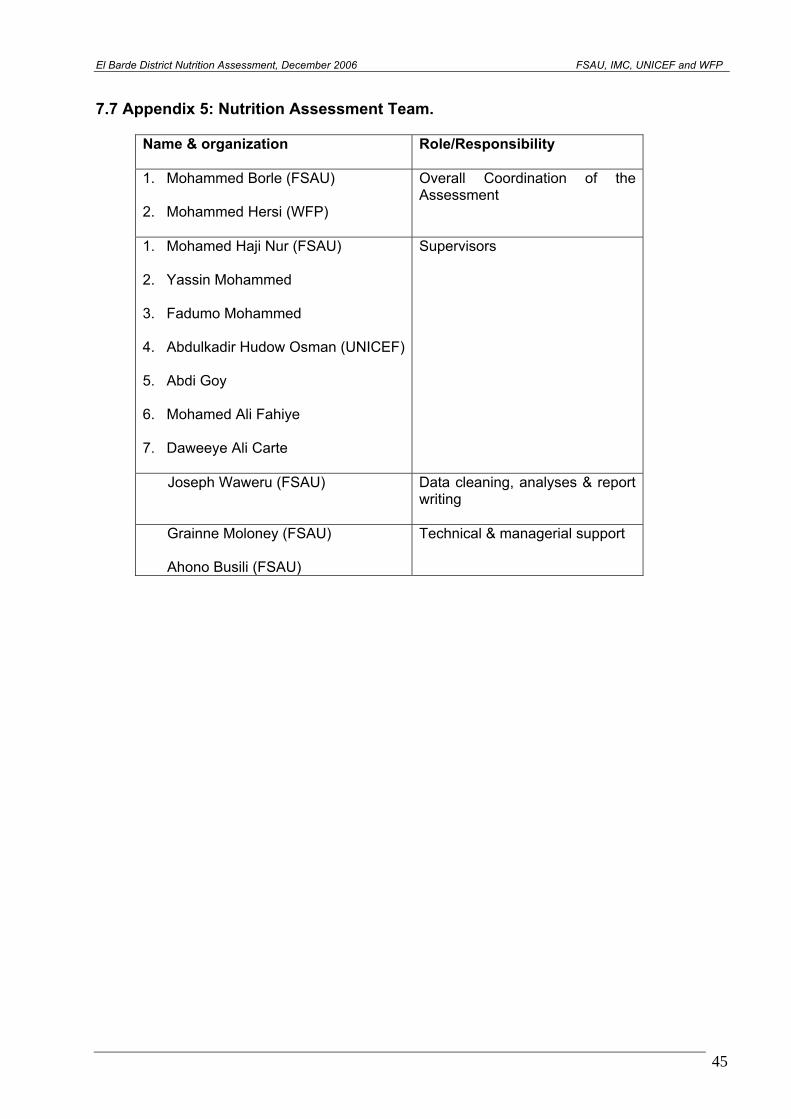
El Barde District Nutrition Assessment, December 2006 FSAU, IMC, UNICEF and WFP
7.7 Appendix 5: Nutrition Assessment Team.
Name & organization
Role/Responsibility
1. Mohammed Borle (FSAU) 2. Mohammed Hersi (WFP)
Overall Coordination of the Assessment
1. Mohamed Haji Nur (FSAU) 2. Yassin Mohammed 3. Fadumo Mohammed 4. Abdulkadir Hudow Osman (UNICEF) 5. Abdi Goy 6. Mohamed Ali Fahiye 7. Daweeye Ali Carte
Supervisors
Joseph Waweru (FSAU) Data cleaning, analyses & report writing
Grainne Moloney (FSAU)
Ahono Busili (FSAU)
Technical & managerial support
45
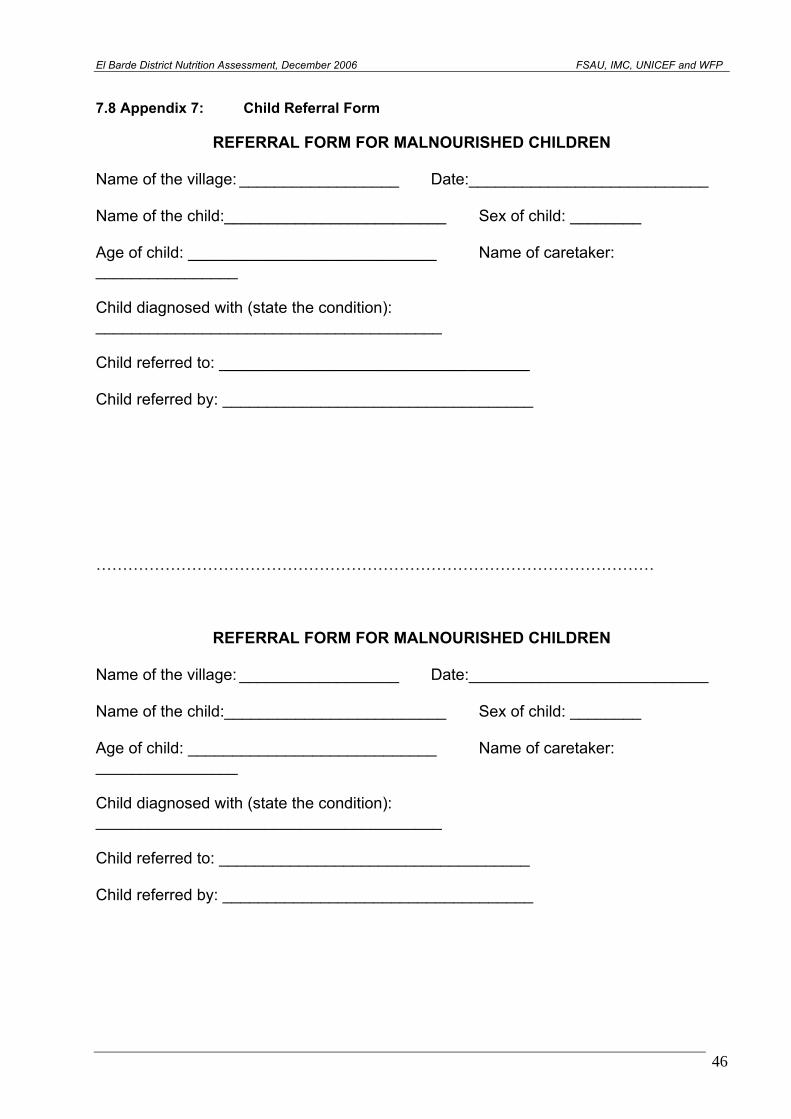
El Barde District Nutrition Assessment, December 2006 FSAU, IMC, UNICEF and WFP
7.8 Appendix 7: Child Referral Form
REFERRAL FORM FOR MALNOURISHED CHILDREN Name of the village: __________________ Date:___________________________ Name of the child:_________________________ Sex of child: ________ Age of child: ____________________________ Name of caretaker: ________________ Child diagnosed with (state the condition): _______________________________________ Child referred to: ___________________________________ Child referred by: ___________________________________ ……………………………………………………………………………………………
REFERRAL FORM FOR MALNOURISHED CHILDREN Name of the village: __________________ Date:___________________________ Name of the child:_________________________ Sex of child: ________ Age of child: ____________________________ Name of caretaker: ________________ Child diagnosed with (state the condition): _______________________________________ Child referred to: ___________________________________ Child referred by: ___________________________________
46
El Barde District Nutrition Assessment, December 2006 FSAU, IMC, UNICEF and WFP
8.0 REFERENCES AND BIBLIOGRAHY CARE and WFP: Field Methods Manual. The Coping Strategies Index – A tool for rapid measurement of household food security and the impact of food aid programs in humanitarian emergencies. FEWS NET, 2003. Urban Assessment, Food economy FSAU, Technical Series Report No V.9; 2006 Post Gu Analysis FSAU, Technical Series Report No IV.8; 2005/06 Post Deyr Analysis FSAU, September 2002: Food Utilisation in Somalia FSAU, November 2003: Nutrition Training Manual: A guide to data collection, analysis, interpretation and use. FSAU, April 2004: Dietary Diversity in Somalia IRC and partners, Inter-agency Returnee Settlement Area Assessment, June 2002. SACB: Nutrition assessment guidelines for Somalia. Sphere (2004). Humanitarian Charter and Minimum Standards in Disaster Response. The Sphere Project. Standardized Monitoring and Assessment of Relief and Transition (SMART). Standardizing Assessment methodology. Technical Series. July 23 – 26, 2002. Washington, DC. WHO, 1995: Guide on rapid nutritional assessment in emergencies
47