electric market national overview - federal energy regulatory … · 2008-11-18 · electric market...
TRANSCRIPT
Federal Energy Regulatory Commission • Market Oversight @ FERC.gov
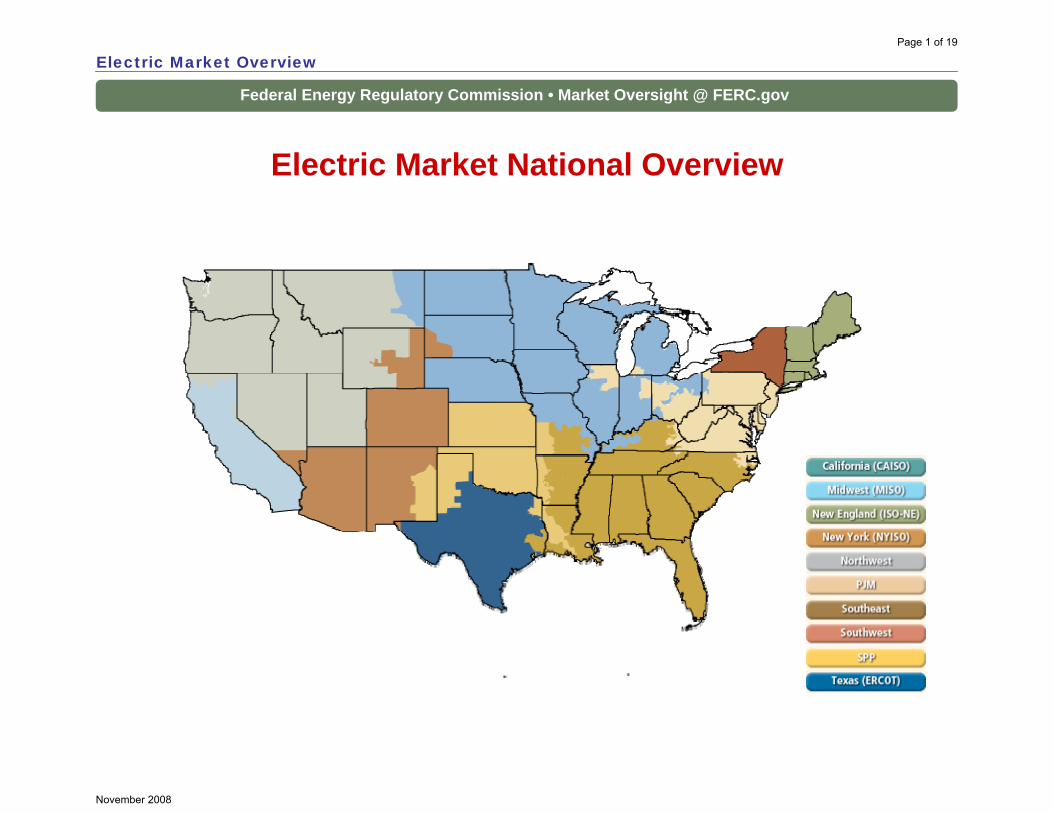
Electric Market National Overview
Electric Market OverviewPage 1 of 19
November 2008

NE
CA
NV
OR
WAMT
ID
WY
UT
NMOK
CO
SD
NDMN
IL
WI
IA
MO
AR
KS
AL GASC
FL
OH
KY
NC
VA
PA
WV
TX
MI
IN
LA
MS
TN
NY
MEVT
MA
RICTNJ
MD
DE
NH
AZ
REGIONAL TRANSMISSION ORGANIZATIONS
NY ISO
This map was created using Platts POWERmap, November 2008
SPP RTO
Alberta ElectricSystem Operator
(AESO)
MISO RTO
Ontario Independent Electricity
System Operator
New England
ISO
ERCOT ISO
CaliforniaISO
PJMInterconnection
Page 2 of 19
November 2008

Federal Energy Regulatory Commission • Market Oversight @ FERC.gov
Weekly U.S. Electric Generation Output and Temperatures
Electric Market Overview: Generation Output and Temperatures
1110Source: Derived from EEI and NOAA data.
50,000
60,000
70,000
80,000
90,000
100,000
Jan Feb Mar Apr May Jun Jul Aug Sep Oct Nov Dec
Ele
ctric
Gen
erat
ion
(GW
h)
2003-2007 Range2008
-60-40-20
020406080
War
mer
Tem
pera
ture
s th
anN
orm
al (D
egre
e D
ays)
Heating SeasonHeating Season Cooling Season
Updated November 7, 2008
Page 3 of 19
November 2008
Federal Energy Regulatory Commission • Market Oversight @ FERC.gov
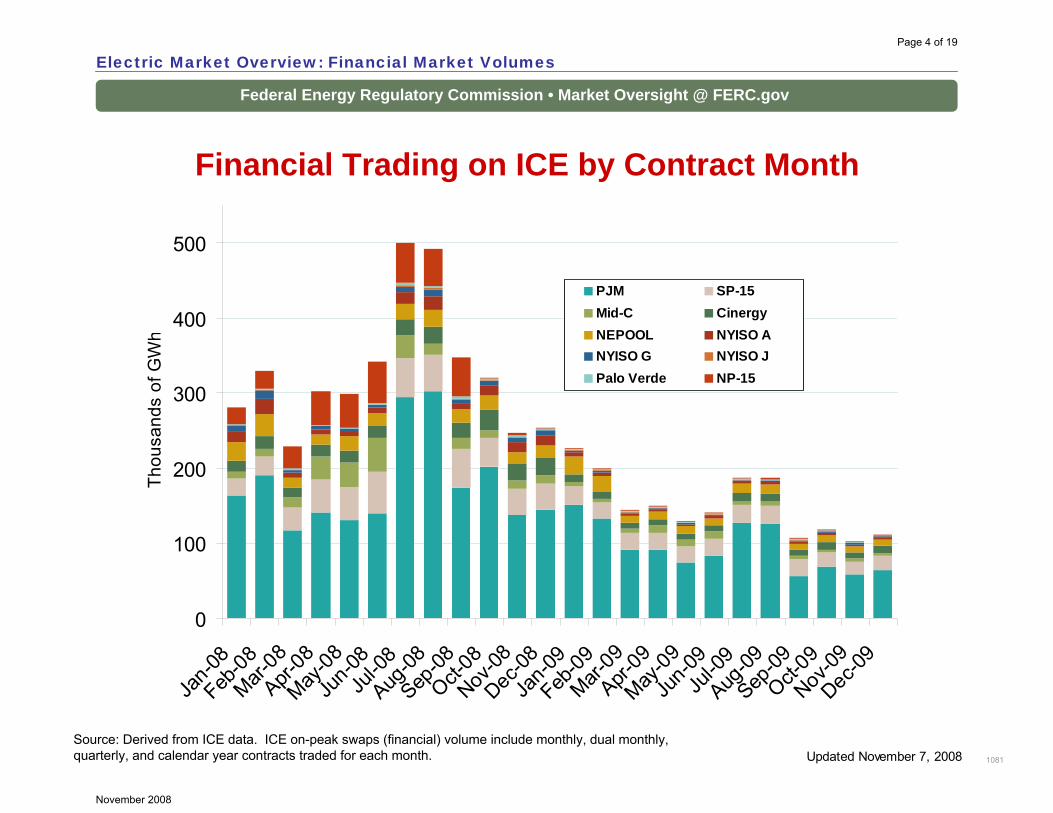
Financial Trading on ICE by Contract Month
Electric Market Overview: Financial Market Volumes
1081
Source: Derived from ICE data. ICE on-peak swaps (financial) volume include monthly, dual monthly, quarterly, and calendar year contracts traded for each month.
0
100
200
300
400
500
Jan-0
8Feb
-08Mar-
08Apr-
08May
-08Ju
n-08
Jul-0
8Aug
-08Sep
-08Oct-
08Nov
-08Dec
-08Ja
n-09
Feb-09
Mar-09
Apr-09
May-09
Jun-0
9Ju
l-09
Aug-09
Sep-09
Oct-09
Nov-09
Dec-09
Thou
sand
s of
GW
h
PJM SP-15Mid-C CinergyNEPOOL NYISO ANYISO G NYISO JPalo Verde NP-15
Updated November 7, 2008
Page 4 of 19
November 2008

Federal Energy Regulatory Commission • Market Oversight @ FERC.gov
Renewable Energy Portfolio Standards (RPS)
Electric Market Overview: Renewables
1109
Notes: Alaska has no RPS; * Iowa has a goal of 1,000 MW of wind by 2010; TVA’s “Renewable Energy and Clean Energy Assessment” is from the Public Power Authority; it is not a state policy.Abbreviations: DG: distributed generation; DR: demand response; EE: energy efficiency; IRP: integrated resource plan.Sources: Derived from data in: EEI, EIA, LBNL, PUCs, State legislative tracking services, Database of State Incentives for Renewables and Efficiency, and the Union of Concerned Scientists.
RPS
Strengthened/ amended RPS
Voluntary standards or goals
Proposed RPS or studying RPS
Other renewable energy goal
NV: 20% by 2015; solar 5% per year
CA: 20% by 2010; goal of 33% by 2020
AZ: 15% by 2025; includes 30% DG
TX: 5,880 MW by 2015;goal of 10,000 MW by 2025
IA: 1,105 MW by 2011*
MN: 25% by 2025Xcel 30% by 2020
ME: 40% by 2017
MA: 15% by 2020; 250 MW solar goal by 2017
CT: 23% Class I/II by 20204% Class III by 2010
NJ: 22.5% by 2020; 2% solar; MEP proposes increases
PA: 8% Tier I, 10% Tier II by 2020; 0.5% solar set-aside
MD: 20% by 2022, with 2% solar
HI: 20% by 2020, and goal of 70% RE by 2030
RI: 16% by 2019
KY: recommended goal
CO: 20% by 2020; co-ops & munis 10%;
includes 4% solar
NM: 20% by 2020; co-ops 10%
WI: 10% by 2015; proposed for 2009: 25% by 2025
DC: 20% by 2020; with 0.4% solar
VT: 25% by 2025
MT: 15% by 2015
DE: 20% by 2019, with 2% solar
WA: 15% by 2020
OH: 12.5% by 2025; 0.5% solar
OR: 25% by 2025;small utilities 5-10%
IL: 25% by 2025
MO:15% by 2021;at least 2% solar
NH: 23.8% BY 2025
VA: 12% by 2022
NC: 12.5% by 2021co-ops & munis: 10% by 2018
FL: PSC postponed vote on draftRPS to Jan 2009 for more study
KS: 20% wind by 2020
ND: 10% by 2015
UT: 20% by 2025
MI: 10% by 2015, and new RE capacity: 1,100 MW by 2015
Updates at: http://www.ferc.gov/market-oversight/mkt-electric/overview/elec-ovr-rps.pdf
Updated November 7, 2008
AR: utilities to include RE in IRPs
OK: studying RPS, RE transmission, cost-recovery
NY: 24% by 2013
ID: Priority to DR, EE, and in-state RE
TVA: examining renewable and clean energy potential*
28 states plus D.C. have an RPS
Page 5 of 19
November 2008

Federal Energy Regulatory Commission • Market Oversight @ FERC.gov
Renewable Energy Portfolio Standards
Electric Market Overview: Renewables
1109
• A Renewable Portfolio Standard (RPS) requires a percent of energy sales or installed capacity to come from renewable resources.
• 28 states plus D.C., have renewable energy standards. • Recent state policy developments include:
– New Jersey released its Master Energy Plan in October. The MEP calls for exceeding NJ’s RPS with 30% of state electricity from renewables by 2030 and changing the solar goal from 2% of sales to 2120 GWh by 2020. Proposed renewable resources include 900 MW of biomass; 3,000 MW from offshore- and 200 MW from onshore-wind; and supporting emerging energy technologies.
– Florida presented a draft RPS to PSC Commissioners at their October meeting. A vote on the RPS was deferred to a Jan 9 special PSC agenda to allow time for more study. When the PSC approves it, the RPS must be submitted to the legislature by Feb 2009 for ratification.
– Hawaii: Hawaii Electric (HE) signed an agreement with the Governor and other stage agencies setting forth the Hawaii Clean Energy Initiative (HCEI) goals. It agreed to a goal of 70% of HI’selectricity and ground transportation energy from RE and EE by 2030. HCEI will try to amend the RPS from 20% to 25% RE by 2020 and add a further goal of 40% by 2030.
• Six states have renewable goals without financial penalties: UT, ND, KS, MO, KY, VA, VT.
• Thirteen states include energy efficiency in their RPS or renewable goals; more are considering energy efficiency additions or companion bills.
• Ballot propositions on renewables were on state and local elections on Nov 4:
– Missouri voters passed Prop C by 66%, repealing the voluntary renewable goal and substituting a RPS. MO utilities must meet a goal of 15% renewables by 2021, including a 2% solar carve-out. They can meet the goal by generating or buying renewable energy or by buying renewable energy credits. In-state resources count 1.25 times more than out-of-state energy or credits.
– California voters turned down two propositions: Prop 7 would have increased the RPS to 50% by 2025. A bond initiative that would have funded alternative-energy vehicles and renewable research also failed.
– Boulder, CO voters passed Issue 1A by 65%, authorizing the county to issue special bonds to offer low-interest financing for residential and commercial energy efficiency improvements or for installing solar PV or other renewable energy systems.
Updated November 7, 2008
Page 6 of 19
November 2008
Federal Energy Regulatory Commission • Market Oversight @ FERC.gov
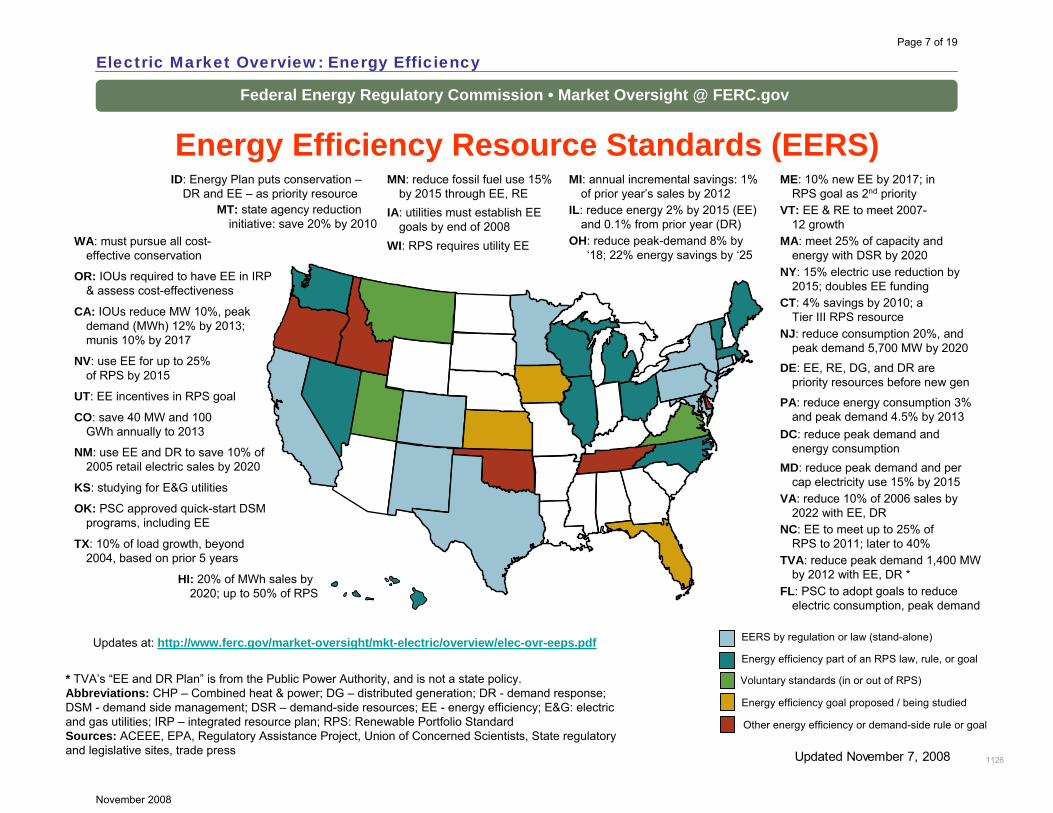
Energy Efficiency Resource Standards (EERS)
Electric Market Overview: Energy Efficiency
1126
* TVA’s “EE and DR Plan” is from the Public Power Authority, and is not a state policy.Abbreviations: CHP – Combined heat & power; DG – distributed generation; DR - demand response; DSM - demand side management; DSR – demand-side resources; EE - energy efficiency; E&G: electric and gas utilities; IRP – integrated resource plan; RPS: Renewable Portfolio StandardSources: ACEEE, EPA, Regulatory Assistance Project, Union of Concerned Scientists, State regulatory and legislative sites, trade press
IL: reduce energy 2% by 2015 (EE) and 0.1% from prior year (DR)
MI: annual incremental savings: 1% of prior year’s sales by 2012
MT: state agency reduction initiative: save 20% by 2010
ID: Energy Plan puts conservation –DR and EE – as priority resource
MN: reduce fossil fuel use 15% by 2015 through EE, RE
IA: utilities must establish EE goals by end of 2008
WI: RPS requires utility EE OH: reduce peak-demand 8% by ‘18; 22% energy savings by ‘25
Updates at: http://www.ferc.gov/market-oversight/mkt-electric/overview/elec-ovr-eeps.pdf EERS by regulation or law (stand-alone)
Energy efficiency part of an RPS law, rule, or goal
Energy efficiency goal proposed / being studied
Voluntary standards (in or out of RPS)
Other energy efficiency or demand-side rule or goal
NV: use EE for up to 25% of RPS by 2015
CA: IOUs reduce MW 10%, peak demand (MWh) 12% by 2013; munis 10% by 2017
TX: 10% of load growth, beyond 2004, based on prior 5 years
HI: 20% of MWh sales by 2020; up to 50% of RPS
CO: save 40 MW and 100 GWh annually to 2013
WA: must pursue all cost-effective conservation
NM: use EE and DR to save 10% of 2005 retail electric sales by 2020
UT: EE incentives in RPS goal
OK: PSC approved quick-start DSM programs, including EE
OR: IOUs required to have EE in IRP & assess cost-effectiveness
KS: studying for E&G utilities
Updated November 7, 2008
VT: EE & RE to meet 2007-12 growth
CT: 4% savings by 2010; a Tier III RPS resource
NJ: reduce consumption 20%, and peak demand 5,700 MW by 2020
ME: 10% new EE by 2017; in RPS goal as 2nd priority
VA: reduce 10% of 2006 sales by 2022 with EE, DR
NY: 15% electric use reduction by 2015; doubles EE funding
NC: EE to meet up to 25% of RPS to 2011; later to 40%
FL: PSC to adopt goals to reduce electric consumption, peak demand
MD: reduce peak demand and per cap electricity use 15% by 2015
DE: EE, RE, DG, and DR are priority resources before new gen
MA: meet 25% of capacity and energy with DSR by 2020
DC: reduce peak demand and energy consumption
TVA: reduce peak demand 1,400 MW by 2012 with EE, DR *
PA: reduce energy consumption 3% and peak demand 4.5% by 2013
Page 7 of 19
November 2008
Federal Energy Regulatory Commission • Market Oversight @ FERC.gov
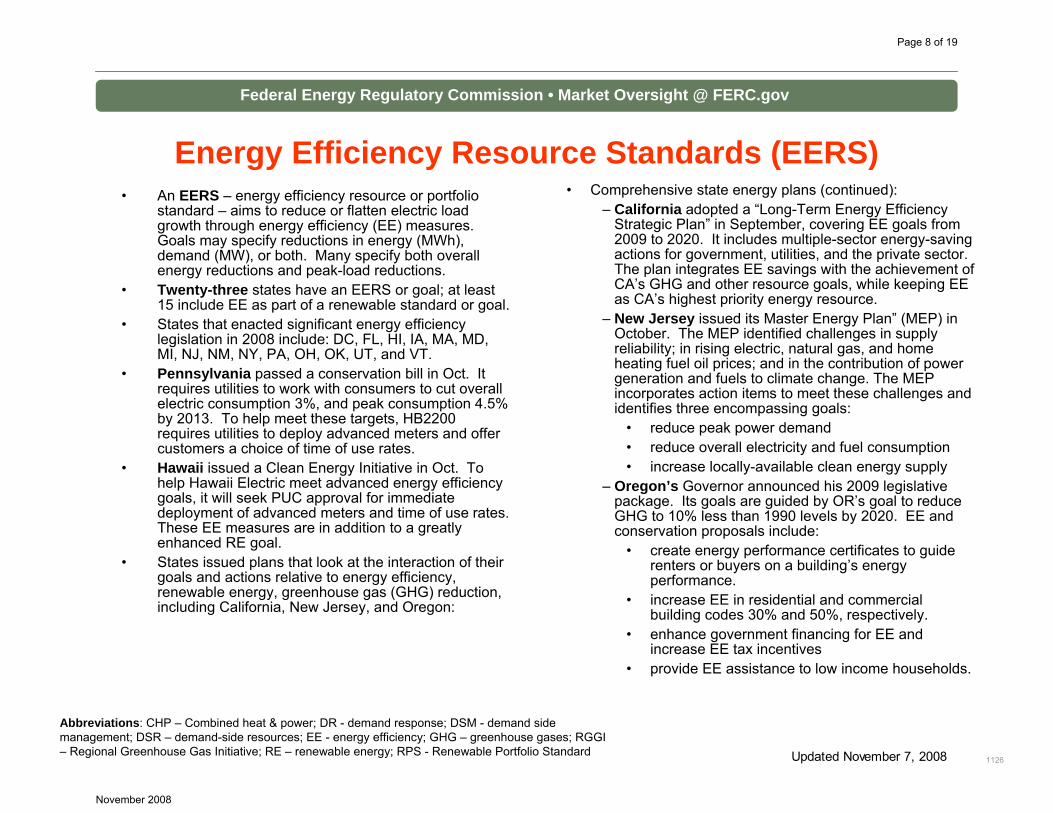
Energy Efficiency Resource Standards (EERS)• Comprehensive state energy plans (continued):
– California adopted a “Long-Term Energy Efficiency Strategic Plan” in September, covering EE goals from 2009 to 2020. It includes multiple-sector energy-saving actions for government, utilities, and the private sector. The plan integrates EE savings with the achievement of CA’s GHG and other resource goals, while keeping EE as CA’s highest priority energy resource.
– New Jersey issued its Master Energy Plan” (MEP) in October. The MEP identified challenges in supply reliability; in rising electric, natural gas, and home heating fuel oil prices; and in the contribution of power generation and fuels to climate change. The MEP incorporates action items to meet these challenges and identifies three encompassing goals:
• reduce peak power demand• reduce overall electricity and fuel consumption• increase locally-available clean energy supply
– Oregon’s Governor announced his 2009 legislative package. Its goals are guided by OR’s goal to reduce GHG to 10% less than 1990 levels by 2020. EE and conservation proposals include:
• create energy performance certificates to guide renters or buyers on a building’s energy performance.
• increase EE in residential and commercial building codes 30% and 50%, respectively.
• enhance government financing for EE and increase EE tax incentives
• provide EE assistance to low income households.
• An EERS – energy efficiency resource or portfolio standard – aims to reduce or flatten electric load growth through energy efficiency (EE) measures. Goals may specify reductions in energy (MWh), demand (MW), or both. Many specify both overall energy reductions and peak-load reductions.
• Twenty-three states have an EERS or goal; at least 15 include EE as part of a renewable standard or goal.
• States that enacted significant energy efficiency legislation in 2008 include: DC, FL, HI, IA, MA, MD, MI, NJ, NM, NY, PA, OH, OK, UT, and VT.
• Pennsylvania passed a conservation bill in Oct. It requires utilities to work with consumers to cut overall electric consumption 3%, and peak consumption 4.5% by 2013. To help meet these targets, HB2200 requires utilities to deploy advanced meters and offer customers a choice of time of use rates.
• Hawaii issued a Clean Energy Initiative in Oct. To help Hawaii Electric meet advanced energy efficiency goals, it will seek PUC approval for immediate deployment of advanced meters and time of use rates. These EE measures are in addition to a greatly enhanced RE goal.
• States issued plans that look at the interaction of their goals and actions relative to energy efficiency, renewable energy, greenhouse gas (GHG) reduction, including California, New Jersey, and Oregon:
1126Updated November 7, 2008
Abbreviations: CHP – Combined heat & power; DR - demand response; DSM - demand side management; DSR – demand-side resources; EE - energy efficiency; GHG – greenhouse gases; RGGI – Regional Greenhouse Gas Initiative; RE – renewable energy; RPS - Renewable Portfolio Standard
Page 8 of 19
November 2008
Federal Energy Regulatory Commission • Market Oversight @ FERC.gov
Collaborative Greenhouse Gas (GHG) Programs
Electric Market Overview: Greenhouse Gas Programs
1108
Notes: Kansas is a MGGRA participant and WCI observer. Ontario is a Partner to WCI and MGGRA Observer. Sources: Regional initiatives: www.rggi.org, www.midwesternaccord.org, www.westernclimateinitiative.org , trade press, Pew Center.
Updates at: http://www.ferc.gov/market-oversight/mkt-electric/overview/elec-ovr-ghg.pdf
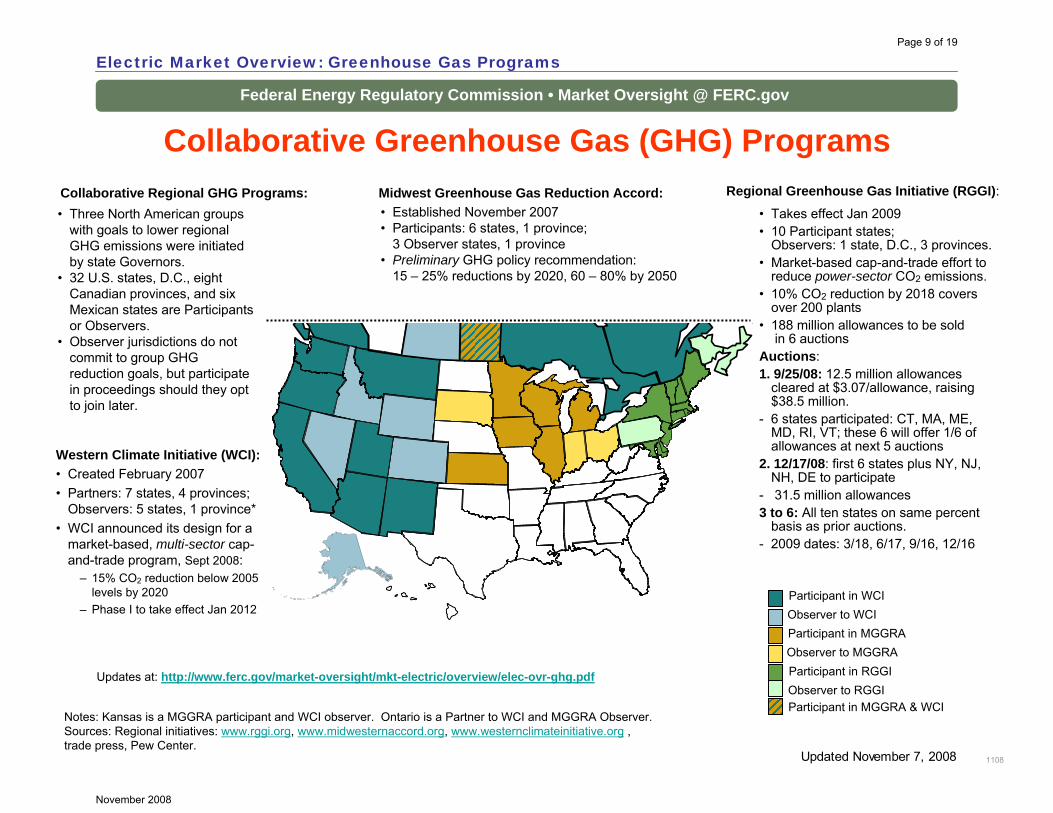
Western Climate Initiative (WCI):• Created February 2007 • Partners: 7 states, 4 provinces;
Observers: 5 states, 1 province*• WCI announced its design for a
market-based, multi-sector cap-and-trade program, Sept 2008:
– 15% CO2 reduction below 2005 levels by 2020
– Phase I to take effect Jan 2012
• Takes effect Jan 2009• 10 Participant states;
Observers: 1 state, D.C., 3 provinces.• Market-based cap-and-trade effort to
reduce power-sector CO2 emissions.• 10% CO2 reduction by 2018 covers
over 200 plants• 188 million allowances to be sold
in 6 auctionsAuctions:1. 9/25/08: 12.5 million allowances
cleared at $3.07/allowance, raising $38.5 million.
- 6 states participated: CT, MA, ME, MD, RI, VT; these 6 will offer 1/6 of allowances at next 5 auctions
2. 12/17/08: first 6 states plus NY, NJ, NH, DE to participate
- 31.5 million allowances3 to 6: All ten states on same percent
basis as prior auctions. - 2009 dates: 3/18, 6/17, 9/16, 12/16
Regional Greenhouse Gas Initiative (RGGI): Midwest Greenhouse Gas Reduction Accord:• Established November 2007• Participants: 6 states, 1 province;
3 Observer states, 1 province• Preliminary GHG policy recommendation:
15 – 25% reductions by 2020, 60 – 80% by 2050
Collaborative Regional GHG Programs:• Three North American groups
with goals to lower regional GHG emissions were initiated by state Governors.
• 32 U.S. states, D.C., eight Canadian provinces, and six Mexican states are Participants or Observers.
• Observer jurisdictions do not commit to group GHG reduction goals, but participate in proceedings should they opt to join later.
Updated November 7, 2008
Observer to WCIParticipant in WCI
Observer to MGGRAParticipant in MGGRA
Participant in RGGIObserver to RGGIParticipant in MGGRA & WCI
Page 9 of 19
November 2008
Federal Energy Regulatory Commission • Market Oversight @ FERC.gov
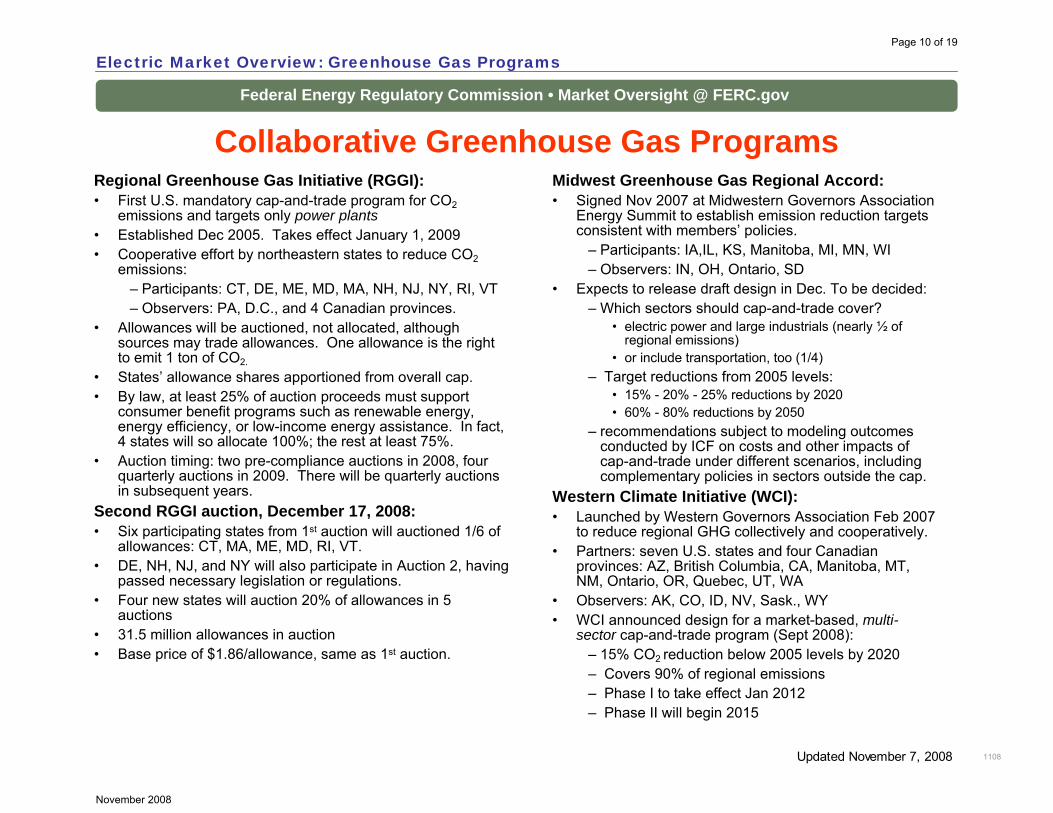
Regional Greenhouse Gas Initiative (RGGI):• First U.S. mandatory cap-and-trade program for CO2
emissions and targets only power plants• Established Dec 2005. Takes effect January 1, 2009• Cooperative effort by northeastern states to reduce CO2
emissions: – Participants: CT, DE, ME, MD, MA, NH, NJ, NY, RI, VT – Observers: PA, D.C., and 4 Canadian provinces.
• Allowances will be auctioned, not allocated, although sources may trade allowances. One allowance is the right to emit 1 ton of CO2.
• States’ allowance shares apportioned from overall cap. • By law, at least 25% of auction proceeds must support
consumer benefit programs such as renewable energy, energy efficiency, or low-income energy assistance. In fact, 4 states will so allocate 100%; the rest at least 75%.
• Auction timing: two pre-compliance auctions in 2008, four quarterly auctions in 2009. There will be quarterly auctions in subsequent years.
Second RGGI auction, December 17, 2008:• Six participating states from 1st auction will auctioned 1/6 of
allowances: CT, MA, ME, MD, RI, VT.• DE, NH, NJ, and NY will also participate in Auction 2, having
passed necessary legislation or regulations. • Four new states will auction 20% of allowances in 5
auctions• 31.5 million allowances in auction• Base price of $1.86/allowance, same as 1st auction.
Midwest Greenhouse Gas Regional Accord:• Signed Nov 2007 at Midwestern Governors Association
Energy Summit to establish emission reduction targets consistent with members’ policies.
– Participants: IA,IL, KS, Manitoba, MI, MN, WI– Observers: IN, OH, Ontario, SD
• Expects to release draft design in Dec. To be decided:– Which sectors should cap-and-trade cover?
• electric power and large industrials (nearly ½ of regional emissions)
• or include transportation, too (1/4)– Target reductions from 2005 levels:
• 15% - 20% - 25% reductions by 2020• 60% - 80% reductions by 2050
– recommendations subject to modeling outcomes conducted by ICF on costs and other impacts of cap-and-trade under different scenarios, including complementary policies in sectors outside the cap.
Western Climate Initiative (WCI):• Launched by Western Governors Association Feb 2007
to reduce regional GHG collectively and cooperatively.• Partners: seven U.S. states and four Canadian
provinces: AZ, British Columbia, CA, Manitoba, MT, NM, Ontario, OR, Quebec, UT, WA
• Observers: AK, CO, ID, NV, Sask., WY• WCI announced design for a market-based, multi-
sector cap-and-trade program (Sept 2008):– 15% CO2 reduction below 2005 levels by 2020– Covers 90% of regional emissions– Phase I to take effect Jan 2012– Phase II will begin 2015
Collaborative Greenhouse Gas Programs
Electric Market Overview: Greenhouse Gas Programs
1108Updated November 7, 2008
Page 10 of 19
November 2008

Federal Energy Regulatory Commission • Market Oversight @ FERC.gov
June-August Implied Heat Rates, 2008 vs. 2007
Source: Implied heat rates derived from Platts Megawatt Daily data.
Electric Market Overview: Summer Heat Rates
1206
Southern California Southern California (SP(SP--15)15)
10,193 Btu/kWh (10,193 Btu/kWh (--14%)14%)
Northwest (Mid C)Northwest (Mid C)6,850 Btu/kWh 6,850 Btu/kWh
((--32%)32%)
PJM Western HubPJM Western Hub9,845 Btu/kWh 9,845 Btu/kWh
((--12%)12%)
New York CityNew York City13,170 Btu/kWh (+1%)13,170 Btu/kWh (+1%)
Massachusetts HubMassachusetts Hub9,799 Btu/kWh (9,799 Btu/kWh (--4%)4%)
Midwest ISO (Cinergy)Midwest ISO (Cinergy)7,983 Btu/kWh (7,983 Btu/kWh (--22%)22%)
Palo VerdePalo Verde10,610 Btu/kWh (10,610 Btu/kWh (--17%)17%)
Updated September 9, 2008
Page 11 of 19
November 2008
Federal Energy Regulatory Commission • Market Oversight @ FERC.gov
WECC
RFCRFC
NPCC
SERC
MRO
FRCCERCOT
SPP
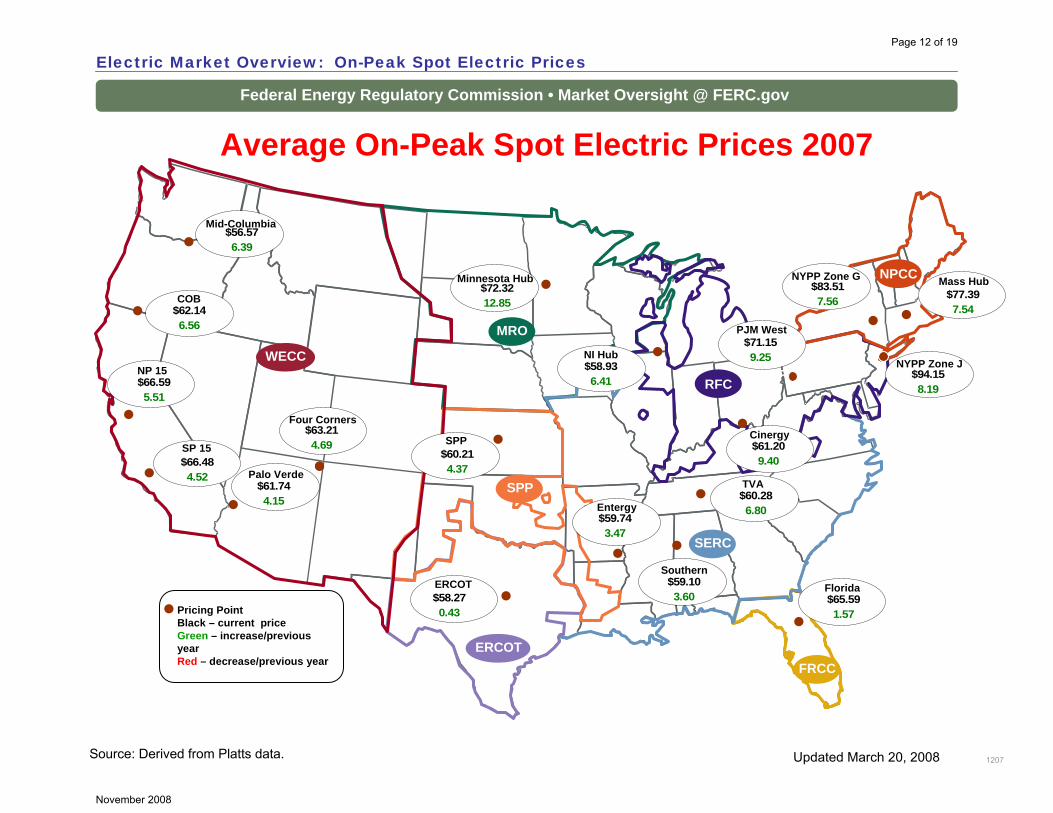
Pricing PointBlack – current priceGreen – increase/previous yearRed – decrease/previous year
NP 15
SP 15
Four Corners
Palo Verde
COB
Mid-Columbia
Minnesota Hub
SPP
ERCOT
Entergy
Florida
TVA
Cinergy
NI Hub
PJM West
NYPP Zone G Mass Hub
NYPP Zone J
MAIN
Average On-Peak Spot Electric Prices 2007
$56.576.39
$62.146.56
$66.595.51
$66.484.52
$61.744.15
$63.214.69
$58.270.43
$60.214.37
$58.936.41
$72.3212.85
$59.743.47
$65.591.57
$60.286.80
$61.209.40
$71.159.25
$94.158.19
$83.517.56 $77.39
7.54
Southern$59.103.60
Electric Market Overview: On-Peak Spot Electric Prices
1207Source: Derived from Platts data. Updated March 20, 2008
Page 12 of 19
November 2008
Federal Energy Regulatory Commission • Market Oversight @ FERC.gov
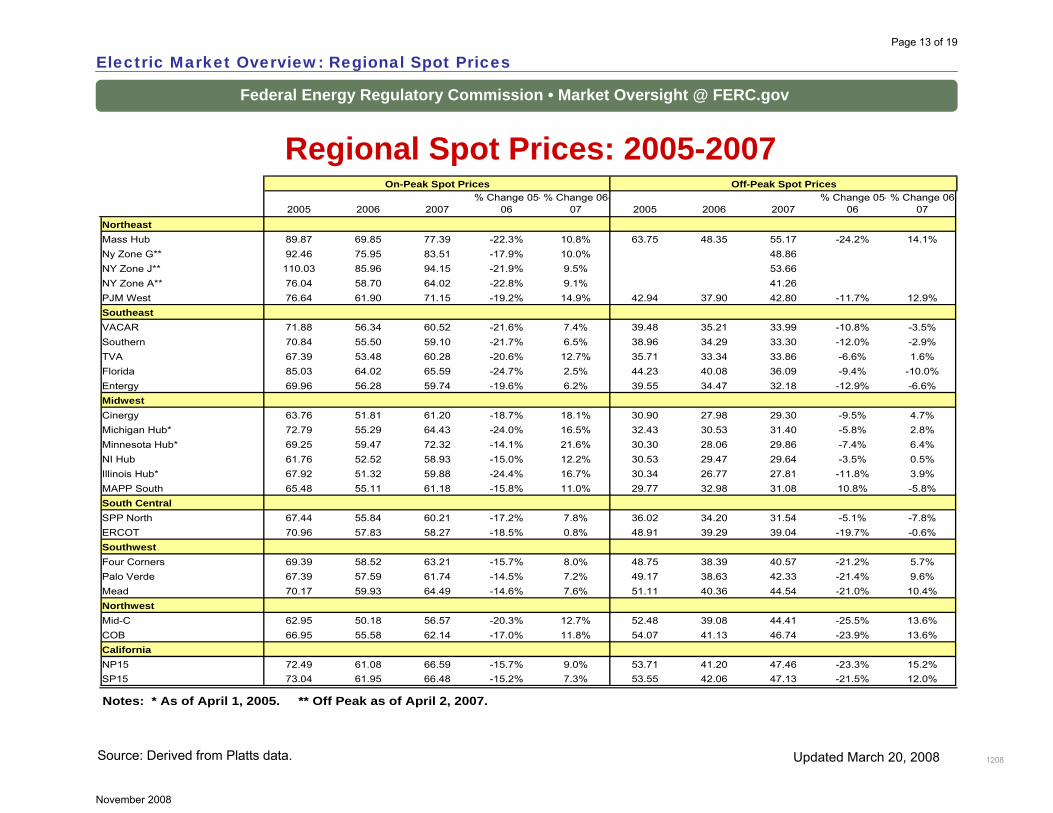
Regional Spot Prices: 2005-2007
Source: Derived from Platts data.
Electric Market Overview: Regional Spot Prices
1208
2005 2006 2007% Change 05-
06% Change 06-
07 2005 2006 2007% Change 05-
06% Change 06-
07NortheastMass Hub 89.87 69.85 77.39 -22.3% 10.8% 63.75 48.35 55.17 -24.2% 14.1%Ny Zone G** 92.46 75.95 83.51 -17.9% 10.0% 48.86NY Zone J** 110.03 85.96 94.15 -21.9% 9.5% 53.66NY Zone A** 76.04 58.70 64.02 -22.8% 9.1% 41.26PJM West 76.64 61.90 71.15 -19.2% 14.9% 42.94 37.90 42.80 -11.7% 12.9%SoutheastVACAR 71.88 56.34 60.52 -21.6% 7.4% 39.48 35.21 33.99 -10.8% -3.5%Southern 70.84 55.50 59.10 -21.7% 6.5% 38.96 34.29 33.30 -12.0% -2.9%TVA 67.39 53.48 60.28 -20.6% 12.7% 35.71 33.34 33.86 -6.6% 1.6%Florida 85.03 64.02 65.59 -24.7% 2.5% 44.23 40.08 36.09 -9.4% -10.0%Entergy 69.96 56.28 59.74 -19.6% 6.2% 39.55 34.47 32.18 -12.9% -6.6%MidwestCinergy 63.76 51.81 61.20 -18.7% 18.1% 30.90 27.98 29.30 -9.5% 4.7%Michigan Hub* 72.79 55.29 64.43 -24.0% 16.5% 32.43 30.53 31.40 -5.8% 2.8%Minnesota Hub* 69.25 59.47 72.32 -14.1% 21.6% 30.30 28.06 29.86 -7.4% 6.4%NI Hub 61.76 52.52 58.93 -15.0% 12.2% 30.53 29.47 29.64 -3.5% 0.5%Illinois Hub* 67.92 51.32 59.88 -24.4% 16.7% 30.34 26.77 27.81 -11.8% 3.9%MAPP South 65.48 55.11 61.18 -15.8% 11.0% 29.77 32.98 31.08 10.8% -5.8%South CentralSPP North 67.44 55.84 60.21 -17.2% 7.8% 36.02 34.20 31.54 -5.1% -7.8%ERCOT 70.96 57.83 58.27 -18.5% 0.8% 48.91 39.29 39.04 -19.7% -0.6%SouthwestFour Corners 69.39 58.52 63.21 -15.7% 8.0% 48.75 38.39 40.57 -21.2% 5.7%Palo Verde 67.39 57.59 61.74 -14.5% 7.2% 49.17 38.63 42.33 -21.4% 9.6%Mead 70.17 59.93 64.49 -14.6% 7.6% 51.11 40.36 44.54 -21.0% 10.4%NorthwestMid-C 62.95 50.18 56.57 -20.3% 12.7% 52.48 39.08 44.41 -25.5% 13.6%COB 66.95 55.58 62.14 -17.0% 11.8% 54.07 41.13 46.74 -23.9% 13.6%CaliforniaNP15 72.49 61.08 66.59 -15.7% 9.0% 53.71 41.20 47.46 -23.3% 15.2%SP15 73.04 61.95 66.48 -15.2% 7.3% 53.55 42.06 47.13 -21.5% 12.0%
Notes: * As of April 1, 2005. ** Off Peak as of April 2, 2007.
On-Peak Spot Prices Off-Peak Spot Prices
Updated March 20, 2008
Page 13 of 19
November 2008
Federal Energy Regulatory Commission • Market Oversight @ FERC.gov
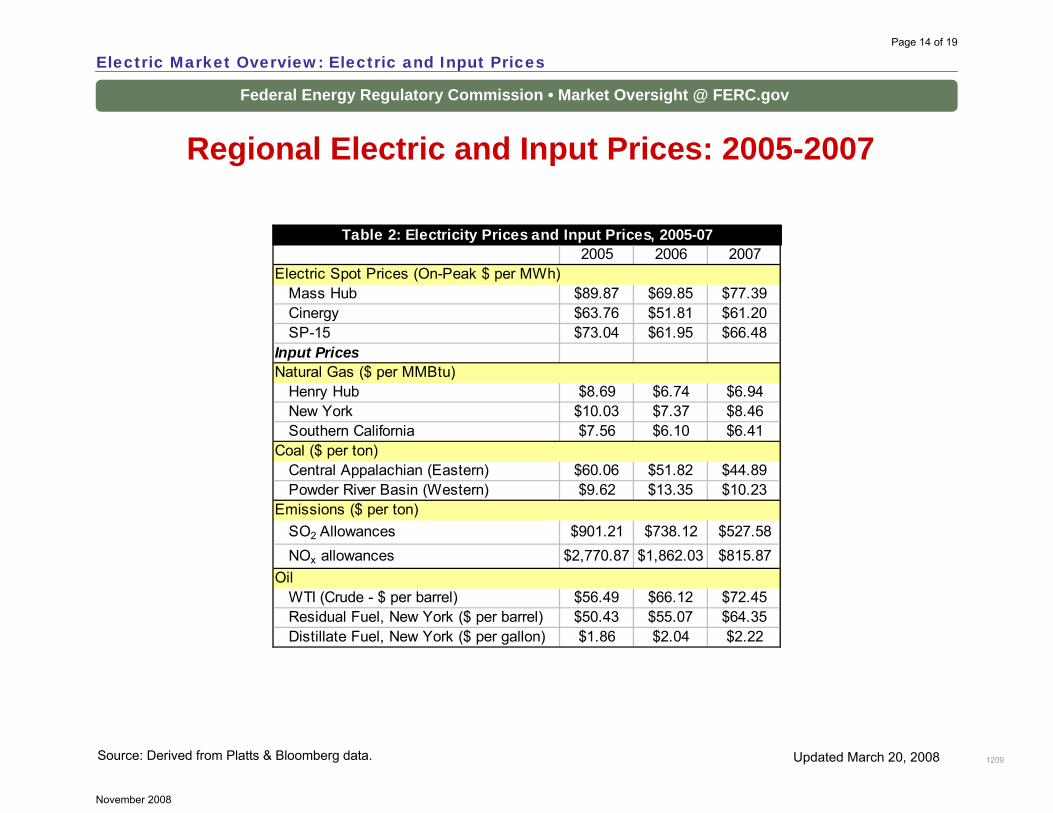
Regional Electric and Input Prices: 2005-2007
Source: Derived from Platts & Bloomberg data.
Electric Market Overview: Electric and Input Prices
1209
2005 2006 2007Electric Spot Prices (On-Peak $ per MWh)
Mass Hub $89.87 $69.85 $77.39Cinergy $63.76 $51.81 $61.20SP-15 $73.04 $61.95 $66.48
Input PricesNatural Gas ($ per MMBtu)
Henry Hub $8.69 $6.74 $6.94New York $10.03 $7.37 $8.46Southern California $7.56 $6.10 $6.41
Coal ($ per ton)Central Appalachian (Eastern) $60.06 $51.82 $44.89Powder River Basin (Western) $9.62 $13.35 $10.23
Emissions ($ per ton)SO2 Allowances $901.21 $738.12 $527.58NOx allowances $2,770.87 $1,862.03 $815.87
Oil WTI (Crude - $ per barrel) $56.49 $66.12 $72.45Residual Fuel, New York ($ per barrel) $50.43 $55.07 $64.35Distillate Fuel, New York ($ per gallon) $1.86 $2.04 $2.22
Table 2: Electricity Prices and Input Prices, 2005-07
Updated March 20, 2008
Page 14 of 19
November 2008
Federal Energy Regulatory Commission • Market Oversight @ FERC.gov
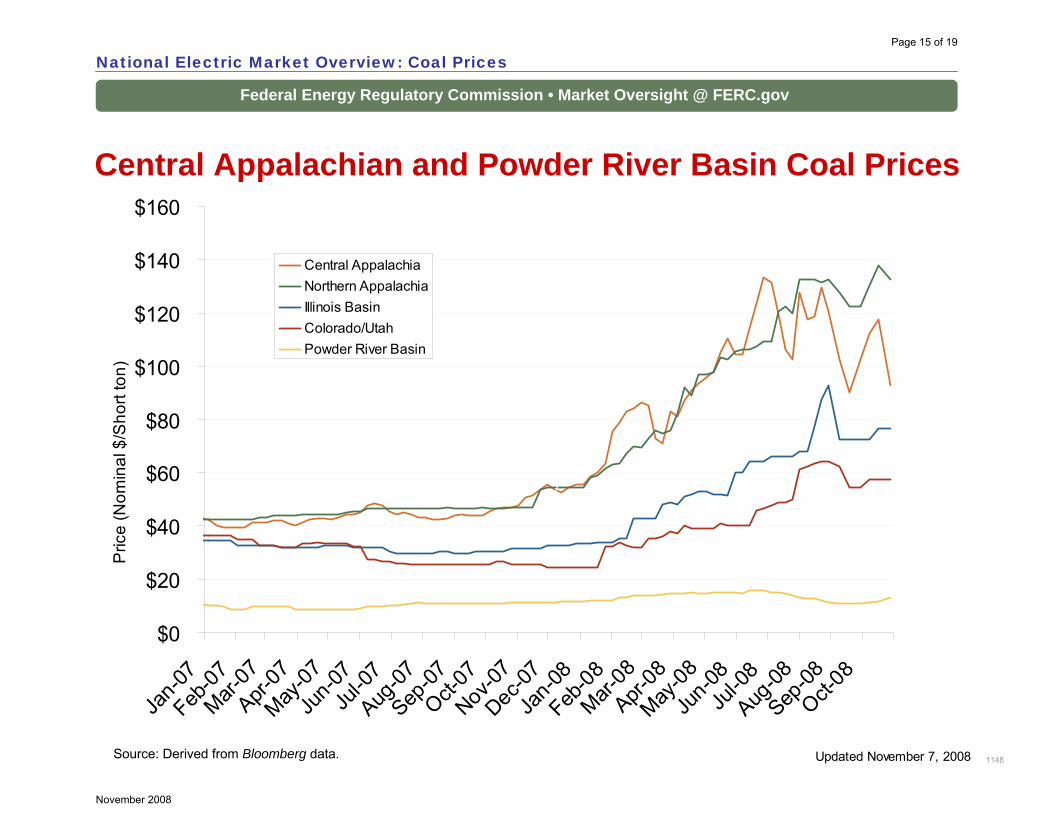
Central Appalachian and Powder River Basin Coal Prices
Source: Derived from Bloomberg data.
National Electric Market Overview: Coal Prices
1148Updated November 7, 2008
$0
$20
$40
$60
$80
$100
$120
$140
$160
Jan-0
7Feb
-07Mar-
07Apr-
07May
-07Ju
n-07
Jul-0
7Aug
-07Sep
-07Oct-
07Nov
-07Dec
-07Ja
n-08
Feb-08
Mar-08
Apr-08
May-08
Jun-0
8Ju
l-08
Aug-08
Sep-08
Oct-08
Central AppalachiaNorthern AppalachiaIllinois BasinColorado/UtahPowder River Basin
Pric
e (N
omin
al $
/Sho
rt to
n)
Page 15 of 19
November 2008
Federal Energy Regulatory Commission • Market Oversight @ FERC.gov
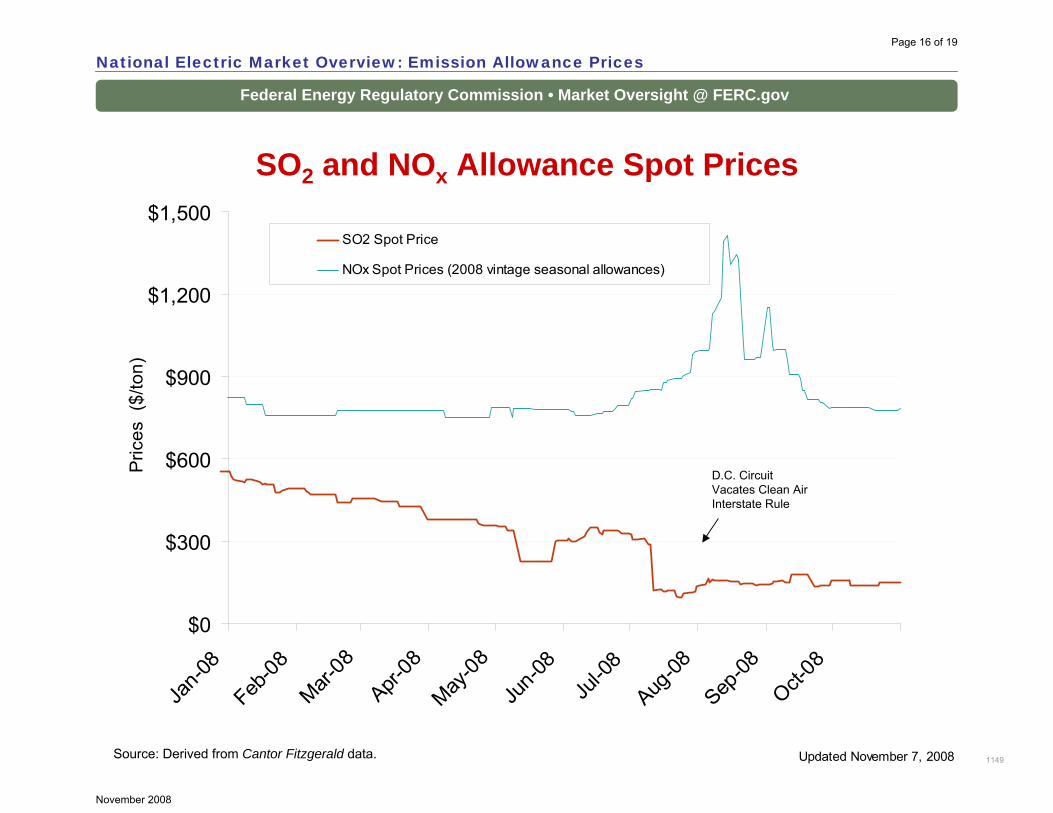
SO2 and NOx Allowance Spot Prices
Source: Derived from Cantor Fitzgerald data.
National Electric Market Overview: Emission Allowance Prices
1149
$0
$300
$600
$900
$1,200
$1,500
Jan-0
8Feb
-08Mar-
08Apr-
08May
-08Ju
n-08
Jul-0
8Aug
-08Sep
-08Oct-
08SO2 Spot Price
NOx Spot Prices (2008 vintage seasonal allowances)
Pric
es (
$/to
n)
D.C. Circuit Vacates Clean Air Interstate Rule
Updated November 7, 2008
Page 16 of 19
November 2008
Federal Energy Regulatory Commission • Market Oversight @ FERC.gov
National Electric Market Overview: Emission Allowance Prices
1149
Brief Overview of the SO2 and NOx Emissions Markets
The electric power industry is a major source of sulfur dioxide emissions (SO2) and nitrogen dioxide emissions (NOx) emissions –both precursors of acid rain and smog. According to the Environmental Protection Agency’s (EPA) 2006 Acid Rain Progress Report, the power sector is responsible for 70% of SO2 emissions and 20% of NOx emissions.
Reduction in SO2 and NOx emissions can be obtained through a cap-and-trade program, which is a market-based compliance option that also provides an emitting source with relative flexibility in compliance options. These options include pollution control technology such as flue gas desulfurization (FGD) for SO2 and selective catalytic reduction (SCR) for NOx (i.e., scrubbers), fuel switching, and/or participating in their respective cap-and-trade markets. Compliance measures can be capital-intensive and the decision to use pollution controls and/or emission allowances is primarily driven by the regulatory environment, fuel input type and the level of emission output by emitting sources. The associated costs with this decision contribute to the price of wholesale power and ultimately, the retail price.
The Acid Rain Program http://www.epa.gov/airmarkets/progsregs/arp/index.htmlEPA’s Acid Rain Program (ARP), established under the 1990 Clean Air Act Amendments, required reductions of SO2 and NOxemissions from the electric power industry. The Acid Rain Program was the first cap and trade program implemented nationwide toreduce SO2 emissions. The SO2 program set a permanent cap on the total amount of SO2 that can be emitted by fossil fuel-fired generating units and allows allowance trading so affected sources have some flexibility in their compliance method. Currently, SO2 sources must surrender one allowance to emit one ton of SO2. If a source falls short on the number of allowances it needs to comply with its individual cap, it can purchase allowances from another source that has a surplus of allowances. An emitting source may have a surplus of allowances for several reasons. For example, if it chose to install and/or run scrubbers then it can “bank”those unused allowances for future use or sell the leftover allowances to other emitting sources.
The NOx Budget Trading Program http://www.epa.gov/airmarkets/cap-trade/docs/nox.pdfIn 2003, the cap-and-trade method was also implemented to reduce seasonal (primarily summer) NOx emissions from fossil fuel-fired plants. While the EPA administers the program, states are required to share the responsibility for allowance allocation and enforcement. Currently, NOx sources must surrender one allowance to emit one ton of NOx.
Updated October 14, 2008
[1] The Acid Rain Program also required NOx emission reductions by select coal units but under a rate-based regulatory program [http://www.epa.gov/airmarkets/progsregs/arp/nox.html].
Source – EPA
Page 17 of 19
November 2008
Federal Energy Regulatory Commission • Market Oversight @ FERC.gov
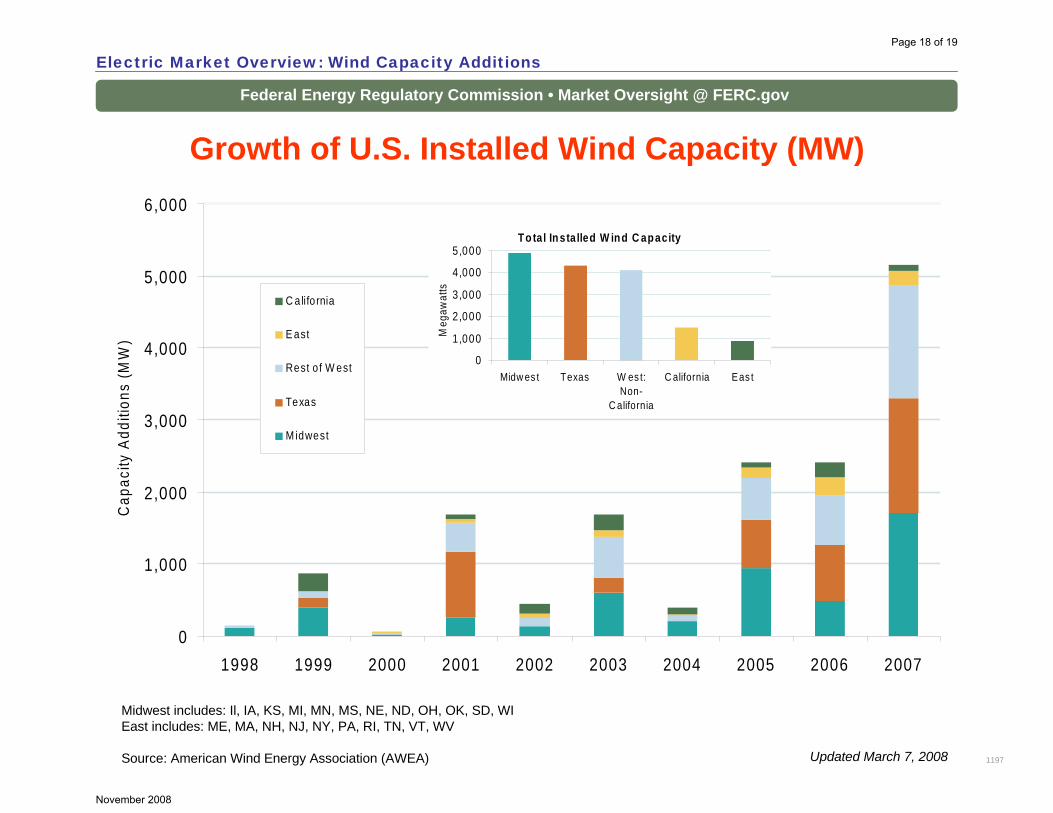
Growth of U.S. Installed Wind Capacity (MW)
Electric Market Overview: Wind Capacity Additions
1197Updated March 7, 2008
Midwest includes: Il, IA, KS, MI, MN, MS, NE, ND, OH, OK, SD, WIEast includes: ME, MA, NH, NJ, NY, PA, RI, TN, VT, WV
Source: American Wind Energy Association (AWEA)
0
1,000
2,000
3,000
4,000
5,000
6,000
1998 1999 2000 2001 2002 2003 2004 2005 2006 2007
Cap
acity
Add
ition
s (M
W)
C a lifo rnia
E ast
Rest o f W est
Texas
M idwest
To tal In sta lled W ind C apacity
0
1,000
2,000
3,000
4,000
5,000
Midw es t Texas W es t:Non-
C alifornia
C alifornia Eas t
Meg
awat
ts
Page 18 of 19
November 2008
Federal Energy Regulatory Commission • Market Oversight @ FERC.gov
2007 Review of Wind Generation
Electric Market Overview: Wind Capacity Additions
• Installed wind capacity grew 5,244 MW from 11,603 MW in 2006 to 16,818 MW in 2007, a 45% increase.
• More new wind capacity was added in 2007 than any prior year:.
• Just over half of new capacity – 2,704 MW –was installed in states with the highest wind potential. 59 percent of that – 1,588 MW –was in Texas.
• Installed capacity grew 150% from 2004 to 2007, while:
– the number of states (including D.C.) with a renewable portfolio standard grew from 21 to 27, and
– the wind production tax credit did not lapse.
• The top five states by capacity added in 2007 were: Texas (1,618 MW), Colorado (776), Illinois (592), Oregon (447), and Minnesota (405). Texas moved into 1st place in installed wind capacity in 2006, passing long-time leader California.
• The top 10 states by cumulative installed capacity have 14,366 MW of wind, or 85% of U.S. capacity. Nine of them had a Renewable Portfolio Standard (RPS) in 2007.
• The rapid growth of wind generating capacity has led to a backlog in many interconnection queues. The Commission held a Technical Conference on December 11, 2007 (AD08-2-000) to re-examine the Large Generator Interconnection Rule. Many ISO/RTOs reported that the queuing procedures specified by Order 2003 impede the timely interconnection of wind resources.
3022Updated March 7, 2008
Page 19 of 19
November 2008