electric power generation, transmission, and … power generation, transmission, and distribution:...
TRANSCRIPT

Electric Power Generation,Transmission, andDistribution: 2002
2002 Economic Census
Utilities
Industry Series
Issued December 2004
EC02-22I-03
U.S. Department of CommerceEconomics and Statistics Administration
U.S. CENSUS BUREAU

This report was prepared in the Service Sector Statistics Division under the direction of Bobby E.Russell, Assistant Division Chief for Census Programs. Planning, management, and coordination of thisreport were under the supervision of Steven M. Roman, Chief, Utilities and Financial Census Branch,assisted by Steven L. Barron, Amy R. Houtz, Faye A. Jacobs, Pamela J. Palmer, Maria A.Poschinger, and Vannah L. Beatty. Primary staff assistance was provided by Diane M. Carodiskey,Sandra K. Creech, Andrew N. Lampton, Douglas A. Smyly, and Erick G. Wicks.
Mathematical and statistical techniques, as well as the coverage operations were provided by Ruth E.Detlefsen, Assistant Division Chief for Research and Methodology, assisted by Scot A. Dahl, Leader,Census/Current Integration Group, with staff assistance from Samson A. Adeshiyan and Anthony G.Tersine Jr.
Eddie J. Salyers, Assistant Division Chief of Economic Planning and Coordination Division, wasresponsible for overseeing the editing and tabulation procedures and the interactive analytical software.Dennis Shoemaker and Kim Wortman, Special Assistants, John D. Ward, Chief, Analytical Branch,and Brandy L. Yarbrough, Chief, Edit Branch, were responsible for developing the systems andprocedures for data collection, editing, review, and correction. Donna L. Hambric, Chief of theEconomic Planning Staff, was responsible for overseeing the systems and information for dissemination.Douglas J. Miller, Chief, Tables and Dissemination Branch, assisted by Lisa Aispuro, Jamie Fleming,Keith Fuller, Andrew W. Hait, and Kathy G. Padgett were responsible for developing the datadissemination systems and procedures. The Geography Division staff, Robert LaMacchia, Chief,developed geographic coding procedures and associated computer programs.
The Economic Statistical Methods and Programming Division, Howard R. Hogan, Chief, developed andcoordinated the computer processing systems. Barry F. Sessamen, Assistant Division Chief for PostCollection, was responsible for design and implementation of the processing systems and computerprograms. Gary T. Sheridan, Chief, Macro Analytical Branch, assisted by Apparao V. Katikineni andEdward F. Johnson provided computer programming and implementation.
The Systems Support Division provided the table composition system. Robert Joseph Brown, TableImage Processing System (TIPS) Senior Software Engineer, was responsible for the design anddevelopment of the TIPS, under the supervision of Robert J. Bateman, Assistant Division Chief,Information Systems.
The staff of the National Processing Center performed mailout preparation and receipt operations,clerical and analytical review activities, and data entry.
Margaret A. Smith, Bernadette J. Beasley, Michael T. Browne, and Alan R. Plisch of theAdministrative and Customer Services Division, Walter C. Odom, Chief, provided publication andprinting management, graphics design and composition, and editorial review for print and electronicmedia. General direction and production management were provided by James R. Clark, AssistantDivision Chief, and Susan L. Rappa, Chief, Publications Services Branch.
Special acknowledgment is also due the many businesses whose cooperation contributed to thepublication of these data.
ACKNOWLEDGMENTS
Electric Power Generation,Transmission, andDistribution: 2002
2002 Economic Census
Utilities
Industry Series
Issued December 2004
EC02-22I-03
U.S. Department of CommerceDonald L. Evans,
SecretaryTheodore W. Kassinger,
Deputy Secretary
Economics and Statistics AdministrationKathleen B. Cooper,
Under Secretary forEconomic Affairs
U.S. CENSUS BUREAUCharles Louis Kincannon,
Director

Vacant,Principal AssociateDirector for Programs
Frederick T. Knickerbocker,Associate Directorfor Economic Programs
Thomas L. Mesenbourg,Assistant Directorfor Economic Programs
Mark E. Wallace,Chief, Service SectorStatistics Division
ECONOMICS
AND STATISTICS
ADMINISTRATION
Economicsand StatisticsAdministration
Kathleen B. Cooper,Under Secretaryfor Economic Affairs
U.S. CENSUS BUREAU
Charles Louis Kincannon,Director
Hermann Habermann,Deputy Director andChief Operating Officer

CONTENTS
Introduction to the Economic Census v�����������������������������
Utilities ix�������������������������������������������������������
Tables
1. Summary Statistics for the United States: 2002 1��������������
2. Comparative Statistics for the United States(1997 NAICS Basis): 2002 and 1997 2����������������������
3. Product Lines by Kind of Business for the United States: 2002 3�
4. Concentration by Largest Firms for the United States: 2002 5���
Appendixes
A. Explanation of Terms A–1�������������������������������������
B. NAICS Codes, Titles, and Descriptions B–1����������������������
C. Methodology C–1���������������������������������������������
D. Geographic Notes ������������������������������������������
E. Metropolitan and Micropolitan Statistical Areas �����������������
�� Not applicable for this report.
Utilities�Industry Series Electric Power Generation, Transmission, & Distribution iiiU.S. Census Bureau, 2002 Economic Census
Introduction to the Economic Census
PURPOSES AND USES OF THE ECONOMIC CENSUS
The economic census is the major source of facts about the structure and functioning of thenation’s economy. It provides essential information for government, business, industry, and thegeneral public. Title 13 of the United States Code (Sections 131, 191, and 224) directs the CensusBureau to take the economic census every 5 years, covering years ending in “2” and “7.”
The economic census furnishes an important part of the framework for such composite measuresas the gross domestic product estimates, input/output measures, production and price indexes,and other statistical series that measure short-term changes in economic conditions. Specific usesof economic census data include the following:
• Policymaking agencies of the federal government use the data to monitor economic activity andto assess the effectiveness of policies.
• State and local governments use the data to assess business activities and tax bases withintheir jurisdictions and to develop programs to attract business.
• Trade associations study trends in their own and competing industries, which allows them tokeep their members informed of market changes.
• Individual businesses use the data to locate potential markets and to analyze their own produc-tion and sales performance relative to industry or area averages.
INDUSTRY CLASSIFICATIONS
Data from the 2002 Economic Census are published primarily according to the 2002 North Ameri-can Industry Classification System (NAICS). NAICS was first adopted in the United States, Canada,and Mexico in 1997. The 2002 Economic Census covers the following NAICS sectors:
21 Mining22 Utilities23 Construction31-33 Manufacturing42 Wholesale Trade44-45 Retail Trade48-49 Transportation and Warehousing51 Information52 Finance and Insurance53 Real Estate and Rental and Leasing54 Professional, Scientific, and Technical Services55 Management of Companies and Enterprises56 Administrative and Support and Waste Management and Remediation Services61 Educational Services62 Health Care and Social Assistance71 Arts, Entertainment, and Recreation72 Accommodation and Food Services81 Other Services (except Public Administration)
(Not listed above are the Agriculture, Forestry, Fishing, and Hunting sector (NAICS 11), partiallycovered by the census of agriculture conducted by the U.S. Department of Agriculture, and thePublic Administration sector (NAICS 92), largely covered by the census of governments conductedby the Census Bureau.)
The 20 NAICS sectors are subdivided into 100 subsectors (three-digit codes), 317 industry groups(four-digit codes), and, as implemented in the United States, 1,179 industries (six-digit codes).
Introduction v2002 Economic Census
U.S. Census Bureau, 2002 Economic Census
RELATIONSHIP TO HISTORICAL INDUSTRY CLASSIFICATIONS
Prior to the 1997 Economic Census, data were published according to the Standard Industrial Clas-sification (SIC) system. While many of the individual NAICS industries correspond directly to indus-tries as defined under the SIC system, most of the higher level groupings do not. Particular careshould be taken in comparing data for retail trade, wholesale trade, and manufacturing, which aresector titles used in both NAICS and SIC, but cover somewhat different groups of industries. The1997 Economic Census Bridge Between NAICS and SIC demonstrates the relationships betweenNAICS and SIC industries. Where changes are significant, it may not be possible to construct timeseries that include data for points both before and after 1997.
Most industry classifications remained unchanged between 1997 and 2002, but NAICS 2002includes substantial revisions within the construction and wholesale trade sectors, and a numberof revisions for the retail trade and information sectors. These changes are noted in industry defi-nitions and will be demonstrated in the Bridge Between NAICS 2002 and NAICS 1997.
For 2002, data for enterprise support establishments (those functioning primarily to support theactivities of their company’s operating establishments, such as a warehouse or a research anddevelopment laboratory) are included in the industry that reflects their activities (such as ware-housing). For 1997, such establishments were termed auxiliaries and were excluded from industrytotals.
BASIS OF REPORTING
The economic census is conducted on an establishment basis. A company operating at more thanone location is required to file a separate report for each store, factory, shop, or other location.Each establishment is assigned a separate industry classification based on its primary activity andnot that of its parent company. (For selected industries, only payroll, employment, and classifica-tion are collected for individual establishments, while other data are collected on a consolidatedbasis.)
GEOGRAPHIC AREA CODING
Accurate and complete information on the physical location of each establishment is required totabulate the census data for states, metropolitan and micropolitan statistical areas, counties, andcorporate municipalities (places) including cities, towns, townships, villages, and boroughs.Respondents were required to report their physical location (street address, municipality, county,and state) if it differed from their mailing address. For establishments not surveyed by mail (andthose single-establishment companies that did not provide acceptable information on physicallocation), location information from administrative sources is used as a basis for coding.
AVAILABILITY OF ADDITIONAL DATA
All results of the 2002 Economic Census are available on the Census Bureau Internet site(www.census.gov) and on digital versatile discs (DVD-ROMs) for sale by the Census Bureau. TheAmerican FactFinder system at the Internet site allows selective retrieval and downloading of thedata. For more information, including a description of reports being issued, see the Internet site,write to the U.S. Census Bureau, Washington, DC 20233-6100, or call Customer Services at 301-763-4100.
HISTORICAL INFORMATION
The economic census has been taken as an integrated program at 5-year intervals since 1967 andbefore that for 1954, 1958, and 1963. Prior to that time, individual components of the economiccensus were taken separately at varying intervals.
The economic census traces its beginnings to the 1810 Decennial Census, when questions onmanufacturing were included with those for population. Coverage of economic activities wasexpanded for the 1840 Decennial Census and subsequent censuses to include mining and somecommercial activities. The 1905 Manufactures Census was the first time a census was taken apart
vi Introduction 2002 Economic Census
U.S. Census Bureau, 2002 Economic Census

from the regular decennial population census. Censuses covering retail and wholesale trade andconstruction industries were added in 1930, as were some service trades in 1933. Censuses ofconstruction, manufacturing, and the other business censuses were suspended during World WarII.
The 1954 Economic Census was the first census to be fully integrated, providing comparable cen-sus data across economic sectors and using consistent time periods, concepts, definitions, classi-fications, and reporting units. It was the first census to be taken by mail, using lists of firms pro-vided by the administrative records of other federal agencies. Since 1963, administrative recordsalso have been used to provide basic statistics for very small firms, reducing or eliminating theneed to send them census report forms.
The range of industries covered in the economic census expanded between 1967 and 2002. Thecensus of construction industries began on a regular basis in 1967, and the scope of serviceindustries, introduced in 1933, was broadened in 1967, 1977, and 1987. While a few transporta-tion industries were covered as early as 1963, it was not until 1992 that the census broadened toinclude all of transportation, communications, and utilities. Also new for 1992 was coverage offinancial, insurance, and real estate industries. With these additions, the economic census and theseparate census of governments and census of agriculture collectively covered roughly 98 percentof all economic activity. New for 2002 is coverage of four industries classified in the agriculture,forestry, and fishing sector under the SIC system: landscape architectural services, landscapingservices, veterinary services, and pet care services.
Printed statistical reports from the 1992 and earlier censuses provide historical figures for thestudy of long-term time series and are available in some large libraries. Reports for 1997 werepublished primarily on the Internet and copies of 1992 reports are also available there. CD-ROMsissued from the 1987, 1992, and 1997 Economic Censuses contain databases that include all ornearly all data published in print, plus additional statistics, such as ZIP Code statistics, publishedonly on CD-ROM.
SOURCES FOR MORE INFORMATION
More information about the scope, coverage, classification system, data items, and publicationsfor the 2002 Economic Census and related surveys is published in the Guide to the 2002 EconomicCensus at www.census.gov/econ/census02/guide. More information on the methodology, proce-dures, and history of the census will be published in the History of the 2002 Economic Census atwww.census.gov/econ/www/history.html.
Introduction vii2002 Economic Census
U.S. Census Bureau, 2002 Economic Census

This page is intentionally blank.
viii Introduction 2002 Economic Census
U.S. Census Bureau, 2002 Economic Census
Utilities
SCOPE
The Utilities sector (sector 22) comprises establishments engaged in the provision of the followingutility services: electric power, natural gas, steam supply, water supply, and sewage removal.Within this sector, the specific activities associated with the utility services provided vary by util-ity: electric power includes generation, transmission, and distribution; natural gas includes distri-bution; steam supply includes provision and/or distribution; water supply includes treatment anddistribution; and sewage removal includes collection, treatment, and disposal of waste throughsewer systems and sewage treatment facilities.
Among electric, gas, and water utilities, many locations with activities that might in other indus-tries be considered as support or auxiliary activities (such as headquarters operations), areincluded in this report as operating locations.
Exclusions. Establishments primarily engaged in waste management services are not included inthis sector. These establishments are classified in Subsector 562, Waste Management and Reme-diation Services. These establishments also collect, treat, and dispose of waste materials; how-ever, they do not use sewer systems or sewage treatment facilities.
The reports described below exclude establishments of firms with no paid employees. These“nonemployers,” typically self-employed individuals or partnerships operating businesses thatthey have not chosen to incorporate, are reported separately in Nonemployer Statistics. The con-tribution of nonemployers, relatively small for this sector, may be examined atwww.census.gov/nonemployerimpact.
Definitions. Industry categories are defined in Appendix B, NAICS Codes, Titles, and Descrip-tions. Other terms are defined in Appendix A, Explanation of Terms.
REPORTS
The following reports provide statistics on this sector.
Industry Series. There are three reports, each covering a group of related industries. The reportspresent, by kind of business for the United States, general statistics for establishments of firmswith payroll on number of establishments, revenue, payroll, and employment; comparative statis-tics for 2002 and 1997; product lines; and concentration of business activity in the largest firms.The data in industry reports are preliminary and subject to change in the following reports.
Geographic Area Series. There is a separate report for each state, the District of Columbia, andthe United States. Each state report presents, for establishments of firms with payroll, general sta-tistics on number of establishments, revenue, payroll, and employment by kind of business forthe state and metropolitan and micropolitan statistical areas. Greater kind-of-business detail isshown for larger areas. The United States report presents data for the United States as a whole fordetailed kind-of-business classifications.
Subject Series:
• Product Lines. This report presents product lines data for establishments of firms with payrollby kind of business. Data are presented for the United States only.
• Establishment and Firm Size (Including Legal Form of Organization). This report pre-sents revenue, payroll, and employment data for the United States by revenue size, by employ-ment size, and by legal form of organization for establishments of firms with payroll; and byrevenue size (including concentration by largest firms), by employment size, and by number ofestablishments operated (single units and multiunits) for firms with payroll.
Utilities ix2002 Economic Census
U.S. Census Bureau, 2002 Economic Census

• Miscellaneous Subjects. This report presents data for a variety of industry-specific topics forestablishments of firms with payroll. Presentation of data varies by kind of business.
Other reports. Data for this sector are also included in reports with multisector coverage, includ-ing Nonemployer Statistics, Comparative Statistics, Bridge Between 2002 NAICS and 1997 NAICS,Business Expenses, and the Survey of Business Owners reports.
GEOGRAPHIC AREAS COVERED
The level of geographic detail varies by report. Maps are available atwww.census.gov/econ2002maps. Notes specific to areas in the state are included in Appendix D,Geographic Notes. Data may be presented for –
1. The United States as a whole.
2. States and the District of Columbia.
3. Metropolitan and micropolitan statistical areas. A core based statistical area (CBSA) contains acore area with a substantial population nucleus, together with adjacent communities having ahigh degree of social and economic integration with that core. CBSAs are differentiated intometropolitan and micropolitan statistical areas based on size criteria. Both metropolitan andmicropolitan statistical areas are defined in terms of entire counties, and are listed in Appen-dix E, Metropolitan and Micropolitan Statistical Areas.
a. Metropolitan Statistical Areas (metro areas). Metro areas have at least one urbanized area of50,000 or more population, plus adjacent territory that has a high degree of social and eco-nomic integration with the core as measured by commuting ties.
b. Micropolitan Statistical Areas (micro areas). Micro areas have at least one urban cluster ofat least 10,000 but less than 50,000 population, plus adjacent territory that has a highdegree of social and economic integration with the core as measured by commuting ties.
c. Metropolitan Divisions (metro divisions). If specified criteria are met, a metro area contain-ing a single core with a population of 2.5 million or more may be subdivided to formsmaller groupings of counties referred to as Metropolitan Divisions.
d. Combined Statistical Areas (combined areas). If specified criteria are met, adjacent metroand micro areas, in various combinations, may become the components of a new set ofareas called Combined Statistical Areas. The areas that combine retain their own designa-tions as metro or micro areas within the larger combined area.
DOLLAR VALUES
All dollar values presented are expressed in current dollars; i.e., 2002 data are expressed in 2002dollars, and 1997 data, in 1997 dollars. Consequently, when making comparisons with prioryears, users of the data should consider the changes in prices that have occurred.
All dollar values are shown in thousands of dollars.
COMPARABILITY OF THE 1997 AND 2002 ECONOMIC CENSUSES
Both the 2002 Economic Census and the 1997 Economic Census present data based on the NorthAmerican Industry Classification System (NAICS). While there were revisions to some industries for2002, none of those affect this sector.
Among electric, gas, and water utilities, many locations with activities that might in other indus-tries be considered as support or auxiliary activities (such as headquarters operations), areincluded in this report as operating locations.
RELIABILITY OF DATA
All data compiled for this sector are subject to nonsampling errors. Nonsampling errors can beattributed to many sources: inability to identify all cases in the actual universe; definition andclassification difficulties; differences in the interpretation of questions; errors in recording or cod-ing the data obtained; and other errors of collection, response, coverage, processing, and estima-tion for missing or misreported data. Data presented in the Miscellaneous Subjects and ProductLines reports for this sector are subject to sampling errors, as well as nonsampling errors.
x Utilities 2002 Economic Census
U.S. Census Bureau, 2002 Economic Census

The accuracy of these tabulated data is determined by the joint effects of the various nonsam-pling errors or by the joint effects of sampling and nonsampling errors. No direct measurement ofthese effects has been obtained except for estimation for missing or misreported data, as by thepercentages shown in the tables. Precautionary steps were taken in all phases of the collection,processing, and tabulation of the data in an effort to minimize the effects of nonsampling errors.More information on the reliability of the data is included in Appendix C, Methodology.
DISCLOSURE
In accordance with federal law governing census reports (Title 13 of the United States Code), nodata are published that would disclose the operations of an individual establishment or business.However, the number of establishments in a kind-of-business classification is not considered a dis-closure; therefore, this information may be released even though other information is withheld.Techniques employed to limit disclosure are discussed atwww.census.gov/epcd/ec02/disclosure.htm.
AVAILABILITY OF MORE FREQUENT ECONOMIC DATA
The County Business Patterns program offers annual statistics on the number of establishments,employment, and payroll classified by industry within each county, and Statistics of U.S. Busi-nesses provides annual statistics classified by the employment size of the enterprise, further clas-sified by industry for the United States, and by broader categories for states and metropolitanareas.
CONTACTS FOR DATA USERS
Questions about these data may be directed to the U.S. Census Bureau, Service Sector StatisticsDivision, Utilities and Financial Census Branch, 1-800-541-8345 or [email protected].
ABBREVIATIONS AND SYMBOLS
The following abbreviations and symbols are used with these data:
D Withheld to avoid disclosing data of individual companies; data are included in higher level totalsN Not available or not comparableQ Revenue not collected at this level of detail for multiestablishment firmsS Withheld because estimates did not meet publication standardsX Not applicableZ Less than half the unit shown
a 0 to 19 employeesb 20 to 99 employeesc 100 to 249 employeese 250 to 499 employeesf 500 to 999 employeesg 1,000 to 2,499 employeesh 2,500 to 4,999 employeesi 5,000 to 9,999 employeesj 10,000 to 24,999 employeesk 25,000 to 49,999 employeesl 50,000 to 99,999 employeesm 100,000 employees or more
r Revised– Represents zero (page image/print only)(CC) Consolidated city(IC) Independent city
Utilities xi2002 Economic Census
U.S. Census Bureau, 2002 Economic Census
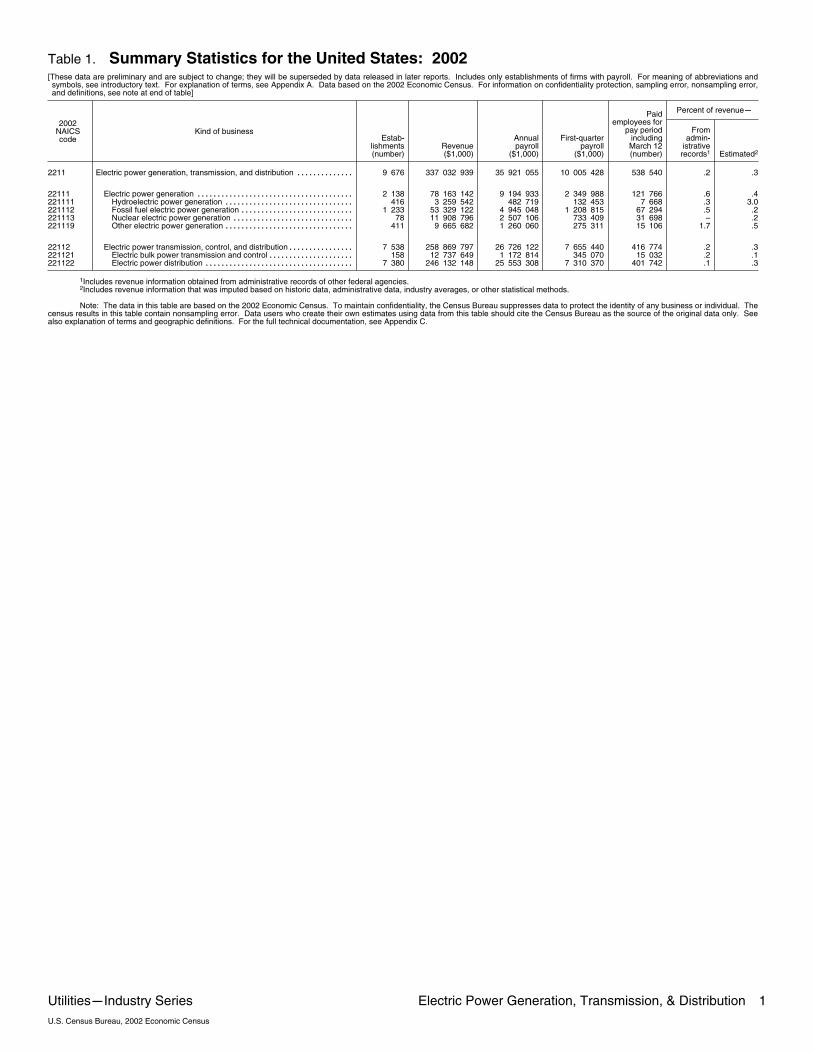
Table 1. Summary Statistics for the United States: 2002[These data are preliminary and are subject to change; they will be superseded by data released in later reports. Includes only establishments of firms with payroll. For meaning of abbreviations andsymbols, see introductory text. For explanation of terms, see Appendix A. Data based on the 2002 Economic Census. For information on confidentiality protection, sampling error, nonsampling error,and definitions, see note at end of table]
2002NAICScode
Kind of business
Percent of revenue�
Estab�lishments(number)
Revenue($1,000)
Annualpayroll
($1,000)
First�quarterpayroll
($1,000)
Paidemployees for
pay periodincludingMarch 12(number)
Fromadmin�
istrativerecords1 Estimated2
2211 Electric power generation, transmission, and distribution 9 676�������������� 337 032 939 35 921 055 10 005 428 538 540 .2 .3
22111 Electric power generation 2 138��������������������������������������� 78 163 142 9 194 933 2 349 988 121 766 .6 .4221111 Hydroelectric power generation 416�������������������������������� 3 259 542 482 719 132 453 7 668 .3 3.0221112 Fossil fuel electric power generation 1 233���������������������������� 53 329 122 4 945 048 1 208 815 67 294 .5 .2221113 Nuclear electric power generation 78������������������������������ 11 908 796 2 507 106 733 409 31 698 – .2221119 Other electric power generation 411�������������������������������� 9 665 682 1 260 060 275 311 15 106 1.7 .5
22112 Electric power transmission, control, and distribution 7 538���������������� 258 869 797 26 726 122 7 655 440 416 774 .2 .3221121 Electric bulk power transmission and control 158��������������������� 12 737 649 1 172 814 345 070 15 032 .2 .1221122 Electric power distribution 7 380������������������������������������� 246 132 148 25 553 308 7 310 370 401 742 .1 .3
1Includes revenue information obtained from administrative records of other federal agencies.2Includes revenue information that was imputed based on historic data, administrative data, industry averages, or other statistical methods.
Note: The data in this table are based on the 2002 Economic Census. To maintain confidentiality, the Census Bureau suppresses data to protect the identity of any business or individual. Thecensus results in this table contain nonsampling error. Data users who create their own estimates using data from this table should cite the Census Bureau as the source of the original data only. Seealso explanation of terms and geographic definitions. For the full technical documentation, see Appendix C.
Utilities�Industry Series Electric Power Generation, Transmission, & Distribution 1U.S. Census Bureau, 2002 Economic Census
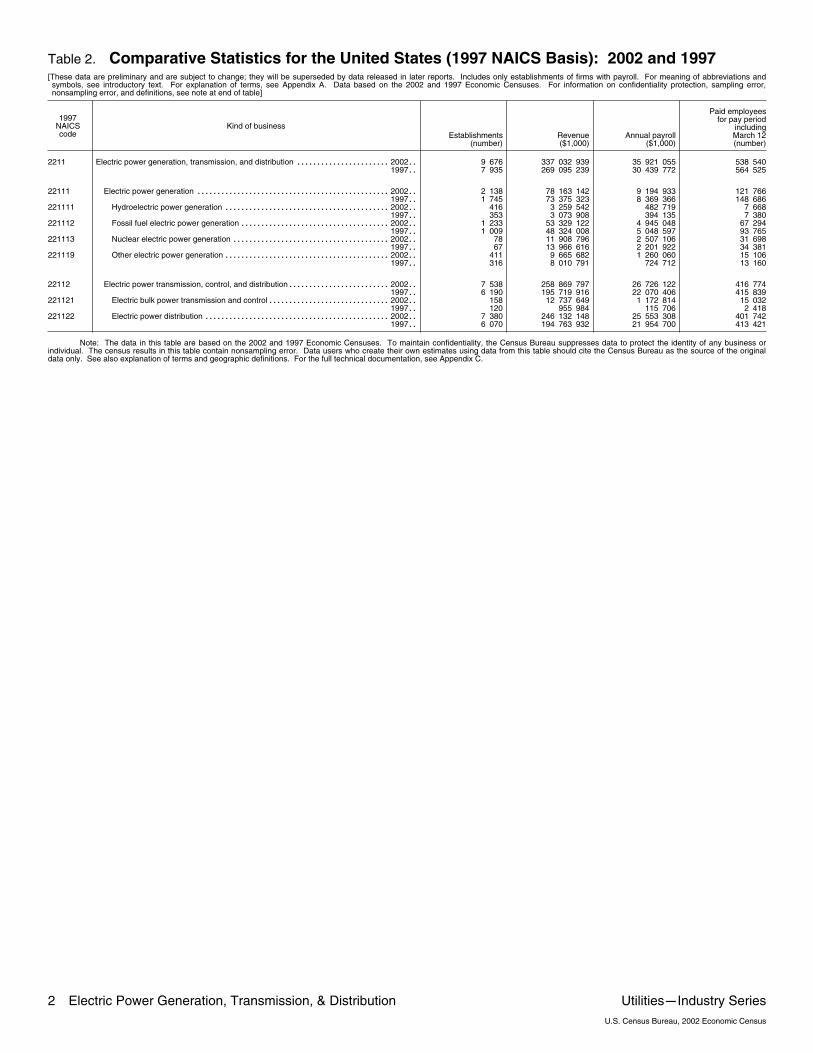
Table 2. Comparative Statistics for the United States (1997 NAICS Basis): 2002 and 1997[These data are preliminary and are subject to change; they will be superseded by data released in later reports. Includes only establishments of firms with payroll. For meaning of abbreviations andsymbols, see introductory text. For explanation of terms, see Appendix A. Data based on the 2002 and 1997 Economic Censuses. For information on confidentiality protection, sampling error,nonsampling error, and definitions, see note at end of table]
1997NAICScode
Kind of businessEstablishments
(number)Revenue($1,000)
Annual payroll($1,000)
Paid employeesfor pay period
includingMarch 12(number)
2211 Electric power generation, transmission, and distribution 2002������������������������� 9 676 337 032 939 35 921 055 538 5401997�� 7 935 269 095 239 30 439 772 564 525
22111 Electric power generation 2002�������������������������������������������������� 2 138 78 163 142 9 194 933 121 7661997�� 1 745 73 375 323 8 369 366 148 686
221111 Hydroelectric power generation 2002������������������������������������������� 416 3 259 542 482 719 7 6681997�� 353 3 073 908 394 135 7 380
221112 Fossil fuel electric power generation 2002��������������������������������������� 1 233 53 329 122 4 945 048 67 2941997�� 1 009 48 324 008 5 048 597 93 765
221113 Nuclear electric power generation 2002����������������������������������������� 78 11 908 796 2 507 106 31 6981997�� 67 13 966 616 2 201 922 34 381
221119 Other electric power generation 2002������������������������������������������� 411 9 665 682 1 260 060 15 1061997�� 316 8 010 791 724 712 13 160
22112 Electric power transmission, control, and distribution 2002��������������������������� 7 538 258 869 797 26 726 122 416 7741997�� 6 190 195 719 916 22 070 406 415 839
221121 Electric bulk power transmission and control 2002�������������������������������� 158 12 737 649 1 172 814 15 0321997�� 120 955 984 115 706 2 418
221122 Electric power distribution 2002������������������������������������������������ 7 380 246 132 148 25 553 308 401 7421997�� 6 070 194 763 932 21 954 700 413 421
Note: The data in this table are based on the 2002 and 1997 Economic Censuses. To maintain confidentiality, the Census Bureau suppresses data to protect the identity of any business orindividual. The census results in this table contain nonsampling error. Data users who create their own estimates using data from this table should cite the Census Bureau as the source of the originaldata only. See also explanation of terms and geographic definitions. For the full technical documentation, see Appendix C.
2 Electric Power Generation, Transmission, & Distribution Utilities�Industry SeriesU.S. Census Bureau, 2002 Economic Census

Table 3. Product Lines by Kind of Business for the United States: 2002[These data are preliminary and are subject to change; they will be superseded by data released in later reports. Includes only establishments of firms with payroll. For meaning of abbreviations andsymbols, see introductory text. For explanation of terms, see Appendix A. Data based on the 2002 Economic Census. For information on confidentiality protection, sampling error, nonsamplingerror, and definitions, see note at end of table]
2002NAICScode
2002Product
line codeKind of business and product line
Establishments with the productline Product line revenue
As percent of total revenueof�
NumberTotal revenue
($1,000)Amount1($1,000)
Estab�lishments
with theproduct
line
Allestab�
lishments1
Responsecoverage2
(percent)
2211 Electric power generation, transmission, and distribution 9 676�������������� X 337 032 939 X 100.0 73.6
43500 Sales of products extracted from natural gas, including propane andbutane Q�������������������������������������������������������� Q 7 384 Q Z X
43600 Household appliance sales Q��������������������������������������� Q 9 845 Q Z X43750 Sales of other merchandise Q��������������������������������������� Q 54 341 Q Z X46030 Pipeline transportation of natural gas and storage of natural gas from
processing plants to local distribution systems Q���������������������� Q 174 752 Q .1 X49000 Electricity � generation and distribution sales Q������������������������ Q 283 529 632 Q 84.1 X49010 Electricity � power marketing and brokering sales Q�������������������� Q 8 744 094 Q 2.6 X49020 Natural gas distribution to final consumer Q��������������������������� Q 11 750 375 Q 3.5 X49030 Natural gas � power marketing and brokering sales Q������������������ Q 3 390 740 Q 1.0 X49040 Mixed, manufactured, or liquefied gas sales Q������������������������� Q 41 433 Q Z X49050 Steam or air�conditioning sales Q������������������������������������ Q 702 213 Q .2 X49060 Water sales Q����������������������������������������������������� Q 1 707 620 Q .5 X49070 Electric power transmission Q��������������������������������������� Q 13 934 739 Q 4.1 X49080 Irrigation system user charges Q������������������������������������ Q 12 533 Q Z X49090 Sewer system user charges Q�������������������������������������� Q 12 307 Q Z X49810 All other operating revenue Q��������������������������������������� Q 12 960 931 Q 3.8 X
22111 Electric power generation 2 138����������������������������������������� X 78 163 142 X 100.0 72.3
49000 Electricity � generation and distribution sales Q������������������������ Q 74 282 479 Q 95.0 X49010 Electricity � power marketing and brokering sales Q�������������������� Q 796 566 Q 1.0 X49020 Natural gas distribution to final consumer Q��������������������������� Q 731 149 Q .9 X49030 Natural gas � power marketing and brokering sales Q������������������ Q 570 094 Q .7 X49040 Mixed, manufactured, or liquefied gas sales Q������������������������� Q 26 665 Q Z X49050 Steam or air�conditioning sales Q������������������������������������ Q 69 659 Q .1 X49060 Water sales Q����������������������������������������������������� Q 21 632 Q Z X49070 Electric power transmission Q��������������������������������������� Q 117 814 Q .2 X49080 Irrigation system user charges Q������������������������������������ Q 226 Q Z X49810 All other operating revenue Q��������������������������������������� Q 1 546 665 Q 2.0 X
221111 Hydroelectric power generation 416������������������������������������ X 3 259 542 X 100.0 75.2
49000 Electricity � generation and distribution sales Q������������������������ Q 3 152 465 Q 96.7 X49810 All other operating revenue Q��������������������������������������� Q 11 539 Q .4 X
221112 Fossil fuel electric power generation 1 233������������������������������� X 53 329 122 X 100.0 72.4
49000 Electricity � generation and distribution sales Q������������������������ Q 49 669 643 Q 93.1 X49010 Electricity � power marketing and brokering sales Q�������������������� Q 723 683 Q 1.4 X49020 Natural gas distribution to final consumer Q��������������������������� Q 731 149 Q 1.4 X49030 Natural gas � power marketing and brokering sales Q������������������ Q 570 094 Q 1.1 X49040 Mixed, manufactured, or liquefied gas sales Q������������������������� Q 26 665 Q .1 X49050 Steam or air�conditioning sales Q������������������������������������ Q 44 263 Q .1 X49070 Electric power transmission Q��������������������������������������� Q 117 325 Q .2 X49810 All other operating revenue Q��������������������������������������� Q 1 444 700 Q 2.7 X
221113 Nuclear electric power generation 78��������������������������������� X 11 908 796 X 100.0 70.4
49000 Electricity � generation and distribution sales Q������������������������ Q 11 867 472 Q 99.7 X49810 All other operating revenue Q��������������������������������������� Q 41 324 Q .3 X
221119 Other electric power generation 411����������������������������������� X 9 665 682 X 100.0 73.2
49000 Electricity � generation and distribution sales Q������������������������ Q 9 592 899 Q 99.2 X49050 Steam or air�conditioning sales Q������������������������������������ Q 21 941 Q .2 X49060 Water sales Q����������������������������������������������������� Q 1 257 Q Z X49810 All other operating revenue Q��������������������������������������� Q 49 102 Q .5 X
22112 Electric power transmission, control, and distribution 7 538����������������� X 258 869 797 X 100.0 74.0
43500 Sales of products extracted from natural gas, including propane andbutane Q�������������������������������������������������������� Q 7 384 Q Z X
43600 Household appliance sales Q��������������������������������������� Q 9 845 Q Z X43750 Sales of other merchandise Q��������������������������������������� Q 54 148 Q Z X46030 Pipeline transportation of natural gas and storage of natural gas from
processing plants to local distribution systems Q���������������������� Q 174 752 Q .1 X49000 Electricity � generation and distribution sales Q������������������������ Q 209 247 153 Q 80.8 X49010 Electricity � power marketing and brokering sales Q�������������������� Q 7 947 528 Q 3.1 X49020 Natural gas distribution to final consumer Q��������������������������� Q 11 019 226 Q 4.3 X49030 Natural gas � power marketing and brokering sales Q������������������ Q 2 820 646 Q 1.1 X49040 Mixed, manufactured, or liquefied gas sales Q������������������������� Q 14 768 Q Z X49050 Steam or air�conditioning sales Q������������������������������������ Q 632 554 Q .2 X49060 Water sales Q����������������������������������������������������� Q 1 685 988 Q .7 X49070 Electric power transmission Q��������������������������������������� Q 13 816 925 Q 5.3 X49080 Irrigation system user charges Q������������������������������������ Q 12 307 Q Z X49090 Sewer system user charges Q�������������������������������������� Q 12 307 Q Z X49810 All other operating revenue Q��������������������������������������� Q 11 414 266 Q 4.4 X
221121 Electric bulk power transmission and control 158������������������������ X 12 737 649 X 100.0 91.7
49070 Electric power transmission Q��������������������������������������� Q 12 733 955 Q 100.0 X49810 All other operating revenue Q��������������������������������������� Q 3 694 Q Z X
221122 Electric power distribution 7 380���������������������������������������� X 246 132 148 X 100.0 73.0
43500 Sales of products extracted from natural gas, including propane andbutane Q�������������������������������������������������������� Q 7 384 Q Z X
43600 Household appliance sales Q��������������������������������������� Q 9 845 Q Z X43750 Sales of other merchandise Q��������������������������������������� Q 54 148 Q Z X46030 Pipeline transportation of natural gas and storage of natural gas from
processing plants to local distribution systems Q���������������������� Q 174 752 Q .1 X49000 Electricity � generation and distribution sales Q������������������������ Q 209 247 153 Q 85.0 X49010 Electricity � power marketing and brokering sales Q�������������������� Q 7 947 528 Q 3.2 X49020 Natural gas distribution to final consumer Q��������������������������� Q 11 019 226 Q 4.5 X49030 Natural gas � power marketing and brokering sales Q������������������ Q 2 820 646 Q 1.1 X49040 Mixed, manufactured, or liquefied gas sales Q������������������������� Q 14 768 Q Z X
See footnotes at end of table.
Utilities�Industry Series Electric Power Generation, Transmission, & Distribution 3U.S. Census Bureau, 2002 Economic Census
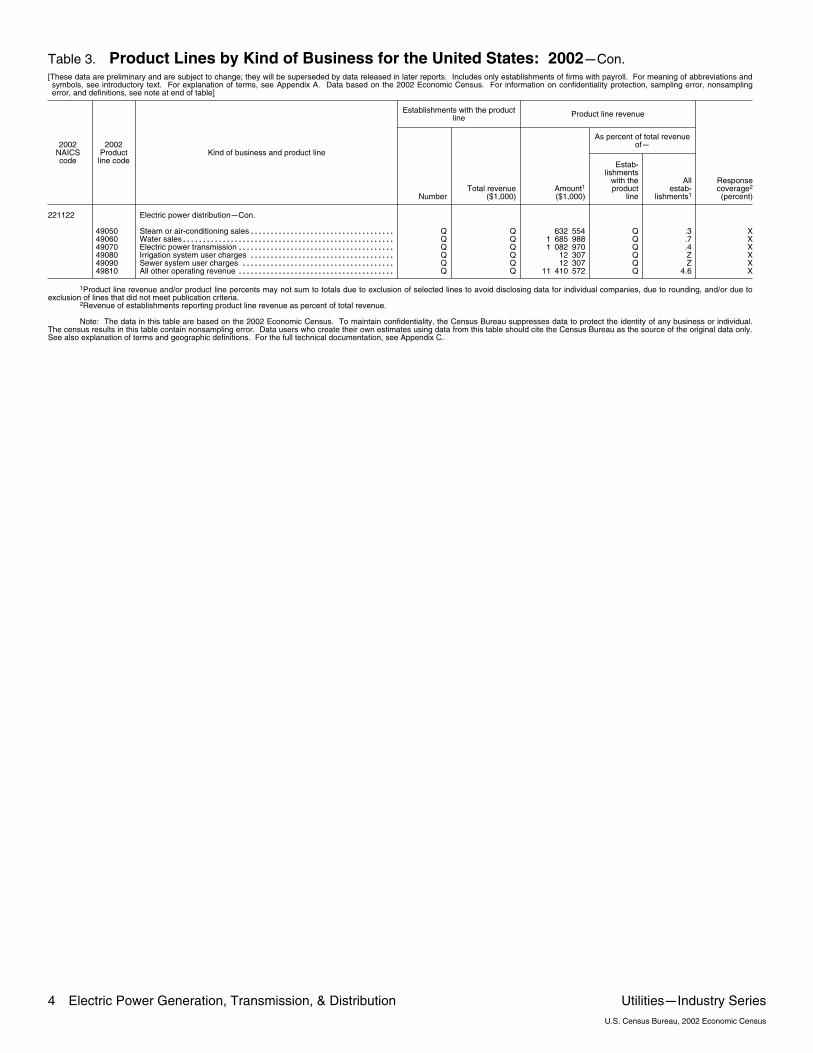
Table 3. Product Lines by Kind of Business for the United States: 2002�Con.[These data are preliminary and are subject to change; they will be superseded by data released in later reports. Includes only establishments of firms with payroll. For meaning of abbreviations andsymbols, see introductory text. For explanation of terms, see Appendix A. Data based on the 2002 Economic Census. For information on confidentiality protection, sampling error, nonsamplingerror, and definitions, see note at end of table]
2002NAICScode
2002Product
line codeKind of business and product line
Establishments with the productline Product line revenue
As percent of total revenueof�
NumberTotal revenue
($1,000)Amount1($1,000)
Estab�lishments
with theproduct
line
Allestab�
lishments1
Responsecoverage2
(percent)
221122 Electric power distribution�Con.
49050 Steam or air�conditioning sales Q������������������������������������ Q 632 554 Q .3 X49060 Water sales Q����������������������������������������������������� Q 1 685 988 Q .7 X49070 Electric power transmission Q��������������������������������������� Q 1 082 970 Q .4 X49080 Irrigation system user charges Q������������������������������������ Q 12 307 Q Z X49090 Sewer system user charges Q�������������������������������������� Q 12 307 Q Z X49810 All other operating revenue Q��������������������������������������� Q 11 410 572 Q 4.6 X
1Product line revenue and/or product line percents may not sum to totals due to exclusion of selected lines to avoid disclosing data for individual companies, due to rounding, and/or due toexclusion of lines that did not meet publication criteria.
2Revenue of establishments reporting product line revenue as percent of total revenue.
Note: The data in this table are based on the 2002 Economic Census. To maintain confidentiality, the Census Bureau suppresses data to protect the identity of any business or individual.The census results in this table contain nonsampling error. Data users who create their own estimates using data from this table should cite the Census Bureau as the source of the original data only.See also explanation of terms and geographic definitions. For the full technical documentation, see Appendix C.
4 Electric Power Generation, Transmission, & Distribution Utilities�Industry SeriesU.S. Census Bureau, 2002 Economic Census

Table 4. Concentration by Largest Firms for the United States: 2002[These data are preliminary and are subject to change; they will be superseded by data released in later reports. Includes only firms and establishments of firms with payroll. Excludes data forestablishments of these firms that are classified in other categories than those specified in this table. For meaning of abbreviations and symbols, see introductory text. For explanation of terms, seeAppendix A. For method of assignment to categories shown, see Appendix C. Data based on the 2002 Economic Census. For information on confidentiality protection, sampling error, nonsamplingerror, and definitions, see note at end of table]
2002NAICScode
Kind of business and largest firms based on revenue
Revenue
Establishments(number)
Amount($1,000)
As percentof total
Annualpayroll
($1,000)
First�quarterpayroll
($1,000)
Paid employeesfor pay period
includingMarch 12(number)
2211 Electric power generation, transmission, and distribution
All firms 9 676����������������������������������������������������� 337 032 939 100.0 35 921 055 10 005 428 538 5404 largest firms 1 186�������������������������������������������������������� 64 238 223 18.1 6 837 320 2 151 572 96 3778 largest firms 2 093�������������������������������������������������������� 112 106 040 31.6 10 236 957 3 118 437 150 15220 largest firms 3 971������������������������������������������������������ 197 982 739 55.9 18 829 495 5 500 288 270 56150 largest firms 5 745������������������������������������������������������ 281 494 541 79.5 28 181 488 8 061 007 414 267
22111 Electric power generation
All firms 2 138����������������������������������������������������� 78 163 142 100.0 9 194 933 2 349 988 121 7664 largest firms 336�������������������������������������������������������� 26 858 269 31.1 2 234 717 646 578 27 7658 largest firms 466�������������������������������������������������������� 39 569 483 45.8 3 204 854 924 070 42 27220 largest firms 828������������������������������������������������������ 57 520 127 66.6 5 704 341 1 502 584 71 81850 largest firms 1 143������������������������������������������������������ 75 526 645 87.5 7 494 416 1 975 097 99 670
221111 Hydroelectric power generation
All firms 416����������������������������������������������������� 3 259 542 100.0 482 719 132 453 7 6684 largest firms 122�������������������������������������������������������� 2 594 070 65.6 276 928 77 319 3 9938 largest firms 158�������������������������������������������������������� 3 127 078 79.0 337 186 93 247 5 00820 largest firms 265������������������������������������������������������ 3 702 372 93.6 411 357 113 830 6 37550 largest firms 314������������������������������������������������������ 3 921 261 99.1 442 860 122 487 7 012
221112 Fossil fuel electric power generation
All firms 1 233����������������������������������������������������� 53 329 122 100.0 4 945 048 1 208 815 67 2944 largest firms 265�������������������������������������������������������� 18 943 653 33.9 701 218 200 598 8 8918 largest firms 444�������������������������������������������������������� 27 300 593 48.8 1 492 654 423 064 23 54320 largest firms 600������������������������������������������������������ 38 684 638 69.2 2 459 359 678 723 35 60250 largest firms 815������������������������������������������������������ 51 294 383 91.7 3 565 028 976 835 52 037
221113 Nuclear electric power generation
All firms 78����������������������������������������������������� 11 908 796 100.0 2 507 106 733 409 31 6984 largest firms 31�������������������������������������������������������� 10 800 508 62.8 1 219 748 373 902 14 9168 largest firms 53�������������������������������������������������������� 14 239 126 82.7 1 875 462 563 506 23 47920 largest firms 67������������������������������������������������������ 17 184 718 99.9 2 562 550 746 630 33 58250 largest firms 78������������������������������������������������������ 17 210 446 100.0 2 566 163 747 719 33 638
221119 Other electric power generation
All firms 411����������������������������������������������������� 9 665 682 100.0 1 260 060 275 311 15 1064 largest firms 14�������������������������������������������������������� 4 281 003 46.2 283 170 71 168 2 1818 largest firms 32�������������������������������������������������������� 5 478 880 59.1 411 055 105 752 4 43820 largest firms 71������������������������������������������������������ 7 442 872 80.3 620 717 163 469 7 95350 largest firms 136������������������������������������������������������ 8 518 545 91.9 781 740 202 742 10 080
22112 Electric power transmission, control, and distribution
All firms 7 538����������������������������������������������������� 258 869 797 100.0 26 726 122 7 655 440 416 7744 largest firms 840�������������������������������������������������������� 47 326 991 17.7 3 945 609 1 199 183 60 2668 largest firms 1 840�������������������������������������������������������� 87 633 906 32.7 7 848 924 2 475 035 118 30120 largest firms 3 406������������������������������������������������������ 157 814 458 58.9 14 801 178 4 416 009 223 77550 largest firms 4 956������������������������������������������������������ 221 694 062 82.8 22 211 882 6 492 247 338 313
221121 Electric bulk power transmission and control
All firms 158����������������������������������������������������� 12 737 649 100.0 1 172 814 345 070 15 0324 largest firms 67�������������������������������������������������������� 10 941 352 85.3 964 299 286 488 11 7738 largest firms 89�������������������������������������������������������� 11 732 792 91.5 1 033 039 306 666 12 83020 largest firms 117������������������������������������������������������ 12 546 932 97.8 1 130 226 334 148 14 40050 largest firms 147������������������������������������������������������ 12 812 291 99.9 1 174 473 345 378 15 089
221122 Electric power distribution
All firms 7 380����������������������������������������������������� 246 132 148 100.0 25 553 308 7 310 370 401 7424 largest firms 1 304�������������������������������������������������������� 47 107 088 18.5 4 645 242 1 477 518 70 3868 largest firms 1 826�������������������������������������������������������� 85 287 102 33.4 7 781 556 2 383 804 117 16520 largest firms 3 346������������������������������������������������������ 150 207 038 58.9 14 093 839 4 172 090 214 97350 largest firms 4 772������������������������������������������������������ 210 763 057 82.6 21 116 696 6 184 289 322 996
Note: The data in this table are based on the 2002 Economic Census. To maintain confidentiality, the Census Bureau suppresses data to protect the identity of any business or individual. Thecensus results in this table contain nonsampling error. Data users who create their own estimates using data from this table should cite the Census Bureau as the source of the original data only. Seealso explanation of terms and geographic definitions. For the full technical documentation, see Appendix C.
Utilities�Industry Series Electric Power Generation, Transmission, & Distribution 5U.S. Census Bureau, 2002 Economic Census
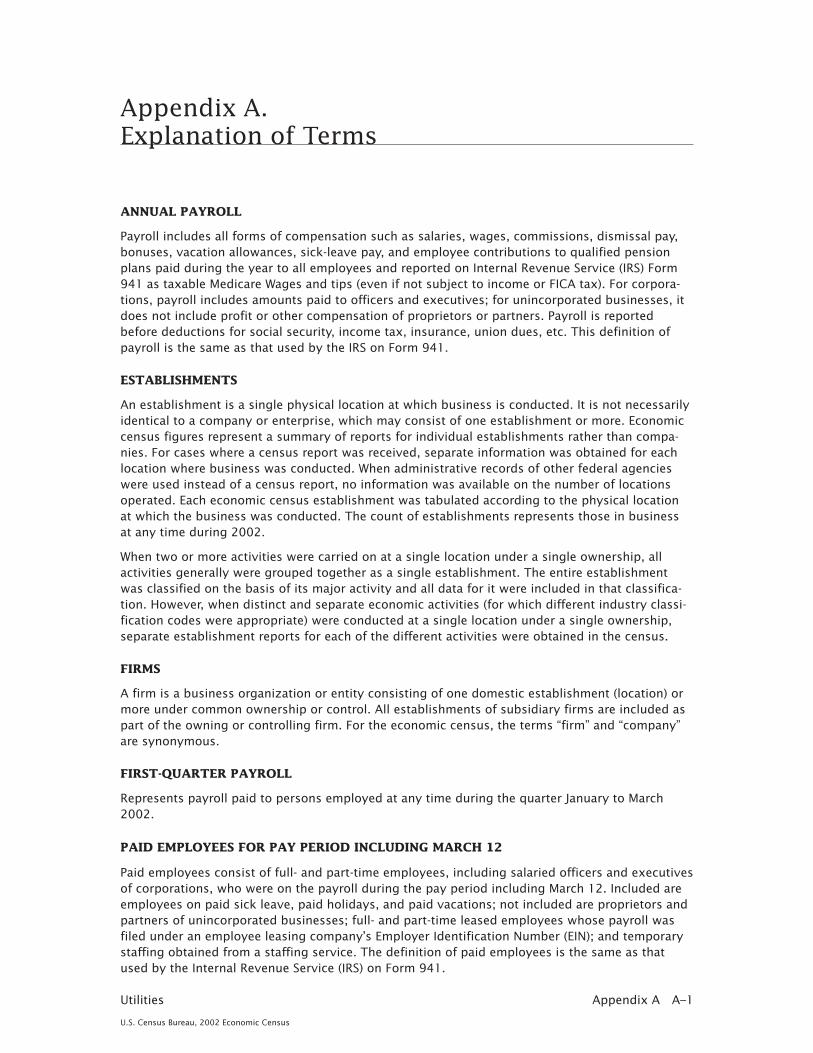
Appendix A.Explanation of Terms
ANNUAL PAYROLL
Payroll includes all forms of compensation such as salaries, wages, commissions, dismissal pay,bonuses, vacation allowances, sick-leave pay, and employee contributions to qualified pensionplans paid during the year to all employees and reported on Internal Revenue Service (IRS) Form941 as taxable Medicare Wages and tips (even if not subject to income or FICA tax). For corpora-tions, payroll includes amounts paid to officers and executives; for unincorporated businesses, itdoes not include profit or other compensation of proprietors or partners. Payroll is reportedbefore deductions for social security, income tax, insurance, union dues, etc. This definition ofpayroll is the same as that used by the IRS on Form 941.
ESTABLISHMENTS
An establishment is a single physical location at which business is conducted. It is not necessarilyidentical to a company or enterprise, which may consist of one establishment or more. Economiccensus figures represent a summary of reports for individual establishments rather than compa-nies. For cases where a census report was received, separate information was obtained for eachlocation where business was conducted. When administrative records of other federal agencieswere used instead of a census report, no information was available on the number of locationsoperated. Each economic census establishment was tabulated according to the physical locationat which the business was conducted. The count of establishments represents those in businessat any time during 2002.
When two or more activities were carried on at a single location under a single ownership, allactivities generally were grouped together as a single establishment. The entire establishmentwas classified on the basis of its major activity and all data for it were included in that classifica-tion. However, when distinct and separate economic activities (for which different industry classi-fication codes were appropriate) were conducted at a single location under a single ownership,separate establishment reports for each of the different activities were obtained in the census.
FIRMS
A firm is a business organization or entity consisting of one domestic establishment (location) ormore under common ownership or control. All establishments of subsidiary firms are included aspart of the owning or controlling firm. For the economic census, the terms “firm” and “company”are synonymous.
FIRST-QUARTER PAYROLL
Represents payroll paid to persons employed at any time during the quarter January to March2002.
PAID EMPLOYEES FOR PAY PERIOD INCLUDING MARCH 12
Paid employees consist of full- and part-time employees, including salaried officers and executivesof corporations, who were on the payroll during the pay period including March 12. Included areemployees on paid sick leave, paid holidays, and paid vacations; not included are proprietors andpartners of unincorporated businesses; full- and part-time leased employees whose payroll wasfiled under an employee leasing company’s Employer Identification Number (EIN); and temporarystaffing obtained from a staffing service. The definition of paid employees is the same as thatused by the Internal Revenue Service (IRS) on Form 941.
Appendix A A–1Utilities
U.S. Census Bureau, 2002 Economic Census

REVENUE
Includes revenue from all business activities whether or not payment was received in the censusyear. Revenue does not include sales and other taxes (including Hawaii’s General Excise Tax) col-lected from customers and paid directly by the firm to a local, state, or federal tax agency.
A–2 Appendix A Utilities
U.S. Census Bureau, 2002 Economic Census

Appendix B.NAICS Codes, Titles, and Descriptions
PART 1. 2002 NAICS
2211 ELECTRIC POWER GENERATION, TRANSMISSION, AND DISTRIBUTION
This industry group comprises establishments primarily engaged in generating, transmitting,and/or distributing electric power. Establishments in this industry group may perform one ormore of the following activities: (1) operate generation facilities that produce electric energy; (2)operate transmission systems that convey the electricity from the generation facility to the distri-bution system; and (3) operate distribution systems that convey electric power received from thegeneration facility or the transmission system to the final consumer.
22111 ELECTRIC POWER GENERATION
This industry comprises establishments primarily engaged in operating electric power generationfacilities. These facilities convert other forms of energy, such as water power (i.e., hydroelectric),fossil fuels, nuclear power, and solar power, into electrical energy. The establishments in thisindustry produce electric energy and provide electricity to transmission systems or to electricpower distribution systems.
221111 HYDROELECTRIC POWER GENERATION
This industry comprises establishments primarily engaged in operating hydroelectric power gen-eration facilities. These facilities use water power to drive a turbine and produce electric energy.The electric energy produced in these establishments is provided to electric power transmissionsystems or to electric power distribution systems.
221112 FOSSIL FUEL ELECTRIC POWER GENERATION
This industry comprises establishments primarily engaged in operating fossil fuel powered elec-tric power generation facilities.
These facilities use fossil fuels, such as coal, oil, or gas, in internal combustion or combustion tur-bine conventional steam process to produce electric energy. The electric energy produced in theseestablishments is provided to electric power transmission systems or to electric power distribu-tion systems.
221113 NUCLEAR ELECTRIC POWER GENERATION
This industry comprises establishments primarily engaged in operating nuclear electric powergeneration facilities. These facilities use nuclear power to produce electric energy. The electricenergy produced in these establishments is provided to electric power transmission systems or toelectric power distribution systems.
221119 OTHER ELECTRIC POWER GENERATION
This industry comprises establishments primarily engaged in operating electric power generationfacilities (except hydroelectric, fossil fuel, nuclear). These facilities convert other forms of energy,such as solar, wind, or tidal power, into electrical energy. The electric energy produced in theseestablishments is provided to electric power transmission systems or to electric power distribu-tion systems.
Appendix B B–1Utilities
U.S. Census Bureau, 2002 Economic Census
22112 ELECTRIC POWER TRANSMISSION, CONTROL, AND DISTRIBUTION
This industry comprises establishments primarily engaged in operating electric power transmis-sion systems, controlling (i.e., regulating voltage) the transmission of electricity, and/or distribut-ing electricity. The transmission system includes lines and transformer stations. These establish-ments arrange, facilitate, or coordinate the transmission of electricity from the generating sourceto the distribution centers, other electric utilities, or final consumers. The distribution system con-sists of lines, poles, meters, and wiring that deliver the electricity to final consumers.
221121 ELECTRIC BULK POWER TRANSMISSION AND CONTROL
This industry comprises establishments primarily engaged in operating electric power transmis-sion systems and/or controlling (i.e., regulating voltage) the transmission of electricity from thegenerating source to distribution centers or other electric utilities. The transmission systemincludes lines and transformer stations.
221122 ELECTRIC POWER DISTRIBUTION
This industry comprises electric power establishments primarily engaged in either (1) operatingelectric power distribution systems (i.e., consisting of lines, poles, meters, and wiring) or (2) oper-ating as electric power brokers or agents that arrange the sale of electricity via power distributionsystems operated by others.
PART 2. 1997 NAICS
2211 ELECTRIC POWER GENERATION, TRANSMISSION, AND DISTRIBUTION
This industry group comprises establishments primarily engaged in generating, transmitting,and/or distributing electric power. Establishments in this industry group may perform one ormore of the following activities: (1) operate generation facilities that produce electric energy; (2)operate transmission systems that convey the electricity from the generation facility to the distri-bution system; and (3) operate distribution systems that convey electric power received from thegeneration facility or the transmission system to the final consumer.
22111 ELECTRIC POWER GENERATION
This industry comprises establishments primarily engaged in operating electric power generationfacilities. These facilities convert other forms of energy, such as water power (i.e., hydroelectric),fossil fuels, nuclear power, and solar power, into electrical energy. The establishments in thisindustry produce electric energy and provide electricity to transmission systems or to electricpower distribution systems.
221111 HYDROELECTRIC POWER GENERATION
This industry comprises establishments primarily engaged in operating hydroelectric power gen-eration facilities. These facilities use water power to drive a turbine and produce electric energy.The electric energy produced in these establishments is provided to electric power transmissionsystems or to electric power distribution systems.
221112 FOSSIL FUEL ELECTRIC POWER GENERATION
This industry comprises establishments primarily engaged in operating fossil fuel powered elec-tric power generation facilities.
These facilities use fossil fuels, such as coal, oil, or gas, in internal combustion or combustion tur-bine conventional steam process to produce electric energy. The electric energy produced in theseestablishments is provided to electric power transmission systems or to electric power distribu-tion systems.
B–2 Appendix B Utilities
U.S. Census Bureau, 2002 Economic Census
221113 NUCLEAR ELECTRIC POWER GENERATION
This industry comprises establishments primarily engaged in operating nuclear electric powergeneration facilities. These facilities use nuclear power to produce electric energy. The electricenergy produced in these establishments is provided to electric power transmission systems or toelectric power distribution systems.
221119 OTHER ELECTRIC POWER GENERATION
This industry comprises establishments primarily engaged in operating electric power generationfacilities (except hydroelectric, fossil fuel, nuclear). These facilities convert other forms of energy,such as solar, wind, or tidal power, into electrical energy. The electric energy produced in theseestablishments is provided to electric power transmission systems or to electric power distribu-tion systems.
22112 ELECTRIC POWER TRANSMISSION, CONTROL, AND DISTRIBUTION
This industry comprises establishments primarily engaged in operating electric power transmis-sion systems, controlling (i.e., regulating voltage) the transmission of electricity, and/or distribut-ing electricity. The transmission system includes lines and transformer stations. These establish-ments arrange, facilitate, or coordinate the transmission of electricity from the generating sourceto the distribution centers, other electric utilities, or final consumers. The distribution system con-sists of lines, poles, meters, and wiring that deliver the electricity to final consumers.
221121 ELECTRIC BULK POWER TRANSMISSION AND CONTROL
This industry comprises establishments primarily engaged in operating electric power transmis-sion systems and/or controlling (i.e., regulating voltage) the transmission of electricity from thegenerating source to distribution centers or other electric utilities. The transmission systemincludes lines and transformer stations.
221122 ELECTRIC POWER DISTRIBUTION
This industry comprises electric power establishments primarily engaged in either (1) operatingelectric power distribution systems (i.e., consisting of lines, poles, meters, and wiring) or (2) oper-ating as electric power brokers or agents that arrange the sale of electricity via power distributionsystems operated by others.
Appendix B B–3Utilities
U.S. Census Bureau, 2002 Economic Census

Appendix C.Methodology
SOURCES OF THE DATA
For this sector, large- and medium-size firms, plus all firms known to operate more than oneestablishment, were sent report forms to be completed for each of their establishments andreturned to the Census Bureau. For most very small firms, data from existing administrativerecords of other federal agencies were used instead. These records provide basic information onlocation, kind of business, revenue, payroll, number of employees, and legal form of organization.
Firms in the 2002 Economic Census are divided into those sent report forms and those not sentreport forms. The coverage of and the method of obtaining census information from each aredescribed below:
1. Establishments sent a report form:
a. Large employers, i.e., all multiestablishment firms, and all employer firms with payrollabove a specified cutoff. (The term “employers” refers to firms with one or more paidemployees at any time during 2002 as shown in the active administrative records of otherfederal agencies.)
b. A sample of small employers, i.e., single-establishment firms with payroll below a specifiedcutoff in classifications for which specialized data precludes reliance solely on administra-tive records sources. The sample was stratified by industry and geography.
2. Establishments not sent a report form:
a. Small employers, i.e., single-establishment firms with payroll below a specified cutoff, notselected into the small employer sample. Although the payroll cutoff varies by kind of busi-ness, small employers not sent a report form generally include firms with less than 10employees and represent about 10 percent of total revenue of establishments covered inthe census. Data on revenue, payroll, and employment for these small employers werederived or estimated from administrative records of other federal agencies.
b. All nonemployers, i.e., all firms subject to federal income tax with no paid employees dur-ing 2002. Revenue information for these firms was obtained from administrative records ofother federal agencies. Although consisting of many firms, nonemployers account for lessthan 10 percent of total revenue of all establishments covered in the census. Data for non-employers are not included in this report, but are released in the annual Nonemployer Sta-tistics series.
The report forms used to collect information for establishments in this sector are available athelp.econ.census.gov/econhelp/resources/.
A more detailed examination of census methodology is presented in the History of the EconomicCensus at www.census.gov/econ/www/history.html.
INDUSTRY CLASSIFICATION OF ESTABLISHMENTS
The classifications for all establishments are based on the North American Industry ClassificationSystem, United States, 2002 manual. There were no changes between the 2002 edition and the1997 edition affecting this sector. Tables at www.census.gov/epcd/naics02/ identify all industriesthat changed between the 1997 North American Industry Classification System (NAICS) and 2002NAICS.
Appendix C C–1Utilities
U.S. Census Bureau, 2002 Economic Census
The method of assigning classifications and the level of detail at which establishments were clas-sified depends on whether a report form was obtained for the establishment.
1. Establishments that returned a report form were classified on the basis of their self-designation, product line revenue, and responses to other industry-specific inquiries.
2. Establishments without a report form:
a. Small employers not sent a form were, where possible, classified on the basis of the mostcurrent kind-of-business classification available from one of the Census Bureau’s currentsample surveys or the 1997 Economic Census. Otherwise, the classification was obtainedfrom administrative records of other federal agencies. If the census or administrativerecord classifications proved inadequate (none corresponded to a 2002 Economic Censusclassification in the detail required for employers), the firm was sent a brief inquiryrequesting information necessary to assign a kind-of-business code.
b. Nonemployers were classified on the basis of information obtained from administrativerecords of other federal agencies.
RELIABILITY OF DATA
All data compiled in the economic census are subject to nonsampling errors. Nonsampling errorscan be attributed to many sources during the development or execution of the census:
• inability to identify all cases in the actual universe;
• definition and classification difficulties;
• differences in the interpretation of questions;
• errors in recording or coding the data obtained; and
• other errors of collection, response, coverage, processing, and estimation for missing or misre-ported data.
Data presented in the Miscellaneous Subjects and the Product Lines reports for this sector are sub-ject to sampling errors, as well as nonsampling errors. Specifically, these data are estimated basedon information obtained from census report forms mailed to all large employers and to a sampleof small employers in the universe. Sampling errors affect these estimates, insofar, as they maydiffer from results that would be obtained from a complete enumeration.
The accuracy of these tabulated data is determined by the joint effects of the various nonsam-pling errors or by the joint effects of sampling and nonsampling errors. No direct measurement ofthese effects has been obtained except for estimation for missing or misreported data; however,precautionary steps were taken in all phases of the collection, processing, and tabulation of thedata in an effort to minimize the effects of nonsampling errors.
The Census Bureau obtains limited information extracted from administrative records of other fed-eral agencies, such as gross revenue from federal income tax records and employment and payrollfrom payroll tax records. This information is used in conjunction with other information availableto the Census Bureau to develop estimates for nonemployers, small employers, and other estab-lishments for which responses were not received in time for publication.
Key tables in this report include a column for “Percent of revenue from administrative records.”This includes revenue information obtained from administrative records of other federal agencies.The “Percent of revenue estimated” includes revenue information that was imputed based on his-toric company ratios or administrative records, or on industry averages.
The Census Bureau recommends that data users incorporate this information into their analyses,as nonsampling error and sampling error could impact the conclusions drawn from economic cen-sus data.
C–2 Appendix C Utilities
U.S. Census Bureau, 2002 Economic Census

TREATMENT OF NONRESPONSE
Census report forms included two different types of inquiries, “basic” and “industry-specific.” Datafor the basic inquiries, which include location, kind of business or operation, revenue, payroll, andnumber of employees, were available from a combination of sources for all establishments. Datafor industry-specific inquiries, tailored to the particular kinds of business or operation covered bythe report form, were available only from establishments responding to those inquiries.
Data for industry-specific inquiries in this sector were expanded in most cases to account forestablishments that did not respond to the particular inquiry for which data are presented. Unlessotherwise noted in specific reports, data for industry-specific inquiries were expanded in directrelationship to total revenue of all establishments included in the category. In a few cases, expan-sion on the basis of the revenue item was not appropriate, and another basic data item was usedas the basis for expansion of reported data to account for nonrespondents.
All reports in which industry-specific data were expanded include a coverage indicator for eachpublication category, which shows the revenue of establishments responding to the industry-specific inquiry as a percent of total revenue for all establishments for which data are shown. Forsome inquiries, coverage is determined by the ratio of total payroll or employment of establish-ments responding to the inquiry to total payroll or employment of all establishments in the cat-egory.
CONCENTRATION CATEGORIES
Concentration categories are based on aggregate revenue of all establishments operated by thesame firm in a given kind-of-business classification or group for which data are presented. Forexample, a firm operating two utilities establishments – an electric power distribution service(NAICS 221122) and a natural gas distribution service (NAICS 221210) – would be treated as twoone-establishment firms at the most detailed NAICS level, as a two-establishment firm in NAICS221, and as a single two-establishment firm in Utilities totals (NAICS 22).
DISCLOSURE
In accordance with federal law governing census reports (Title 13 of the United States Code), nodata are published that would disclose the operations of an individual establishment or business.However, the number of establishments in a kind-of-business classification is not considered a dis-closure; therefore, this information may be released even though other information is withheld.Techniques employed to limit disclosure are discussed atwww.census.gov/epcd/ec02/disclosure.htm.
Appendix C C–3Utilities
U.S. Census Bureau, 2002 Economic Census

Appendix D.Geographic Notes
Not applicable for this report.
Appendix D D–12002 Economic Census
U.S. Census Bureau, 2002 Economic Census
Appendix E.Metropolitan and MicropolitanStatistical Areas
Not applicable for this report.
Appendix E E–12002 Economic Census
U.S. Census Bureau, 2002 Economic Census

EC0
2-2
2I-0
32
00
2El
ectr
icPo
wer
Gen
erat
ion
,Tra
nsm
issi
on
,an
dD
istr
ibu
tion
:2
00
22
00
2Eco
nom
icC
en
su
sU
tilit
ies
Indust
rySe
ries
US
CE
NS
US
BU
RE
AU