electrical properties of skin at moderate voltages · home help feedback subscriptions archive...
TRANSCRIPT

HOME HELP FEEDBACK SUBSCRIPTIONS ARCHIVE SEARCH TABLE OF CONTENTS
Biophys J, February 1998, p. 843-856, Vol. 74, No. 2
Electrical Properties of Skin at ModerateVoltages: Contribution of Appendageal Macropores Yuri A. Chizmadzhev,* Andrey V. Indenbom,* Peter I. Kuzmin,*
Sergey V. Galichenko,* James C. Weaver,# and Russell O. Potts§
*Frumkin Institute of Electrochemistry, Russian Academy ofSciences, Moscow 117071, Russia; #Harvard-MIT Division ofHealth Sciences and Technology, Massachusetts Institute ofTechnology, Cambridge, Massachusetts 012139, and §Cygnus, Inc.,Redwood City, California 94063 USA
ABSTRACT
The electrical properties of human skin inthe range of the applied voltages between0.2 and 60 V are modeled theoretically
and measured experimentally. Twoparallel electric current pathways areconsidered: one crossing lipid-corneocytematrix and the other going through skinappendages. The appendageal ducts aremodeled as long tubes with distributed electrical parameters. For both transport systems, equations taking into account the electroporation of lipid lamella in the case the lipid-corneocyte matrix or the walls of the appendageal ducts in the case of the skin appendages are derived. Numerical solutions of these nonlinear equations are compared with published data and the results of our own experiments. The current-time response of the skin during the application of rectangular pulses of different voltage amplitudes show a profound similarity with the same characteristics in model and plasma membrane electroporation. A comparison of the theory and the experiment shows that a significant (up to three orders of magnitude) drop of skin resistance due to electrotreatment can be explained by electroporation of different substructures of stratum corneum. At relatively low voltages (U < 30 V) this drop of skin resistance can be attributed to electroporation of the appendageal ducts. At higher voltages (U > 30 V), electroporation of the lipid-corneocyte matrix leads to an additional drop of skin resistance. These theoretical findings are in a good agreement with the experimental results and literature data.
INTRODUCTION
Drug delivery through human skin has a number of potential advantages relative to other means of administration. The difficulty with transdermal drug delivery is that the outermost layer of the skin (stratum corneum, SC) is a formidable barrier to the transport of hydrophilic or ionized species.
Abstract of this Article
Reprint (PDF) Version of this Article
Similar articles found in:Biophys. J. Online PubMed
PubMed Citation
This Article has been cited by:
other online articles
Search Medline for articles by: Chizmadzhev, Y. A. || Potts, R. O.
Alert me when: new articles cite this article
Download to Citation Manager Top Abstract Introduction Materials & Methods Results Discussion References

Therefore, the enhancement of transdermal flux for these species is of greatmedical importance. It has been shown (for references, see Burnette, 1989) thatthe application of an electric field is an effective enhancer of charged moleculetransfer through the skin. For this reason, knowledge of the electrical propertiesof the skin is valuable. At applied voltages of less than 1 V the current density isdescribed by the Nernst-Planck electrodiffusion equation (Lakshminarayanaiah,
1984). In the absence of concentration gradients, the current-voltage dependenceof skin is linear, in accordance with experimental data. In this case, the electric field provides a driving force for ion migration without creating new pathways. The situation changes markedly, however, at higher voltage. For example, at a potential difference of a few volts the current-voltage dependence
becomes nonlinear (Kasting and Bowman, 1990a,b; Inada et al., 1994). Under these conditions a steady-state potential (at constant current) develops with significant lag time, and the system acquires some features of irreversibility. This behavior cannot be described by electrodiffusion theory. Rather, it was interpreted in terms of either interfacial nonlinear reactions or electroporation (Kasting and Bowman, 1990a,b; Inada et al., 1994).
The SC consists of a lipid-corneocyte matrix crossed by skin appendages (e.g., sweat glands and hair follicles; Fig. 1). The lipid matrix subsystem includes ~70-100 bilayers in sequence (Elias et al., 1977; Odland, 1983; Elias, 1983; Madison et al., 1987). Hence, a transdermal voltage of ~1 V results in a potential drop across each bilayer of ~10 mV, a value too small for electroporation in planar lipid bilayers (Abidor et al., 1979; Benz et al., 1979). The skin appendages also carry current. Direct, high-resolution
measurements using vibrating potentiometric microelectrodes (Cullander and Guy, 1991; Cullander, 1992) and scanning electrochemical and video microscopy (Scott et al., 1993) have shown that appendages are associated with regions of high current density. The edges of these ducts (or macropores) are lined by two layers of epithelial cells (Odland, 1983). At a voltage near 1 V, the potential drop across each epithelial cell membrane lining the macropore duct is ~250 mV, sufficient for electroporation. This electric field could, therefore, create new pathways in the appendageal macropore walls. Even more dramatic effects were described at applied potentials up to several hundred volts (Prausnitz et al., 1993; Pliquett et al., 1995; Bommannan, 199). In these studies it was shown that skin resistance decreased by 1000-fold during a very short (<10 µs) time interval. The primary resistance drop occurred at voltages of less than 70 V. Prausnitz et al. (1993) and Pliquett et al. (1995) attribute this change in skin resistance to electroporation of the multilamellar bilayer membranes of the SC. A quantitative theoretical study (Chizmadzhev et al., 1995) focused on the domain of high voltages and electroporation of SC lipids.
View larger version (81K): [in this window]
[in a new window]
FIGURE 1 A schematic representation of the structure of human skin.
Here we investigate the effect of moderate voltages (U<60V). The main objective of the study is to
Top Abstract Introduction Materials & Methods Results Discussion References

elucidate the role of appendages in the electrical properties of skin. As a first step, a quantitative theory of electroporation of skin appendages is developed and applied to the analysis of published experimental
data (Kasting and Bowman, 1990a,b ; Inada et al., 1994) obtained around 1V applied potential. The experimental results obtained at higher voltages (10V<U<60V) are compared with theoretical predictions.
THEORETICAL
Consider a skin sample immersed in an electrolyte solution. The electric current flowing across the skin can be measured after the application of a rectangular voltage pulse applied between two electrodes on either side of the skin. It is believed that there are two parallel current pathways through the skin (Monteiro-Riviere, 1994; Potts et al., 1992 ; Oh et al., 1993), one crossing the lipid-corneocyte matrix (m) of the SC, and the other going through appendages (a). An equivalent electrical scheme of this systemis shown in Fig. 2. All of the elements in the scheme are explained below.
View largerversion (13K):
[in this window] [in a new window]
FIGURE 2 The equivalent electrical scheme of an outermost layer of skin. (a)An integral scheme where Rb, Rs, and Rc are the resistances of bulk solution,
skin, and measuring resistor, correspondingly; Cs is skin capacitance. (b) More
specified scheme, where two parallel pathways are shown. Rm and Cm refer to
lipid-corneocyte matrix, and Ra and Ca refer to appendages.
Lipid-corneocyte matrix pathway (m)
From an electrostatic point of view, the m-subsystem of the SC can be considered as a dielectric with a resistance (Rm) of ~105 ohms cm2 and a capacitance (Cm) of ~0.03 µF/cm2 (Oh et al., 1993; Edelberg,
1971) (Fig. 2 b). If the m-layer is considered to be a homogeneous medium of 15-20 µm thickness, an average dielectric permittivity of 700 is obtained. This value is unreasonable, and this homogeneous model is therefore not valid (DeNuzzio and Berner, 1990). Alternatively, we should take into account the fact that corneocytes contain water and small ions resulting in an equipotential domain within these compartments. Thus, the potential drop across the SC should occur predominantly across the lipid domains between the corneocytes. This lipid domain can be described as parallel resistors and capacitors in series through the SC. There are on average 15-20 corneocyte layers in the SC, each separated by lipid domains of ~0.05 µm thickness (Holbrook and Odland, 1974 ; Swartzendruber et al., 1989 ; Swartzendruber et al., 1987 ). Thus, the effective thickness of this nonconducting layer is ~1 µm (20 × 0.05 µm), yielding an effective dielectric constant of 15-20. This value is intermediate between that for lipids (~2-3) and water (~80) and is reasonable for hydrated lipid bilayers. This estimate suggests that the voltage drop is concentrated across lipid bilayers that are oriented normal to the electric field.
The SC matrix resistance (Rm) and capacitance (Cm) introduced in this way are frequency independent. If
the charging time ( m) of Cm is small compared with the time of the experiment, the equivalent scheme of
the SC can be reduced to a simple voltage divider that includes four resistors in sequence, the bulk (Rb),

epidermal (Re), measurement (Rc), and matrix (Rm) resistances. It will be shown that m is less than 1 µs,
whereas the typical time resolution of the measuring device used here is ~20 µs. Instead of the first three resistors, which are voltage independent, we introduce Rt = Rb + Re + Rc (Fig. 2 b). There is good reason,
however, to assume that Rm is voltage dependent due to electroporation of the SC, where the applied
potential induces electropores in the lipid bilayers.
The mechanism of formation and electroinduced accumulation of pores in a lipid bilayer is now well understood. Due to lateral thermal fluctuations of lipid molecules, hydrophobic pores are spontaneously formed in the membrane (see inset 1 in Fig. 3). The probability of the appearance of a hydrophobic pore isdetermined by the dependence of the pore energy on its radius (Glaser et al., 1988 ). It is clear that exposure of lipid hydrophobic tails into a polar media (water) results in an increase of the pore energy with increasing radius, as illustrated by curve 1 in Fig. 3. When the radius ( ) of the pore exceeds the some critical value *, a reorientation of the lipid molecules at the edge converts the pore into a hydrophilic one with the headgroups lining the pore walls (Fig. 3, curve 2). It is clear that the hydrophilic
pore energy should increase at small radius (Fig. 3, dotted branch of curve 2). Unfortunately, the precise dependence of the hydrophilic pore energy on small values of the radius is unknown, and the theoretical description is semiquantitative. The most important feature of the resulting energy curve in Fig. 3, however, is the existence of an energy minimum at relatively small radius min
(estimated to be ~1 nm)
and an energy barrier at * (~0.4 nm), which has to be overcome for hydrophilic pore formation (Glaser etal., 1988 ). When the energy barrier and the minimum energy are sufficiently high, the population of the pores in the corresponding potential well is low. However, it has been shown (Abidor et al., 1979 ; Pastushenko et al., 1979 ) that the application of external electric field significantly reduces the height of the barrier and lowers the minimum (Fig. 3), resulting in the accumulation of metastable hydrophilic pores in the potential well.
View larger version (33K): [in this window]
[in a new window]
FIGURE 3 Energy of an electropore in a single lipid bilayer versus its radius. The hydrophobic (1) and hydrophilic (2) pores are displayed in the inset. The pore radius * corresponds to a structural rearrangement of the pore edge, and the hydrophobic pore is converted to a hydrophilic one. Pores accumulated in the local minimum min determine the electrical conductivity of the
membrane. The electric field application (1' and 2' curves) reduces the potential barrier at * and, hence, increases pore population in the potential well min as well as the membrane
conductivity.
The height of the energy barrier at * is equal to (Glaser et al., 1988 )
(1)
where W(0, *) is the height of the energy barrier in the absence of an electric field, w and m are
dielectric constants of water and the membrane, respectively, 0 is the electric constant, U1 is potential
drop across a single membrane, and d is the bilayer thickness. The second term in the right-hand part of Eq. 1 corresponds to a decrease of the electric free energy of a membrane due to a replacement of lipid material with water as a result of the cylindrical pore formation.

According to the classical theory of the rates of activated processes, the rate 1 of hydrophilic pore
formation in a single bilayer can be calculated as
(2)
where
and is the frequency of lateral fluctuations of lipid molecules, whereas a0 is the area per lipid molecule.
The subscript 1 attributes the corresponding variable to a single bilayer. For planar membranes in electrolyte solution the values of K1 and
1 are 103 s 1 cm 2 and 4.8 V 2, respectively (Glaser et al., 1988
).
To apply this theory to the case of the m-subsystem of SC we assume that pore formation in each bilayer is an independent process that is governed by a potential drop U1 = Um/m, where Um is the voltage drop
on the lipid-corneocyte matrix, and m is the number of bilayers. This approximation is appropriate when
the pore radii are small ( d) and the pore density does not exceed 108 cm 2 (Weaver and Chizmadzhev,
1996 ).
When an applied potential induces electropores, the conductance of the m-subsystem (Gm) is determined
by the density (N) of electropores in each bilayer and the number of the bilayers (m) in sequence:
(3)
where g is the conductance of a single electropore. The kinetics of hydrophilic pore formation is described by the equation (Pastushenko et al., 1979 ; Chizmadzhev and Pastushenko, 1988 )
(4)
with the initial condition N(t = 0) = No. Here Um is the voltage drop across the lipid-corneocyte matrix
with m bilayers in series. The subscript 1 of 1 attributes this quantity to a single bilayer.
The voltage drop across the SC is
(5)
and U is the applied voltage. Using Eqs. 3 and 5, it is convenient to rewrite Eq. 4 in the following form:
(6)
with the initial condition Gm(t = 0) = Gm0, where Gm
0 = N0g/m, Km = K1g/m, and m = 1/m2. In the
derivation of Eq. 6, and in accordance with an accepted approximation (Glaser et al., 1988 ), we assumedthat the single pore conductance g is independent of Um. The electrical current density I is then defined as

(7)
The results of a numerical solution to Eq. 6 will be shown and compared with the experimental data in theDiscussion.
Appendageal pathway (a)
The appendageal duct is modeled by a semi-infinite cylindrical tube with a radius r filled with an electrolyte of specific conductance . This tube crosses the SC, which is considered a dielectric separatingtwo compartments (Fig. 4). The x axis is directed along the tube with the origin at the SC boundary and a layer of epithelial cells lining the duct. Consistent with morphological evidence, it is assumed that the epithelial lining of the macropore duct consists of two cell layers (Berridge and Oschmann, 1972 ;
Odland, 1983 ). The upper surface of the SC has the coordinate x = h. The wall of the tube is
then formed by SC in the upper region ( h x 0), and the epithelial cell layer in the lower
region (x > 0). In the upper region ( h x 0), the tube wall is nonconductive. Below the SC
(x > 0), the tube wall is characterized by a specific capacitance (Cw) and a potential-induced
(electroporation) conductance (Gw = gN/m), where N is the electropore density in a single plasma
membrane, g is the conductance of a single electropore, and m is the number of plasma membranes in the tube wall. In the lower electrolyte solution the electric potential is chosen to be zero, whereas in the top solution it is determined by the experimental protocol. The potential distribution along x can be found from the balance equation for electric current averaged over the tube cross section
(8)
with initial and boundary conditions
(9)
The last condition is a consequence of zero wall conductance in the upper, SC-lined region (h x 0). We neglect the potential drop across the resistance Rb + Rc, which is small in comparison with
the applied voltage (U).
FIGURE 4 Appendageal duct modeled as a tube of radius r. Tube(or macropore) wall (w) is formed by (presumably) two layers of epithelial cells. In an entering region (h), tube walls being formed of lipid-corneocyte matrix are nonpermeable for electric current.

View larger version (30K): [in this window]
[in a new window]
The electropore density (N) is determined by the balance equation (Eq. 4), which after transformation yields an equation for the macropore wall conductance (Gw(t)) similar to Eq. 6
(10)
with the initial condition Gw(t = 0) = Gw0, where w = 1/m2, Kw = K1g/m. The parameters Kw and w are
similar to Kw and m introduced in Eq. 6 except that the number of bilayers in the macropore wall (m = 4)
differs from that for the lipid-corneocyte subsystem (m 70).
The current density across the skin sample is
(11)
where Rh = h/n r2 is the total resistance per unit area at the entrance of the appendageal macropores, n is
the surface density of the macropores, and o(t) = |x = 0. This expression includes both conductive and
capacitive currents. However, for sufficiently long time, the capacitive component is small and the appendageal resistance (Ra(t))can be calculated:
(12)
Equations 8 and 10 are nonlinear and can only be solved numerically. The results are presented in the Discussion and compared with experimental data.
For steady state, the nonlinear Eqs. 8 and 10 can be reduced to
(13)
The first integration gives a transcendental equation for the steady-state value of the potential 0(U) at the
opening of entrance region (x = 0)
(14)
which was solved numerically using the Newton method. With that result, the current-voltage dependenceand skin resistance were found using Eqs. 11 and 12. The results and a comparison with our and other published data (Kasting and Bowman, 1990a ,b ; Inada et al., 1994 ) are presented in the Discussion. Athigh voltages Eq. 14 can be simplified, and its solution is written as
(15)
For the asymptotic behavior of the macropore resistance (Ra), we obtain from Eqs. 12 and 15

(16)
One may conclude from Eq. 15 that the potential ( 0) increases less than the applied potential U (actually,
0 ln1/2U). As a consequence, the ratio 0/U tends to zero, and the macropore resistance saturates at a
value near the total resistance for the macropore opening (Ra Rh.).
Consider the potential distribution along the tube in the absence of electroporation. In this case, the potential inside the tube ( (x, t)) is described by Eq. 8, with Gw = Gw
0 = a constant. At steady state Eq. 8
reduces to Eq. 17, for all positions within the tube:
(17)
According to this equation, the potential decays exponentially along the tube as
(18)
with a characteristic length
(19)
Here 0 = |x = 0, which is a simple function of the applied potential U:
(20)
MATERIALS AND METHODS
Skin preparation
The established methods for skin sample preparation (described, for example, inPrausnitz et al., 1993 , and Pliquett et al., 1995 ) were used. Human skin wasobtained from the upper thoracic area of males and females within 24 hpostmortem (usually 6-10 h). Full-thickness sections (1-2 mm in thickness) wereused in all experiments as thinner epidermal sections may result in damage toskin appendages such as hair follicles and sweat glands. The skin was stored (dermis down) in petri disheson filters wetted by the nutrient Dulbecco's modified Eagle's medium at 4°C and 95% relative humidity for several days before use. After 7-10 days of storage, many of the samples had low resistance compared
with initial values. Therefore, experiments were performed only with samples stored less than 5 days. Justbefore the experiment, the subcutaneous fat was gently scraped from a 1-cm2 piece of skin. The samples were clamped between two half-cells, each containing 0.15 M NaCl, and were left for 2 h at room temperature (25 ± 1°C) to achieve a stable resistance value. Only samples with a resistance greater than 10 k cm2 were used. To avoid scatter of the experimental data arising from variation in the initial skin resistance, most measurements were made on the same sample.
Cell design
The design of the experimental cell was similar to that described previously (Prausnitz et al., 1993 ; Pliquett et al., 1995 ), with the skin sample immersed in an electrolyte solution between electrodes and
Top Abstract Introduction Materials & Methods Results Discussion References

the electric field applied normal to the skin surface. The measuring cell consisted of two Teflon half-cells,with an exposed skin area of 0.12 cm2. The volumes of the half-cells were 5 and 10 ml. Three electrodes
were immersed in each half-cell: two planar Ag/AgCl (with a width of 8 mm and thickness of 1 mm) and one Pd electrode (with a width of 8 mm and a thickness of 0.3 mm). The electrodes in each half-cell were parallel, with a distance between them of ~20 mm. Ag/AgCl electrodes were used for the measurement of skin resistance and capacitance before and after electrotreatment. Rectangular voltage pulses were appliedusing the Pd electrodes. A schematic diagram of the test circuit is shown in Fig. 5. The circuit consists of
separate blocks enabling the measurement of the electrical parameters of both the cell and skin sample. The electrical characteristics of the skin were measured before, during (0-8 ms), and after pulsing (1-40 min). Before the experiments, the electrical parameters of the cell without the skin were measured.
View larger version (30K): [in this window]
[in a new window]
FIGURE 5 Schematic diagram of the experimental setup for skin capacitance and resistance measurements before, during, andafter high-voltage electrotreatment. LG, low-voltage generator of triangular pulses; HG, high-voltage generator; PS, four-electrode potentiostat; C, cell with a skin sample and six (1-6) electrodes; OS1 and OS2, oscilloscopes.
Before and after pulsing
To initiate the experiment, switch K was connected to a four-electrode potentiostat PS (P84, Institute of Electrochemistry, Moscow, Russia) by two pairs of Ag/AgCl electrodes (electrodes 2-5 in Fig. 5). A low-voltage, triangular wave form (100 mV, 101-104 Hz) from a generator LG (A-100, Prosser Scientific Instruments, Ltd, Suffolk, UK) was applied to the input of PS. From the output of PS, the response of the system (current and voltage) was monitored by a two-channel oscilloscope OS1 (C1-114, Minsk, Belorus). The capacitance and resistance of the skin were calculated from the equivalent circuit shown in Fig. 2 a using a potentiodynamic method. After analyses of the prepulse characteristics, the switch K was
opened.
During the pulse (0-8 ms)
A rectangular voltage pulse (10-60 V amplitude) was applied to the Pd electrodes (1 and 6) using a generator HG (G5-82, Russia). The beginning of the voltage pulse was set as zero time. The current in thiscircuit was measured by a voltage drop (Uc(t)) on the measuring resistance (Rc = 220 ). The signal was
recorded in a one channel of the digital oscilloscope OS2 (Gould 1425, Gould Instruments, Essex, UK), and the total input signal (U(t)) from the control output of the generator HG was recorded in another
channel. All oscillograms were stored in a computer for subsequent processing. The current response (I(t))of the system to the input voltage can be determined from Uc(t) and contains information about changes in
the electrical properties of the skin. In general, I(t) contains a capacitive current that can be significant at
the initial stage of the pulsation. At longer times, however, the capacitive current becomes negligible, and the skin resistance can be estimated using the values of the measuring (Rc) and cell (Rb) resistances
according to the equivalent circuit shown in Fig. 2 a, without the skin capacitance (Cs).

The interpulse interval was chosen long enough so that skin sample resistance could be restored. To estimate the extent of skin recovery, the electrical current was measured in the course of two subsequent voltage pulses. In addition, the skin resistance was monitored just before and after each voltage pulse.
RESULTS
Cell resistance without skin
To calculate the skin resistance (Rs) during pulsing, it is necessary to know the
cell resistance (Rb), including the resistance of the electrolyte solution and the
interfacial resistance of the current electrodes. The cell resistance with 0.15 MNaCl but without skin was measured after voltage pulses ranging in amplitude
from 10 to 60 V and during the application of a small-amplitude alternatingcurrent. The Pd electrodes were maintained at +220 mV versus a normal hydrogen electrode for 1 h before the experiment to achieve a reversible state. The average value of the cell resistance (Rb) obtained
was 275 ± 25 regardless of the measurement technique. To measure the potential drop across the solution excluding a possible contribution from the electrodes, two Pd (1 and 6) and two Ag/AgCl (2 and 5) electrodes were used. A voltage pulse was applied to the Pd electrodes, and a response was measured atthe Ag/AgCl electrodes. The Ag/AgCl electrodes were connected to two channels of the oscilloscope OS2(input impedance 1M ), and the time-dependent potential was measured. The results showed that Pd electrode resistance was less than the error (±25 ) of the measured Rb value. The current-voltage
characteristic of the cell without skin was linear throughout the total range of applied voltages. Therefore we can conclude that external voltage applied to the cell with a skin sample is divided between the skin and the electrolyte solution resistances.
Current response of the skin during a rectangular pulse
In Fig. 6, four amperograms (I(t)) are shown, each obtained in the course of consecutive rectangular voltage pulses with U = 10 V (a), U = 20 V (b), U = 30 V (c), and U = 60 V (d) applied to a skin sample with the initial resistance of 1.8 M . The time interval between successive points on the curves is 20 µs. The interpulse interval was long enough so that skin resistance was restored after the previous voltage pulse (for more details, see below). The current responses were monitored for skin samples with initial resistance of approximately 100, 150, 200, 300, 500, and 750 k and 1.8 M using voltage pulses of 5, 10, 15, 20, 30, 40, 50, and 60 V for each sample. Qualitatively, all amperograms were similar. A comparison of electric current values at 10 and 20 V shows that a twofold increase of the voltage leads to a sevenfold increase of the current. These results demonstrate that in this range of voltages the skin behaves as a non-ohmic, nonlinear system, with a conductance that increases with increased voltage. At the beginning of a pulse, the current dropped to a minimal value and then slowly increased. The time to achieve this minimum decreased as the pulse amplitude increased. Measurements of I(t) made at very high time resolution (5 µs) demonstrated that this minimum cannot be detected at 40 or 60 V (data not shown). This type of current-time behavior is similar to the well known results described in the studies of reversible electroporation of planar lipid bilayers (Chernomordik et al., 1987 ), where the initial decrease of I(t) was associated with capacitive current. According to Fig. 6, the capacitive current in skin is negligible at the times longer than 300 µs for any voltage studied. In this case, the equivalent circuit of thesystem can be represented as two consecutive resistors, Rb and Rs (Fig. 2, but excluding Cs), and the skin
resistance (Rs) can be calculated from the equation
Top Abstract Introduction Materials & Methods Results Discussion References

(21)
The time-dependent skin resistance (Rs(t)) at 1 ms as a function of the applied voltage is shown in Fig. 7.
These results show a 100-fold drop in Rs as the voltage was increased from 0 to 30 V, with a fivefold
additional decrease as the voltage was increased to 60 V. The closed circles in Fig. 7 were obtained for thesame skin sample with an initial resistance of 1.8 M (see closed circles on the ordinate axis). The open circles correspond to the five samples with lower initial resistances (100-300 k ) and were obtained after averaging the resistance values at each pulse voltage. The scatter of Rs values at each voltage is less than
the circle diameter in Fig. 7. A comparison of the closed and the open circles in Fig. 7 shows that all approach a common value at high voltage. Additional experiments with exponential pulses of high amplitude (102-103 V) have demonstrated that in this voltage range, the skin resistance approaches a limiting value of ~500-1000 , independent of the initial resistance. This behavior is probably due to the potential-independent resistance of epidermis (Re, in series with the resistance of the outermost layer of
the skin, Rm). This suggestion is consistent with the results of Pliquett et al. (1995) , which show that the
resistance of very thin layers of the skin with the epidermis removed (50 to 70 µm thickness) drops to a value near 20 after electrotreatment by single voltage pulses of U 100 V. Hence, pulsation of the SC alone leads to very low resistance.
View larger version (17K): [in this window]
[in a new window]
FIGURE 6 The amperograms of a skin sample with initial resistance RS
O = 1.8 M obtained during the application of
rectangular pulses of different amplitudes (in V): (a) 10; (b) 20; (c) 30; (d) 60.
View larger version (11K): [in this window]
[in a new window]
FIGURE 7 Voltage dependence of skin resistance Rs measured
at 1 ms after the application of the pulse. and correspond to the samples with different initial resistances RS
O: , 1.8 M ; ,
100-300 k ; each open circle corresponds to the resistance averaged over five samples.
The recovery of the electrical properties of the skin after voltage pulses

The resistance of different skin samples varies widely. To diminish possible scatter in the data, primary experiments were performed on the same skin sample by the application of consecutive pulses with different amplitudes. This experimental protocol requires recovery of the skin electrical properties after each voltage pulse. For comparatively short pulse-to-pulse time intervals (1-110 ms) the shape of the I(t) curves measured during two consecutive pulses was chosen as an operative criterion of the recovery. This
was done for different voltages and interpulse pauses ( ip) of 1, 2, 4, 8, 15, 30, 60, and 110 ms. The extent
of the recovery was found to be a function of the pulse amplitude. At 60 V, the current at the beginning of the second pulse was the same as at the end of the first one (e.g., no recovery), even at ip = 110ms (Fig. 8
a). Thus, the interval ip = 110 ms is not sufficient for the recovery process after a strong pulse (60 V). On
the contrary, at 10 V and ip = 110 ms, significant recovery was observed (Fig. 8 b), but at ip = 1 ms, no
recovery was detectable at any voltage studied.
View larger version(10K):
[in this window] [in a new window]
FIGURE 8 Current response I(t) of two skin samples with different RS
O after the application of two consecutive pulses of different
amplitude with an interpulse interval of 100 ms: (a) 100 k , 60 V; (b) 200 k , 10 V.
The full recovery time ( ) was obtained from the measurement of skin resistance after the pulse (1 min and later). Skin capacitance (Cs) measured 1-2 min after the pulse coincided with the initial value for all
pulse amplitudes. In contrast, the skin resistance recovery time ( r) varied for pulses of different voltages.
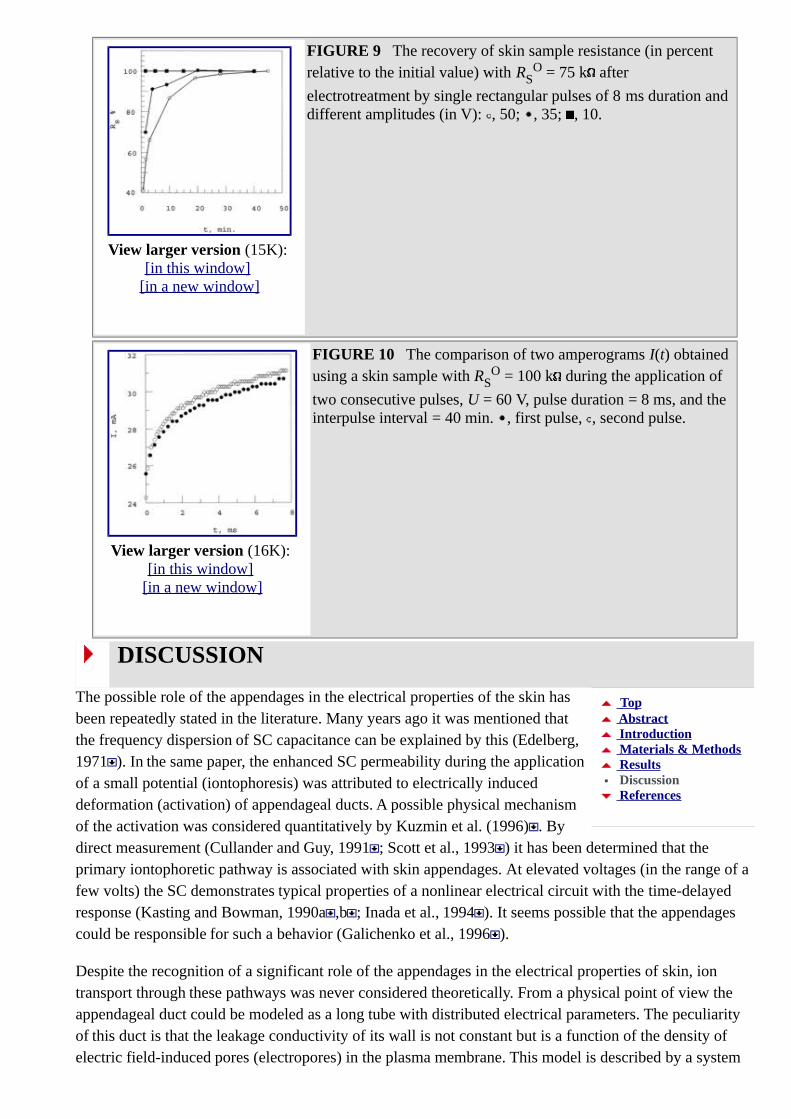
For a sample with an initial resistance of 750 k at 10 V, complete recovery after an 8-ms pulse took less than 1 min, whereas recovery after a 30-V pulse took ~30 min (Fig. 9). At 20 V, the recovery time was approximately 2 min. Therefore, a large increase in the recovery time occurs at ~30 V, the same voltage where the slope of Rs(U) changes abruptly. The recovery time depends also on the initial resistance (RS
0)
of the skin. For samples with lower RS0, r was shorter. As an additional test of complete recovery, a
measurement of I(t) was made using two consecutive pulses with a long interpulse pause (40 min). From the results in Fig. 10 it is clear that the two I(t) curves corresponding to the first and second pulses coincide, even at high voltages (60 V).
View larger version (15K): [in this window]
[in a new window]
FIGURE 9 The recovery of skin sample resistance (in percent relative to the initial value) with RS
O = 75 k after
electrotreatment by single rectangular pulses of 8 ms duration and different amplitudes (in V): , 50; , 35; , 10.
View larger version (16K): [in this window]
[in a new window]
FIGURE 10 The comparison of two amperograms I(t) obtained using a skin sample with RS
O = 100 k during the application of
two consecutive pulses, U = 60 V, pulse duration = 8 ms, and the interpulse interval = 40 min. , first pulse, , second pulse.
DISCUSSION
The possible role of the appendages in the electrical properties of the skin hasbeen repeatedly stated in the literature. Many years ago it was mentioned thatthe frequency dispersion of SC capacitance can be explained by this (Edelberg,1971 ). In the same paper, the enhanced SC permeability during the application
of a small potential (iontophoresis) was attributed to electrically induceddeformation (activation) of appendageal ducts. A possible physical mechanismof the activation was considered quantitatively by Kuzmin et al. (1996) . Bydirect measurement (Cullander and Guy, 1991 ; Scott et al., 1993 ) it has been determined that the
primary iontophoretic pathway is associated with skin appendages. At elevated voltages (in the range of a few volts) the SC demonstrates typical properties of a nonlinear electrical circuit with the time-delayed response (Kasting and Bowman, 1990a ,b ; Inada et al., 1994 ). It seems possible that the appendages could be responsible for such a behavior (Galichenko et al., 1996 ).
Despite the recognition of a significant role of the appendages in the electrical properties of skin, ion transport through these pathways was never considered theoretically. From a physical point of view the appendageal duct could be modeled as a long tube with distributed electrical parameters. The peculiarity of this duct is that the leakage conductivity of its wall is not constant but is a function of the density of electric field-induced pores (electropores) in the plasma membrane. This model is described by a system
Top Abstract Introduction Materials & Methods Results Discussion References

of the nonlinear differential equations (Eqs. 8 and 10) for electric potential ( ) and tube wall conductance (Gw; or electropores density) as a function of time t and coordinate x along the tube. These equations were
solved numerically.
To compare the results of calculations with experimental data we should specify all parameter values. According to morphological data (Odland, 1983 ), the macropore radius r is ~10-20 µm. Near the entrance region of a macropore (see Fig. 1) the lipid-corneocyte layers of the SC bend and stretch along the x axis (especially in the case of hair follicles). At increasing depth, the SC surrounding a macropore gradually disappears, leaving only the remaining layers of epithelial cells. The length of the entrance region h can be estimated roughly as 40-100 µm (Scheuplein, 1967 ). It seems reasonable to assume that electrolyte conductivity inside the macropore is of the same order of magnitude as in the bulk solutions ( ~ 10 2 1 cm 1). The macropore wall capacitance (Cw) and conductance (Gw
o) can be estimated from
typical data for a cell membrane, where Cc is ~10 6 F/cm2, and Gco is ~10 4 1 cm 2. Assuming that
beyond the entrance region the tube wall is formed of one to two layers of epithelial cells (Berridge and Oschmann, 1972 ; Odland, 1983 ) (corresponding to two to four plasma membranes; m 2-4), we obtain Cw (Cc/m) of ~0.5 × 10 6 to 0.25 × 10 6 F/cm2, and Gw
0 (Gc0/m) of ~0.5 × 10 4 to 0.25 × 10 4
1 cm 2. Keeping in mind that Gw0 = Nog/m (see Eq. 3), the preexisting electropore density (No) is
estimated to be ~106 cm 2, if the electropore conductance (g) is assumed to be ~10 10 1 (Glaser et al., 1988 ). The values for electroporation kinetic parameters are based on published data for model membranes (Glaser et al., 1988 ), where 1 = 4.8 V 2 and K = 103 s 1 cm 2. In our analysis, w ( 1/m2)
is approximately 1-0.2 V 2 and Kw (Kg/m) is ~10 7 1 s 1 cm 2. As a large number of these parameters
are only approximately known, we do not attach any great importance to a quantitative agreement between the theoretical results and experimental data. The explanation of the qualitative features of a wide spectrum of different experimental data concerning electrical properties of the skin is much more important.
Potential distribution
Consider a general time-dependent potential distribution taking into account electroporation (Fig. 11). After the application of voltage U at t = 0, the total potential difference drops instantaneously at the
entrance domain h x 0, and hence, (0,0) = 0. As a result of this charging process, 0(t)
increased rapidly. The same is true for the potential (x, t) at any x, but with some time delay. This behavior of the potential (x, t) is illustrated in Fig. 11, curves 1-5, where the time is increasing with each
curve number. The steady-state distribution due to electroporation is also shown by curve 6, which can be compared with the absence of electroporation, shown by curve 0. These results indicate that the tube resistance decreased due to electroporation. The characteristic length (L) of the potential distribution (no electroporation, curve 0) can be estimated from Eq. 19 to be ~3 mm, using values of Gw
0 0.4 × 10 4 1 cm 2, r 10 3 cm, and ~ 10 2 1 cm 1. The characteristic time ( a) to establish steady state in the
absence of the electroporation can be evaluated from Eq. 8 as
(22)
The results of a numerical calculation for o(t) at U = 4 V are shown in Fig. 12. The characteristic time of
o(t) without electroporation (shown by the dashed curve in Fig. 12) is in the range of milliseconds, in
agreement with the estimation shown in Eq. 22. For electroporation the situation is more complicated.

One can see from Fig. 12 (solid curve) that there are now two different characteristic times, one for the fast increase (~0.2 ms) and another for the slow decrease (~10 s) of o(t). It can be seen from Fig. 11 that
at time t, the function (x, t) cannot be characterized by a single characteristic length. Rather, it changes very steeply at small x but much more gradually at greater x. At 2 ms, o(t) becomes close to the value of
~3.9 V, which is a limiting level for o(t) at t , in the absence of poration (the dashed curve in Fig. 12).
In the case of electroporation, o(t) reached maximum and then decreased to a limiting value near 3 V,
similar to the value obtained by numerical calculations. This behavior is a consequence of the electroporation dynamics and potential redistribution along the macropore tube.
View larger version (29K): [in this window]
[in a new window]
FIGURE 11 Potential distribution (x) along a tube at different moments of time (in ms) calculated using Eqs. 8-10: 0, steady-state solution without electroporation; 1-6, time-dependent solutions taking into account electroporation: 1, 0.01; 2, 0.1; 3, 1;4, 10; 5, 100. The following parameter values were used:
w = 1 V 2, h = 4 × 10 3 cm, r = 10 3 cm, = 10 2 1 cm 1,
GWO = 4 × 10 5 1 cm 2, Cw = 5 × 10 7 F cm 2, Kw = 4 × 10
7 1 cm 2 s 1.
View larger version (22K): [in this window]
[in a new window]
FIGURE 12 Time dependence of (x = 0) after the application of rectangular voltage step U = 4 V calculated using Eqs. 8-10. The dashed curve corresponds to the absence of electroporation. The values of all parameters are the same as in Fig. 11.
It is interesting to note a peculiar feature of the function o(U, t ). According to Eq. 15, the potential
o(U, t ) increased less than U so that the ratio o/U tends to zero. For example, estimating the value of
o at maximal voltage used in our experiments (U = 60 V) and the extent of the resistance saturation using
the following set of parameters ( w = 0, 2 V 2, Gw = 4 × 10 5 1 cm 2, = 10 2 1 cm 1,
r = 1.3 × 10 3 cm, h = 8 × 10 3 cm, n = 10 cm 2), we obtain o 7.8 V, and o/U 0.13 1. At this
value of o, the resistance deviates from the limiting value Rh by ~13%.
With these results in mind, it is not difficult to calculate current-voltage curves, skin resistance, and current dynamics in various potential ranges.
Domain of comparatively low voltages (U 4 V)

It is useful to compare the theory described above with published data for the steady state current-voltage characteristics of human skin (Kasting and Bowman, 1990a ,b ). The current-voltage results in Fig. 13 were obtained by a numerical solution of Eqs. 8 and 10. The values of the parameters used in this solutionare presented in the figure legend. It is clear that the experimental data (open circles in Fig. 13) fit well to the theoretical curve, using reasonable parameter values. The deviation of the current-voltage curve from linearity arises from nonlinear dependence of the electroporation rate on voltage. The time to achieve steady state reflects the kinetics of electroporation and propagation of electric potential profile along a macropore.
View larger version (21K): [in this window]
[in a new window]
FIGURE 13 The comparison of theoretical (see Eqs. 11-14) current-voltage characteristic of skin sample ( ) with experimental data ( ) from Kasting and Bowman (1990) . The values of the parameters (except w = 0.4 V 2 and h = 8.8 × 10 3
cm) were the same as in Fig. 11.
From the results presented in Figs. 11 and 12, it is clear that capacitive current is important at short times (<1 ms) at low potential but is negligible at longer times. Hence, at longer times it is possible to calculate the dynamics of macropore resistance in time. This is illustrated by the curve in Fig. 14, which was
calculated numerically using Eqs. 8 and 10-12. The values of all parameters are presented in the legend toFig. 14. In the figure, the experimental data of Inada et al. (1994) , obtained at 4 V (closed circles) and 0.5 V (squares), are also shown. The calculated and measured skin resistances decrease sharply at short times, especially at U > 1 V, and slowly saturate at longer times. For U = 0.5 V, the skin resistance remains virtually constant. In Fig. 15, the resistance decay at 10 s during the application of different voltages (0 U 4 V) is presented. The experimental points (closed circles) are taken from Inada et al.
(1994) , and the curve is a result of theoretical calculations. Although agreement between the theory and experimental results is generally good, the reason for the slight discrepancy at intermediate voltages is notclear.
View larger version (13K): [in this window]
[in a new window]
FIGURE 14 Dependence of the specific skin resistance Rs on
time at two voltages: 0.5 and 4 V. As 100%, the value of 43.8 k cm2 was chosen. The experimental data at corresponding voltages ( and ) are taken from Inada et al. (1994) . The valuesof the parameters (except w = 0.65 V 2) are the same as in Fig.
11.

View larger version (16K): [in this window]
[in a new window]
FIGURE 15 Dependence of the specific skin resistance Rs on
applied voltage at t = 10 s. As 100%, the value Rs = 43.8 k cm2
was chosen. , experimental data from Inada et al. (1994) . The values of the parameters are the same as in Fig. 11.
As discussed by Kasting and Bowman (1990a ,b ) and Inada et al. (1994) , the time-dependent, nonlinear current-voltage characteristics of the skin can be attributed to electroporation. The theoretical
consideration presented here provides a background for the quantitative analysis of the problem and confirms skin electroporation at low voltages, as stated by those authors. This theoretical analysis also shows that skin appendages at these voltages are the targets for electroporation.
Domain of higher voltages (10 V U 60 V)
The valuable advantage of our experimental data in comparison with published results (Kasting and Bowman, 1990a ,b ; Inada et al., 1994 ; Pliquett et al., 1995 ) consists in higher time resolution (tens ofmicroseconds) and a wider range of applied voltages. This gives the ability to monitor both capacitive andelectroporation currents and to investigate the skin structures (lipid-corneocyte matrix or appendages) where new transport pathways may be created by the applied electric field. The shape of amperograms in Fig. 6 provides a number of important insights. The initial, rapid decrease in current shown in Fig. 6, a and b, can be attributed to capacitive charging of the skin. In our experimental system, the characteristic time ( s) of this process is ~200 µs. There are two parallel ion-transport pathways crossing the outer layer
of the skin, one going across lipid-corneocyte matrix (m) and the other through skin appendages (a; see Fig. 1). Both pathways have capacitive elements. We can estimate a charging time ( m) for the m-
subsystem for our experimental conditions. The skin capacitance (Cs) measured at 10 kHz was 2 nF, in
agreement with published results (Oh et al., 1993 ). As shown in Fig. 2, this value includes two capacitors in parallel, so Cm should be smaller than 2 nF. The experimental cell and epidermis resistance
(Rt) is ~1 k , so that m RtCm 2 µs. This estimated m is ~1% of the measured value (200 µs). Thus,
it is unlikely that the capacitive effect is associated with the lipid-corneocyte matrix. Alternatively,
estimations of s according to the appendageal model, obtained by fitting the numerical solution of Eqs. 8
and 10 to the measured (at 10 V, RS0 = 750 k ) amperogram (Fig. 16), results in a good agreement with a
measured value of s near 200 µs. Thus, at low voltage, capacitive current is primarily associated with the
skin appendages.

View larger version (23K): [in this window]
[in a new window]
FIGURE 16 A comparison of theoretical ( ) results with experimental data ( ) for I(t) at U = 10 V. The following values of the parameters were adopted: w = 0.2 V 2, h = 7.7 × 10 3 cm,
r = 1.3 × 10 3 cm, Cw = 10 6 F cm 2, n = 10 cm 2. The other
parameters are the same as in Fig. 11.
At elevated voltages, s is smaller, and above 40 V it cannot be measured (Fig. 6, c and d). The smaller
experimental value for s at high voltage relative to the value predicted by Eq. 22 results from a decrease
in the characteristic length (L) when the macropore wall conductivity (Gw) increased due to
electroporation. Correspondingly, as a (Eq. 22) is proportional to L2, it also decreases. For example, at a
high degree of electroporation (e.g., high voltage) when L 20 µm, we obtain a 0.15 µs, using for the
resistance the value of so-called spreading resistance (Newman, 1973 ), Rsr 1/ r 20 k . This
estimation is confirmed by rigorous numerical solutions that are similar to that shown in Fig. 16.
Additional conclusions can be drawn from the values of electric current at the minimum of I(t). First consider the results shown in Fig. 6 a, which corresponds to a skin sample with high initial resistance (RS
0 = 1.8 M ,), at U = 10 V. At the end of the capacitive current (~0.2 ms), the skin resistance can be
estimated as 10 V/50 µA = 200 k , which is nine times smaller than RS0. This result suggests that the
rapid decrease of I(t) is a superposition of the capacitive and leakage currents, the latter increased due to electroporation. The rate of electroporation (Eq. 10) is an exponential function of 2. At U = 10 V, the electrical potential near the macropore opening is large enough to cause rapid electroporation in this region. The rate of pore generation decreases along the x axes due to the potential drop. As shown in Fig. 11 (curves 1-5), the region of the macropore affected by electroporation increases with time. This explainsthe gradual increase of I with t illustrated in Fig. 6. Qualitatively, the amperograms shown in Fig. 6 a and b, are similar to I(t) curves obtained in the studies of reversible electroporation of lipid and cell membranes (Chernomordik et al., 1983 , 1987 ; Glaser et al., 1988 ; Tsong, 1991 ; Weaver and Chizmadzhev, 1996 ). There are, of course, some differences because the macropore is, in reality, a system with distributed parameters, whereas our model of a tube with homogeneous properties as a function of depth is a rather bold simplification.
As mentioned above, the capacitive current at times greater than ~1 ms becomes negligible, and the skin resistance can be calculated by Eq. 21. The dependence of Rs (t = 1 ms) on voltage is presented in Fig. 7,
which shows that Rs decreased by over 100-fold from 0 to 30 V, but decreased only about two-fold from
30 to 60 V. The recovery time of skin resistance as a function of voltage also changes significantly at 30 V. These observations suggest a change of the operative small ion transport mode from the appendagesto lipid-corneocyte matrix at ~30 V. At 10 V, the potential drop on each SC bilayer is approximately 100 mV, whereas at 40 V it is ~400 mV, sufficient for effective electroporation. Remember also that the electroporation rate is an exponential function of the applied potential (see Eqs. 6 and 10). At the same
time, however, 10 V is more than sufficient to cause electroporation of the two layers of epithelial cells lining the appendageal ducts.

Consider the theoretical resistance-voltage curves (Rs(U)) for the appendageal and lipid-corneocyte
pathways (shown in Fig. 2 b) obtained as a solution of Eqs. 8-10 and 6, respectively. The results of numerical calculations are shown in Fig. 17, where curve 1 corresponds to the appendageal subsytem, curve 2 corresponds to the lipid-corneocyte subsytem, and curve 3 corresponds to their superposition. Thecalculated appendageal resistance decreased at low voltages and saturated after 20 V. In contrast, the calculated SC resistance was constant up to 20 V, decreased markedly in the interval between 20 and 30 V, and then changes little at higher voltages. At potentials below 20 V, the theoretical lipid-corneocyte
resistance (Rm) is much higher than appendageal Ra, whereas the opposite is true (Ra Rm.) above 30 V. A
superposition of these two pathways leads to a good fit to the experimental data. Therefore the electrical properties of the skin below 20 V are defined by appendages and above 30 V by the lipid-corneocyte matrix. Within the interval between 20 and 30 V, both pathways are operative. At small voltages (10 V), the time-dependent current across the skin was described by a theory developed for appendageal macropores and illustrated in Fig. 16. The fitting of the theory for the lipid-corneocyte pathway with the data between 30 and 60 V (see Fig. 18) is also satisfactory. The value of the electroporation parameter
m = 0.02 V 2 chosen here is small compared with the case of appendages, w = 0.2 V 2, because the
number of bilayers in sequence in the SC is higher.
View larger version (26K): [in this window]
[in a new window]
FIGURE 17 Skin resistance as function of voltage. Theoretical curves are for (1) appendageal pathway; (2) lipid-corneocyte pathway; (3) superposition of both pathways. , experimental datahave been obtained for skin sample with RS
O = 0.75 M (see also
Results for details). The following values of the parameters were used for pathway 2: m = 0.02 V 2, Rt = 1.3 k , Gm
O = 6 × 10 7
1, Km = 5 × 10 9 1 s 1 cm 2. For the appendageal pathway
(1), all of the parameters are the same as in Fig. 16.
View larger version (34K): [in this window]
[in a new window]
FIGURE 18 Time behavior of electric current for skin sample with RS
O = 0.75 M at different voltages (in V): (1) 30; (2) 35; (3)
40; (4) 50; (5) 60. Solid curves were calculated using Eqs. 6 and 7 for the same parameters as in Fig. 17 for the appendageal pathway., experimental data for different voltages (see Results for details).
The resistance recovery data are also in agreement with consecutive electroporation of two subsystems: the appendages below 30 V and the lipid-corneocyte matrix above 30 V. The data presented in Fig. 8 showthat just below 30 V the recovery time is less than 1 min, whereas at 10 V it is only a few seconds. Above

30 V, however, a large increase in the recovery time is noted. The lipid-corneocyte subsystem is much more complicated than the two layers of epithelial cells lining the macropores. Experimental data show that electrotreament induces structural reorganization of the lipid-corneocyte matrix (Craane-van-Hinsberg et al., 1995 ). Moreover, the SC experiences spontaneous localization of electroporation away from the appendages (Pliquett et al., 1995 , 1996 ; Zewert et al., 1995 ). Hence, it is reasonable to explain the considerable increase in recovery time by a transition of the electroporation target from the appendages to the lipid-corneocyte subsystem.
Comparison with results obtained for lipid bilayers (Chernomordik et al., 1983 ; Glaser et al., 1988 ) andindividual cells (Chernomordik et al., 1987 ) shows that electropore resealing time for lipid is in the range from 10 s up to a few minutes, whereas in cell membranes it increases up to dozens of minutes. Thelonger times associated with cell membranes is due to the stabilizing effect of membrane proteins (Chernomordik et al., 1987 ). The data presented in Fig. 9 show that below 30 V the recovery time ( r)
is
less than 1 min, and at 10 V, it is only a few seconds. At 30 V, however, a large increase of r occurs.
Structural reorganization of the SC can occur in this region (Craane-van-Hinsberg et al., 1995 ), and therefore, it seems plausible that above 30 V, when the electroporation occurs within the lipid-corneocyte matrix, the resealing time drastically increases.
In conclusion, our results demonstrate the similarity between the skin and model or cell membrane behavior under electrotreatment. The amperograms in Fig. 6 demonstrate current-time behavior typical forthe electroporation of lipid bilayers. The skin resistance recovery time is also similar to values for pore resealing in model and cell membranes. In addition, our results indicate the morphological location of electric field effects within the skin. Below 30 V appendageal ducts are susceptible to electroporation and play a key role in the formation of new transdermal pathways for electric current. At higher voltages, however, the appendageal resistance saturates and electroporation of the lipid-corneocyte matrix develops to further increase current flow. Thus, the current carrying-pathways within the skin differ at low (appendages) versus high (lipid-corneocyte matrix) voltage.
ACKNOWLEDGMENTS
We are obliged to U. Pliquett and B. Bommannan for fruitful discussions and Galina Voronia for valuable assistance during production of this manuscript.
This work was supported by Cygnus, Inc., National Institutes of Health grant RO1-ARH 4921, Whitaker Foundation grant RR 10963, and Russian Foundation for Basic Research grant 96-03-34059.
FOOTNOTES
Received for publication 9 April 1997 and in final form 4 November 1997.
Address reprint requests to Dr. Russell O. Potts, Cygnus, Inc., 400 Penobscot Drive, Redwood City, CA 94063. Tel.: 650-599-3523; Fax: 650-599-2519; E-mail: [email protected].
REFERENCES
• Abidor, I. G., V. B. Arakelyan, L. V. Chernomordik, Y. A. Chizmadzhev, V. F. Pastushenko, and M.R. Tarasevich. 1979. Electric breakdown of bilayer membranes. I. The main experimental facts and their qualitative discussion. Bioelectrochem. Bioenerg. 6:37-52.

• Benz, R., F. Beckers, and U. Zimmermann. 1979. Reversible electricalbreakdown of lipid bilayer membranes: a charge-pulse relaxation study. J. Membr. Biol. 48:181-204[Medline].
• Berridge, M. J., and J. L. Oschmann. 1972. Transporting Epithelia.Academic Press, New York. 68.
• Bommannan, D., J. A. Tamada, L. Leung, and R. O. Potts. 1994. Effectof electroporation on transdermal iontophoretic delivery of luteinizinghormone releasing hormone (LHRH) in vitro. Pharm. Res. 11:1809-1814[Medline].
• Burnette, R. R. 1989. Iontophoresis. In Transdermal Drug Delivery: Developmental Issues and Research Initiatives. J. Hadgraft, and R. H. Guy, editors. Marcel Dekker, New York. 247-291.
• Chizmadzhev, Y. A., V. Zarnytsin, J. C. Weaver, and R. O. Potts. 1995. Mechanism of electroinduced ionic species transport through a multilamellar lipid system. Biophys. J. 6:749-765.
• Chernomordik, L. V., S. I. Sukharev, I. G. Abidor, and Y. A. Chizmadzhev. 1983. Breakdown of lipid bilayer membranes in an electric field. Biochim. Biophys. Acta. 736:203-213.
• Chernomordik, L. V., S. I. Sukharev, S. V. Popov, V. F. Pastushenko, A. V. Sokirko, I. G. Abidor, and Y. A. Chizmadzhev. 1987. The electrical breakdown of cell and lipid membranes: the similarity of phenomenologies. Biochim. Biophys. Acta. 902:360-373[Medline].
• Chizmadzhev, Y. A., and V. F. Pastushenko. 1988. Theory of electrical breakdown of planar lipid bilayers. In Thin Liquid Films. J. B. Ivanov, editor. Marcel-Dekker, Basel, Switzerland. 1059-1120.
• Craane-van-Hinsberg, W. H. M., F. Spies, J. Verhoff, G. Gooris, J. A. Bouwstra, H. E. Junginger, and H. E. Bodde. 1995. Electroperturbation of the human skin barrier in vitro: effects on stratum corneum impedance and lipid fine structure. Int. PPP Conf., 4th. 4a:C87.
• Cullander, C. 1992. What are the pathways of iontophoretic current flow through mammalian skin? Adv. Drug Del. Rev. 9:19-135.
• Cullander, C., and R. H. Guy. 1991. Sites of iontophoretic current flow into the skin: identificationand characterization with the vibrating probe electrode. J. Invest. Dermatol. 97:55-64[Abstract].
• DeNuzzio, J. D., and B. Berner. 1990. Electrochemical and iontophoretic studies of human skin. J.Controlled Release. 11:105-112.
• Edelberg, R. 1971. Electrical properties of skin. In Biophysical Properties of the Skin. H. R. Elden, editor. John Wiley and Sons, New York. 513-550.
• Elias, P. 1983. Epidermal lipids, barrier function and desquamation. J. Invest. Dermatol. 80:44s-49s[Medline].
• Elias, P. M., N. S. McNut, and D. S. Friend. 1977. Membrane alterations during cornification of mammalian squamous epithelia: a freeze-fracture, tracer and thin-section study. Anat. Rec. 189:577-599[Medline].
• Galichenko, S. V., P. I. Kuzmin, and Y. A. Chizmadzhev. 1996. Electroporation of skin appendagesunder iontophoretic conditions: theoretical approach. Membr. Cell Biol. 10:467-475.
• Glaser, R. W., S. L. Leikin, L. V. Chernomordik, V. F. Pastushenko, and A. I. Sokirko. 1988. Reversible electrical breakdown of lipid bilayers: formation and evolution of pores. Biochim. Biophys. Acta. 940:275-287[Medline].
• Holbrook, K. A., and G. F. Odland. 1974. Regional differences in the thickness (cell layers) of the human stratum corneum: an ultrastructural analysis. J. Invest. Dermatol. 62:415-422[Medline].
• Inada, H., A. H. Ghanem, and W. I. Higuchi. 1994. Studies on the effects of applied voltage and duration on human epidermal membrane alteration. Pharm. Res. 11:687-697[Medline].
• Kasting, G. G., and L. A. Bowman. 1990a. DC electrical properties of frozen, excised human skin.Pharm. Res. 7:134-143[Medline].
• Kasting, G. G., and L. A. Bowman. 1990b. Electrical analysis of fresh excised human skin: a comparison with frozen skin. Pharm. Res. 7:1141-1146[Medline].
• Kuzmin, P. I., A. S. Darmostuk, Y. A. Chizmadzhev, H. S. White, and R. O. Potts. 1996. Mechanism of skin appendage macropores electroactivation during iontophoresis. Membr. Cell Biol. 10:699-706.
• Lakshminarayanaiah, N. 1984. Equations of Membrane Biophysics. Academic Press, New York. 230 pp.
Top Abstract Introduction Materials & Methods Results Discussion References

• Madison, K. D., D. C. Swartzendruber, P. W. Wertz, and D. T. Downing. 1987. Presence of intact intercellular lipid lamellae in the upper layers of the stratum corneum. J. Invest. Dermatol. 88:714-718[Abstract].
• Monteiro-Riviere, N. A., A. O. Inman, and J. E. Riviere. 1994. Identification of the pathway of iontophoretic drug delivery: light and ultrastructure studies using mercuric chloride in pigs. Pharm. Res. 11:251-256[Medline].
• Newman, J. 1973. Electrochemical Systems. Prentice-Hall, Englewood Cliffs, NJ. 375-387. • Odland, G. F. 1983. Structure of the skin. In Biochemistry and Physiology of the Skin. L. A.
Goldsmith, editor. Oxford University Press, Oxford. 3-63. • Oh, S. Y., L. Leung, D. Bommannan, R. H. Guy, and R. O. Potts. 1993. Effect of current ionic
strength and temperature on the electrical properties of skin. J. Controlled Release. 9:137-176. • Pastushenko, V. F., Y. A. Chizmadzhev, and V. B. Arakelyan. 1979. Calculation of the membrane
life-time in the steady-state diffusion approximation. Bioelectrochem. Bioenerg. 6:53-62. • Pliquett, U., R. Langer, and J. C. Weaver. 1995. Changes in the passive electrical properties of
human stratum corneum due to electroporation. Biochim. Biophys. Acta. 1239:111-121[Medline]. • Pliquett, U., T. E. Zewert, T. Chen, R. Langer, and J. C. Weaver. 1996. Imaging of fluorescent
molecule and small ion transport through human stratum corneum during high-voltage pulsing: localized transport regions are involved. J. Biophys. Chem. 58:185-204.
• Potts, R. O., and R. H. Guy. 1992a. Predicting skin permeability. Pharmaceutical Res. 96:495-499.• Potts, R. O., R. H. Guy, and M. L. Francoeur. 1992b. Routes of ionic permeability through
mammalian skin. Solid State Ionics. 53-56:165-169. • Prausnitz, M. R., V. G. Bose, R. Langer, and J. C. Weaver. 1993. Electroporation of mammalian
skin: a mechanism to enhance transdermal drug delivery. Proc. Natl. Acad. Sci. USA. 90:10504-10508[Abstract].
• Scheuplein, R. S. 1967. Mechanism of percutaneous transport. II. Transient diffusion and the relative importance of various routes of skin penetration. J. Invest. Dermatol. 48:79-88[Medline].
• Scott, E. R., A. I. Laplaza, H. S. White, and J. B. Phipps. 1993. Transport of ionic species in skin: contribution of pores to the overall skin conductance. Pharm. Res. 10:1699-1709[Medline].
• Swartzendruber, D. C., P. W. Wertz, D. J. Kitko, K. C. Madison, and D. T. Downing. 1989. Molecular models of the intercellular lipid lamellae in mammalian stratum corneum. J. Invest. Dermatol. 92:251-257[Abstract].
• Swartzendruber, D. C., P. W. Wertz, K. C. Madison, and D. T. Downing. 1987. Evidence that the corneocyte has a chemically bound lipid envelope. J. Invest. Dermatol. 88:709-713[Abstract].
• Tsong, T. Y. 1991. Electroporation of cell membranes. Biophys. J. 60:297-306[Abstract]. • Weaver, J. C., and Y. A. Chizmadzhev. 1996. Theory of electroporation: A Review.
Bioelectrochem. Bioenerg. 41:135-160. • Weaver, J. C., and Y. A. Chizmadzhev. 1996. Electroporation. In CRC Handbook of Biological
Effects of Electromagnetic Fields, 2nd ed. C. Polk, and E. Postow, editors. CRC Press, Boca Raton, FL. 247-274.
• Zewert, T. E., U. F. Pliquett, R. Langer, and J. C. Weaver. 1995. Transport of DNA antisense oligonucleotides across human skin by electroporation. Biochem. Biophys. Res. Commun. 212:286-292[Medline].
Biophys J, February 1998, p. 843-856, Vol. 74, No. 2© 1998 by the Biophysical Society 0006-3495/98/02/843/14 $2.00
This article has been cited by other articles:
T. R. GOWRISHANKAR, U. PLIQUETT, and J. C. WEAVERChanges in Skin Structure and Electrical Properties following High Voltage ExposureAnn. N.Y. Acad. Sci., October 30, 1999; 888(1): 183 - 194. [Abstract] [Full Text]

S. A. Gallo, A. Sen, M. L. Hensen, and S. W. HuiTime-Dependent Ultrastructural Changes to Porcine Stratum Corneum Following an Electric PulseBiophys. J., May 1, 1999; 76(5): 2824 - 2832. [Abstract] [Full Text]
S. HuiLow voltage electroporation of the skin, or is it iontophoresis?Biophys. J., February 1, 1998; 74(2): 679 - 680. [Full Text]
HOME HELP FEEDBACK SUBSCRIPTIONS ARCHIVE SEARCH TABLE OF CONTENTS
Copyright © 1998 by the Biophysical Society.
Abstract of this Article
Reprint (PDF) Version of this Article
Similar articles found in:Biophys. J. Online PubMed
PubMed Citation
This Article has been cited by:
Search Medline for articles by: Chizmadzhev, Y. A. || Potts, R. O.
Alert me when: new articles cite this article
Download to Citation Manager