electrocorticogram encoding of upper extremity movement
TRANSCRIPT
Electrocorticogram encoding of upper extremity movement duration
Po T. Wang1, Christine E. King1, Colin M. McCrimmon1, Susan J. Shaw2,3, David E. Millett2,3,Charles Y. Liu4,5, Luis A. Chui6, Zoran Nenadic1,7 and An H. Do6
Abstract— Electrocorticogram (ECoG) is a promising long-term signal acquisition platform for brain-computer interface(BCI) systems such as upper extremity prostheses. Severalstudies have demonstrated decoding of arm and finger tra-jectories from ECoG high-gamma band (80-160 Hz) signals.In this study, we systematically vary the velocity of threeelementary movement types (pincer grasp, elbow and shoulderflexion/extension) to test whether the high-gamma band encodesfor the entirety of the movements, or merely the movementonset. To this end, linear regression models were created forthe durations and amplitudes of high-gamma power bursts andvelocity deflections. One subject with 8×8 high-density ECoGgrid (4 mm center-to-center electrode spacing) participated inthe experiment. The results of the regression models indicatedthat the power burst durations varied directly with the move-ment durations (e.g. R2=0.71 and slope=1.0 s/s for elbow). Thepersistence of power bursts for the duration of the movementsuggests that the primary motor cortex (M1) is likely activefor the entire duration of a movement, instead of providinga marker for the movement onset. On the other hand, theamplitudes were less co-varied. Furthermore, the electrodes ofmaximum R2 conformed to somatotopic arrangement of thebrain. Also, electrodes responsible for flexion and extensionmovements could be resolved on the high-density grid. Insummary, these findings suggest that M1 may be directlyresponsible for activating the individual muscle motor units,and future BCI may be able to utilize them for better controlof prostheses.
I. INTRODUCTION
Subdurally-recorded electrocorticogram (ECoG) is apromising long-term signal acquisition platform for brain-computer interface (BCI) systems, such as upper extremityprostheses. Several studies have shown that arm and fingertrajectories [1], [2], [3], [4], [5], [6], [7] can be decoded fromECoG signals. However, the performance of these decodershas been modest. Thus, a better understanding of ECoGmotor control may improve the design of trajectory decoders.
Our previous studies [8], [9] have demonstrated that thepower of ECoG in the high-γ band (80-160 Hz) strongly cor-relates with kinematic parameters of upper extremity move-
Work supported by the National Science Foundation (Award #1134575)1Department of Biomedical Engineering, University of California, Irvine
(UCI), CA, USA {ptwang, kingce, cmccrimm, znenadic}@uci.edu2Department of Neurology, Rancho Los Amigos National Rehabilitation
Center (RLANRC), Downey, CA, USA {millett, shaws}@usc.edu3Department of Neurology, University of Southern California (USC), Los
Angeles, CA, USA4Department of Neurosurgery, RLANRC, Downey, CA, USA
[email protected] of Neurosurgery, USC, Los Angeles, CA, USA6Department of Neurology, UCI, Irvine, CA, USA {and,
lchui}@uci.edu7Department of Electrical Engineering and Computer Science, UCI,
Irvine, CA, USA
ments. Specifically, the high-γ power bursts have waveformsthat resemble the velocity of elementary arm movements.However, these experiments did not systematically vary themovement velocity, and so it remains unclear whether ahigh-γ power burst is responsible for the entire duration ofmovement or merely encodes for the movement onset. Tothis end, the velocity of various elementary upper extremitymovements was systematically varied to better characterizemotor control strategies in ECoG.
II. METHODS
A. Signal Acquisition
This study was approved by the Institutional ReviewBoard of the Rancho Los Amigos National RehabilitationCenter. Subjects were recruited from a patient populationundergoing temporary subdural electrode implantation forepilepsy surgery evaluation. Subject selection was limitedto those with electrodes covering the primary motor cortex(M1) upper extremity representation area. Up to 64 channelsof ECoG data were recorded using a pair of linked NeXus-32bioamplifiers (Mind Media, Roermond-Herten, The Nether-lands), and signals were acquired at a 2048-Hz sample ratewith common average referencing.
B. Experimental Task
A subset of elementary upper extremity movements [10]was performed on the side contralateral to the ECoG elec-trode implant: 1. pincer grasp and release (PG); 2. elbow flex-ion and extension (E); and 3. shoulder forward flexion andextension (SFE). Prior to each movement, an appropriate sen-sor to measure angular trajectory was mounted and calibratedusing conventional goniometry. Specifically, the trajectory ofPG was measured by a custom-made electrogoniometer [11],while E and SFE movements were measured by a gyroscope(Wii Motion Plus, Nintendo, Kyoto, Japan). The trajectorysignals (position, θ, and velocity, θ) were acquired using amicrocontroller unit (Arduino, Smart Projects, Turin, Italy).ECoG data were synchronized with the trajectory signalsusing a common pulse train sent to both acquisition systems.
Each movement type was performed at fast, moderate,and slow speeds (see Table I for details) as guided by avideo animation representing the moving joint. The videocued the subjects to fully flex the joint at the specifiedspeed, followed by holding the joint stationary (idling) for aspecific duration. This was then followed by a full extensionmovement and another idling period. The idling periodswere introduced to prevent temporal overlapping of flexionand extension ECoG features, which we observed in earlier
978-1-4244-7929-0/14/$26.00 ©2014 IEEE 1243
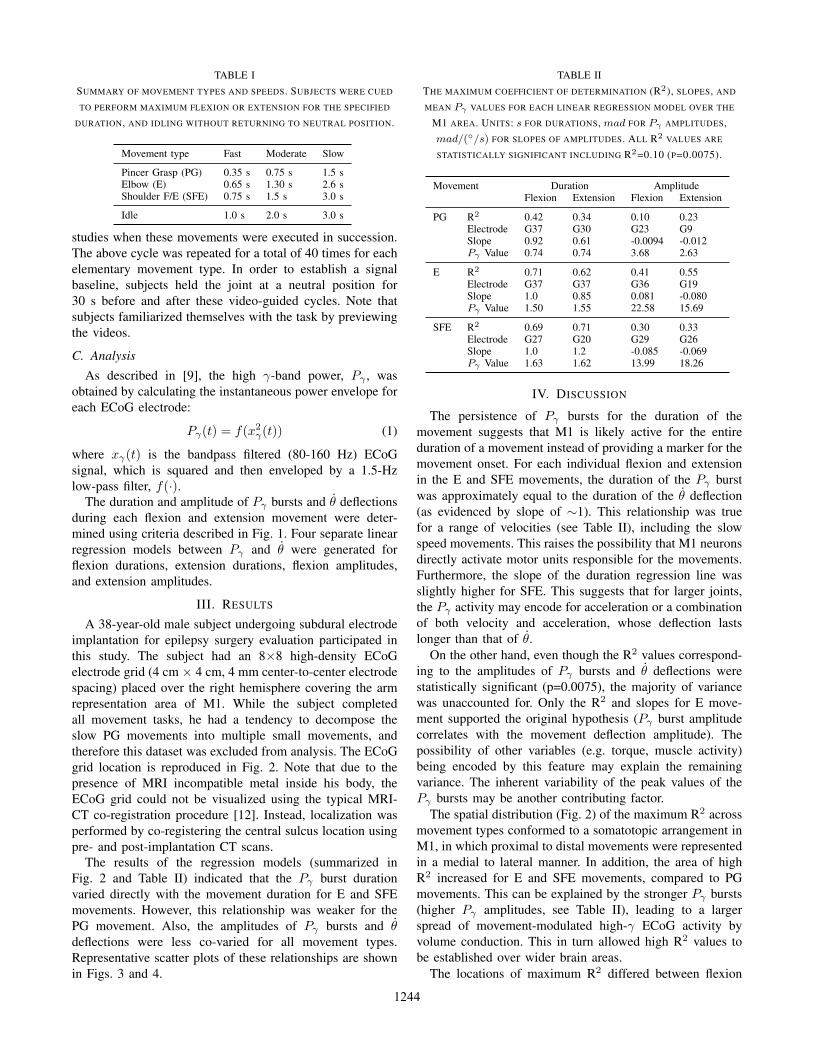
TABLE ISUMMARY OF MOVEMENT TYPES AND SPEEDS. SUBJECTS WERE CUED
TO PERFORM MAXIMUM FLEXION OR EXTENSION FOR THE SPECIFIED
DURATION, AND IDLING WITHOUT RETURNING TO NEUTRAL POSITION.
Movement type Fast Moderate Slow
Pincer Grasp (PG) 0.35 s 0.75 s 1.5 sElbow (E) 0.65 s 1.30 s 2.6 sShoulder F/E (SFE) 0.75 s 1.5 s 3.0 s
Idle 1.0 s 2.0 s 3.0 s
studies when these movements were executed in succession.The above cycle was repeated for a total of 40 times for eachelementary movement type. In order to establish a signalbaseline, subjects held the joint at a neutral position for30 s before and after these video-guided cycles. Note thatsubjects familiarized themselves with the task by previewingthe videos.
C. Analysis
As described in [9], the high γ-band power, Pγ , wasobtained by calculating the instantaneous power envelope foreach ECoG electrode:
Pγ(t) = f(x2γ(t)) (1)
where xγ(t) is the bandpass filtered (80-160 Hz) ECoGsignal, which is squared and then enveloped by a 1.5-Hzlow-pass filter, f(·).
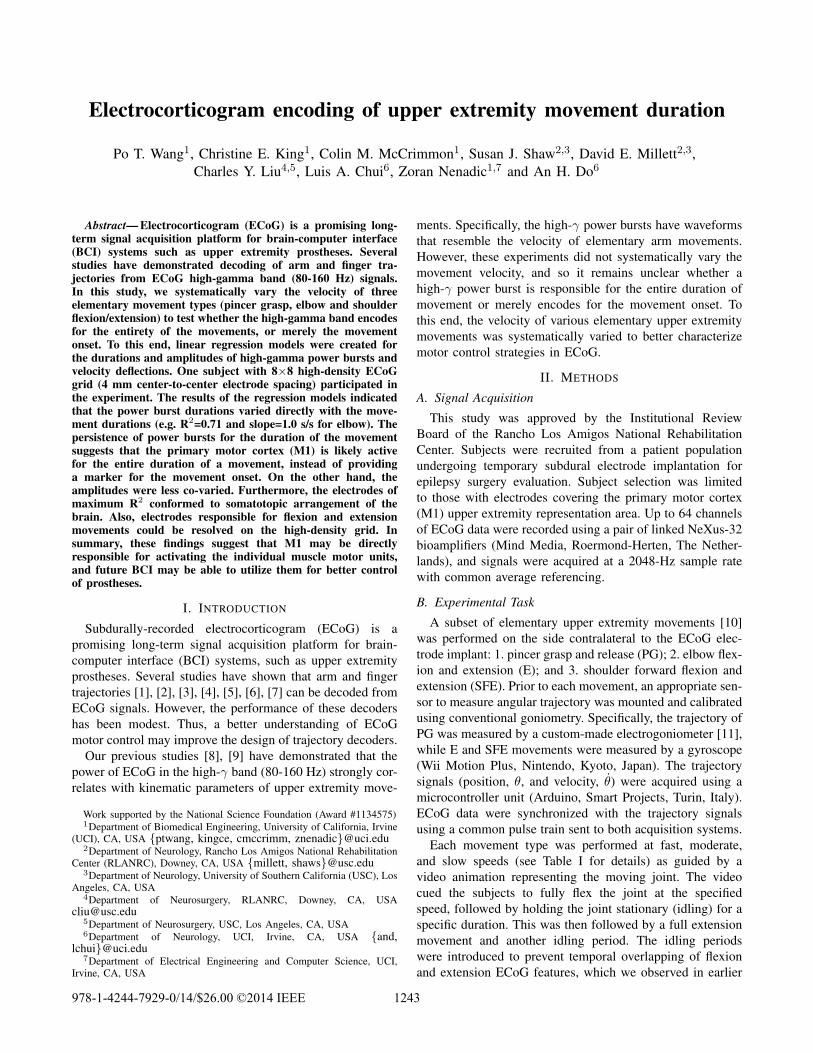
The duration and amplitude of Pγ bursts and θ deflectionsduring each flexion and extension movement were deter-mined using criteria described in Fig. 1. Four separate linearregression models between Pγ and θ were generated forflexion durations, extension durations, flexion amplitudes,and extension amplitudes.
III. RESULTS
A 38-year-old male subject undergoing subdural electrodeimplantation for epilepsy surgery evaluation participated inthis study. The subject had an 8×8 high-density ECoGelectrode grid (4 cm × 4 cm, 4 mm center-to-center electrodespacing) placed over the right hemisphere covering the armrepresentation area of M1. While the subject completedall movement tasks, he had a tendency to decompose theslow PG movements into multiple small movements, andtherefore this dataset was excluded from analysis. The ECoGgrid location is reproduced in Fig. 2. Note that due to thepresence of MRI incompatible metal inside his body, theECoG grid could not be visualized using the typical MRI-CT co-registration procedure [12]. Instead, localization wasperformed by co-registering the central sulcus location usingpre- and post-implantation CT scans.
The results of the regression models (summarized inFig. 2 and Table II) indicated that the Pγ burst durationvaried directly with the movement duration for E and SFEmovements. However, this relationship was weaker for thePG movement. Also, the amplitudes of Pγ bursts and θdeflections were less co-varied for all movement types.Representative scatter plots of these relationships are shownin Figs. 3 and 4.
TABLE IITHE MAXIMUM COEFFICIENT OF DETERMINATION (R2), SLOPES, AND
MEAN Pγ VALUES FOR EACH LINEAR REGRESSION MODEL OVER THE
M1 AREA. UNITS: s FOR DURATIONS, mad FOR Pγ AMPLITUDES,mad/(◦/s) FOR SLOPES OF AMPLITUDES. ALL R2 VALUES ARE
STATISTICALLY SIGNIFICANT INCLUDING R2=0.10 (P=0.0075).
Movement Duration AmplitudeFlexion Extension Flexion Extension
PG R2 0.42 0.34 0.10 0.23Electrode G37 G30 G23 G9Slope 0.92 0.61 -0.0094 -0.012Pγ Value 0.74 0.74 3.68 2.63
E R2 0.71 0.62 0.41 0.55Electrode G37 G37 G36 G19Slope 1.0 0.85 0.081 -0.080Pγ Value 1.50 1.55 22.58 15.69
SFE R2 0.69 0.71 0.30 0.33Electrode G27 G20 G29 G26Slope 1.0 1.2 -0.085 -0.069Pγ Value 1.63 1.62 13.99 18.26
IV. DISCUSSION
The persistence of Pγ bursts for the duration of themovement suggests that M1 is likely active for the entireduration of a movement instead of providing a marker for themovement onset. For each individual flexion and extensionin the E and SFE movements, the duration of the Pγ burstwas approximately equal to the duration of the θ deflection(as evidenced by slope of ∼1). This relationship was truefor a range of velocities (see Table II), including the slowspeed movements. This raises the possibility that M1 neuronsdirectly activate motor units responsible for the movements.Furthermore, the slope of the duration regression line wasslightly higher for SFE. This suggests that for larger joints,the Pγ activity may encode for acceleration or a combinationof both velocity and acceleration, whose deflection lastslonger than that of θ.
On the other hand, even though the R2 values correspond-ing to the amplitudes of Pγ bursts and θ deflections werestatistically significant (p=0.0075), the majority of variancewas unaccounted for. Only the R2 and slopes for E move-ment supported the original hypothesis (Pγ burst amplitudecorrelates with the movement deflection amplitude). Thepossibility of other variables (e.g. torque, muscle activity)being encoded by this feature may explain the remainingvariance. The inherent variability of the peak values of thePγ bursts may be another contributing factor.
The spatial distribution (Fig. 2) of the maximum R2 acrossmovement types conformed to a somatotopic arrangement inM1, in which proximal to distal movements were representedin a medial to lateral manner. In addition, the area of highR2 increased for E and SFE movements, compared to PGmovements. This can be explained by the stronger Pγ bursts(higher Pγ amplitudes, see Table II), leading to a largerspread of movement-modulated high-γ ECoG activity byvolume conduction. This in turn allowed high R2 values tobe established over wider brain areas.
The locations of maximum R2 differed between flexion
1244
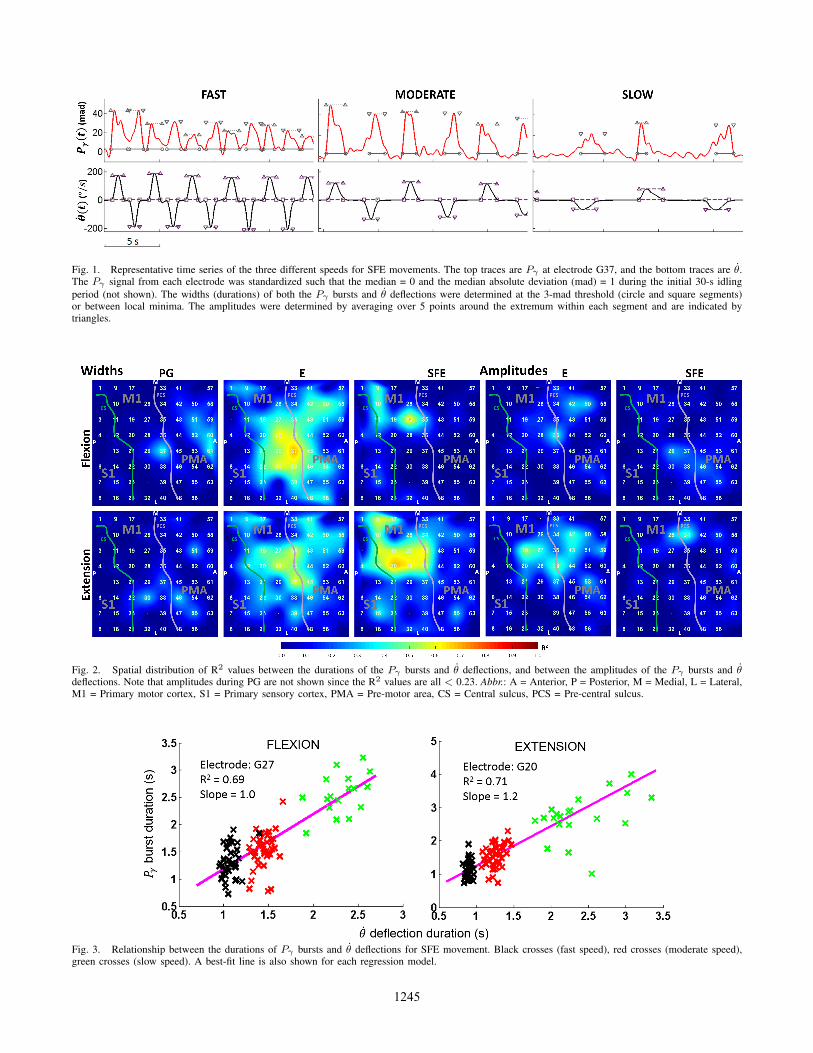
Fig. 1. Representative time series of the three different speeds for SFE movements. The top traces are Pγ at electrode G37, and the bottom traces are θ.The Pγ signal from each electrode was standardized such that the median = 0 and the median absolute deviation (mad) = 1 during the initial 30-s idlingperiod (not shown). The widths (durations) of both the Pγ bursts and θ deflections were determined at the 3-mad threshold (circle and square segments)or between local minima. The amplitudes were determined by averaging over 5 points around the extremum within each segment and are indicated bytriangles.
Fig. 2. Spatial distribution of R2 values between the durations of the Pγ bursts and θ deflections, and between the amplitudes of the Pγ bursts and θdeflections. Note that amplitudes during PG are not shown since the R2 values are all < 0.23. Abbr.: A = Anterior, P = Posterior, M = Medial, L = Lateral,M1 = Primary motor cortex, S1 = Primary sensory cortex, PMA = Pre-motor area, CS = Central sulcus, PCS = Pre-central sulcus.
Fig. 3. Relationship between the durations of Pγ bursts and θ deflections for SFE movement. Black crosses (fast speed), red crosses (moderate speed),green crosses (slow speed). A best-fit line is also shown for each regression model.
1245

Fig. 4. Relationship between the amplitudes of Pγ bursts and θ deflections for E movement. Black crosses (fast speed), red crosses (moderate speed),green crosses (slow speed). A best-fit line is also shown for each regression model.
and extension for each movement type, suggesting thatthere exist separate neuronal generators responsible for eachmovement direction. These generators appeared to be suffi-ciently resolved in space using a high-density ECoG grid,which makes it a promising signal acquisition platform forfuture BCI applications. In summary, the strong R2 fordurations, the presence of their somatotopic arrangement,and the separation of flexion and extension generators furtherreinforce the possibility that M1 cortical neurons are directlyresponsible for activating muscle motor units.
Finally, it can be observed that Pγ bursts did not fullyreturn to the noise threshold between flexion and extensionmovements at fast speed (see Fig. 1). Adjusting futureexperiments to increase the idling period to 2-3 s may betterisolate the ECoG signals encoding for these movements andmay improve the R2 value.
V. CONCLUSION
This study explored the characteristics of high-γ powerbursts at varying movement velocities. The results supportthe hypothesis that M1 is active for the entire duration ofa movement instead of marking the onset of movement.They also suggest that M1 may be directly responsible foractivating the individual muscle motor units. Our future workwill focus on corroborating these findings and testing thishypothesis in a larger cohort of subjects. Ultimately, thismay improve our understanding of physiological processesunderlying upper extremity movement, which in conjunctionwith high-density ECoG grids, may lead to the design ofbetter BCI systems for upper extremity prosthesis control.
ACKNOWLEDGMENTS
We thank Angelica Nguyen for her assistance with theexperiments and Andrew Schombs for building the velocityacquisition system.
REFERENCES
[1] P. T. Wang, E. J. Puttock, C. E. King, A. Schombs, J. J. Lin, M. Sazgar,F. P. K. Hsu, S. J. Shaw, D. E. Millett, C. Y. Liu, L. A. Chui, A. H.Do, and Z. Nenadic, “State and trajectory decoding of upper extremitymovements from electrocorticogram,” in Proc 6th Int IEEE EMBSConf Neural Eng, pp. 969–972, 2013.
[2] W. Wang, J. L. Collinger, A. D. Degenhart, E. C. Tyler-Kabara,A. B. Schwartz, D. W. Moran, R. K. Vinjamuri, R. C. Ashmore,D. J. Weber, B. Wodlinger, J. W. Kelly, and M. L. Boninger, “Anelectrocorticographic brain interface in an individual with tetraplegia,”PLOS ONE, vol. 8, p. e55344, 2013.
[3] T. Yanagisawa, M. Hirata, Y. Saitoh, H. Kishima, K. Matsushita,T. Goto, R. Fukuma, H. Yokoi, Y. Kamitani, and T. Yoshimine, “Elec-trocorticographic control of a prosthetic arm in paralyzed patients,”Ann Neurol, vol. 71, no. 3, pp. 353–361, 2012.
[4] K. J. Miller, S. Zanos, E. E. Fetz, M. den Nijs, and J. G. Ojemann,“Decoupling the cortical power spectrum reveals real-time representa-tion of individual finger movements in humans.,” J Neurosci, vol. 29,no. 10, pp. 3132–3137, 2009.
[5] S. Acharya, M. S. Fifer, H. L. Benz, N. E. Crone, and N. V. Thakor,“Electrocorticographic amplitude predicts finger positions during slowgrasping motions of the hand,” J Neural Eng, vol. 7, no. 4, p. 046002,2010.
[6] J. Kubanek, K. J. Miller, J. G. Ojemann, J. R. Wolpaw, and G. Schalk,“Decoding flexion of individual fingers using electrocorticographicsignals in humans,” J Neural Eng, vol. 6, no. 6, p. 66001, 2009.
[7] J. C. Sanchez, A. Gunduz, P. R. Carney, and J. C. Principe, “Extractionand localization of mesoscopic motor control signals for human ECoGneuroprosthetics.,” J Neurosci Meth, vol. 167, no. 1, pp. 63–81, 2008.
[8] P. T. Wang, C. E. King, A. Schombs, J. J. Lin, M. Sazgar, F. P. K.Hsu, S. J. Shaw, D. E. Millett, C. Y. Liu, L. A. Chui, Z. Nenadic,and A. H. Do, “Electrocorticographic gamma band power encodesthe velocity of upper extremity movements,” in Proc 5th Int Brain-Computer Interface Meeting, Article ID 120, 2013.
[9] P. T. Wang, C. E. King, A. Schombs, J. J. Lin, M. Sazgar, F. P. K.Hsu, S. J. Shaw, D. Millett, C. Y. Liu, L. A. Chui, Z. Nenadic, andA. H. Do, “Electrocorticogram encoding of upper extremity movementtrajectories,” in Proc 6th Int IEEE EMBS Conf Neural Eng, pp. 1429–1432, 2013.
[10] A. H. Do, P. T. Wang, C. E. King, A. Schombs, J. J. Lin, M. Sazgar,F. P. K. Hsu, S. J. Shaw, D. E. Millett, C. Y. Liu, A. A. Szymanska,L. A. Chui, and Z. Nenadic, “Sensitivity and specificity of upperextremity movements decoded from electrocorticogram,” in Proc 35thAnn Int Conf IEEE EMBS, pp. 5618–5621, 2013.
[11] P. T. Wang, C. E. King, A. H. Do, and Z. Nenadic, “A durable, low-cost electrogoniometer for dynamic measurement of joint trajectories,”Med Eng Phys, vol. 33, no. 5, pp. 546–552, 2011.
[12] P. T. Wang, C. E. King, S. J. Shaw, D. E. Millett, C. Y. Liu, L. A.Chui, Z. Nenadic, and A. H. Do, “A co-registration approach forelectrocorticogram electrode localization using post-implantation MRIand CT of the head,” in Proc 6th Int IEEE EMBS Conf Neural Eng,pp. 525–528, 2013.
1246