elk grove market study progress evaluation...in 2010, the center for strategic economic research...
TRANSCRIPT

Elk Grove Market Study Progress Evaluation
March 27, 2014
Prepared for: City of Elk Grove
8401 Laguna Palms Way Elk Grove, CA 95758
www.elkgrovecity.org
Prepared by:
400 Capitol Mall, Suite 2500
Sacramento, CA 95814 916/491-0444
www.strategiceconomicresearch.org
In association with: Economic & Planning Systems, Inc.
2295 Gateway Oaks Drive, Suite 250 Sacramento, CA 95833
916/649-8010 www.epsys.com
MARKET STUDY PROGRESS EVALUATION
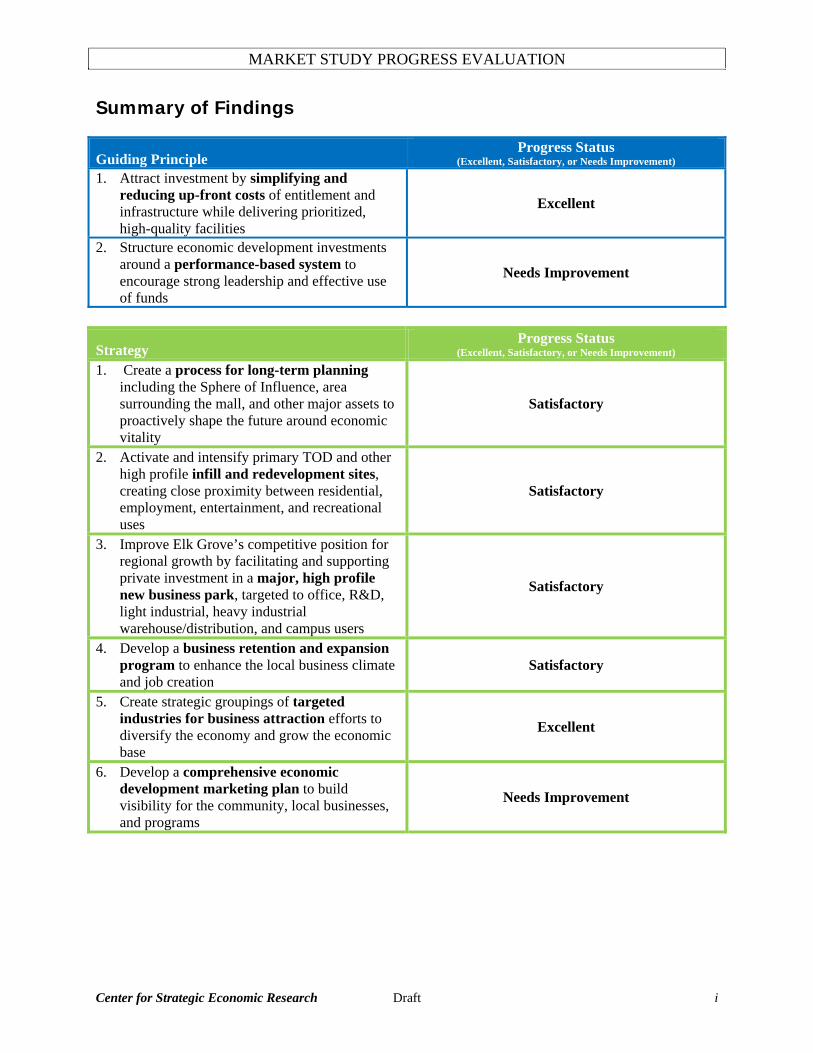
Summary of Findings
Guiding Principle Progress Status
(Excellent, Satisfactory, or Needs Improvement)
1. Attract investment by simplifying and reducing up-front costs of entitlement and infrastructure while delivering prioritized, high-quality facilities
Excellent
2. Structure economic development investments around a performance-based system to encourage strong leadership and effective use of funds
Needs Improvement
Strategy Progress Status
(Excellent, Satisfactory, or Needs Improvement)
1. Create a process for long-term planning including the Sphere of Influence, area surrounding the mall, and other major assets to proactively shape the future around economic vitality
Satisfactory
2. Activate and intensify primary TOD and other high profile infill and redevelopment sites, creating close proximity between residential, employment, entertainment, and recreational uses
Satisfactory
3. Improve Elk Grove’s competitive position for regional growth by facilitating and supporting private investment in a major, high profile new business park, targeted to office, R&D, light industrial, heavy industrial warehouse/distribution, and campus users
Satisfactory
4. Develop a business retention and expansion program to enhance the local business climate and job creation
Satisfactory
5. Create strategic groupings of targeted industries for business attraction efforts to diversify the economy and grow the economic base
Excellent
6. Develop a comprehensive economic development marketing plan to build visibility for the community, local businesses, and programs
Needs Improvement
Center for Strategic Economic Research Draft i

MARKET STUDY PROGRESS EVALUATION
Contents Section Page Summary of Findings i Introduction 1 Progress Evaluation 5 Guiding Principles 6 Guiding Principle 1 6 Guiding Principle 2 11 Strategies 13 Strategy 1 13 Strategy 2 16 Strategy 3 20 Strategy 4 23 Strategy 5 24 Strategy 6 27 Summary of Recommendations 30 Additional Considerations 32 Appendix—Economic and Demographic Dynamics A-1
Introduction In 2010, the Center for Strategic Economic Research (CSER), in collaboration with Economic & Planning Systems (EPS), completed a Market Study for the City of Elk Grove, which examined the economic development opportunities and land use needs for the City. As part of the Market Study, a strategy component was developed to help the community realize a future with more desirable outcomes and a stronger business climate than it had historically experienced. The strategy was intended to cover a roughly five-year period with a broad vision and two guiding principles overlaying a set of six strategies split equally between real estate and land use and economic development topics. At the three-year mark in the implementation period, the City engaged CSER and EPS to conduct an evaluation of progress toward executing the strategies and actions outlined in the 2010 Market Study. This report summarizes the results of the progress evaluation and provides conclusions on the status of the items in the strategy, offers recommendations for moving action items forward or modifying approaches, and discusses other potential priority areas for the City to consider. The guiding principles and strategies in the 2010 Market Study were designed to align with the core vision that was developed based on stakeholder engagement and community reports. The following vision reflects the broad community values and desired outcomes at the time:
Enhance economic well-being and quality of life, improve the jobs-housing balance, create employment opportunities for residents, and build economic stability by facilitating job creation and economic diversification.
While work on the 2010 Market Study was conducted in the midst of the national recession and used several data sets benchmarked in 2008 to inform decision-making, the regional economy
Center for Strategic Economic Research Draft 1
MARKET STUDY PROGRESS EVALUATION
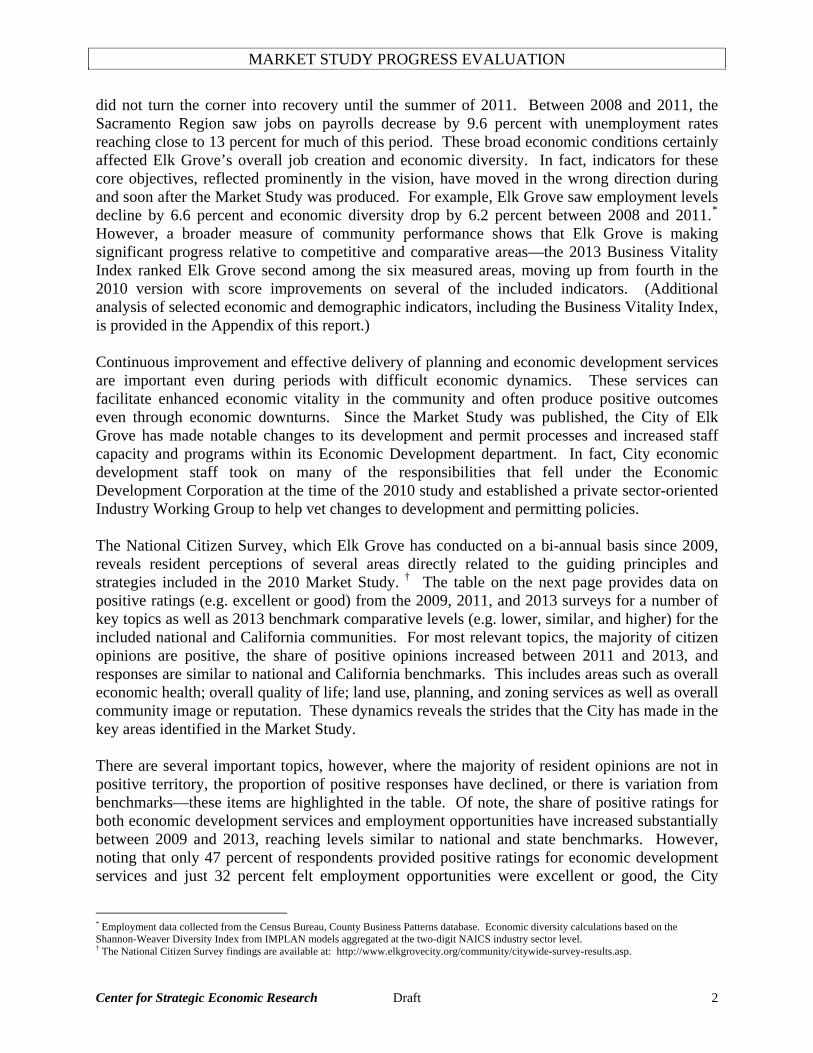
did not turn the corner into recovery until the summer of 2011. Between 2008 and 2011, the Sacramento Region saw jobs on payrolls decrease by 9.6 percent with unemployment rates reaching close to 13 percent for much of this period. These broad economic conditions certainly affected Elk Grove’s overall job creation and economic diversity. In fact, indicators for these core objectives, reflected prominently in the vision, have moved in the wrong direction during and soon after the Market Study was produced. For example, Elk Grove saw employment levels decline by 6.6 percent and economic diversity drop by 6.2 percent between 2008 and 2011.* However, a broader measure of community performance shows that Elk Grove is making significant progress relative to competitive and comparative areas—the 2013 Business Vitality Index ranked Elk Grove second among the six measured areas, moving up from fourth in the 2010 version with score improvements on several of the included indicators. (Additional analysis of selected economic and demographic indicators, including the Business Vitality Index, is provided in the Appendix of this report.) Continuous improvement and effective delivery of planning and economic development services are important even during periods with difficult economic dynamics. These services can facilitate enhanced economic vitality in the community and often produce positive outcomes even through economic downturns. Since the Market Study was published, the City of Elk Grove has made notable changes to its development and permit processes and increased staff capacity and programs within its Economic Development department. In fact, City economic development staff took on many of the responsibilities that fell under the Economic Development Corporation at the time of the 2010 study and established a private sector-oriented Industry Working Group to help vet changes to development and permitting policies. The National Citizen Survey, which Elk Grove has conducted on a bi-annual basis since 2009, reveals resident perceptions of several areas directly related to the guiding principles and strategies included in the 2010 Market Study. † The table on the next page provides data on positive ratings (e.g. excellent or good) from the 2009, 2011, and 2013 surveys for a number of key topics as well as 2013 benchmark comparative levels (e.g. lower, similar, and higher) for the included national and California communities. For most relevant topics, the majority of citizen opinions are positive, the share of positive opinions increased between 2011 and 2013, and responses are similar to national and California benchmarks. This includes areas such as overall economic health; overall quality of life; land use, planning, and zoning services as well as overall community image or reputation. These dynamics reveals the strides that the City has made in the key areas identified in the Market Study. There are several important topics, however, where the majority of resident opinions are not in positive territory, the proportion of positive responses have declined, or there is variation from benchmarks—these items are highlighted in the table. Of note, the share of positive ratings for both economic development services and employment opportunities have increased substantially between 2009 and 2013, reaching levels similar to national and state benchmarks. However, noting that only 47 percent of respondents provided positive ratings for economic development services and just 32 percent felt employment opportunities were excellent or good, the City
* Employment data collected from the Census Bureau, County Business Patterns database. Economic diversity calculations based on the Shannon-Weaver Diversity Index from IMPLAN models aggregated at the two-digit NAICS industry sector level. † The National Citizen Survey findings are available at: http://www.elkgrovecity.org/community/citywide-survey-results.asp.
Center for Strategic Economic Research Draft 2
MARKET STUDY PROGRESS EVALUATION
should continue to strive for levels that are higher than benchmark areas in order to garner more than a majority of positive ratings for these categories. Additionally, while not included in the 2013 survey, the 2011 responses revealed that 89 percent of respondents felt that the pace of job growth was too slow, a much higher level than national and state benchmarks. Overall, based on citizen opinions, the changes that the City has implemented in planning services appear to be having a positive impact in the community while outcomes related to enhancements in economic development services have been slower to materialize. ELK GROVE NATIONAL CITIZEN SURVEY FINDINGS POSITIVE RATINGS AND BENCHMARKS
Center for Strategic Economic Research, January 2014
CA National Benchmarks Benchmarks
Question 2009 2011 2013 2011-2013 2013 2013
Overall quality of life 73% 74% 81% 7% similar similarNeighborhood as place to live 79% 83% 82% -1% similar similarCity as place to live 80% 82% 88% 6% similar similar
Ease of car travel 52% 54% 58% 4% similar similarEase of bus travel / public transportation [1] 42% 52% 41% - low er low erEase of bicycle travel 57% 52% 57% 5% similar similarEase of w alking 61% 62% 71% 9% similar similarAvailability of paths and w alking trails 59% 59% 73% 14% similar similarTraff ic f low on major streets 39% 37% 48% 11% similar similarBus or transit service 53% 56% 56% 0% similar similar
Availability of affordable quality housing 49% 44% 50% 6% higher similarVariety of housing options 62% 56% 63% 7% higher similarOverall quality of new development 53% 57% 52% -5% similar similarOverall appearance of City 78% 81% 79% -2% similar similarLand use, planning, and zoning services 38% 50% 53% 3% similar similar
Employment opportunities 14% 22% 32% 10% similar similarShopping opportunities 47% 52% 50% -2% similar similarCity as place to w ork 49% 42% 59% 17% similar similarOverall quality of biz and svc establishments in City 55% 58% 59% 1% similar similarJob grow th seen as too slow [2] 81% 89% - - much higher much higherRetail grow th seen as too slow [2] 37% 47% - - higher much higherEconomic development services 33% 37% 47% 10% similar similarOverall economic health of City - - 63% - similar similar
Recreational opportunities 50% 59% 69% 10% similar similarOpportunities to attend cultural activities 38% 44% 44% 0% similar similarOpportunities to participate in social events and activities 49% 58% 52% -6% similar similarPublic library services 74% 74% 79% 5% similar similar
Overall direction City is taking 35% 43% 52% 9% similar similarOverall image or reputation of City 64% 64% 74% 10% similar similarServices provided by City 66% 67% 70% 3% similar similar
Elk Grove
Data Source: Elk Grove National Citizen Surveys 2009, 2011, and 2012, National Research Center, Inc. Notes: [1] Question changed from bus travel to public transportation in 2013. [2] Benchmark comparisons from 2011.
Center for Strategic Economic Research Draft 3
MARKET STUDY PROGRESS EVALUATION
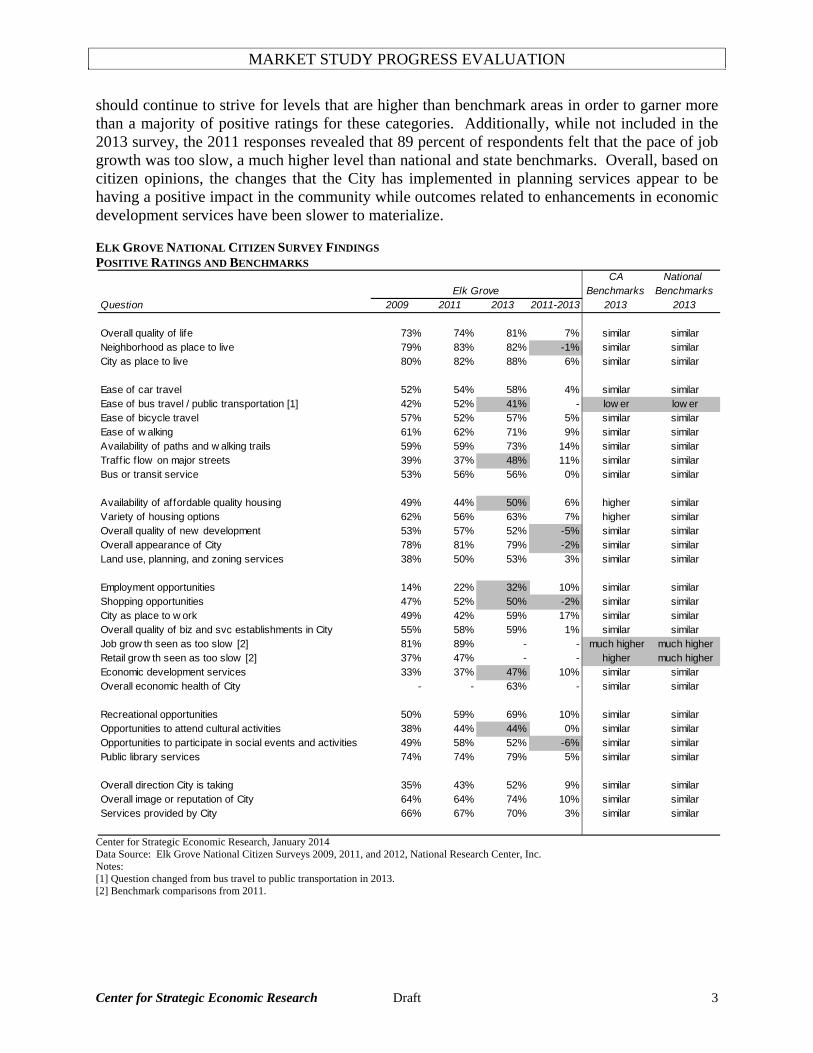
Facing similar challenges in economic conditions and the ecosystem of regional economic development programs and services, public and private sector leaders in the Sacramento Region undertook a collaborative process to develop the Next Economy Capital Region Prosperity Plan.‡ Over its five-year action period, this Plan seeks to transform the Region into one that is widely regarded as a:
• Sought-after place for business growth, investment, and entrepreneurship • Desirable place for a quality workforce and young professionals to live, study, work,
play, and contribute • Diverse economy renowned for its core business clusters and driven in large part by
export activity The robust implementation plan is centered on five overarching goals:
1. Foster a strong innovation environment 2. Amplify the Region’s global market transactions 3. Diversity the economy through growth and support of core business clusters 4. Grow and maintain a world-class talent base 5. Improve the regional business climate for economic growth
The City of Elk Grove demonstrated its support of the core principles contained in the Plan by adopting a resolution of support in January of 2013. By aligning its economic development activities, where appropriate, with Next Economy, Elk Grove can benefit from regional momentum created by collective and coordinated action in key areas that will drive incremental job growth and diversification. Moreover, the City has taken on a leadership role by serving on the Next Economy Oversight Committee and has indicated that it would like to expand its role by further committing to specific Plan initiatives. It will be important for the City to continue to build on the strategies outlined in the 2010 Market Study and consider the modifications and other potential priority areas discussed in the next section of this report. This will allow the City of Elk Grove to better position itself to see positive movement in its quality of life, jobs-housing balance, employment opportunities for residents, job creation, and economic diversification objectives.
‡ The full Next Economy Capital Region Prosperity Plan and accompanying Research Report are available at: www.nexteconomycapitalregion.org.
Center for Strategic Economic Research Draft 4
MARKET STUDY PROGRESS EVALUATION
Progress Evaluation This section provides a standard rating of progress status for the two guiding principles and six strategies presented in the 2010 Market Study along with comments on the observations driving the rating and recommendations for modified approaches.§ For all items, the progress status is rated as excellent, satisfactory, or needs improvement based on the alignment with the intent of the 2010 recommendations, accomplishments to date, relationship with suggested timelines, and professional opinions. It is important to note that while the original project was collaboratively initiated by the City of Elk Grove, Elk Grove Economic Development Corporation, and Elk Grove Chamber of Commerce, the progress evaluation focuses solely on City activities and only indirectly considers the impacts of and relationships with programs at the other entities. This distinction is significant because the Market Study identified the Economic Development Corporation as a responsible party for some strategies at a time before the City decided to increase staffing capacity and programs in its Economic Development department and assume many responsibilities of the Economic Development Corporation. The City recognizes that the expanded staffing in the Economic Development department will allow it to continue to administer key programs and commit to many of the core economic development responsibilities outlined in the Market Study. As emphasized in the 2010 Market Study, there is still a recognized need for additional physical assets in the community in order to create a stronger competitive position and support economic vitality. Noting that the planning and development horizon associated with building physical assets can be lengthy, the Market Study stressed the need to expand and strategically-orient economic development programs in the short-term in order to maximize the economic growth potential based on Elk Grove’s existing competitive position. The progress evaluation was conducted with this context in the forefront.
§ Refer to the 2010 Market Study for details on guiding principles and strategies in the Market Strategy section beginning on page 90. The full report is available at: www.strategiceconomicresearch.org/AboutUs/egmkt.pdf .
Center for Strategic Economic Research Draft 5
MARKET STUDY PROGRESS EVALUATION
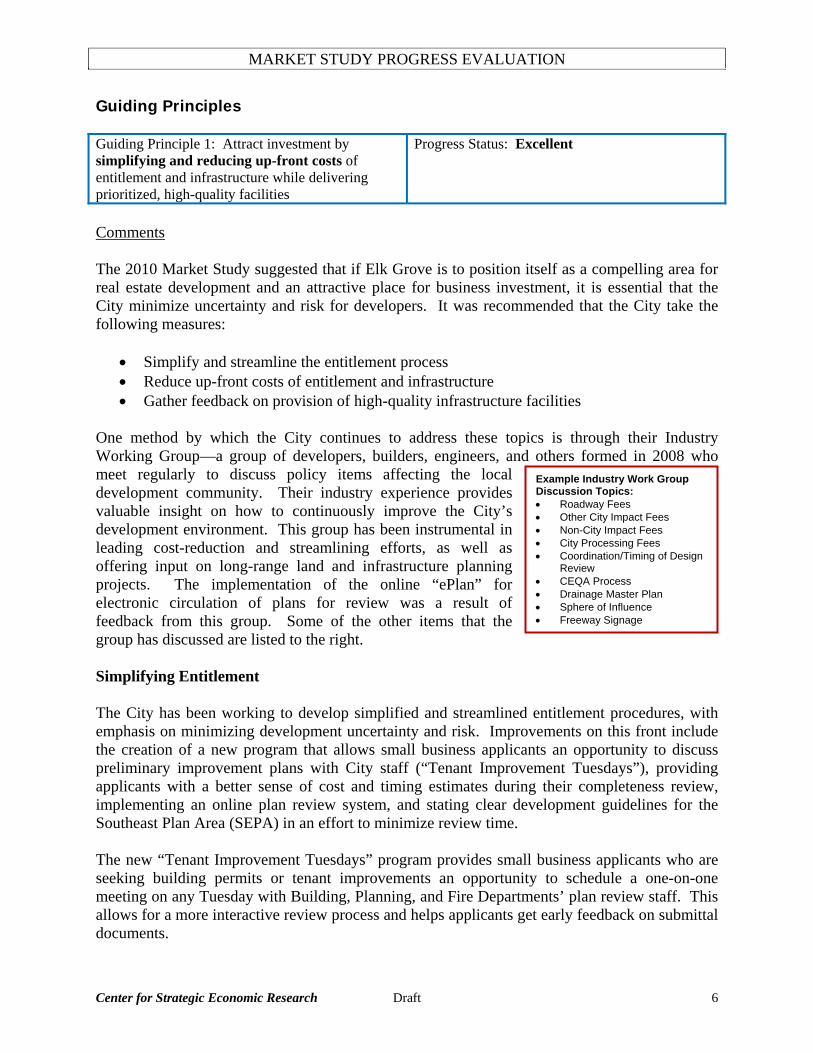
Guiding Principles Guiding Principle 1: Attract investment by simplifying and reducing up-front costs of entitlement and infrastructure while delivering prioritized, high-quality facilities
Progress Status: Excellent
Comments The 2010 Market Study suggested that if Elk Grove is to position itself as a compelling area for real estate development and an attractive place for business investment, it is essential that the City minimize uncertainty and risk for developers. It was recommended that the City take the following measures:
• Simplify and streamline the entitlement process • Reduce up-front costs of entitlement and infrastructure • Gather feedback on provision of high-quality infrastructure facilities
One method by which the City continues to address these topics is through their Industry Working Group—a group of developers, builders, engineers, and others formed in 2008 who meet regularly to discuss policy items affecting the local development community. Their industry experience provides valuable insight on how to continuously improve the City’s development environment. This group has been instrumental in leading cost-reduction and streamlining efforts, as well as offering input on long-range land and infrastructure planning projects. The implementation of the online “ePlan” for electronic circulation of plans for review was a result of feedback from this group. Some of the other items that the group has discussed are listed to the right.
Example Industry Work Group Discussion Topics: • Roadway Fees • Other City Impact Fees • Non-City Impact Fees • City Processing Fees • Coordination/Timing of Design
Review • CEQA Process • Drainage Master Plan • Sphere of Influence • Freeway Signage
Simplifying Entitlement The City has been working to develop simplified and streamlined entitlement procedures, with emphasis on minimizing development uncertainty and risk. Improvements on this front include the creation of a new program that allows small business applicants an opportunity to discuss preliminary improvement plans with City staff (“Tenant Improvement Tuesdays”), providing applicants with a better sense of cost and timing estimates during their completeness review, implementing an online plan review system, and stating clear development guidelines for the Southeast Plan Area (SEPA) in an effort to minimize review time. The new “Tenant Improvement Tuesdays” program provides small business applicants who are seeking building permits or tenant improvements an opportunity to schedule a one-on-one meeting on any Tuesday with Building, Planning, and Fire Departments’ plan review staff. This allows for a more interactive review process and helps applicants get early feedback on submittal documents.
Center for Strategic Economic Research Draft 6
MARKET STUDY PROGRESS EVALUATION
As required by state law, the City has a 30-day completeness review window for all permit applications, whereby the City must determine whether an application is complete and provide the applicant with a list of materials required for approval. In 2012, the City instituted a policy to provide applicants with a cost estimate and estimated timeline for approval as part of the completeness review. This additional step provides developers with clearer expectations of the cost and duration of the permit and entitlement process. The Market Study recommended that the City establish internal monitoring procedures to identify whether targeted timelines for processing of permits and other planning documents are being met. Two years ago, the City implemented a system for evaluating performance measures by tracking permit turnaround time—this database is monitored quarterly. Since the system is relatively new, the process is just reaching the point where the dataset is large enough to be used for meaningful evaluation. Code enforcement has already started making policy changes based on the information gathered through this system. As mentioned above, another tech-savvy system the City implemented recently is ePlan, an online electronic plan review system, which electronically notifies permit applicants as soon as plan reviewers provide new comments or request additional information, significantly reducing waiting times. Applicants are able to submit plan revisions electronically, saving them both time and money, because printing and delivery can be eliminated. It also means time-savings with routing—electronic submittals can be sent to all necessary departments simultaneously rather than having to be physically sorted and distributed to the appropriate personnel. The City is in the process of creating a simplified entitlement process for development specific to the SEPA. As part of this process, the City has outlined a comprehensive list of approved uses, which would only be subject to a Minor Design Review, thus minimizing review time and providing clear expectations of the City’s requirements. The City also is trying to minimize uncertainty with environmental review. An Environmental Impact Report (EIR) is being drafted for the entire 1,200 acres of the SEPA. If approved, new projects in the SEPA would require little, if any, additional environmental review, as long as it conforms to what was proposed in the area EIR. Reducing Up-Front Costs The streamlining measures identified above effectively decrease the cost of development. Other more direct cost-reducing approaches the City has implemented include adoption of a new Affordable Housing Fee Program, focusing development near existing infrastructure, and proposing new infrastructure financing policies. In April 2013, the City adopted a new Affordable Housing Fee Program. Before adoption of this fee program, the City had been using a non-residential fee structure that the County of Sacramento had implemented before the City’s incorporation in 2000. The residential fees had not been updated since 2002. In an effort to spur new business growth, the City eliminated the affordable housing impact fee for office development.
Center for Strategic Economic Research Draft 7
MARKET STUDY PROGRESS EVALUATION
Buildout of the SEPA and plans for the proposed Outlet Collection @ Elk Grove area (formerly the “Promenade” mall) encourage development where high-capacity road infrastructure already is in place and slated for expansion, thus reducing developers’ up-front costs for infrastructure. For example, the Capital Southeast Connector project that connects Interstate 5 and State Route 99 will run along the SEPA’s southern boundary on Kammerer Road. Also, the existing Kammerer Road interchange off State Route 99 is a critical access point that already has the capacity to serve the SEPA and mall area. The Market Study suggested the City explore policies to provide reimbursement mechanisms for developer-constructed infrastructure benefitting other parties. Considering input from the Industry Working Group, the City recently adopted new Land-Secured Financing Policies that will be applicable to all future development in the City. With the update, the City has created certainty and consistency by adhering to applicable legal requirements and implementing industry best practices. Delivering High-Quality Facilities The Market Study recommended that the City establish a feedback process for residents and community advocates to comment on whether the City is providing high-quality infrastructure facilities. The City does this by gathering community members’ input through public meetings and workshops, as well as conducting a biannual communitywide survey, which commenced in 2009. As discussed in the previous section, the vast majority of 2013 survey responses showed improvement since the prior 2011 survey and indicate that Elk Grove has done a fine job of providing high-quality, community-serving facilities and infrastructure. In particular, the City is working to expand its public transportation and provide more cultural amenities, which will greatly enhance the City. These two topics will be discussed separately in the following sections. According to the Elk Grove 2013 National Citizen Survey results, the ease of bus travel and public transportation is one area where there remains room for improvement. As shown in the table on page 3, less than half of the 2013 respondents offered favorable opinions on this topic in 2013, which was below the included California and national benchmarks. One way in which the City is planning on improving public transportation is through the incorporation of a Bus Rapid Transit (BRT) route. The Elk Grove Short Range Transit Plan for Fiscal Years 2014–2020 outlines a proposed BRT project that would cover 15 miles with 28 boarding locations. Service would include 10–minute headways during peak times and 15 minutes on weekends and off-peak times. The route would consist of two transit corridors—a north/south corridor and an east/west corridor that would intersect at the main transfer center located at the Civic Center. Elk Grove has the potential to become a cultural amenity destination. One of the strategies in the Next Economy Capital Region Prosperity Plan calls for investment in the Sacramento Region's cultural infrastructure as a means to retain and attract talent. An action item under this strategy relates to moving the Civic Amenities Strategic Plan forward. In the Plan, Elk Grove is identified as a "Civic Amenities Hub," primarily citing the Elk Grove Town Center’s Civic Center District, which is part of the Laguna Ridge Specific Plan. Development of a critical mass of civic, cultural, and educational amenities focused in the Civic Center (and some potentially in
Center for Strategic Economic Research Draft 8

MARKET STUDY PROGRESS EVALUATION
Old Town) will add an interesting facet to the Elk Grove community, providing residents and visitors with additional recreation, learning, and entertainment options. Development of these facilities should help garner more positive opinions on the opportunities to attend cultural activities—less than half of respondents on the 2013 National Citizen Survey provided positive ratings on this topic. The City’s commitment to delivering high-quality facilities is also reflected in its Capital Improvement Program (CIP). In the 2013-2018 period, the City plans to invest nearly $240 million on transportation, drainage, and facilities through the CIP. While funding sources have not been identified, several notable projects were included in the CIP to document a known need or priority including a professional soccer stadium and tournament fields, LED light fixtures, and Railroad Street realignment. Recommendations The City should continue conducting the biannual communitywide survey to assess community members’ satisfaction with living/working in the City, paying close attention to perceptions on the ease of using public transportation and opportunities to attend cultural activities. Other creative methods of obtaining resident feedback could include holding a public open house or community forum focused on the future of Elk Grove. This forum also could serve as a basis for identifying a focus group, comprised of individuals from key City organizations, to form a stakeholder group responsible for assisting the City with periodic progress evaluations. The City has an impressive inventory of parks and outdoor recreation spaces, which are a notable community asset and add to the overall quality of life. Quality of life is an important factor for attracting and retaining workforce assets as well as businesses. In keeping with the City’s pride of parks, similar attention should be given to the interstitial green spaces in and on the periphery of residential neighborhoods, specifically with regard to the width, setback, layout, and landscaping of pedestrian thoroughfares. A close look at these design standards can help to ensure that future development approaches the same level of quality and design while being cognizant of cost implications. Creating a secured funding stream to develop the high quality amenities discussed above necessitates a “balancing act” between the needs and desires of the resident community and effectively assessing and collecting funds from new development, which is reluctant at times to absorbing an additional cost burden. Past City practice has permitted a property owner the option of financing infrastructure and public facilities whether such facilities were included in a City or other agency fee program. This flexibility has been important as land-secured financing has proven instrumental in helping to finance early required project infrastructure (e.g., underground water, sewer, and storm drainage infrastructure). However, in many instances, this developer-led approach has resulted in less than sufficient funding being realized either to fully construct improvements or achieve the desired quality level of improvements. Again this has been primarily due to developer actions that often reduce these costs to the bare minimum. The new Land Secured approach was discussed extensively with the Industry Work Group. While the Group conceptually expressed concerns with the general nature of this approach, it has
Center for Strategic Economic Research Draft 9
MARKET STUDY PROGRESS EVALUATION
been supportive of the current proposed version of the Land Secured Financing Policy. While the Policy does reduce land-owner financing flexibility, it does create a more secure method of funding the desired level and quality of improvement within the community that is necessary for maintaining the community appearance, amenities, and core facilities desired by Elk Grove residents as expressed through community feedback channels such as the communitywide survey. As such, it will be important for the City to closely monitor the effectiveness of these new policies and continue to refine them as warranted. Finally, the City should consider reviving a feedback system exploring applicants’ satisfaction and experience with the permitting process. While the old comment card system is likely not the best approach, the City should explore a sending surveys directly to permit applicants. Potential survey questions could address whether the costs and timing met the applicant’s expectations. This survey feedback should be consistently monitored by economic development and planning staff, with tangible solutions discussed and implemented to address any consistent themes arising from this process.
Center for Strategic Economic Research Draft 10
MARKET STUDY PROGRESS EVALUATION
Guiding Principle 2: Structure economic development investments around a performance-based system to encourage strong leadership and effective use of funds
Progress Status: Needs Improvement
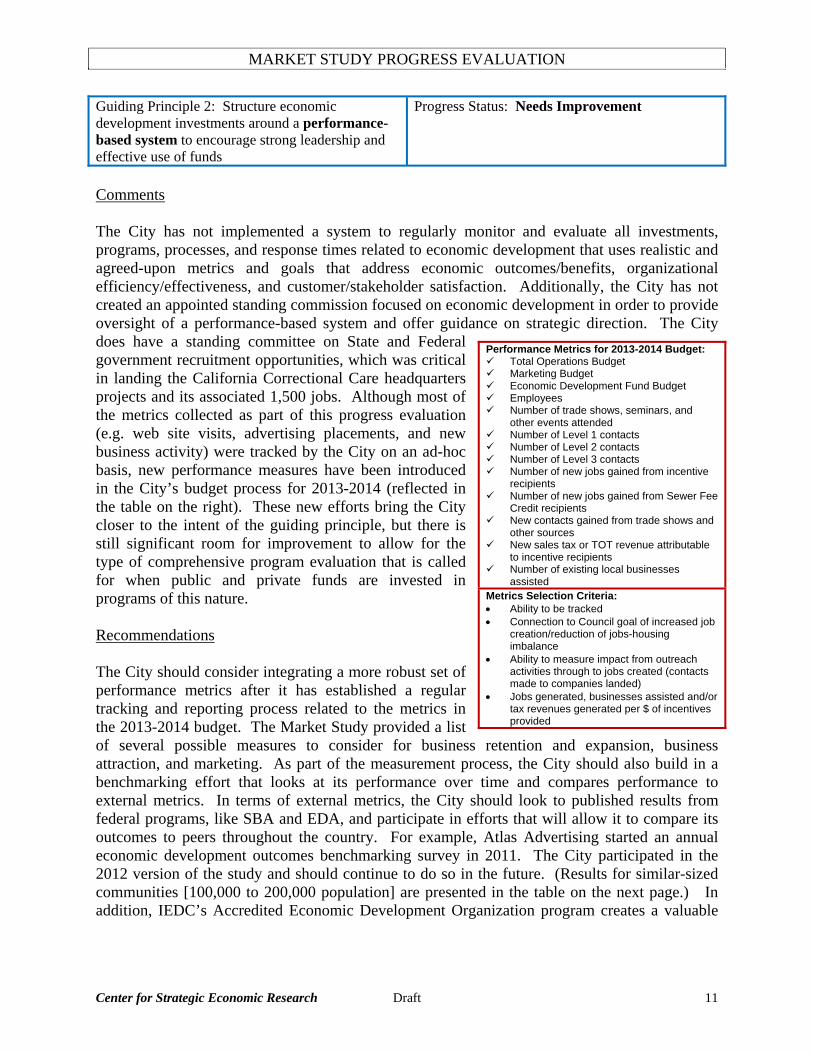
Comments The City has not implemented a system to regularly monitor and evaluate all investments, programs, processes, and response times related to economic development that uses realistic and agreed-upon metrics and goals that address economic outcomes/benefits, organizational efficiency/effectiveness, and customer/stakeholder satisfaction. Additionally, the City has not created an appointed standing commission focused on economic development in order to provide oversight of a performance-based system and offer guidance on strategic direction. The City does have a standing committee on State and Federal government recruitment opportunities, which was critical in landing the California Correctional Care headquarters projects and its associated 1,500 jobs. Although most of the metrics collected as part of this progress evaluation (e.g. web site visits, advertising placements, and new business activity) were tracked by the City on an ad-hoc basis, new performance measures have been introduced in the City’s budget process for 2013-2014 (reflected in the table on the right). These new efforts bring the City closer to the intent of the guiding principle, but there is still significant room for improvement to allow for the type of comprehensive program evaluation that is called for when public and private funds are invested in programs of this nature. Recommendations The City should consider integrating a more robust set of performance metrics after it has established a regular tracking and reporting process related to the metrics in the 2013-2014 budget. The Market Study provided a list of several possible measures to consider for business retention and expansion, business attraction, and marketing. As part of the measurement process, the City should also build in a benchmarking effort that looks at its performance over time and compares performance to external metrics. In terms of external metrics, the City should look to published results from federal programs, like SBA and EDA, and participate in efforts that will allow it to compare its outcomes to peers throughout the country. For example, Atlas Advertising started an annual economic development outcomes benchmarking survey in 2011. The City participated in the 2012 version of the study and should continue to do so in the future. (Results for similar-sized communities [100,000 to 200,000 population] are presented in the table on the next page.) In addition, IEDC’s Accredited Economic Development Organization program creates a valuable
Performance Metrics for 2013-2014 Budget: Total Operations Budget Marketing Budget Economic Development Fund Budget Employees Number of trade shows, seminars, and
other events attended Number of Level 1 contacts Number of Level 2 contacts Number of Level 3 contacts Number of new jobs gained from incentive
recipients Number of new jobs gained from Sewer Fee
Credit recipients New contacts gained from trade shows and
other sources New sales tax or TOT revenue attributable
to incentive recipients Number of existing local businesses
assisted Metrics Selection Criteria: • Ability to be tracked • Connection to Council goal of increased job
creation/reduction of jobs-housing imbalance
• Ability to measure impact from outreach activities through to jobs created (contacts made to companies landed)
• Jobs generated, businesses assisted and/or tax revenues generated per $ of incentives provided
Center for Strategic Economic Research Draft 11

MARKET STUDY PROGRESS EVALUATION
network of peers that could be useful to the City for comparative analysis if it goes through the accreditation process (which also has perception of program quality benefits).** The City should also consider creating a new appointed standing commission on economic development. As a first step, the City could look to stakeholders that were involved with the 2010 Market Study as well as those community leaders that have demonstrated long-term support of the Economic Development Corporation and Chamber of Commerce to assess interest in joining a standing commission. This would be the ideal body to review the performance measures to build accountability as well as provide guidance on the integration of roles and responsibilities across local and regional economic development and business entities.
Atlas Measures 2011 Results 2012 Results
Yearly Unique Web Visits 19,016
Not reported, but available by request to participants
Conversations in Past 12 Months (discussions with prospective, existing, or entrepreneurial companies who are expanding or relocating)
89 112
Jobs in Last 12 Months (announced as a direct result of economic development programs)
1,243 737
Capital Investment in Last 12 Months (announced as a direct result of economic development programs)
$260 million $331 million
** Additional information on the Atlas Advertising survey is available at: http://blog.atlas-advertising.com/?p=3438. Information on the IEDC AEDO program is available at: http://www.iedconline.org/web-pages/professional-development/accredited-economic-development-organization-program/.
Center for Strategic Economic Research Draft 12
MARKET STUDY PROGRESS EVALUATION
Strategies Strategy 1: Create a process for long-term planning including the Sphere of Influence, area surrounding the mall, and other major assets to proactively shape the future around economic vitality
Progress Status: Satisfactory
Comments One of the City’s foremost strategies for growth was expansion into the Sphere of Influence area. On November 6, 2013, the Sacramento Local Agency Formation Commission (LAFCo) indicated that it would not vote in favor of the City’s application for expansion. In light of this position, the City elected to withdraw its application and shift the focus of future development internally, at least for the near term. The City does not plan to revisit the expansion approach for a few years. There are three main geographic areas in the city limits that now form the crux of the City’s long-term growth strategy. These areas include the area around the Outlet Collection @ Elk Grove, Civic Center District, and SEPA—each will be discussed separately in the following paragraphs. The first two areas were identified in the 2010 Market Study. Though the SEPA is the newest priority area, the City has made great strides with incorporating numerous recommended action items from the Market Study. Plans for development of the former Promenade mall site are finally underway after lying dormant for several years. The City has been working with The Howard Hughes Corporation that will be building The Outlet Collection at Elk Grove, which will encompass 125 acres along Promenade Parkway and feature more than 450,000 square feet of factory outlet retail. Project review and construction will be on a tight timeline because the development agreement from the former Promenade plan expires in 2015 (related building permit timelines have been extended). While the project will not necessarily contribute to a high-value employment base, the sales tax generated from the project has the potential to bolster the City’s economic development efforts. The development also represents a substantial investment in the City, sending a positive signal to the investment community. Another area in which the City is heavily investing is the Civic Center. As mentioned previously, Elk Grove was identified as a “Civic Amenities Hub” in the Greater Sacramento Region Civic Amenities Strategic Plan, primarily because of the City’s long-term plans for the Civic Center District, a 76-acre area in the Laguna Ridge Specific Plan. The site is bound by Elk Grove Boulevard to the north, Big Horn Boulevard to the west, and Lotz Parkway to the south. The City actively continues to implement the plan with the intent to develop facilities, activities, and amenities that promote Elk Grove as a regional cultural, tourist, and entertainment destination. A Market Report and Program Recommendations prepared by AECOM in 2010 identified the following uses for the Civic Center:
• Main Library • Community Center • Children’s Discovery Center
Center for Strategic Economic Research Draft 13
MARKET STUDY PROGRESS EVALUATION
• Commercial Development Complex (including hotel, conference center, restaurant, and outdoor event space)
• Other Commercial (pizza parlor, sports bar, and concession space) • Sports Facilities (field sports tournament facilities, aquatic center, and gymnasium)
The City has already committed funds for an aquatic center and waterpark, and the first phase of Civic Center development will break ground in 2015. As of the date of this report, the City has not yet determined which facilities or elements it will pursue next. The Civic Center is a prime location for fostering a distinct sense of place in the larger Elk Grove community. The Civic Center Design Guidelines call for a few “landmark buildings,” which have the potential to serve as architectural showcase pieces and local points of interest. Another long-term priority area is the SEPA, which comprises 1,200 acres at the southern edge of the City, north of Kammerer Road and west of the Outlet Collection @ Elk Grove area. The City’s community outreach and public visioning for this plan have identified that the SEPA’s primary purpose will be to create the future job center of Elk Grove. The draft land use plan proposes 300 acres of office, more than 100 acres of light industrial/flex space, 35 acres of mixed use, and 500 acres of residential, with densities ranging from one dwelling per half-acre for estate residential to 40 units per acre for high-density residential. As the SEPA has components of both a transit-oriented development (TOD) and business park, it is covered further under Strategies 2 and 3. Recommendations The 2010 Market Study recommended holding a planning retreat to identify prioritized City objectives for long-term development outcomes. The City does have a five-year Capital Improvement Plan and budget in place, which is reviewed by the City Council annually in the budget adoption process. The next Council long-term planning retreat is scheduled for after the 2014 election cycle. This retreat will be supported by a multidisciplinary planning effort that addresses interrelated planning, design, engineering, and economic topics and provides the City the opportunity to further refine its community vision and overarching goals for long-range planning projects. Two major focuses should be determining how the City can contribute to a cohesive vision and the identity of the City among residents and visitors alike. One long-term planning strategy the City should consider is strengthening efforts at creating districts in the City that have their own neighborhood identity and identifying each area’s unique role as a component of the larger community. This has been done to some extent through the incorporation of Special Planning Areas, and a small-scale district concept was introduced in the Elk Grove Town Center Design Guidelines as part of the Laguna Ridge Specific Plan. In addition, signage recognizing “Rural Elk Grove” has been implemented. A similar, but more comprehensive, citywide effort could help organize the City’s land use and policy decisions moving forward. The Next Economy Capital Region Prosperity Plan suggests capitalizing on regional assets such as the broad and established network of education and research institutions and comprehensive health and medical services. With Elk Grove’s upcoming influx of medical-oriented uses, such
Center for Strategic Economic Research Draft 14
MARKET STUDY PROGRESS EVALUATION
as the California Northstate University Colleges of Pharmacy and Medicine and two new hospitals (Dignity Health and Sutter), the City is well-positioned to participate in this regional effort. Elk Grove may have a competitive advantage over more urban municipalities in attracting research or medical users who are seeking larger floor plates and less expensive land. There has been a groundswell of interest and research focusing on medical uses as a catalyst for economic development. Numerous cities across the United States have created medical use-driven initiatives for this purpose, including recent efforts in Sacramento to pursue a “Medzone” initiative to leverage University of California (UC) Davis Medical Center and other facilities for purposes of bolstering local economic development in Oak Park and Stockton Boulevard. The City should review examples of these efforts and determine how the composition of new medical facilities may support development of related technologies, medical offices, wet lab space, and other facilities. Fostering synergy with higher education, particularly the new California Northstate University set to open in Elk Grove late in 2014, and local medical industry employers may also increase student retention after graduation, growing the City’s highly-skilled labor force.
Center for Strategic Economic Research Draft 15
MARKET STUDY PROGRESS EVALUATION
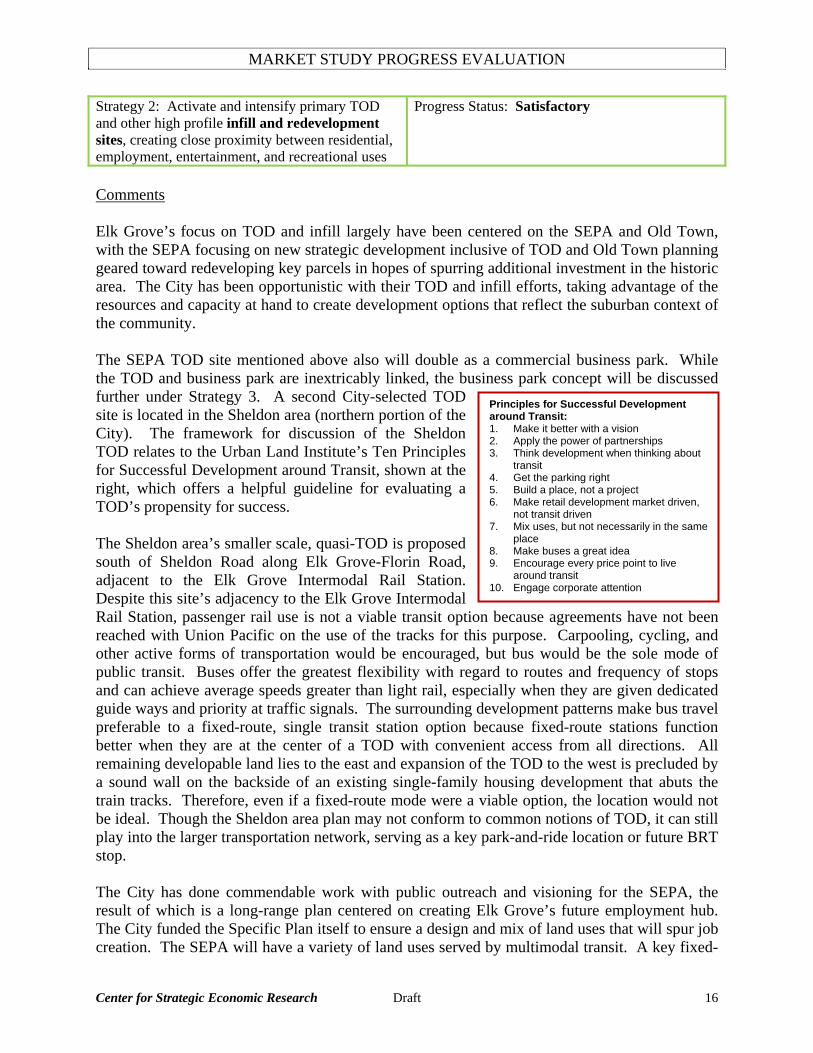
Strategy 2: Activate and intensify primary TOD and other high profile infill and redevelopment sites, creating close proximity between residential, employment, entertainment, and recreational uses
Progress Status: Satisfactory
Comments Elk Grove’s focus on TOD and infill largely have been centered on the SEPA and Old Town, with the SEPA focusing on new strategic development inclusive of TOD and Old Town planning geared toward redeveloping key parcels in hopes of spurring additional investment in the historic area. The City has been opportunistic with their TOD and infill efforts, taking advantage of the resources and capacity at hand to create development options that reflect the suburban context of the community. The SEPA TOD site mentioned above also will double as a commercial business park. While the TOD and business park are inextricably linked, the business park concept will be discussed further under Strategy 3. A second City-selected TOD site is located in the Sheldon area (northern portion of the City). The framework for discussion of the Sheldon TOD relates to the Urban Land Institute’s Ten Principles for Successful Development around Transit, shown at the right, which offers a helpful guideline for evaluating a TOD’s propensity for success.
Center for Strategic Economic Research Draft 16
The Sheldon area’s smaller scale, quasi-TOD is proposed south of Sheldon Road along Elk Grove-Florin Road, adjacent to the Elk Grove Intermodal Rail Station. Despite this site’s adjacency to the Elk Grove Intermodal Rail Station, passenger rail use is not a viable transit option because agreements have not been reached with Union Pacific on the use of the tracks for this purpose. Carpooling, cycling, and other active forms of transportation would be encouraged, but bus would be the sole mode of public transit. Buses offer the greatest flexibility with regard to routes and frequency of stops and can achieve average speeds greater than light rail, especially when they are given dedicated guide ways and priority at traffic signals. The surrounding development patterns make bus travel preferable to a fixed-route, single transit station option because fixed-route stations function better when they are at the center of a TOD with convenient access from all directions. All remaining developable land lies to the east and expansion of the TOD to the west is precluded by a sound wall on the backside of an existing single-family housing development that abuts the train tracks. Therefore, even if a fixed-route mode were a viable option, the location would not be ideal. Though the Sheldon area plan may not conform to common notions of TOD, it can still play into the larger transportation network, serving as a key park-and-ride location or future BRT stop.
Principles for Successful Development around Transit: 1. Make it better with a vision 2. Apply the power of partnerships 3. Think development when thinking about
transit 4. Get the parking right 5. Build a place, not a project 6. Make retail development market driven,
not transit driven 7. Mix uses, but not necessarily in the same
place 8. Make buses a great idea 9. Encourage every price point to live
around transit 10. Engage corporate attention
The City has done commendable work with public outreach and visioning for the SEPA, the result of which is a long-range plan centered on creating Elk Grove’s future employment hub. The City funded the Specific Plan itself to ensure a design and mix of land uses that will spur job creation. The SEPA will have a variety of land uses served by multimodal transit. A key fixed-
MARKET STUDY PROGRESS EVALUATION
route transit element is the Regional Transit Blue Line, which is a Sacramento Region light rail extension that is 15 to 20 years from completion. Though Regional Transit has not released proposed routes for this area, the City has prudently set aside right-of-way for future passenger rail use. The SEPA has a broad range of uses, including various densities of housing, office, light industrial/flex space, commercial, schools, parks, and a possible sports center (reserved for the possibility of developing a major sports complex). Mixing uses has the ability to generate a vibrant neighborhood, but they do not necessarily have to be in the same building or even in the same place to be effective. It is possible to mix uses along a transit corridor, having different nodes for particular functions (e.g., working, shopping, and living). As an example, linking the SEPA, mall area, Civic Center, and Old Town would connect many of the community’s assets. The proposed BRT project would begin to accomplish this. In line with the draft plan, to create a true transit-centered community, the SEPA transit stop should be located at the core of the project area, generating activity on all sides instead of on the periphery. Making transit the physical epicenter will bring it to the mental forefront of the community, which is essential to creating a true transit-centered community. A positive pedestrian experience is fundamental to establishing a sense of place. This can be done by creating compact blocks, pleasant walkways, and continuous street-front experiences. The current draft of the SEPA plan calls for the creation of these elements and the City is encouraged to follow-through on their development as the plan moves forward. The SEPA’s land plan is poised to appeal to a broad socio-economic resident base. It proposes high-density residential to very low-density, estate residential. The estate residential is a niche residential market that is not being served in the community. This type of housing would add diversity to the currently offered housing typologies and has the potential to attract an executive level workforce; however, the current proposed location for estate residential is near light industrial space to the southeast, high-density housing to the north, and a future major thoroughfare to the south (the Capital Southeast Connector), which may present compatibility challenges. The 2010 Market Study recommended Old Town be considered as a primary site for a future TOD, and it remains an area naturally inclined for such use, particularly with its historic character, pedestrian-scaled architecture, and recent streetscape improvements. Although redevelopment initiatives for this area have been constrained because of the dissolution of redevelopment agencies in California, the City has purchased a five-acre site from Union Pacific, which is located at the intersection of Elk Grove Boulevard and Railroad Avenue and is working collaboratively with the Sacramento Area Council of Governments (SACOG) and Portland State University on a study to explore potential catalyst uses on this critical parcel. The objective of this project is to help spur redevelopment and revitalization of Old Town by identifying viable uses for the site. The City has solicited public input through community meetings and by adding questions about Old Town in the 2013 National Citizen Survey for Elk Grove. Examples of potential catalyst uses for the five-acre site include restaurants, boutique retail, or a small-scale performing arts venue, to name a few. Old Town is experiencing private-sector interest, as evidenced by the recent purchase of the Odd Fellows property and reported interest from a group
Center for Strategic Economic Research Draft 17

MARKET STUDY PROGRESS EVALUATION
exploring purchasing the General Store. Vacancy remains very low for ground-floor shops, but the mix and diversity of uses could be improved. Recommendations Though the City has little direct influence on the development of regional transportation systems, advocating for light rail, and the Blue Line implementation in particular, should be a top priority. A light rail extension to Elk Grove will strengthen the City’s connections with the greater Sacramento Region, mitigate traffic congestion, and spur TOD. When Regional Transit reinitiates efforts to extend light rail service to Elk Grove, the City should work collaboratively with Regional Transit to reinstitute fee collection to help fund the extension. Though development fees generally should be used sparingly (in line with Guiding Principle 1), this type of fee collection could be considered since it supports creation of signature projects anchored by light rail with higher assessed values and economic performance benefitting the City. In addition, the City should work with regional partners to identify incentives and funding sources for TOD development. Recent activities related to a HUD Sustainability Grant being carried out by SACOG, in conjunction with the Urban Land Institute, provide for entitlement streamlining under SB375. Other cities have had success with implementing creative incentives for TOD, including sliding scale impact fees that allow fee credits that are commensurate with proximity to transit, and special accommodations for projects that incorporate mixed-use formats and reduce trips. In regards to the SEPA TOD, care should be taken to avoid suburban-oriented traffic standards in the development, which limit density and detract from the pedestrian experience. The City will need to consider ways to minimize the impact of parking and take advantage of shared parking opportunities. Parking located near, but separate from, the station can foster density at the station and encourage foot traffic near retail and business sites. As the plan shifts from a schematic design to actual buildout, it will be critical to reinforce appropriate design guidelines during the project review stage and to incorporate bus options as a first phase. In addition, the City should consider exploring more appropriate locations elsewhere in the City for estate residential concept in the SEPA. General proximity or access to areas encompassing permanently designated open space, such as the area’s beautiful riparian corridors and wetlands, or sites with access to nature trails or pathways, may support this housing type. It is critical that best practices in environmental and ecological protection be a key aspect of any such development. In contrast, luxury-oriented apartments and condominiums offering urban living near transit and other interesting amenities could provide an alternative housing typology that would have a similar effect of providing a product that appeals to a higher income range. As the SEPA takes shape, preserving and expanding a diversity of housing, including affordable and senior options, also will be important to realizing successful transit operations. The Old Town area has the most distinct character in all of Elk Grove, and the City should continue to make the improvement of this unique community asset a high priority. The City should maintain a long-term goal of creating a TOD designation in Old Town, whether it is
Center for Strategic Economic Research Draft 18
MARKET STUDY PROGRESS EVALUATION
through light rail, heavy rail, or bus. A fixed-route TOD may not be viable in the near term, but consistent concerted efforts eventually may be successful. The Old Town area should also be evaluated in terms of strategies to increase the depth of the district, adding density through development of additional housing, and seeking a variety of residential products to appeal to a wide range of incomes. One strategy for encouraging redevelopment of Old Town may be to expand the Multifamily Residential Zones. Currently, there are only a few parcels that allow for multi-family use in Old Town. These are located toward the east end between Kent Street and Waterman Road and already are occupied by garden-style walk-up apartments. Allowing for more mixed-use multi-family in the core of Old Town could add vibrancy to the district and may make ground-floor commercial more financially feasible for developers who could not otherwise justify stand-alone commercial space. Finally, the City should evaluate potential substitutes for redevelopment to help spur Old Town revitalization. Many cities are evaluating options for improving downtown and infill districts in lieu of tax-increment financing. Potential for an Infrastructure Financing District or other mechanisms, as new legislation providing for enhanced infill financing options begins to emerge from the State legislature in the coming year, should be explored on a continual basis. One recent trend that might be worthy of further exploration is a Community Development Corporation (CDC). CDCs in San Diego, Roseville, and other California cities have been structured as 501 (c) (3) nonprofit organizations with a Board of Directors independent of the City Council. In many cases, the organization’s charter includes authorized activities, investment targets, criteria for investment, and other pertinent elements. However, seed funding may be a difficult challenge because such resources may be scarce in Elk Grove and other viable private sources would need to be identified. It is important to recognize that focusing on private funding sources could compete with funding requests from the Economic Development Corporation and Chamber of Commerce in the future. Further study of this topic would be necessary to judge its applicability in Elk Grove.
Center for Strategic Economic Research Draft 19
MARKET STUDY PROGRESS EVALUATION
Strategy 3: Improve Elk Grove’s competitive position for regional growth by facilitating and supporting private investment in a major, high profile new business park, targeted to office, R&D, light industrial, heavy industrial warehouse/distribution, and campus users
Progress Status: Satisfactory
Comments The City is currently experiencing interest in a variety of property types. For example, the City’s online property search system reveals that the top ten most frequently searched sites include three retail centers, two office properties, two industrial sites, one flex site, and one industrial land site. This reveals interest in the City for a full range of business property types, and a need to focus on the lack of high-profile business park space may be the best chance at attracting high value employers bringing additional wealth and employment opportunities into Elk Grove. The City has done well with its efforts to ensure there is sufficient appropriately zoned land for industrial uses. The recent Industrial Sites Analysis Project analyzed the amount, location, and character of the industrial areas of the City, and identified key industrial sites for rezone. Site 4 (along Laguna Boulevard near Interstate 5) could be an especially strategic site, as it has prime visibility from the Interstate 5 corridor. A notable use with good urban design features at this location could serve as a window to the future of Elk Grove, making a statement about the direction the City is taking in terms of attracting major industries or projecting a given theme. Providing appropriately-sized commercial space is key to attracting employment-generating development. There is approximately 200,000 square feet of vacant office space in the City, but it is predominately packaged in 5,000- to 15,000-square-foot spaces, which is good for small and medium enterprises, but presents a challenge since the majority of users are seeking larger building floor plates. The former Bimbo Bakery facility has the largest single building footprint at 150,000 square feet, falling hundreds of thousands of square feet short of what many warehousing and manufacturing companies are seeking in today’s market. Examining the characteristics of the business location and expansion leads that SACTO has circulated among the communities in the Sacramento Region reveals that Elk Grove was not able to compete for the opportunities in the vast majority of cases due to a lack suitable buildings or land. This current shortage of commercial space makes provision of future office and industrial properties critical for the SEPA if Elk Grove is to become a more competitive market for high-value business opportunities in the broader Sacramento Region. As mentioned previously, the SEPA draft land use plan proposes 15 acres of commercial, 290 acres of office, and over 110 acres of light industrial/flex space. This is expected to yield approximately 190,000 square feet of commercial; 5,430,000 of office; and 1,440,000 of industrial/flex space. The predominately flat, raw land presents few geographic encumbrances lending to flexibility in siting different land uses. This is a strategic location for major distribution, a regional mall, and a mixed use plan. In an effort to retain the TOD and accommodate appropriate employment space, individual non-residential typologies may need to be refined and periodically rebalanced. While the overall scale of the plan is appropriate, the
Center for Strategic Economic Research Draft 20
MARKET STUDY PROGRESS EVALUATION
internal allocation of office, research and development, flex, light industrial, manufacturing, warehouse/distribution, and Campus uses may require adjustment based on evolving market forces. Of these uses, light industrial/flex holds great potential for capturing many different types of users, and may prove valuable in attracting users across a number of targeted sectors and clusters that require research and development or specialized space (e.g. wet lab) that is currently in limited supply within the Sacramento Region. Recommendations The City should focus on attracting uses with substantial employment density and high assessed values. While most warehouse/distribution uses fail to meet these objectives, a subset may be more appropriate to the extent the companies conduct packaging, labeling, and other internal value-added activities. It will also be important to acknowledge that speculative development is likely to be slow in initial years; however, SEPA sites may be very attractive to firms looking for space through a build-to-suit arrangement. Careful programming in the form of traffic analysis, economic analysis, and planning (e.g., use restrictions and design guidelines) will be required to ensure compatibility between the mall, TOD, and business park components. A preliminary study of this nature should be conducted prior to potential developer outreach. At this time, it would also be useful to evaluate allocations of retail and recreational space, and to carefully think through potential conflicts brought about by land use adjacencies. Examples include ensuring that truck circulation is compatible with mall operations and assessing retail demand considering that retail space supporting business parks is typically modest in scale, so this use will depend on rooftops (and the consumer preferences of those types of households envisioned in the plan) and cannot be expected to be supported by transit users. Once this evaluation is complete, the City will be well-positioned to solicit development interests in an effort to find a development partner that can work with property owners to create a feasible, phased approach to this ambitious mixed-use endeavor. In order to distinguish itself as a strong provider of regionally significant high-value jobs that will bring additional wealth and a stronger competitive market position to Elk Grove, it is critical to establish and maintain business park land resources. The SEPA is very well positioned to play this role. However, over time, the City is likely to receive pressure to rezone portions of this area to residential, retail, or other uses based on more immediate market demand. Retail, for example, can justify a higher land value per square foot than business park uses. However, business park uses generate other types of financial and economic benefits including higher wage rates and important links to other driving industries, and offer long-term stability and diversity to the City’s overall employment profile. To help avoid situations where developers feel compelled to rezone business park properties due to potential carrying costs during periods of slow or moderate absorption, it will be important to phase infrastructure and related development based on a careful evaluation of market opportunities and project economics.
Center for Strategic Economic Research Draft 21
MARKET STUDY PROGRESS EVALUATION
Strategy 4: Develop a business retention and expansion program to enhance the local business climate and job creation
Progress Status: Satisfactory
Comments The City began participating in the Sacramento Metro Chamber’s Metro Pulse program, a coordinated regional structure for business retention and expansion, and took part in its first annual business walk series in 2012. The 2012 business walk resulted in numerous follow-up communications with local companies and related assistance. For example, City staff identified key intervention that was needed to assist GNB Valves and California Northstate University in their expansion efforts in Elk Grove. GNB Valves, an expanding company supporting 40 jobs in Elk Grove, expressed concerns with zoning codes and availability of qualified employees—the City helped resolve the zoning issues and coordinated with the Workforce Focus Group at the Economic Development Corporation that connected the company to programs at local education and training providers for current and future staffing and training needs. California Northstate University, a new company in Elk Grove that will be opening in the fall of 2014, stated that they were interested in developing a research lab—City staff worked with University representatives to identify a site for the lab, which is included in the plans for the second phase of facilities construction. City records highlight one prominent company, Bell Brothers, that relocated a large portion of their operations to the Mather area due to difficulties finding cost effective, available space in Elk Grove. Three other companies closed due to market pressures or corporate dissolution. The 2012 and 2013 business walks also revealed a handful of themes based on comments regarding what could be done to improve business in Elk Grove, including signage, visibility and awareness of local businesses, traffic and parking, and business regulations. The City has implemented several changes in response to the concerns about local business regulations including its reduction of business license fees, small business loans, and the “Tenant Improvement Tuesdays” program. In addition, the City put together a number of campaigns focused on raising awareness of local businesses including Think Shop Live in 2009 and the new Elk Grove Gets Online and Picture Yourself in Elk Grove initiatives. It is important to note that many of the comments related to business climate issues focused on policies and regulations at the state level. These business walk findings are also in line with a small business friendliness study produced by Thumbtack and the Kaufman Foundation that gave the greater Sacramento area (including Elk Grove) a grade of ‘F’ for overall friendliness—many of the individual business owner comments collected in the study survey process pointed specifically to state regulations rather than local issues. The Metro Pulse program provides a basic, established structure for participating communities that includes questionnaires, tracking mechanisms, and administrative support for business walks. However, each participant still needs to develop its own follow-up protocols and service provider commitments based on internal capacities and partner networks in order to ensure that business expectations are effectively and professionally addressed. The City did not establish strict, formal follow-up protocols or obtain local and regional service provider (e.g. Chamber of
Center for Strategic Economic Research Draft 22

MARKET STUDY PROGRESS EVALUATION
Commerce, Small Business Development Center, and utility providers) commitments prior to implementing the Metro Pulse program as recommended in the Market Study. Although it does not appear that any problems have resulted from the existing informal system, these two elements are critical to long-term business retention and expansion program success and should be established moving forward. To date, the City has primarily conducted its business outreach through the Metro Pulse business walk structure. The Market Study recommended four tiers of business outreach targets (listed on the right) with three of the four potentially requiring a different approach than the business walk structure. City staff indicated that they have already begun some outreach to major employers, but will be adding a stronger business visitation element to their business retention and expansion program soon, contemplated at reaching one business per week. However, City staff suggested that they have not fully built in the various categories of targets into their business visitation structure. It is also not clear if economic development staff has created new questionnaires (and related tracking mechanisms) that are more appropriate for site visits compared to those being used in the business walks. Before fully implementing the business visitations, the City should ensure that appropriate procedures are in place to effectively select companies, interface with company representatives, and track outcomes of the weekly outreach.
Site Visit Targets: 1. Major employers 2. Fast-growing
companies 3. Business attraction
target sectors 4. Geographic areas
(business walks)
Recommendations As discussed above, the City should implement the follow-up protocols, service provider commitments, and site visit targets based on the actions outlined in the 2010 Market Study. At the same time as the City enhances its business retention and expansion program, it should also consider integrating messaging around this program within its marketing efforts (through traditional channels and social media) focused on existing businesses in the community. Along with a basic overview of relevant economic development programs and services, this messaging could include information about availability of staff for a site visit and the existing online request system as well as examples of outcomes from follow-up related to the business walks. This could help maximize use of and trust in the program among existing businesses and ultimately drive increased program results, which have a major impact on job creation in the community. The Workforce Focus Group was established under the Economic Development Corporation and has clearly been helpful working with companies on staffing and training needs. City staff has cited the importance of this type of effort moving forward and, noting this, should ensure the continuation of the group in its current form or some other structure. Additionally, as noted in the 2010 Market Study, it is likely that the business retention and expansion program will regularly obtain feedback from businesses that point to issues that will require local, regional, and statewide advocacy in order to create the changes needed to improve the business climate. The City should continue to work with and garner support from partners that can assist with addressing the broader business climate issues like the Interagency Forum, Elk Grove Chamber of Commerce, and Sacramento Metro Chamber.
Center for Strategic Economic Research Draft 23
MARKET STUDY PROGRESS EVALUATION
Strategy 5: Create strategic groupings of targeted industries for business attraction efforts to diversify the economy and grow the economic base
Progress Status: Excellent
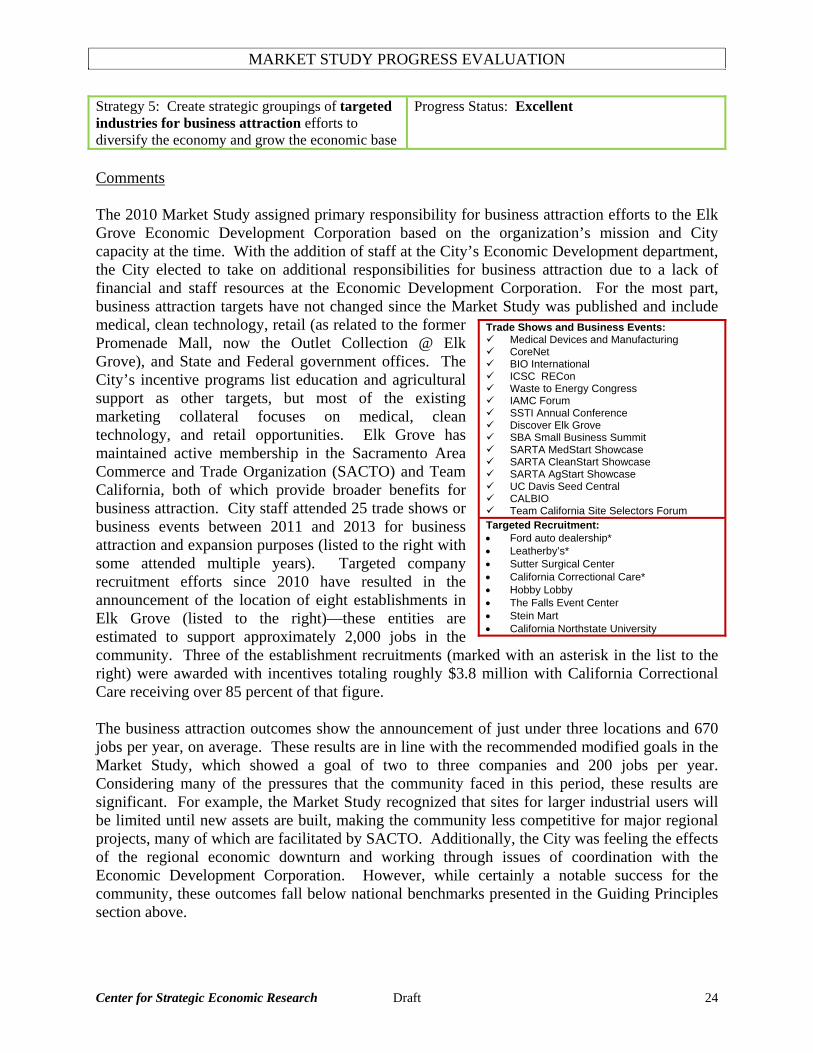
Comments The 2010 Market Study assigned primary responsibility for business attraction efforts to the Elk Grove Economic Development Corporation based on the organization’s mission and City capacity at the time. With the addition of staff at the City’s Economic Development department, the City elected to take on additional responsibilities for business attraction due to a lack of financial and staff resources at the Economic Development Corporation. For the most part, business attraction targets have not changed since the Market Study was published and include medical, clean technology, retail (as related to the former Promenade Mall, now the Outlet Collection @ Elk Grove), and State and Federal government offices. The City’s incentive programs list education and agricultural support as other targets, but most of the existing marketing collateral focuses on medical, clean technology, and retail opportunities. Elk Grove has maintained active membership in the Sacramento Area Commerce and Trade Organization (SACTO) and Team California, both of which provide broader benefits for business attraction. City staff attended 25 trade shows or business events between 2011 and 2013 for business attraction and expansion purposes (listed to the right with some attended multiple years). Targeted company recruitment efforts since 2010 have resulted in the announcement of the location of eight establishments in Elk Grove (listed to the right)—these entities are estimated to support approximately 2,000 jobs in the community. Three of the establishment recruitments (marked with an asterisk in the list to the right) were awarded with incentives totaling roughly $3.8 million with California Correctional Care receiving over 85 percent of that figure.
Trade Shows and Business Events: Medical Devices and Manufacturing CoreNet BIO International ICSC RECon Waste to Energy Congress IAMC Forum SSTI Annual Conference Discover Elk Grove SBA Small Business Summit SARTA MedStart Showcase SARTA CleanStart Showcase SARTA AgStart Showcase UC Davis Seed Central CALBIO Team California Site Selectors Forum
Targeted Recruitment: • Ford auto dealership* • Leatherby’s* • Sutter Surgical Center • California Correctional Care* • Hobby Lobby • The Falls Event Center • Stein Mart • California Northstate University
The business attraction outcomes show the announcement of just under three locations and 670 jobs per year, on average. These results are in line with the recommended modified goals in the Market Study, which showed a goal of two to three companies and 200 jobs per year. Considering many of the pressures that the community faced in this period, these results are significant. For example, the Market Study recognized that sites for larger industrial users will be limited until new assets are built, making the community less competitive for major regional projects, many of which are facilitated by SACTO. Additionally, the City was feeling the effects of the regional economic downturn and working through issues of coordination with the Economic Development Corporation. However, while certainly a notable success for the community, these outcomes fall below national benchmarks presented in the Guiding Principles section above.
Center for Strategic Economic Research Draft 24
MARKET STUDY PROGRESS EVALUATION
The targeted recruitments fall across the three groupings of targeted industries recommended in the Market Study: 1) viable clusters and industries, 2) catalytic opportunities, and 3) business climate enhancement. However, as mentioned above, efforts within the first grouping, viable clusters and industries, primarily focused on the prior original targets, which are not as robust as the list recommended within the Market Study. The clusters in the recommended list were selected mainly due to local economic performance, but many demonstrated other beneficial characteristics like high employment multipliers, occupational demand aligned with the local workforce, and economic base activities. The Market Study also recommended reevaluating targeted industries every three years to account for economic restructuring, economic development successes, broader business climate factors, and firm dynamics in the local and regional economies. As the City transitions to taking full responsibility for business attraction activities, it should reassess the groupings of targeted industries with an expanded focus on higher value industries with diversified employment opportunities for residents. Any new or modified targets will require the creation of messaging and supplemental materials as well as prospect identification and outreach opportunities. The City will also need to assess alignment with incentive programs which list specific targeted industries and related North American Industrial Classification System (NAICS) codes. In addition, the City will also need to consider opportunities created by the Governor’s recently announced “California Competes” program of tax and hiring incentives. Recommendations The City, Economic Development Corporation, and Chamber of Commerce should evaluate means to set aside existing or additional resources to be used specifically for tools and activities that will support business attraction efforts (e.g. site selector familiarization tours, targeted marketing, and direct company outreach). Considering the potential for supplemental tools and activities along with past City staff accomplishments, improved regional economic conditions, and plans for new competitive assets in the SEPA, the City should consider setting an expanded business attraction goal. As discussed above, the City should reassess its business attraction targets. In addition to considering local trends and the viable clusters and industries identified in the 2010 Market Study, the City should also consider its role in the core business clusters identified as part of the Next Economy Capital Region Prosperity Plan (listed to the right).†† The Next Economy research effort built a robust regional analysis using recent data and forecasts for future growth to identify clusters that present opportunities for growth and development across the entire Region. Several of Elk Grove’s existing and recommended targets align with the Next Economy core business clusters, but might require an expanded definition of the range of activities. For example the agriculture support activities mentioned in the City’s incentive targeting could be expanded to include a broader base of food-related industries and the medical industry focus could be reevaluated to determine if related biotechnology and medical research opportunities should be
Next Economy Core Business Clusters: 1. Advanced
Manufacturing 2. Agriculture & Food 3. Clean Energy
Technology 4. Education & Knowledge
Creation 5. Information &
Communications Technology
6. Life Sciences & Health Services
†† Definitions of the core business clusters are presented in the Next Economy Research Report, which is available for download at: http://www.nexteconomycapitalregion.org/Research.html.
Center for Strategic Economic Research Draft 25
MARKET STUDY PROGRESS EVALUATION
included (especially considering the California Northstate University presence). Others like Advanced Manufacturing and Information & Communications Technology will need to be assessed for specific core activities where Elk Grove can present a strong value proposition for business locations. With modified business attraction targets and expanded goals, the City should consider investing resources in lead generation services, similar to what the Economic Development Corporation did for a brief period through a contract with ROI Research on Investment. These types of services can provide a set of qualified leads within specific targeted industries. This would help City economic development staff expand business attraction prospects across a diverse range of targets without having to nurture new leads within relevant business networks, many of which staff might not be familiar with or in domestic and international locations that are costly to access directly. The City should also consider strengthening and expanding its relationships with corporate real estate brokers and developers that cover the Sacramento Region and work more broadly throughout Northern California. Some of the business events that the City’s economic development staff have attended and plan to attend in coming years can help build the relationships in the corporate real estate field (e.g. CoreNet, IAMC, and SIOR), but additional direct outreach with managing directors and individual brokers could be beneficial.
Center for Strategic Economic Research Draft 26
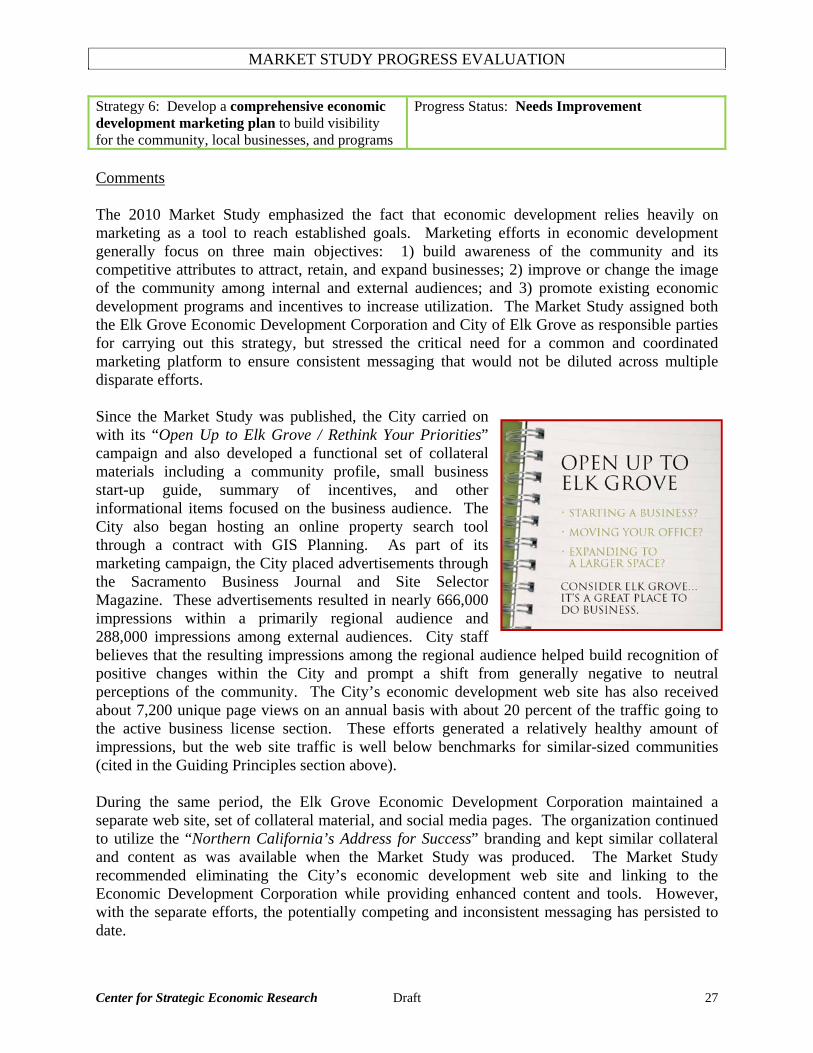
MARKET STUDY PROGRESS EVALUATION
Strategy 6: Develop a comprehensive economic development marketing plan to build visibility for the community, local businesses, and programs
Progress Status: Needs Improvement
Comments The 2010 Market Study emphasized the fact that economic development relies heavily on marketing as a tool to reach established goals. Marketing efforts in economic development generally focus on three main objectives: 1) build awareness of the community and its competitive attributes to attract, retain, and expand businesses; 2) improve or change the image of the community among internal and external audiences; and 3) promote existing economic development programs and incentives to increase utilization. The Market Study assigned both the Elk Grove Economic Development Corporation and City of Elk Grove as responsible parties for carrying out this strategy, but stressed the critical need for a common and coordinated marketing platform to ensure consistent messaging that would not be diluted across multiple disparate efforts. Since the Market Study was published, the City carried on with its “Open Up to Elk Grove / Rethink Your Priorities” campaign and also developed a functional set of collateral materials including a community profile, small business start-up guide, summary of incentives, and other informational items focused on the business audience. The City also began hosting an online property search tool through a contract with GIS Planning. As part of its marketing campaign, the City placed advertisements through the Sacramento Business Journal and Site Selector Magazine. These advertisements resulted in nearly 666,000 impressions within a primarily regional audience and 288,000 impressions among external audiences. City staff believes that the resulting impressions among the regional audience helped build recognition of positive changes within the City and prompt a shift from generally negative to neutral perceptions of the community. The City’s economic development web site has also received about 7,200 unique page views on an annual basis with about 20 percent of the traffic going to the active business license section. These efforts generated a relatively healthy amount of impressions, but the web site traffic is well below benchmarks for similar-sized communities (cited in the Guiding Principles section above). During the same period, the Elk Grove Economic Development Corporation maintained a separate web site, set of collateral material, and social media pages. The organization continued to utilize the “Northern California’s Address for Success” branding and kept similar collateral and content as was available when the Market Study was produced. The Market Study recommended eliminating the City’s economic development web site and linking to the Economic Development Corporation while providing enhanced content and tools. However, with the separate efforts, the potentially competing and inconsistent messaging has persisted to date.
Center for Strategic Economic Research Draft 27
MARKET STUDY PROGRESS EVALUATION
The City is embarking on two new marketing campaigns, “Opportunity Knocks” and “Picture Yourself in Elk Grove,” with the former primarily for economic development purposes and the latter focused on tourism and a broader audience interested in community quality of life and recreational/entertainment aspects. The “Opportunity Knocks” campaign will include targeted e-mail outreach as well as advertisement placements through the Sacramento Business Journal and other Business Journal markets in the country, Site Selection Magazine, and Medical Devices Daily, reflecting a shifting focus on external audiences. While this campaign has elements that are appealing to both the business and talent audiences, it appears to provide limited geographic orientation in the messaging (a positive component of the Economic Development Corporation messaging), an attribute that the Market Study recommended addressing since Elk Grove is a relatively unknown location outside the Sacramento Region (and Sacramento can be unfamiliar in other parts of the country and world). As the new campaign rolls out, the City should consider addressing this component in the messaging, especially considering the shifting focus on external audiences—in this effort, it will be important to clearly distinguish the competitive attributes of the community within the Region. The City should also start a marketing ambassadors program using the types of local and regional champions recommended in the Market Study and arming them with messaging incorporated in the “Opportunity Knocks” campaign. The Economic Development Corporation is currently contemplating a transition to a new operational model, which will focus exclusively on community marketing and minimize delivery of core economic development programs and services. While the issue of separate web sites and messaging will still exist regardless of if the Economic Development Corporation moves forward with this transition, if it were to occur, both the City and the Economic Development Corporation should adopt a heightened sensitivity to the issue in any new marketing efforts. Every effort should be made to invest in complementary marketing efforts that target specific audiences and are designed to generate desired outcomes aligned with the objectives integrated into the Market Study strategies. While the specifics of the potential new operating model for the Economic Development Corporation were not established at the time of this progress evaluation, the City should still consider building a site similar to or adopting the structure of the existing Economic Development Corporation web site. Since business and talent conduct the first round of location selection online, it is important to present a contemporary and appealing web site that is mobile-friendly. A web site distinct from the standard City structure, but with similar content as on the economic development site currently, would allow for more flexibility in the design and functionality (engaging a web design firm with experience in economic development could be helpful in this exercise). This approach would also help distinguish economic development messaging from the City-wide values-based “Proud Heritage-Bright Future” tagline. City economic development staff should also expand the use of the primarily social media channels for business attraction, retention, and expansion as well as talent and tourism marketing. Like other marketing efforts, the City and Economic Development Corporation will need to be sensitive to common messaging if both continue to maintain a social media presence.
Center for Strategic Economic Research Draft 28
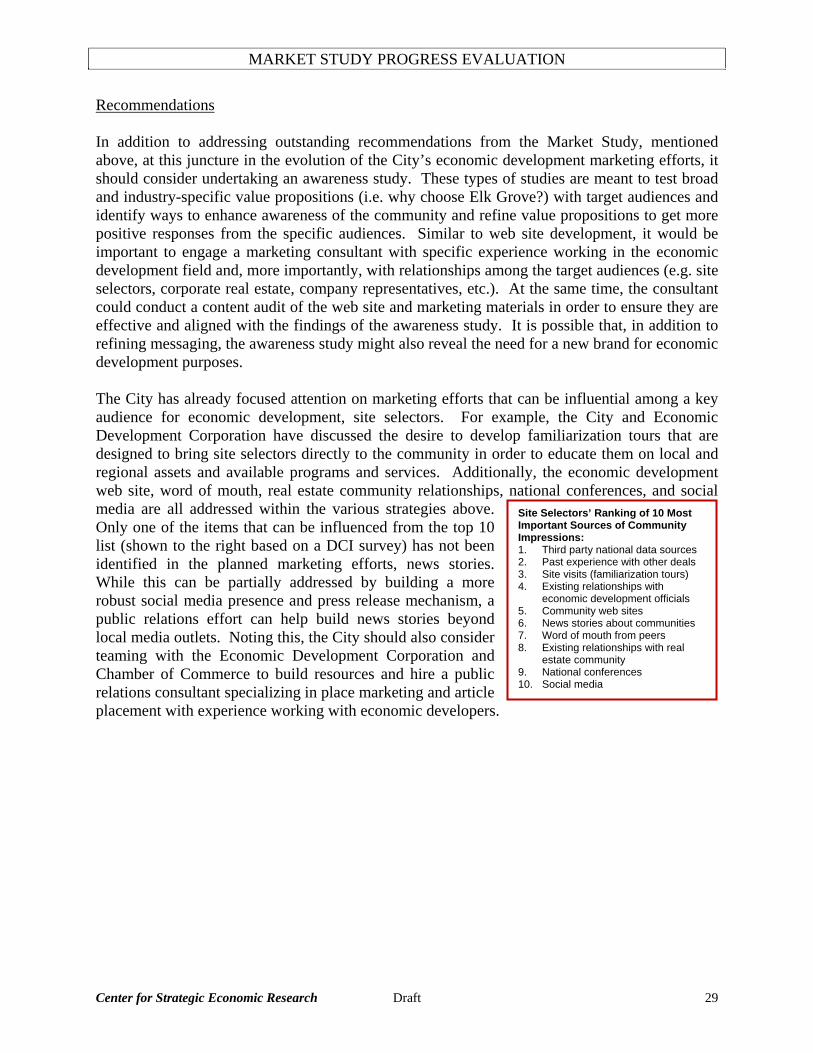
MARKET STUDY PROGRESS EVALUATION
Recommendations In addition to addressing outstanding recommendations from the Market Study, mentioned above, at this juncture in the evolution of the City’s economic development marketing efforts, it should consider undertaking an awareness study. These types of studies are meant to test broad and industry-specific value propositions (i.e. why choose Elk Grove?) with target audiences and identify ways to enhance awareness of the community and refine value propositions to get more positive responses from the specific audiences. Similar to web site development, it would be important to engage a marketing consultant with specific experience working in the economic development field and, more importantly, with relationships among the target audiences (e.g. site selectors, corporate real estate, company representatives, etc.). At the same time, the consultant could conduct a content audit of the web site and marketing materials in order to ensure they are effective and aligned with the findings of the awareness study. It is possible that, in addition to refining messaging, the awareness study might also reveal the need for a new brand for economic development purposes. The City has already focused attention on marketing efforts that can be influential among a key audience for economic development, site selectors. For example, the City and Economic Development Corporation have discussed the desire to develop familiarization tours that are designed to bring site selectors directly to the community in order to educate them on local and regional assets and available programs and services. Additionally, the economic development web site, word of mouth, real estate community relationships, national conferences, and social media are all addressed within the various strategies above. Only one of the items that can be influenced from the top 10 list (shown to the right based on a DCI survey) has not been identified in the planned marketing efforts, news stories. While this can be partially addressed by building a more robust social media presence and press release mechanism, a public relations effort can help build news stories beyond local media outlets. Noting this, the City should also consider teaming with the Economic Development Corporation and Chamber of Commerce to build resources and hire a public relations consultant specializing in place marketing and article placement with experience working with economic developers.
Site Selectors’ Ranking of 10 Most Important Sources of Community Impressions: 1. Third party national data sources 2. Past experience with other deals 3. Site visits (familiarization tours) 4. Existing relationships with
economic development officials 5. Community web sites 6. News stories about communities 7. Word of mouth from peers 8. Existing relationships with real
estate community 9. National conferences 10. Social media
Center for Strategic Economic Research Draft 29
MARKET STUDY PROGRESS EVALUATION
Summary of Recommendations Below is a summary of the recommendations for moving action items forward or modifying approaches discussed in the previous sections. Guiding Principle 1
Continue conducting the biannual communitywide survey and consider other creative methods for obtaining resident feedback.
Ensure that future development approaches adopt design standards that support quality community assets.
Monitor the effectiveness of the new land-secured financing policies and refine them as warranted.
Revive a feedback system focused on applicant’s satisfaction and experience with the permitting process.
Guiding Principle 2
Integrate a more robust set of performance measures and establish a benchmarking effort that examines performance over time and relative to external metrics and peers.
Create a new appointed standing commission on economic development to provide guidance, review performance, and build accountability.
Strategy 1
Conduct a long-range planning retreat after the 2014 election cycle to refine the community vision and overarching goals for development.
Establish a citywide effort to create districts that have a unique identities and roles in the larger community.
Assess opportunities for new research and medical users to capitalize on new investments and regional attention.
Strategy 2
Advocate for reinstating efforts to extend light rail services to Elk Grove and work collaboratively with Regional Transit to reinstitute fee collection to fund the extension.
Identify incentives and funding sources for TOD development. Avoid suburban-oriented traffic standards in the SEPA TOD development and reinforce
design standards during the project review stage. Consider more appropriate locations for the estate residential concept in the SEPA while
preserving and expanding a diversity of housing options. Maintain a long-term goal of creating a TOD designation in Old Town. Evaluate strategies to increase the depth of the Old Town area by adding density through
additional housing and expanding the Multifamily Residential Zones. Assess potential substitutes for redevelopment to help spur Old Town revitalization.
Strategy 3
Focus on attracting uses with substantial employment density and high assessed values within the SEPA commercial development.
Center for Strategic Economic Research Draft 30

MARKET STUDY PROGRESS EVALUATION
Ensure compatibility of traffic and allocation of space between the Outlet Collection @ Elk Grove, TOD, and SEPA business park components.
Solicit developer interests in order to find a development partner that can work with property owners to create a feasible, phased approach to the SEPA development.
Maintain a focus on business park land resources within the SEPA and avoid situations to rezone properties by phasing infrastructure and related development.
Strategy 4
Implement follow-up protocols, services provider commitments, and comprehensive site visits targets within the business retention and expansion program.
Ensure that the Workforce Focus Group continues to exist within the shifting organizational structure.
Garner support from local, regional, and statewide partners that can assist with addressing broader business climate issues.
Strategy 5
Evaluate means to set aside existing or additional resources to be used specifically for tools and activities that will support business attraction efforts.
Set an expanded business attraction goal based on additional resources, tools, and activities. Reassess business attraction targets across viable industries and clusters as well as Next
Economy focus areas. Consider investing resources in lead generation services to identify qualified leads across
business attraction targets. Strengthen and expand relationships with corporate real estate brokers and developments that
cover the Sacramento Region and work more broadly throughout Northern California. Strategy 6
Build geographic orientation into messaging associated with economic development marketing and clearly distinguish competitive attributes of the community within the Region.
Start a marketing ambassadors program using local and regional champions. Resolve the issue of separate economic development web sites, social media presence, and
marketing messaging. Undertake and awareness study and content audit of the City’s economic development web
site and marketing materials. Develop a proactive public relations effort to enhance community visibility among key
audiences.
Center for Strategic Economic Research Draft 31
MARKET STUDY PROGRESS EVALUATION
Additional Considerations While the City should focus on fully implementing the original strategies and building on the additional recommendations discussed in the previous sections, it should also consider integrating innovation-driven opportunities as another potential priority area. The stakeholder engagement process involved in the creation of the 2010 Market Study as well as recent discussions with City representatives revealed an interest in capitalizing on innovation-driven opportunities. A strategy specifically related to this area was not in the 2010 Market Study since it was not identified as a top priority in the planning process. With the exception of supporting incubator, accelerator, or shared service facilities, friendly home-based business policies, and some forms of small business loans, local jurisdictions typically have a limited role to play in enhancing innovation-driven opportunities. Generally, economic development efforts in this area are initiated by the private sector and managed by non-profit organizations with a regional focus. Related programs often involve efforts like business network coordination, equity and risk capital coordination, technology deployment assistance, and specialized business support services. Communities like Boulder and Philadelphia have responded to direct private sector demand for enhanced innovation-related services and now embrace innovation as a key economic development strategy. Fostering a stronger innovation environment was identified as a core priority for the Sacramento Region through the Next Economy planning process and enhanced local efforts can help move this broad goal forward. With the Sacramento Area Regional Technology Alliance (SARTA) identified as one of the core Coordinating Champions for this component of the Next Economy plan, continued collaboration with this regional organization will be important. The City has already established a small business loan program and the majority of its business licenses are classified as home business owners. While the topic of incubator, accelerator, or shared service facilities have been explored at various points in the past few years, City staff engagement with the technology community in Elk Grove revealed little support or demand for these types of facilities. Despite this feedback from the technology community, the City should continue to explore innovative models for these facilities (e.g. co-working space, industrial equipment, art studio, and machine shop) and related demand for three reasons. First, there could be demand for space beyond just the technology community—there are a large number of home-based businesses in the community that might benefit from co-working or shared services facilities plus the 2010 Market Study identified a Creative cluster consisting of at least 1,300 jobs in the community at the time. Second, these types of facilities could enhance the perceptions of the community as supporting an entrepreneurial and innovation environment and ultimately draw more interest in the community among residents and businesses. Third, the City-owned parcel near Old Town could present a viable location for this type of facility and should be considered among the potential uses for the site. According to City representatives, the technology community in Elk Grove has also emphasized an interest in mentorship and additional financial capital options. In response to these identified needs, the City should work with the Chamber of Commerce and Small Business Development Center to build a mentorship program and continue its support of the Sacramento Area Regional
Center for Strategic Economic Research Draft 32

MARKET STUDY PROGRESS EVALUATION
Center for Strategic Economic Research Draft 33
Technology Alliance for progress on enhanced financial capital for competitive companies in the Region. Although still in the construction phase, the City should continue to monitor the progress of California Northstate University, especially its planned research and development lab. After the lab is established, the related university research activities could drive additional innovation-driven opportunities in the community as well as potential demand for new public-private partnerships and support services in the areas mentioned above.
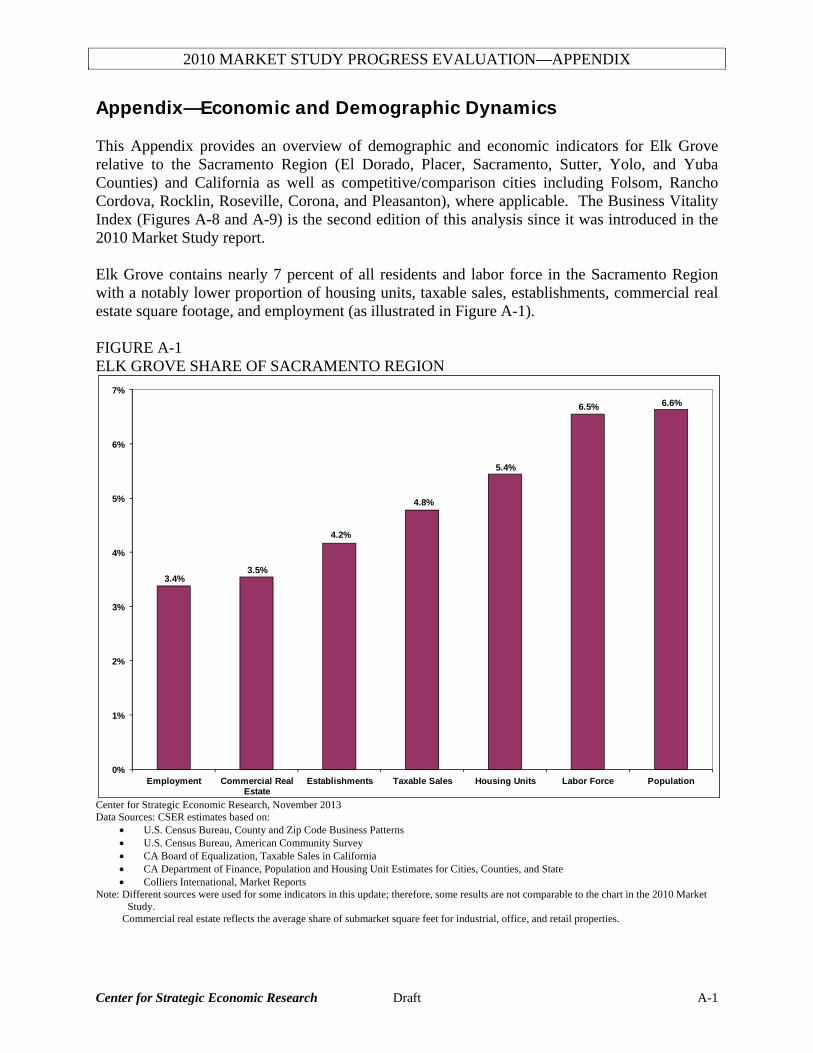
2010 MARKET STUDY PROGRESS EVALUATION—APPENDIX
Appendix—Economic and Demographic Dynamics This Appendix provides an overview of demographic and economic indicators for Elk Grove relative to the Sacramento Region (El Dorado, Placer, Sacramento, Sutter, Yolo, and Yuba Counties) and California as well as competitive/comparison cities including Folsom, Rancho Cordova, Rocklin, Roseville, Corona, and Pleasanton), where applicable. The Business Vitality Index (Figures A-8 and A-9) is the second edition of this analysis since it was introduced in the 2010 Market Study report. Elk Grove contains nearly 7 percent of all residents and labor force in the Sacramento Region with a notably lower proportion of housing units, taxable sales, establishments, commercial real estate square footage, and employment (as illustrated in Figure A-1). FIGURE A-1 ELK GROVE SHARE OF SACRAMENTO REGION
Center for Strategic Economic Research, November 2013
3.4%3.5%
4.2%
4.8%
5.4%
6.5% 6.6%
0%
1%
2%
3%
4%
5%
6%
7%
Employment Commercial Real Estate
Establishments Taxable Sales Housing Units Labor Force Population
Data Sources: CSER estimates based on: • U.S. Census Bureau, County and Zip Code Business Patterns • U.S. Census Bureau, American Community Survey • CA Board of Equalization, Taxable Sales in California • CA Department of Finance, Population and Housing Unit Estimates for Cities, Counties, and State • Colliers International, Market Reports
Note: Different sources were used for some indicators in this update; therefore, some results are not comparable to the chart in the 2010 Market Study. Commercial real estate reflects the average share of submarket square feet for industrial, office, and retail properties.
Center for Strategic Economic Research Draft A-1

2010 MARKET STUDY PROGRESS EVALUATION—APPENDIX
Elk Grove’s population increased from nearly 89,000 residents in 2003 to around 159,000 residents in 2013, as shown in Figure A-2. Elk Grove annexed the Laguna West-Lakeside CDP in 2003 adding about 15,000 people to the City’s total population in addition to the internal annual population change of about 8,600 residents (as reflected in the high annual growth rate for 2004 in Figure X). The substantial population gain since incorporation has made Elk Grove the Sacramento Region’s second-largest city (behind Sacramento) and placed it among the state’s top 30 largest cities. The City’s population grew nearly 9 percent from 2008 to 2013 which was over twice the regional growth rate of around 4 percent and almost three times the statewide growth of just over 3 percent. Elk Grove’s annual population growth rates have been steadily decreasing showing approximately 2 percent growth from 2012 to 2013, down from a non-annexation period peak of about 11 percent in 2005. FIGURE A-2 ELK GROVE POPULATION AND ANNUAL POPULATION GROWTH
Center for Strategic Economic Research, November 2013
88,954
113,391
125,703
135,996142,003
146,083 149,302152,652 154,440 155,763 159,07427.5%
10.9%
27.3%
4.4%
2.9% 2.2%2.2%
1.2%0.9%
2.1%
0.0%
5.0%
10.0%
15.0%
20.0%
25.0%
30.0%
0
20,000
40,000
60,000
80,000
100,000
120,000
140,000
160,000
180,000
2003 2004* 2005 2006 2007 2008 2009 2010 2011 2012 2013
Popu
latio
n G
row
th
Popu
latio
n
Population Population Growth
Data Source: CA Department of Finance, Population Estimates for Cities, Counties, and State, 2001-2013 *Note: Laguna West annexation occurred in 2003, adding approximately 15,000 residents to Elk Grove’s total population resulting in a spike in annual population growth in the 2003 to 2004 time period.
Center for Strategic Economic Research Draft A-2
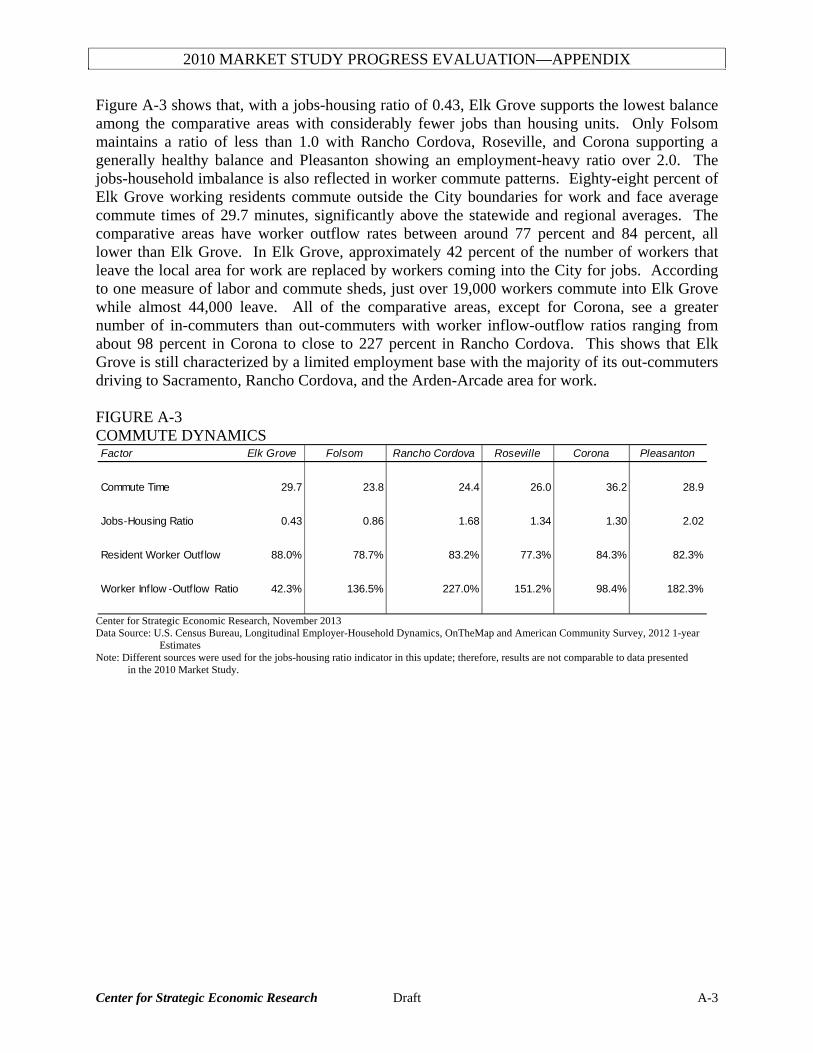
2010 MARKET STUDY PROGRESS EVALUATION—APPENDIX
Figure A-3 shows that, with a jobs-housing ratio of 0.43, Elk Grove supports the lowest balance among the comparative areas with considerably fewer jobs than housing units. Only Folsom maintains a ratio of less than 1.0 with Rancho Cordova, Roseville, and Corona supporting a generally healthy balance and Pleasanton showing an employment-heavy ratio over 2.0. The jobs-household imbalance is also reflected in worker commute patterns. Eighty-eight percent of Elk Grove working residents commute outside the City boundaries for work and face average commute times of 29.7 minutes, significantly above the statewide and regional averages. The comparative areas have worker outflow rates between around 77 percent and 84 percent, all lower than Elk Grove. In Elk Grove, approximately 42 percent of the number of workers that leave the local area for work are replaced by workers coming into the City for jobs. According to one measure of labor and commute sheds, just over 19,000 workers commute into Elk Grove while almost 44,000 leave. All of the comparative areas, except for Corona, see a greater number of in-commuters than out-commuters with worker inflow-outflow ratios ranging from about 98 percent in Corona to close to 227 percent in Rancho Cordova. This shows that Elk Grove is still characterized by a limited employment base with the majority of its out-commuters driving to Sacramento, Rancho Cordova, and the Arden-Arcade area for work. FIGURE A-3 COMMUTE DYNAMICS
Center for Strategic Economic Research, November 2013
Factor Elk Grove Folsom Rancho Cordova Roseville Corona Pleasanton
Commute Time 29.7 23.8 24.4 26.0 36.2 28.9
Jobs-Housing Ratio 0.43 0.86 1.68 1.34 1.30 2.02
Resident Worker Outf low 88.0% 78.7% 83.2% 77.3% 84.3% 82.3%
Worker Inf low -Outf low Ratio 42.3% 136.5% 227.0% 151.2% 98.4% 182.3%
Data Source: U.S. Census Bureau, Longitudinal Employer-Household Dynamics, OnTheMap and American Community Survey, 2012 1-year Estimates Note: Different sources were used for the jobs-housing ratio indicator in this update; therefore, results are not comparable to data presented in the 2010 Market Study.
Center for Strategic Economic Research Draft A-3
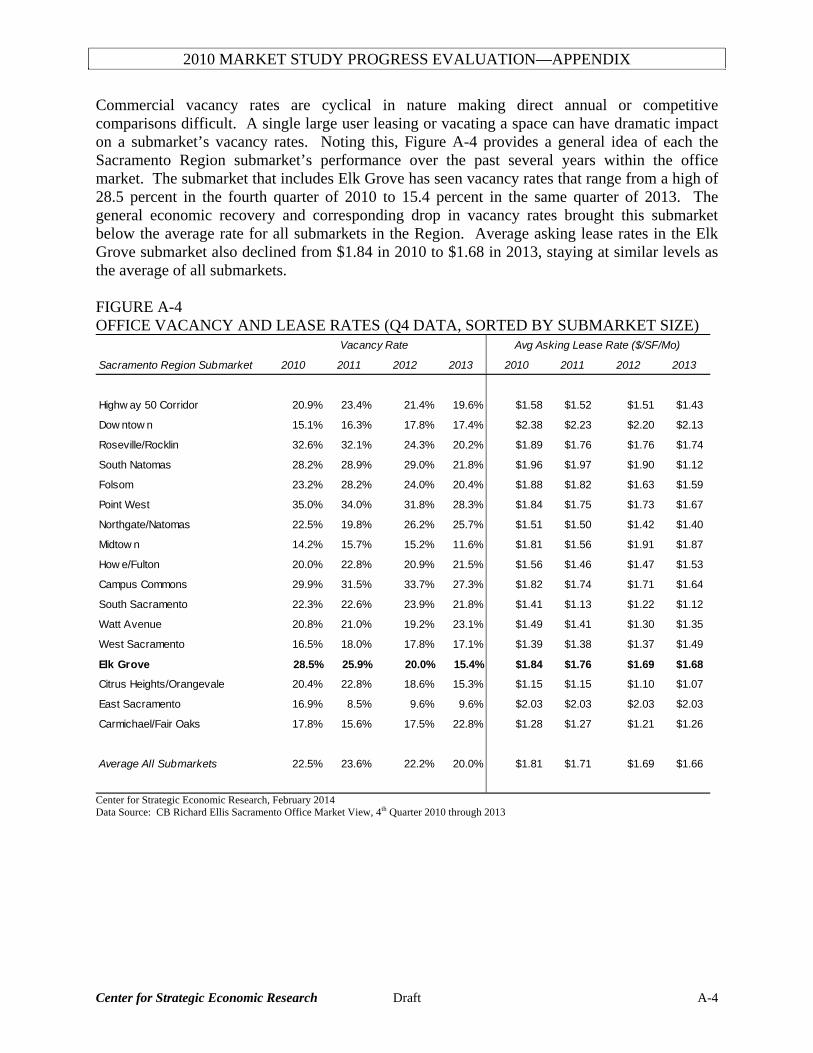
2010 MARKET STUDY PROGRESS EVALUATION—APPENDIX
Commercial vacancy rates are cyclical in nature making direct annual or competitive comparisons difficult. A single large user leasing or vacating a space can have dramatic impact on a submarket’s vacancy rates. Noting this, Figure A-4 provides a general idea of each the Sacramento Region submarket’s performance over the past several years within the office market. The submarket that includes Elk Grove has seen vacancy rates that range from a high of 28.5 percent in the fourth quarter of 2010 to 15.4 percent in the same quarter of 2013. The general economic recovery and corresponding drop in vacancy rates brought this submarket below the average rate for all submarkets in the Region. Average asking lease rates in the Elk Grove submarket also declined from $1.84 in 2010 to $1.68 in 2013, staying at similar levels as the average of all submarkets. FIGURE A-4 OFFICE VACANCY AND LEASE RATES (Q4 DATA, SORTED BY SUBMARKET SIZE)
Center for Strategic Economic Research, February 2014
Sacramento Region Submarket 2010 2011 2012 2013 2010 2011 2012 2013
Highw ay 50 Corridor 20.9% 23.4% 21.4% 19.6% $1.58 $1.52 $1.51 $1.43
Dow ntow n 15.1% 16.3% 17.8% 17.4% $2.38 $2.23 $2.20 $2.13
Roseville/Rocklin 32.6% 32.1% 24.3% 20.2% $1.89 $1.76 $1.76 $1.74
South Natomas 28.2% 28.9% 29.0% 21.8% $1.96 $1.97 $1.90 $1.12
Folsom 23.2% 28.2% 24.0% 20.4% $1.88 $1.82 $1.63 $1.59
Point West 35.0% 34.0% 31.8% 28.3% $1.84 $1.75 $1.73 $1.67
Northgate/Natomas 22.5% 19.8% 26.2% 25.7% $1.51 $1.50 $1.42 $1.40
Midtow n 14.2% 15.7% 15.2% 11.6% $1.81 $1.56 $1.91 $1.87
How e/Fulton 20.0% 22.8% 20.9% 21.5% $1.56 $1.46 $1.47 $1.53
Campus Commons 29.9% 31.5% 33.7% 27.3% $1.82 $1.74 $1.71 $1.64
South Sacramento 22.3% 22.6% 23.9% 21.8% $1.41 $1.13 $1.22 $1.12
Watt Avenue 20.8% 21.0% 19.2% 23.1% $1.49 $1.41 $1.30 $1.35
West Sacramento 16.5% 18.0% 17.8% 17.1% $1.39 $1.38 $1.37 $1.49
Elk Grove 28.5% 25.9% 20.0% 15.4% $1.84 $1.76 $1.69 $1.68
Citrus Heights/Orangevale 20.4% 22.8% 18.6% 15.3% $1.15 $1.15 $1.10 $1.07
East Sacramento 16.9% 8.5% 9.6% 9.6% $2.03 $2.03 $2.03 $2.03
Carmichael/Fair Oaks 17.8% 15.6% 17.5% 22.8% $1.28 $1.27 $1.21 $1.26
Average All Submarkets 22.5% 23.6% 22.2% 20.0% $1.81 $1.71 $1.69 $1.66
Vacancy Rate Avg Asking Lease Rate ($/SF/Mo)
Data Source: CB Richard Ellis Sacramento Office Market View, 4th Quarter 2010 through 2013
Center for Strategic Economic Research Draft A-4
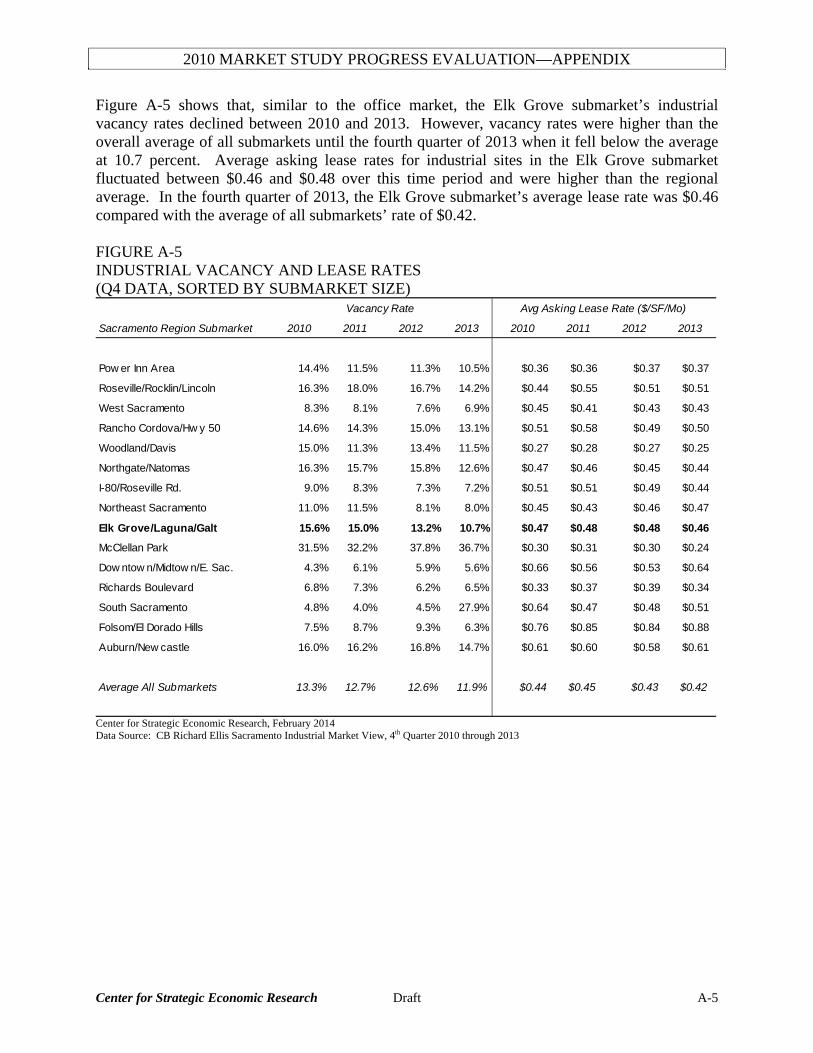
2010 MARKET STUDY PROGRESS EVALUATION—APPENDIX
Figure A-5 shows that, similar to the office market, the Elk Grove submarket’s industrial vacancy rates declined between 2010 and 2013. However, vacancy rates were higher than the overall average of all submarkets until the fourth quarter of 2013 when it fell below the average at 10.7 percent. Average asking lease rates for industrial sites in the Elk Grove submarket fluctuated between $0.46 and $0.48 over this time period and were higher than the regional average. In the fourth quarter of 2013, the Elk Grove submarket’s average lease rate was $0.46 compared with the average of all submarkets’ rate of $0.42. FIGURE A-5 INDUSTRIAL VACANCY AND LEASE RATES (Q4 DATA, SORTED BY SUBMARKET SIZE)
Center for Strategic Economic Research, February 2014
Sacramento Region Submarket 2010 2011 2012 2013 2010 2011 2012 2013
Pow er Inn Area 14.4% 11.5% 11.3% 10.5% $0.36 $0.36 $0.37 $0.37
Roseville/Rocklin/Lincoln 16.3% 18.0% 16.7% 14.2% $0.44 $0.55 $0.51 $0.51
West Sacramento 8.3% 8.1% 7.6% 6.9% $0.45 $0.41 $0.43 $0.43
Rancho Cordova/Hw y 50 14.6% 14.3% 15.0% 13.1% $0.51 $0.58 $0.49 $0.50
Woodland/Davis 15.0% 11.3% 13.4% 11.5% $0.27 $0.28 $0.27 $0.25
Northgate/Natomas 16.3% 15.7% 15.8% 12.6% $0.47 $0.46 $0.45 $0.44
I-80/Roseville Rd. 9.0% 8.3% 7.3% 7.2% $0.51 $0.51 $0.49 $0.44
Northeast Sacramento 11.0% 11.5% 8.1% 8.0% $0.45 $0.43 $0.46 $0.47
Elk Grove/Laguna/Galt 15.6% 15.0% 13.2% 10.7% $0.47 $0.48 $0.48 $0.46
McClellan Park 31.5% 32.2% 37.8% 36.7% $0.30 $0.31 $0.30 $0.24
Dow ntow n/Midtow n/E. Sac. 4.3% 6.1% 5.9% 5.6% $0.66 $0.56 $0.53 $0.64
Richards Boulevard 6.8% 7.3% 6.2% 6.5% $0.33 $0.37 $0.39 $0.34
South Sacramento 4.8% 4.0% 4.5% 27.9% $0.64 $0.47 $0.48 $0.51
Folsom/El Dorado Hills 7.5% 8.7% 9.3% 6.3% $0.76 $0.85 $0.84 $0.88
Auburn/New castle 16.0% 16.2% 16.8% 14.7% $0.61 $0.60 $0.58 $0.61
Average All Submarkets 13.3% 12.7% 12.6% 11.9% $0.44 $0.45 $0.43 $0.42
Vacancy Rate Avg Asking Lease Rate ($/SF/Mo)
Data Source: CB Richard Ellis Sacramento Industrial Market View, 4th Quarter 2010 through 2013
Center for Strategic Economic Research Draft A-5

2010 MARKET STUDY PROGRESS EVALUATION—APPENDIX
Retail vacancy rates in the Elk Grove submarket ranged from 10.0 percent in the fourth quarter of 2010 to 6.4 percent in 2013, as shown in Figure A-6. These rates were far below the average of all submarkets which saw 10.8 percent vacancy in the fourth quarter of 2013. The Elk Grove submarket has had one of the highest average asking lease rates in the Sacramento Region ranging from $1.75 (fourth quarter 2013) to $1.92 (fourth quarter 2011). In comparison, the average of all submarkets saw rates between $1.44 and $1.57 in the represented time period. FIGURE A-6 RETAIL VACANCY AND LEASE RATES (Q4 DATA, SORTED BY SUBMARKET SIZE)
Center for Strategic Economic Research, February 2014
Sacramento Region Submarket 2010 2011 2012 2013 2010 2011 2012 2013
Roseville 13.2% 9.8% 9.5% 8.0% $1.90 $1.67 $1.68 $1.51
Folsom/El Dorado Hills 10.6% 9.0% 8.4% 9.8% $1.80 $1.66 $1.59 $1.92
Laguna/Elk Grove 10.0% 7.3% 7.8% 6.4% $1.86 $1.92 $1.86 $1.75
South Sacramento 18.2% 12.2% 12.9% 14.0% $1.43 $1.41 $1.35 $1.29
Citrus Heights/Fair Oaks 16.3% 17.0% 15.6% 13.5% $1.19 $1.22 $1.54 $1.21
Arden/Watt/How e 9.4% 7.5% 6.4% 5.5% $1.61 $1.49 $1.59 $1.47
Hw y 50/Rancho Cordova/Rosemont 23.2% 21.8% 21.1% 23.8% $1.48 $1.38 $1.28 $1.24
West Sacramento/Davis 8.5% 8.0% 4.7% 3.3% $1.63 $1.68 $1.69 $1.97
North Highlands 11.7% 13.6% 13.2% 9.5% $1.38 $1.32 $1.41 $1.23
North Natomas 16.4% 14.5% 11.2% 9.1% $1.73 $1.69 $1.58 $1.33
Rocklin 24.3% 20.3% 19.2% 17.3% $1.79 $1.39 $1.43 $1.46
Carmichael 21.4% 20.0% 18.6% 22.4% $1.06 $1.03 $0.94 $1.01
Lincoln 10.6% 11.8% 7.1% 9.0% $1.96 $2.00 $1.83 $1.96
Auburn/Loomis 11.7% 7.4% 8.8% 9.4% $1.90 $1.48 $1.75 $1.58
South Natomas 6.0% 5.4% 6.2% 9.1% $1.49 $1.29 $1.59 $1.33
Greenhaven/Pocket 9.7% 14.6% 12.4% 9.8% $1.25 $1.40 $1.47 $1.72
Average All Submarkets 14.2% 12.1% 11.3% 10.8% $1.57 $1.47 $1.51 $1.44
Vacancy Rate Avg Asking Lease Rate ($/SF/Mo)
Data Source: CB Richard Ellis Sacramento Retail Market View, 4th Quarter 2010 through 2013
Center for Strategic Economic Research Draft A-6
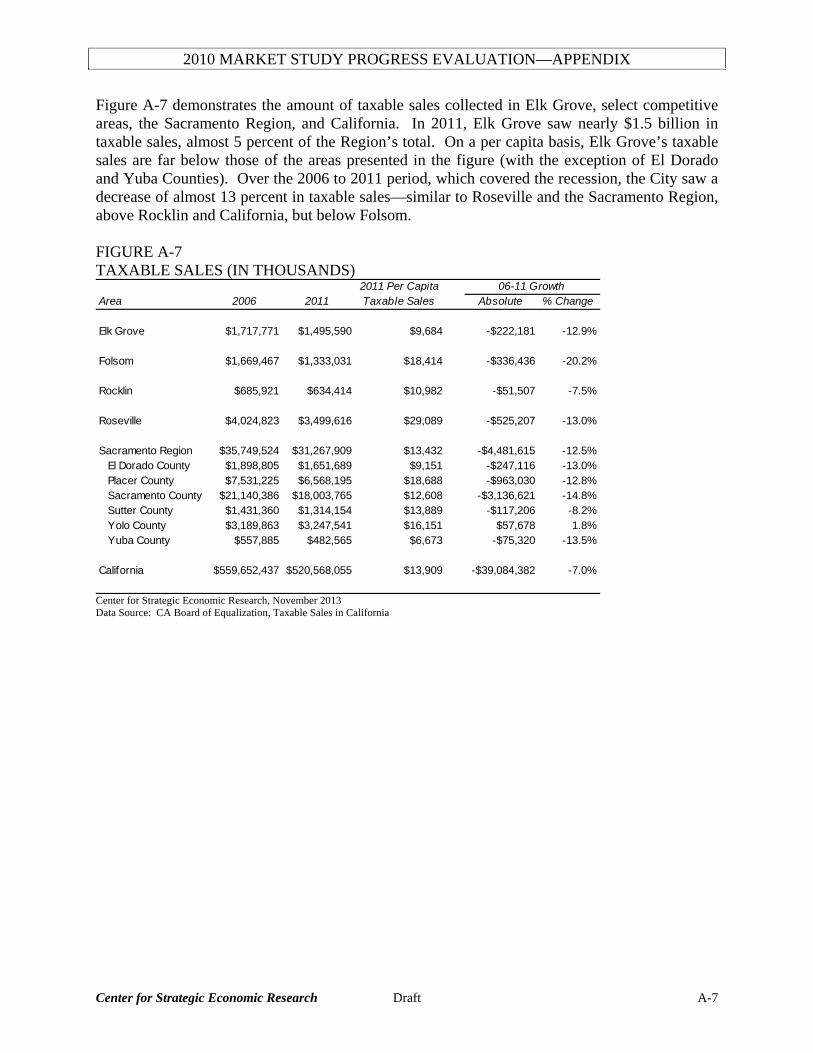
2010 MARKET STUDY PROGRESS EVALUATION—APPENDIX
Figure A-7 demonstrates the amount of taxable sales collected in Elk Grove, select competitive areas, the Sacramento Region, and California. In 2011, Elk Grove saw nearly $1.5 billion in taxable sales, almost 5 percent of the Region’s total. On a per capita basis, Elk Grove’s taxable sales are far below those of the areas presented in the figure (with the exception of El Dorado and Yuba Counties). Over the 2006 to 2011 period, which covered the recession, the City saw a decrease of almost 13 percent in taxable sales—similar to Roseville and the Sacramento Region, above Rocklin and California, but below Folsom. FIGURE A-7 TAXABLE SALES (IN THOUSANDS)
Center for Strategic Economic Research, November 2013
2011 Per CapitaArea 2006 2011 Taxable Sales Absolute % Change
Elk Grove $1,717,771 $1,495,590 $9,684 -$222,181 -12.9%
Folsom $1,669,467 $1,333,031 $18,414 -$336,436 -20.2%
Rocklin $685,921 $634,414 $10,982 -$51,507 -7.5%
Roseville $4,024,823 $3,499,616 $29,089 -$525,207 -13.0%
Sacramento Region $35,749,524 $31,267,909 $13,432 -$4,481,615 -12.5%El Dorado County $1,898,805 $1,651,689 $9,151 -$247,116 -13.0%Placer County $7,531,225 $6,568,195 $18,688 -$963,030 -12.8%Sacramento County $21,140,386 $18,003,765 $12,608 -$3,136,621 -14.8%Sutter County $1,431,360 $1,314,154 $13,889 -$117,206 -8.2%Yolo County $3,189,863 $3,247,541 $16,151 $57,678 1.8%Yuba County $557,885 $482,565 $6,673 -$75,320 -13.5%
California $559,652,437 $520,568,055 $13,909 -$39,084,382 -7.0%
06-11 Growth
Data Source: CA Board of Equalization, Taxable Sales in California
Center for Strategic Economic Research Draft A-7

2010 MARKET STUDY PROGRESS EVALUATION—APPENDIX
The Business Vitality Index presented in Figures A-8 and A-9 measures Elk Grove’s competitive position relative to the five selected comparative areas. The Index captures performance across 10 factors describing demographic, business, and quality of life characteristics. The measured areas received a score between 0 and 10 on each of the 10 indicators listed in Figure A-9 based on relative performance—the best performing area received a score of 10, the lowest received a 0, and all other areas received scores between 0 and 10 based on where measures fell between the two boundaries. All 10 indicator scores were averaged to create the overall Business Vitality Index shown in Figure A-8 with the highest average area garnering a score of 10 and all other areas receiving scores based on performance as a percentage of the top area. On the Business Vitality Index within the 2010 Market Study report, Elk Grove ranked fourth among the six measured areas, falling behind only Pleasanton and Folsom. In the 2013 version, Elk Grove moved up two spots placing it only below Pleasanton. Overall, the updated Index suggests that Elk Grove presents a strong competitive position relative to the five comparative areas. Since the 2010 edition, Elk Grove saw score improvements (or no movement) for all of the indicators except for Establishment Growth. The City received the top scores for three indicators: Population Growth, Office Vacancy, and Housing Affordability—an improvement from 2010 for Population Growth for which Elk Grove only scored 5.4 and a jump from the bottom score to best score for Office Vacancy. In 2010, Elk Grove received the highest score for Establishment Growth, but that measure declined to 5.7 in this update. The Employment Growth and Crime Rate indicators in Elk Grove received rather strong scores while, similar to 2010, Elk Grove posted the weakest scores on the SAT Score and Educational Attainment variables. The other indicators fell between with moderate scores.
Center for Strategic Economic Research Draft A-8
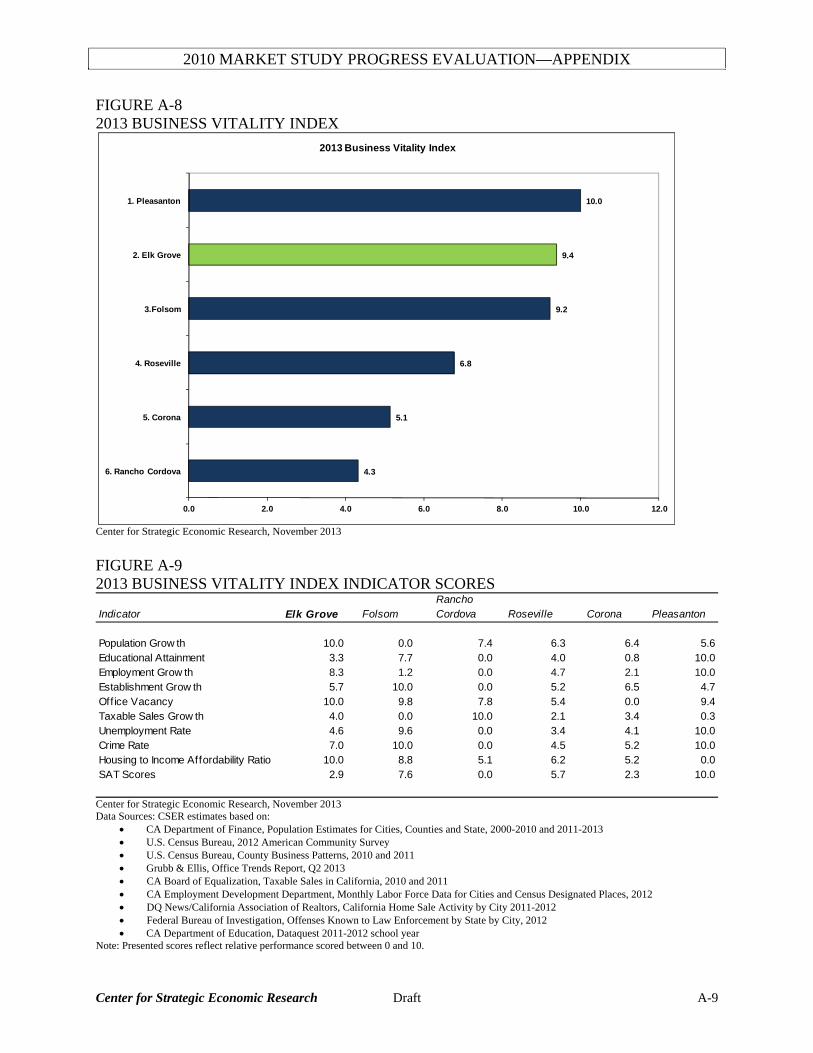
2010 MARKET STUDY PROGRESS EVALUATION—APPENDIX
FIGURE A-8 2013 BUSINESS VITALITY INDEX
Center for Strategic Economic Research, November 2013
4.3
5.1
6.8
9.2
9.4
10.0
0.0 2.0 4.0 6.0 8.0 10.0 12.0
6. Rancho Cordova
5. Corona
4. Roseville
3.Folsom
2. Elk Grove
1. Pleasanton
2013 Business Vitality Index
FIGURE A-9 2013 BUSINESS VITALITY INDEX INDICATOR SCORES
Center for Strategic Economic Research, November 2013
RanchoIndicator Elk Grove Folsom Cordova Roseville Corona Pleasanton
Population Grow th 10.0 0.0 7.4 6.3 6.4 5.6Educational Attainment 3.3 7.7 0.0 4.0 0.8 10.0Employment Grow th 8.3 1.2 0.0 4.7 2.1 10.0Establishment Grow th 5.7 10.0 0.0 5.2 6.5 4.7Office Vacancy 10.0 9.8 7.8 5.4 0.0 9.4Taxable Sales Grow th 4.0 0.0 10.0 2.1 3.4 0.3Unemployment Rate 4.6 9.6 0.0 3.4 4.1 10.0Crime Rate 7.0 10.0 0.0 4.5 5.2 10.0Housing to Income Affordability Ratio 10.0 8.8 5.1 6.2 5.2 0.0SAT Scores 2.9 7.6 0.0 5.7 2.3 10.0
Data Sources: CSER estimates based on: • CA Department of Finance, Population Estimates for Cities, Counties and State, 2000-2010 and 2011-2013 • U.S. Census Bureau, 2012 American Community Survey • U.S. Census Bureau, County Business Patterns, 2010 and 2011 • Grubb & Ellis, Office Trends Report, Q2 2013 • CA Board of Equalization, Taxable Sales in California, 2010 and 2011 • CA Employment Development Department, Monthly Labor Force Data for Cities and Census Designated Places, 2012 • DQ News/California Association of Realtors, California Home Sale Activity by City 2011-2012 • Federal Bureau of Investigation, Offenses Known to Law Enforcement by State by City, 2012 • CA Department of Education, Dataquest 2011-2012 school year
Note: Presented scores reflect relative performance scored between 0 and 10.
Center for Strategic Economic Research Draft A-9
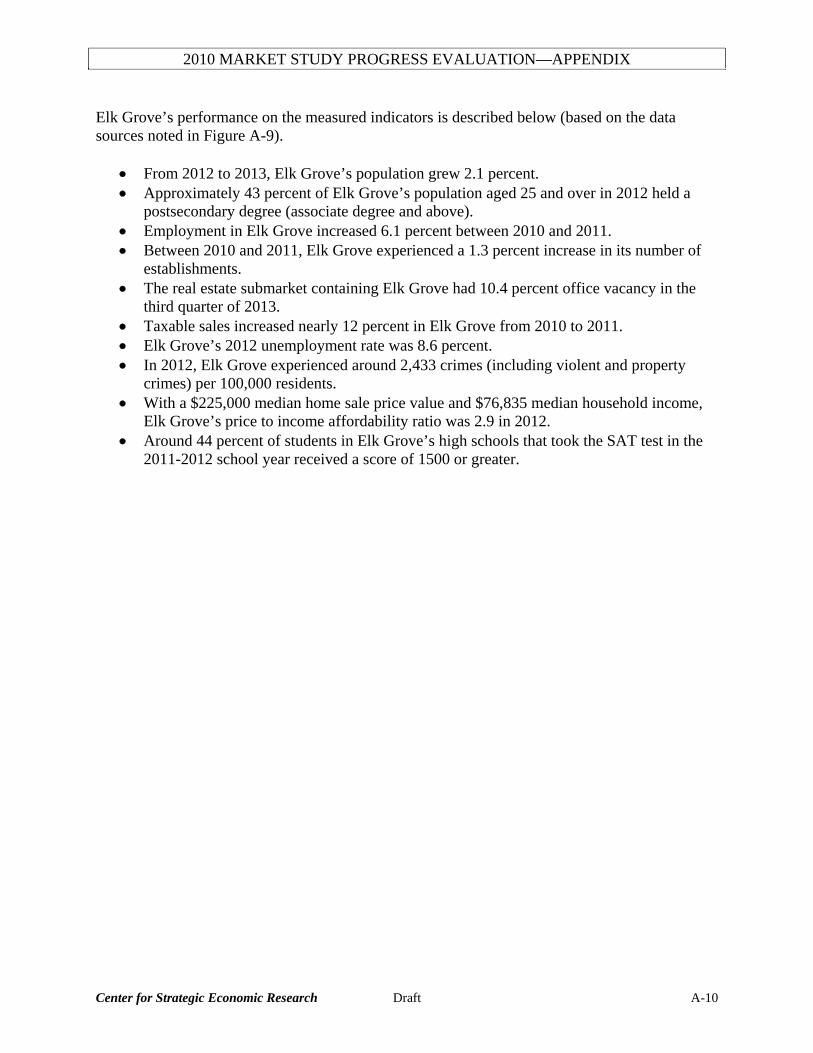
2010 MARKET STUDY PROGRESS EVALUATION—APPENDIX
Elk Grove’s performance on the measured indicators is described below (based on the data sources noted in Figure A-9).
• From 2012 to 2013, Elk Grove’s population grew 2.1 percent. • Approximately 43 percent of Elk Grove’s population aged 25 and over in 2012 held a
postsecondary degree (associate degree and above). • Employment in Elk Grove increased 6.1 percent between 2010 and 2011. • Between 2010 and 2011, Elk Grove experienced a 1.3 percent increase in its number of
establishments. • The real estate submarket containing Elk Grove had 10.4 percent office vacancy in the
third quarter of 2013. • Taxable sales increased nearly 12 percent in Elk Grove from 2010 to 2011. • Elk Grove’s 2012 unemployment rate was 8.6 percent. • In 2012, Elk Grove experienced around 2,433 crimes (including violent and property
crimes) per 100,000 residents. • With a $225,000 median home sale price value and $76,835 median household income,
Elk Grove’s price to income affordability ratio was 2.9 in 2012. • Around 44 percent of students in Elk Grove’s high schools that took the SAT test in the
2011-2012 school year received a score of 1500 or greater.
Center for Strategic Economic Research Draft A-10

2010 MARKET STUDY PROGRESS EVALUATION—APPENDIX
Elk Grove ranks as an “average” cost area for doing business compared to over 400 other jurisdictions in the country (with more than half in California) according to the 2012 Cost of Doing Business Survey, which takes taxes, fees, and economic development programs into consideration. As depicted in Figure A-10, of the measured areas in the Sacramento Region, Elk Grove is one of four that are classified as average cost areas (along with Davis, Citrus Heights and unincorporated Sacramento County). Three other areas in the Region rank as low or very low cost areas including Folsom, Rocklin, Roseville, while the City of Sacramento is classified as a very high cost area. FIGURE A-10 COST OF DOING BUSINESS
Center for Strategic Economic Research, November 2013 Data Source: 2012 Kosmont-Rose Institute Cost of Doing Business Survey
Center for Strategic Economic Research Draft A-11