email marketing: beyond opens and clicks into an advanced analytics adventure
Post on 21-Oct-2014
531 views
DESCRIPTION
Like the quantitative side of email marketing and hungry to learn some new metrics you can use to improve your performance? Not so comfortable with the quantitative side of email but know that you need to be to advance your program and your career? Either way, this is the presentation for you! Concerned that it will be dry and boring? It won’t be, I promise! It will be fun and playful — and you’ll leave with the quantitative tools you need to improve your email marketing program and become a rock star in your marketing department! Why go beyond open and clicks? Because they’re nice, but if you’re like most organizations it’s revenue generated that pays the bills and keeps the doors open. Join us for this presentation to learn how to calculate and apply quantitative metrics to help you improve the effectiveness -- and profitability — of your email program. Topics we’ll cover include (but are not limited to): • Data trees • Reach Metrics • Revenue per email sent • Value of an email address • Verifying Statistical Significance Bring your questions and biggest email marketing challenges — chances are the quantitative tools that can help you solve them are here.TRANSCRIPT

© All Rights
ReservedKCDMA | February 11, 2014 1
Email: BeyondOpens and Clicks
KCDMA | February 11, 2014
Jeanne S. JenningsVice President, Global Strategic Services
Alchemy Worxa 100% Email Marketing Agency

© All Rights
ReservedKCDMA | February 11, 2014 2
Session Overview
• Revenue
• Conversion
• Send Metrics
• Testing Metrics
• Combining Metrics

© All Rights
ReservedKCDMA | February 11, 2014 3
Revenue MetricsEmail: Beyond Opens and Clicks
© All Rights
ReservedKCDMA | February 11, 2014 4
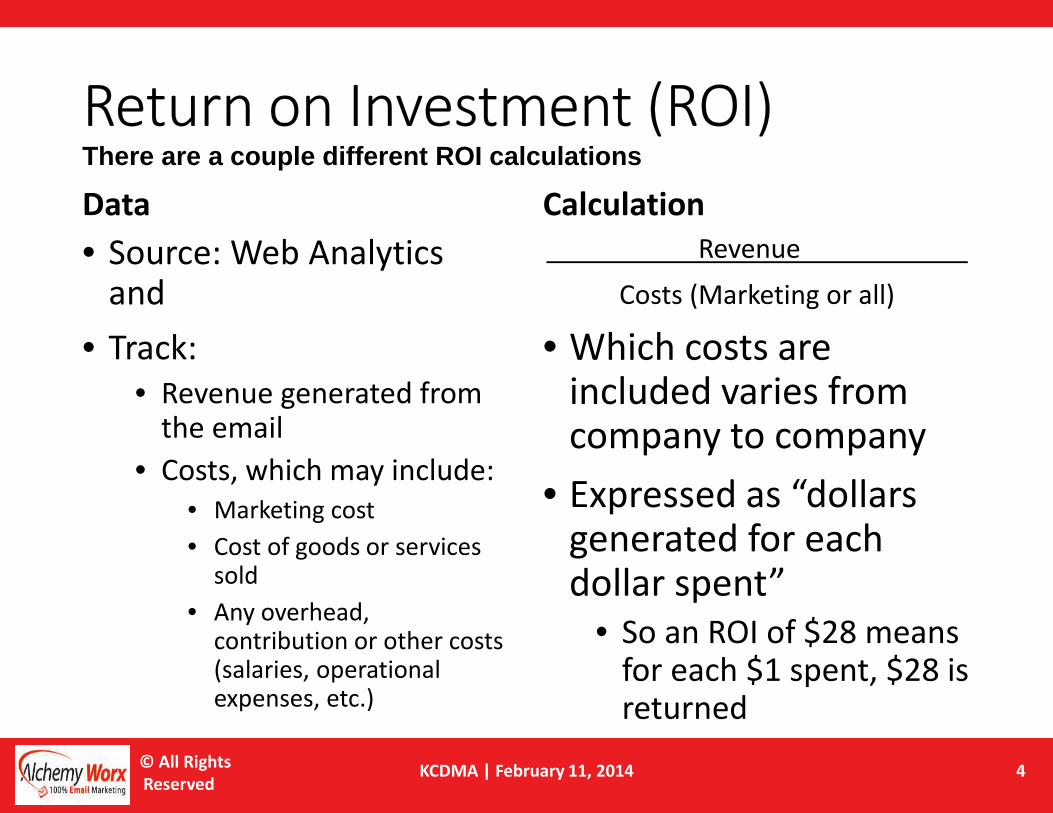
Return on Investment (ROI)There are a couple different ROI calculations
Data
• Source: Web Analytics and
• Track:
• Revenue generated from the email
• Costs, which may include:
• Marketing cost
• Cost of goods or services sold
• Any overhead, contribution or other costs (salaries, operational expenses, etc.)
Calculation
Revenue
Costs (Marketing or all)
• Which costs are included varies from company to company
• Expressed as “dollars generated for each dollar spent”
• So an ROI of $28 means for each $1 spent, $28 is returned

© All Rights
ReservedKCDMA | February 11, 2014 5
List ROIProfitable Lists
• STR Teacher Express ($3.08 )
• TSO Customers ($1.03)
Not Profitable Lists
• Teacher Newsletter ($0.59 ROI)
• SBC Red Apple ($0.43 ROI)

© All Rights
ReservedKCDMA | February 11, 2014 6
Revenue per Email (RPE)When true ROI is difficult to track; to combat list fatigue
Data
• Source: Web Analytics and Email Metrics
• Track:
• Revenue generated from email
• Quantity of email assumed delivered (sent and didn’t bounce)
Calculation
Revenue
Non-Bounce Send Quantity
• Easier to calculate (usually) than ROI
• Can be used both for individual sends as well as for all sends in a given week, month, quarter, etc.
• If the number is very low, calculate RPME – revenue per thousand emails assumed delivered

© All Rights
ReservedKCDMA | February 11, 2014 7
Revenue per Thousand Emails Assumed Delivered (RPME)
Quarterly – all business units
Source: Client Case Study, JeanneJennings.com, Inc.

© All Rights
ReservedKCDMA | February 11, 2014 8
Average Value of an Email AddressHow much is an email address worth to your organization?
Data
• Source: Web Analytics and Email Metrics
• Track:
• Revenue generated from email
• Average number of email addresses on the list
• Usually calculated annually
Calculation
Total revenue generated from email
Average Size of Email List
• Benchmark for improvement
• Useful for determining how much you can afford to spend to get a new email address
Annual Revenue from
Email 12,030,960$
Average List Size 2,023,345
Average Annual Value of
an Email Address 5.95$

© All Rights
ReservedKCDMA | February 11, 2014 9
Final Analysis After Tracking Actual Performance
Source Type Cost Per Lead
Actual Value of an
Email Address by
Source (Annual)
Actual Return
on Spend
A LinkedIn Ad 2.28$ 5.75$ 2.52$
B List Rental 5.90$ 2.02$ 0.34$
C Telemarketing 9.48$ 36.27$ 3.83$
Average Value of an Email AddressInitial Analysis After Test Period
Source Type Cost Per Lead
Average Annual
Value of an Email
Address (Current
List)
Estimated
Return on
Spend
A LinkedIn Ad 2.28$ 5.95$ 2.61$
B List Rental 5.90$ 5.95$ 1.01$
C Telemarketing 9.48$ 5.95$ 0.63$
Initial Analysis After Test Period
Source Type Cost Per Lead
Average Annual
Value of an Email
Address (Current
List)
Estimated
Return on
Spend
A LinkedIn Ad 2.28$ 5.95$ 2.61$
B List Rental 5.90$ 5.95$ 1.01$
C Telemarketing 9.48$ 5.95$ 0.63$
Final Analysis After Tracking Actual Performance
Source Type Cost Per Lead
Actual Value of an
Email Address by
Source (Annual)
Actual Return
on Spend
A LinkedIn Ad 2.28$ 5.75$ 2.52$
B List Rental 5.90$ 2.02$ 0.34$
C Telemarketing 9.48$ 36.27$ 3.83$
Source: Leveraging the Value of Your Email List, Jeanne Jennings for ClickZ.com, June 24, 2013

© All Rights
ReservedKCDMA | February 11, 2014 10
Lifetime Value of an Email AddressHow much is an email address worth to your organization over its lifetime?
Data
• Source: Web Analytics and Email Metrics
• Track/Calculate:
• Annual average value of an email address
• Average time in years that an email address on your list remains active
Calculation
Annual Average Value of an Email Address * Average Time
Active on List in Years
• Useful for estimating future revenue and anticipating when performance will drop off
© All Rights
ReservedKCDMA | February 11, 2014 11
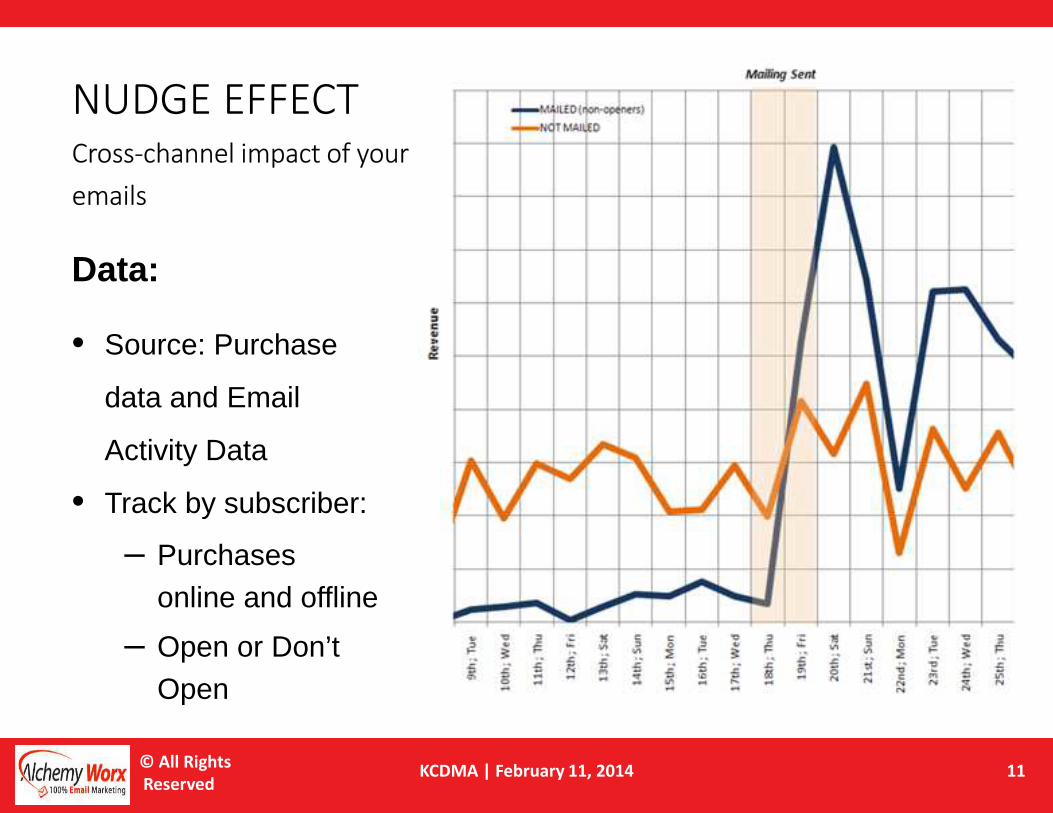
NUDGE EFFECTCross-channel impact of your
emails
Data:
• Source: Purchase
data and Email
Activity Data
• Track by subscriber:
– Purchases online and offline
– Open or Don’t Open

© All Rights
ReservedKCDMA | February 11, 2014 12
NUDGE EFFECTTake a holistic view of email success
Revenue from other channels on days when email campaigns were sent vs. days without
Holistic view:
• Look at those campaigns that may be driving subscribers elsewhere.
• Test subject lines that boost store footfall at key times.
© All Rights
ReservedKCDMA | February 11, 2014 13
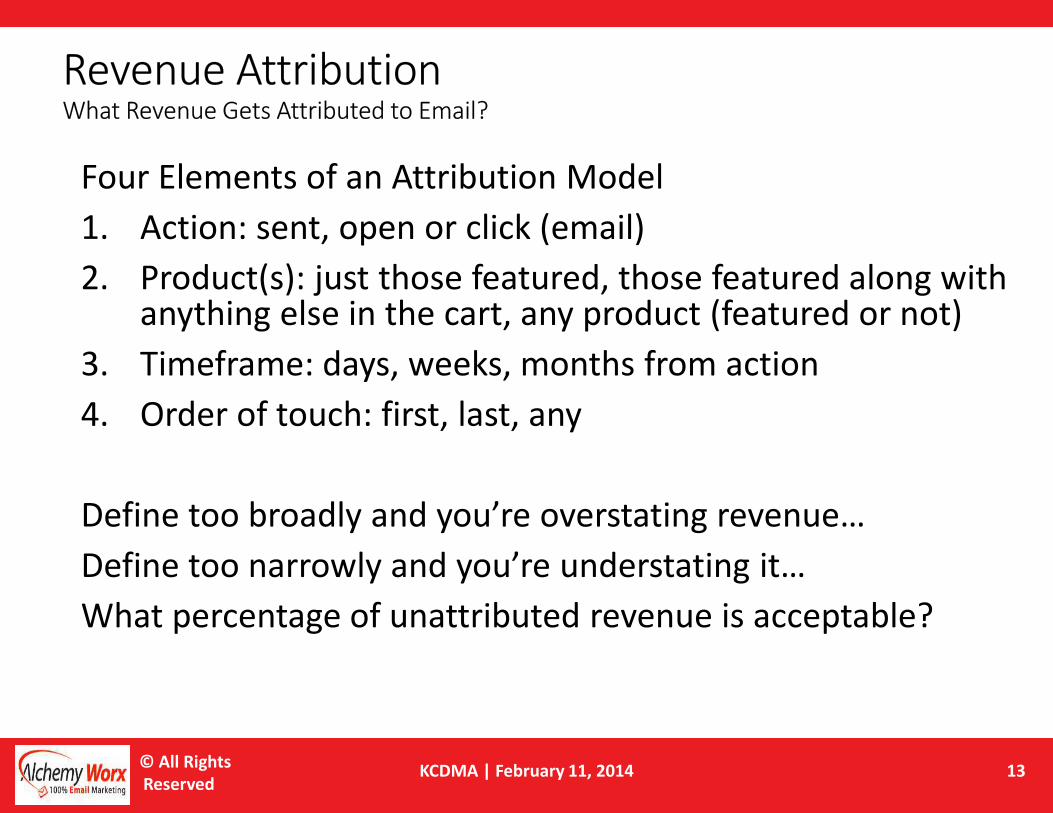
Four Elements of an Attribution Model
1. Action: sent, open or click (email)
2. Product(s): just those featured, those featured along with anything else in the cart, any product (featured or not)
3. Timeframe: days, weeks, months from action
4. Order of touch: first, last, any
Define too broadly and you’re overstating revenue…
Define too narrowly and you’re understating it…
What percentage of unattributed revenue is acceptable?
Revenue Attribution What Revenue Gets Attributed to Email?
© All Rights
ReservedKCDMA | February 11, 2014 14
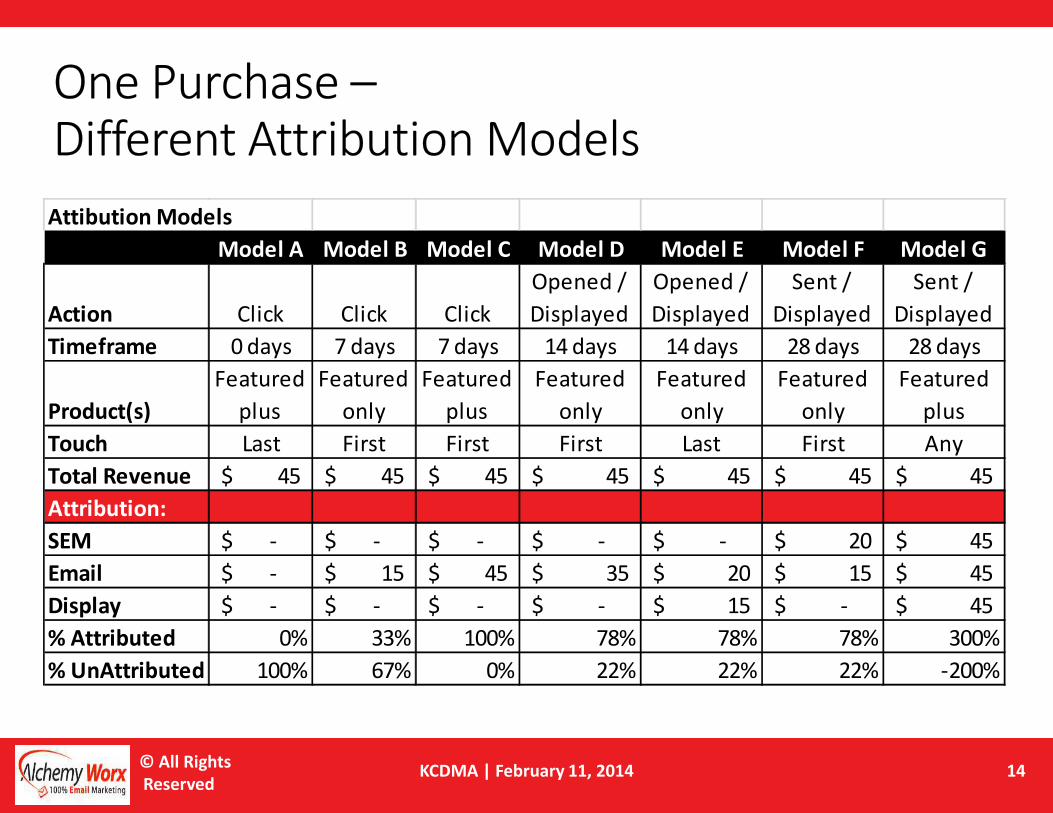
One Purchase –Different Attribution Models
Attibution Models
Model A Model B Model C Model D Model E Model F Model G
Action Click Click Click
Opened /
Displayed
Opened /
Displayed
Sent /
Displayed
Sent /
Displayed
Timeframe 0 days 7 days 7 days 14 days 14 days 28 days 28 days
Product(s)
Featured
plus
Featured
only
Featured
plus
Featured
only
Featured
only
Featured
only
Featured
plus
Touch Last First First First Last First Any
Total Revenue 45$ 45$ 45$ 45$ 45$ 45$ 45$
Attribution:
SEM -$ -$ -$ -$ -$ 20$ 45$
Email -$ 15$ 45$ 35$ 20$ 15$ 45$
Display -$ -$ -$ -$ 15$ -$ 45$
% Attributed 0% 33% 100% 78% 78% 78% 300%
% UnAttributed 100% 67% 0% 22% 22% 22% -200%

© All Rights
ReservedKCDMA | February 11, 2014 15
Hybrid Attribution Model
Hybrid Attibution Model
Direct Indirect Indirect
Action
Click (All
Channels)
Open or
Click
(Email)
Display
or Click
(SEM or
Display)
Timeframe 14 days 14 days 14 days
Product(s)
Featured
plus
Featured
only
Featured
only
Touch Last Not Last Not Last
Total Revenue 45$ 45$ 45$
Attribution:
SEM -$ -$ -$
Email 45$ -$ -$
Display -$ -$ 15$
% Attributed 100% 0% 33%
% UnAttributed 100% 100% 100%
© All Rights
ReservedKCDMA | February 11, 2014 16
Conversion MetricsEmail: Beyond Opens and Clicks
© All Rights
ReservedKCDMA | February 11, 2014 17
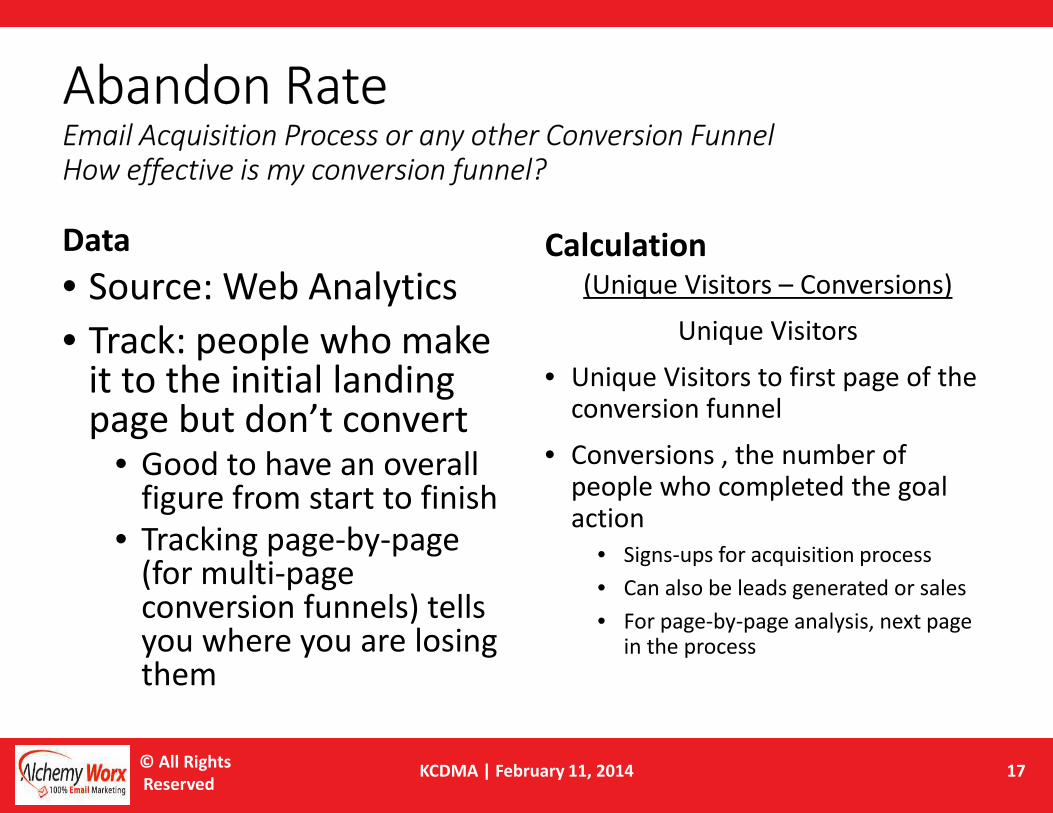
Abandon RateEmail Acquisition Process or any other Conversion FunnelHow effective is my conversion funnel?
Data
• Source: Web Analytics
• Track: people who make it to the initial landing page but don’t convert
• Good to have an overall figure from start to finish
• Tracking page-by-page (for multi-page conversion funnels) tells you where you are losing them
Calculation(Unique Visitors – Conversions)
Unique Visitors
• Unique Visitors to first page of the conversion funnel
• Conversions , the number of people who completed the goal action
• Signs-ups for acquisition process
• Can also be leads generated or sales
• For page-by-page analysis, next page in the process

© All Rights
ReservedKCDMA | February 11, 2014 18
• Collect data after each page, not at end
• Partial info is better than no info
• Prioritize the pages
• What’s more critical – lead scoring questions or phone and USPS address?
• Test to lower the abandon rate on the Lead Scoring Questions Page
Start – Page 1
Email Address
and Name
Page 2
Lead Scoring
Questions
Page 3
Phone and
USPS Address
Finish – Page 4
Thank You
Unique
Visitors
Conversion
Rate
Abandon
Rate
Start - Page 1 10,000 80% 20%
Page 2 8,000 19% 81%
Page 3 1,500 67% 33%
Finish - Page 4 1,000
Start to Finish 10% 90%
Abandon RateAny Conversion Funnel
90%
Abandon
Rate –
Conversion
Funnel
could be
better
(Goal: 50%
or less)

© All Rights
ReservedKCDMA | February 11, 2014 19
Website Email Conversion RateHow effective is my Website at driving Email Sign-ups?
Data
• Source: Web Analytics
• Track:
• Unique NEW Visitors per Month
• Online Email Sign-ups per Month
Calculation
Email Sign-Ups
Unique NEW Visitors
• Unique NEW Visitors weeds out previous visitors, a high percentage of which have signed up previously
• If you have acquisition efforts in place driving directly to the sign-up page, you’ll want to exclude these folks from both data points

© All Rights
ReservedKCDMA | February 11, 2014 20
Unique
NEW
Visitors
Sign-Ups
Website
Conversion
Rate
Website
Revenue
Generated
Control 5,738 748 13.0% 20,024$
Test 5,492 933 17.0% 25,494$
Lift 30% 27%
Website Email
Conversion Rate
Online Email Sign-up
Control
Test
30% lift in Website
Email Conversion Rate
Revenue generated
didn’t decrease, in fact
it increased

© All Rights
ReservedKCDMA | February 11, 2014 21
Send MetricsEmail: Beyond Opens and Clicks

© All Rights
ReservedKCDMA | February 11, 2014 22
REACHOverall Email Program or Individual Sub-program
How much of my subscriber base is engaged with my program?
Data:• Source: Email activity data• Track: Number of unique
subscribers who open an email.
– Typically measured email by email over a Quarter and/or a Year.
De-duped list of all email
addresses that opened
De-duped list of all email
addresses that were delivered
OpenReach =
De-duped list of all email
addresses that clicked
De-duped list of all email
addresses that were delivered
ClickReach
=
Calculation:
© All Rights
ReservedKCDMA | February 11, 2014 23
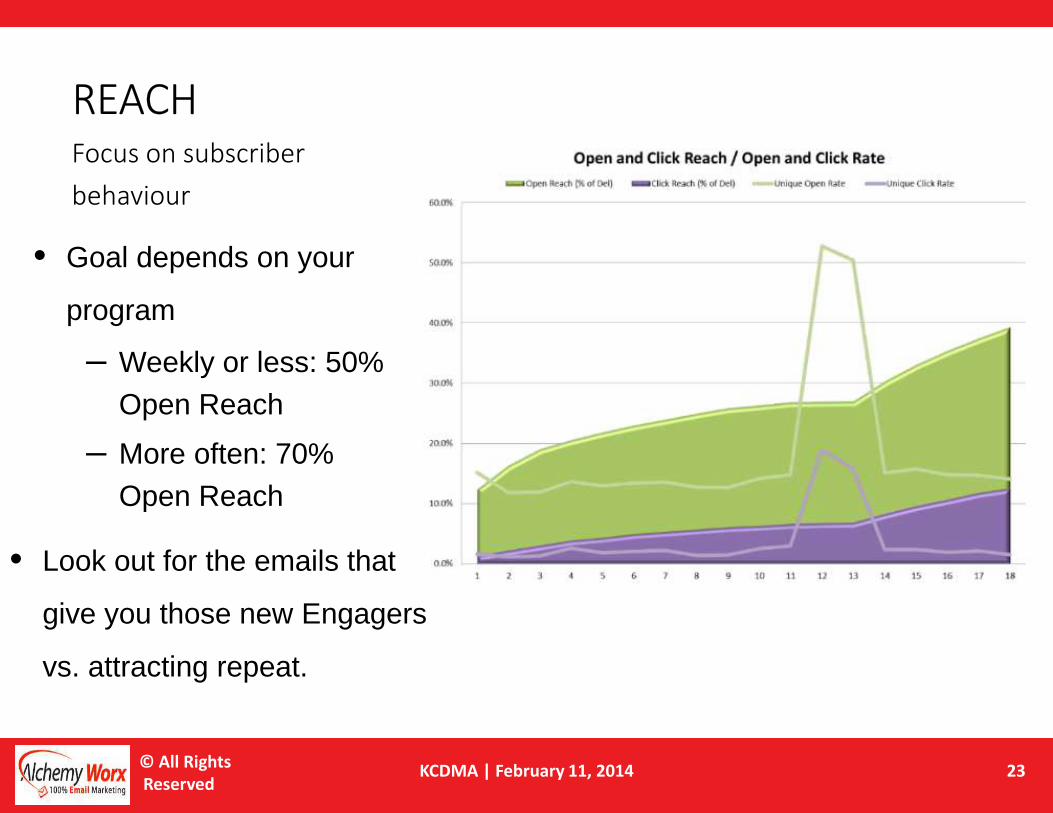
REACHFocus on subscriber
behaviour
• Goal depends on your
program
– Weekly or less: 50% Open Reach
– More often: 70% Open Reach
• Look out for the emails that
give you those new Engagers
vs. attracting repeat.

© All Rights
ReservedKCDMA | February 11, 2014 24
Lifecycle of an Email Address

© All Rights
ReservedKCDMA | February 11, 2014 25
Mobile View Rate
Source: Mobile Maintains 51% Majority; Gmail Gains 3%, Justine Jordan for the Litmus Blog, January 9, 2014

© All Rights
ReservedKCDMA | February 11, 2014 26
Mobile v. Desktop View RateHow much effort should I make to address mobile?
• Reported, not calculated
• Device type as well as operating systems
• Match your resource expenditures on mobile to your current and projected mobile view rate
• Responsive design vs. narrow fixed width
Source: SubscriberMail

© All Rights
ReservedKCDMA | February 11, 2014 27
Responsive DesignUsually Best…
But Think it
Through
© All Rights
ReservedKCDMA | February 11, 2014 28
Testing AnalyticsEmail: Past Opens and Clicks

© All Rights
ReservedKCDMA | February 11, 2014 29
Estimated Sample SizeHow many emails should I send to have a good chance of getting statistically significant results?Data
• Source: Email Metrics and Assumptions
• Track:
• Average expected conversion rate (CR)
• Minimum lift you’re looking for (Lift)
Calculation
31.38 * CR * (1-CR)
(Lift * CR) * (Lift * CR)
• Split the quantity returned between 2 cells
• My rule: minimum of 20,000 per test cell (over multiple sends if necessary)
1.0%
25%
49,706
24,853
24,853
Average expected conversion rate
Minimum lift desired
Total Send Quantity Needed (Control + Test Cells)
Control Cell
Test Cell
© All Rights
ReservedKCDMA | February 11, 2014 30
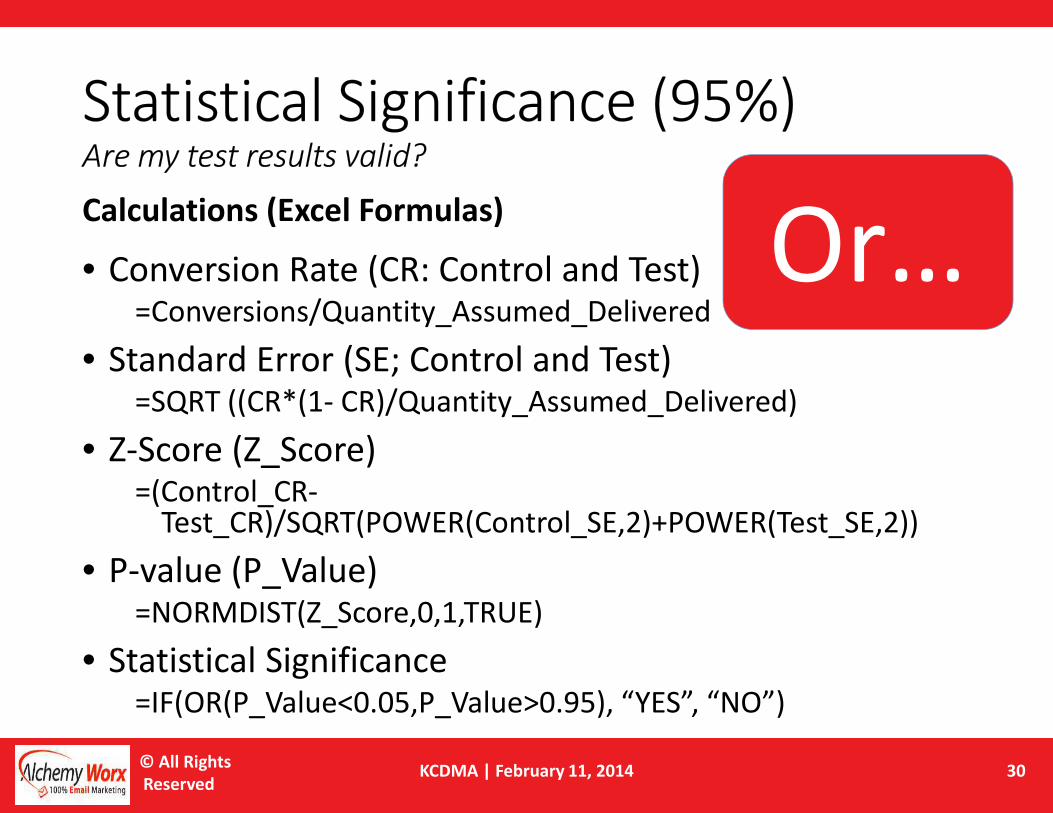
Statistical Significance (95%)Are my test results valid?
Calculations (Excel Formulas)
• Conversion Rate (CR: Control and Test)=Conversions/Quantity_Assumed_Delivered
• Standard Error (SE; Control and Test)=SQRT ((CR*(1- CR)/Quantity_Assumed_Delivered)
• Z-Score (Z_Score)=(Control_CR-
Test_CR)/SQRT(POWER(Control_SE,2)+POWER(Test_SE,2))
• P-value (P_Value)=NORMDIST(Z_Score,0,1,TRUE)
• Statistical Significance=IF(OR(P_Value<0.05,P_Value>0.95), “YES”, “NO”)
Or…
© All Rights
ReservedKCDMA | February 11, 2014 31
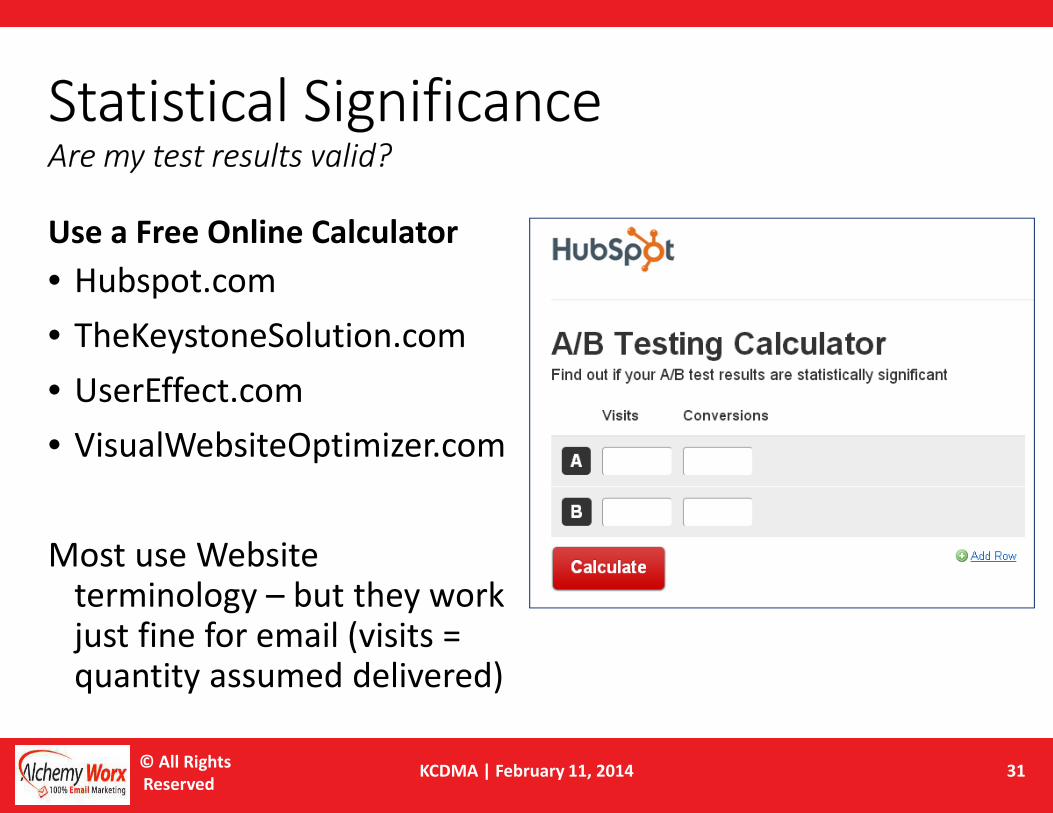
Statistical Significance Are my test results valid?
Use a Free Online Calculator
• Hubspot.com
• TheKeystoneSolution.com
• UserEffect.com
• VisualWebsiteOptimizer.com
Most use Website terminology – but they work just fine for email (visits = quantity assumed delivered)
© All Rights
ReservedKCDMA | February 11, 2014 32
Combining MetricsEmail: Past Opens and Clicks

© All Rights
ReservedKCDMA | February 11, 2014 33
Combine Metrics to Set Goals and Prioritize Time and Resources:Bubble Chart
© All Rights
ReservedKCDMA | February 11, 2014 34
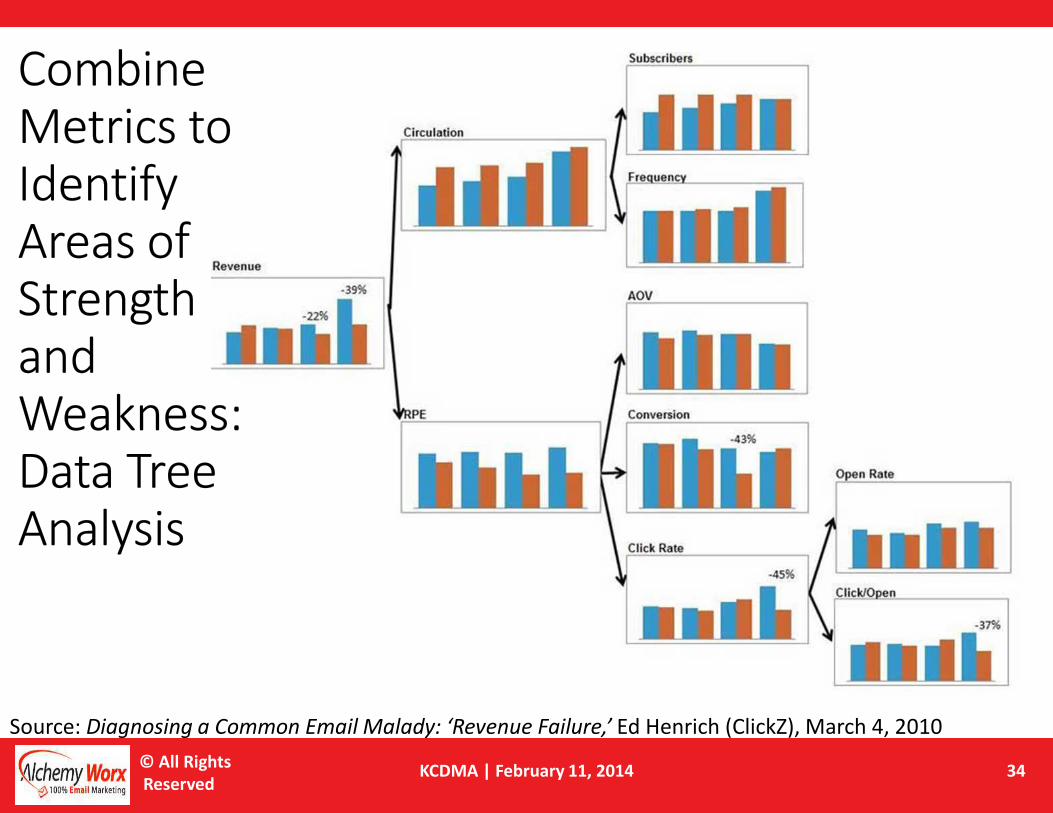
Source: Diagnosing a Common Email Malady: ‘Revenue Failure,’ Ed Henrich (ClickZ), March 4, 2010
Combine Metrics to Identify Areas ofStrength and Weakness:Data Tree Analysis
© All Rights
ReservedKCDMA | February 11, 2014 35
Additional ResourcesEmail: Past Opens and Clicks

© All Rights
ReservedKCDMA | February 11, 2014 36
Additional Email Marketing Resources (Free)
Look for Jeanne’s column on email marketing every other Monday
www.ClickZ.com
The Alchemy Worx email newsletter;
Read past articles and sign-up at
www.alchemyworx.com/emailworx/
@JeaJen to follow Jeanne
@AlchemyWorx to follow the agency

© All Rights
ReservedKCDMA | February 11, 2014 37
Additional Email Marketing Resources (Paid)
The Premier Email Marketing Association, part of the DMA; Resources and Annual Conference
www.EmailExperience.org
A Private Community for Email Marketers; Discussion Lists and Meetups (Feel free to say I referred you); Look for Jeanne’s monthly post on the blogwww.OnlyInfluencers.com
© All Rights
ReservedKCDMA | February 11, 2014 38
Alchemy WorxA 100% Email Marketing Agency
• Services offered include strategy, creative, production and deployment
• We are ESP agnostic – we handle deployment for many clients through a variety of ESPs
• Headquartered in London; US Headquarters in Atlanta
• Founded in 2001 by Dela Quist, CEO
• Jeanne joined the team in 2013, after having her own email marketing consultancy for 12 years
• Call us! We’d love to help make your email marketing more effective and more profitable
© All Rights
ReservedKCDMA | February 11, 2014 39
Email: Beyond Opens and ClicksKCDMA | February 11, 2014
Thanks for Joining Us Today!
Questions?Jeanne S. JenningsVice President, Global Strategic Services
404.922.7448 | [email protected]
Alchemy Worxa 100% Email Marketing Agency
www.AlchemyWorx.com