emc test report - particle
TRANSCRIPT

BV 7Layers Communications
Technology (Shenzhen) Co. Ltd
No.B102, Dazu Chuangxin Mansion, North of Beihuan
Avenue, North Area, Hi-Tech Industrial Park, Nanshan
District, Shenzhen51800, China
Tel: +86 755 8869 6566
Fax: +86 755 8869 6577
Email: [email protected]
Page 1 of 22 Report Version 1
Test Report No.: FV200520W003
EMC TEST REPORT
Applicant: Particle Industries,Inc
Address: 126 Post St,4th floor, San Francisco,CA 94108 USA
Manufacturer or
Supplier: Particle Industries,Inc
Address: 126 Post St,4th floor, San Francisco,CA 94108 USA
Product: Tracker SoM LTE M1
Brand Name: Particle
Model Name: T402M/T404M
FCC ID: 2AEMI-T40X
Date of tests: May. 21, 2020 ~ Jun. 04, 2020
The submitted sample of the above equipment has been tested for according to the requirements of the following standards:
FCC Part 15, Subpart B, Class A FCC Part 15, Subpart B, Class B (sDoC)
ANSI C63.4:2014
CONCLUSION: The submitted sample was found to COMPLY with the test requirement
Prepared by Alex Chen
Engineer / Mobile Department
Approved by Luke Lu
Manager / Mobile Department
Date: Jun. 05, 2020 Date: Jun. 05, 2020 This report is governed by, and incorporates by reference, CPS Conditions of Service as posted at the date of issuance of this report at http://www.bureauveritas.com/home/about-us/our-business/cps/about-us/terms-conditions/and is intended for your exclusive use. Any copying or replication of this report to or for any other person or entity, or use of our name or trademark, is permitted only with our prior written permission. This report sets forth our f indings solely with respect to the test samples identified herein. The results set forth in this report are not indicative or representative of the quality or characteristics of the lot from which a test sample was taken or any similar or identical product unless specifically and expressly noted. Our report includes all of the tests requested by you and the results thereof based upon the information that you provided to us. Measurement uncertainty is only provided upon request for accredited tests. You have 60 days from date of issuance of this report to notify us of any material error or omission caused by our negligence or if you require measurement uncertainty; provided, however, that such notice shall be in writing and shall specifically address the issue you wish to raise. A failure to raise such issue within the prescribed time shall constitute you unqualified acceptance of the completeness of this report, the tests conducted and the correctness of the report contents.
BV 7Layers Communications
Technology (Shenzhen) Co. Ltd
No.B102, Dazu Chuangxin Mansion, North of Beihuan
Avenue, North Area, Hi-Tech Industrial Park, Nanshan
District, Shenzhen51800, China
Tel: +86 755 8869 6566
Fax: +86 755 8869 6577
Email: [email protected]
Page 2 of 22 Report Version 1
Test Report No.: FV200520W003
TABLE OF CONTENTS
RELEASE CONTROL RECORD ............................................................................................................... 3
1 GENERAL INFORMATION ................................................................................................................ 4
1.1 GENERAL DESCRIPTION OF EUT ............................................................................................. 4 1.2 SUMMARY OF TEST RESULTS .................................................................................................. 5 1.3 MEASUREMENT UNCERTAINTY ............................................................................................... 5 1.4 DESCRIPTION OF TEST MODES ............................................................................................... 6 1.5 DESCRIPTION OF SUPPORT UNITS ......................................................................................... 7
2 EMISSION TEST ................................................................................................................................ 8
2.1 CONDUCTED EMISSION MEASUREMENT ................................................................................. 8 2.1.1 LIMITS OF CONDUCTED EMISSION MEASUREMENT ....................................................... 8 2.1.2 TEST INSTRUMENTS .......................................................................................................... 8 2.1.3 TEST PROCEDURES .......................................................................................................... 9 2.1.4 DEVIATION FROM TEST STANDARD ................................................................................ 9 2.1.5 TEST SETUP ...................................................................................................................... 10 2.1.6 EUT OPERATING CONDITIONS ....................................................................................... 10 2.1.7 TEST RESULTS .................................................................................................................. 11
2.2 RADIATED EMISSION MEASUREMENT .................................................................................. 13 2.2.1 LIMITS OF RADIATED EMISSION MEASUREMENT ....................................................... 13 2.2.2 TEST INSTRUMENTS ........................................................................................................ 14 2.2.3 TEST PROCEDURE ........................................................................................................... 15 2.2.4 DEVIATION FROM TEST STANDARD .............................................................................. 16 2.2.5 TEST SETUP ...................................................................................................................... 17 2.2.6 EUT OPERATING CONDITIONS ....................................................................................... 17 2.2.7 TEST RESULTS ................................................................................................................. 18
3 APPENDIX A – MODIFICATIONS RECORDERS FOR ENGINEERING CHANGES TO THE EUT
BY THE LAB ............................................................................................................................................ 22
BV 7Layers Communications
Technology (Shenzhen) Co. Ltd
No.B102, Dazu Chuangxin Mansion, North of Beihuan
Avenue, North Area, Hi-Tech Industrial Park, Nanshan
District, Shenzhen51800, China
Tel: +86 755 8869 6566
Fax: +86 755 8869 6577
Email: [email protected]
Page 3 of 22 Report Version 1
Test Report No.: FV200520W003
RELEASE CONTROL RECORD
ISSUE NO. REASON FOR CHANGE DATE ISSUED
FV200520W003 Original release Jun. 05, 2020

BV 7Layers Communications
Technology (Shenzhen) Co. Ltd
No.B102, Dazu Chuangxin Mansion, North of Beihuan
Avenue, North Area, Hi-Tech Industrial Park, Nanshan
District, Shenzhen51800, China
Tel: +86 755 8869 6566
Fax: +86 755 8869 6577
Email: [email protected]
Page 4 of 22 Report Version 1
Test Report No.: FV200520W003
1 GENERAL INFORMATION
1.1 GENERAL DESCRIPTION OF EUT
PRODUCT Tracker SoM LTE M1
BRAND NAME Particle
MODEL NAME T402M/T404M
NOMINAL VOLTAGE Li+ PIN: DC +3.3V--4.3V or Vusb PIN: DC +4.35V--5.5V or Vin PIN: DC +3.9V--17V
MODULATION TYPE GSM/GPRS/EDGE GMSK, 8PSK
LTE QPSK/16QAM
OPERATING
FREQUENCY
GSM 824.2MHz ~ 848.8MHz (FOR GSM 850)
1850.2MHz ~ 1909.8MHz (FOR GSM 1900)
LTE
1850.7MHz ~ 1909.3MHz (FOR LTE Band2)
1710.7MHz ~ 1754.3MHz (FOR LTE Band4)
824.7MHz ~ 848.3MHz (FOR LTE Band5) 699.7MHz ~ 715.3MHz (FOR LTE Band12)
779.5MHz ~ 784.5MHz (FOR LTE Band13) 1850.7MHz ~ 1914.3MHz (FOR LTE Band25)
HW VERSION V1.0
SW VERSION V1.5.4
I/O PORTS Refer to user’s manual
CABLE SUPPLIED N/A
NOTE: 1. For a more detailed features description, please refer to the manufacturer’s specifications or the
user's manual. 2. The schematic and PCB of the two models T402M and T404M used by our company for the
certification is completely the same ,and the HW&SW used is the same. Because the product is sold in different market using different models eSIM, different models are named. the differences are as follows:T402M uses eSIM of Kore.T404M uses eSIM of Twilio.
3. For the test results, the EUT had been tested with all conditions. But only the worst case was shown
in test report.
BV 7Layers Communications
Technology (Shenzhen) Co. Ltd
No.B102, Dazu Chuangxin Mansion, North of Beihuan
Avenue, North Area, Hi-Tech Industrial Park, Nanshan
District, Shenzhen51800, China
Tel: +86 755 8869 6566
Fax: +86 755 8869 6577
Email: [email protected]
Page 5 of 22 Report Version 1
Test Report No.: FV200520W003
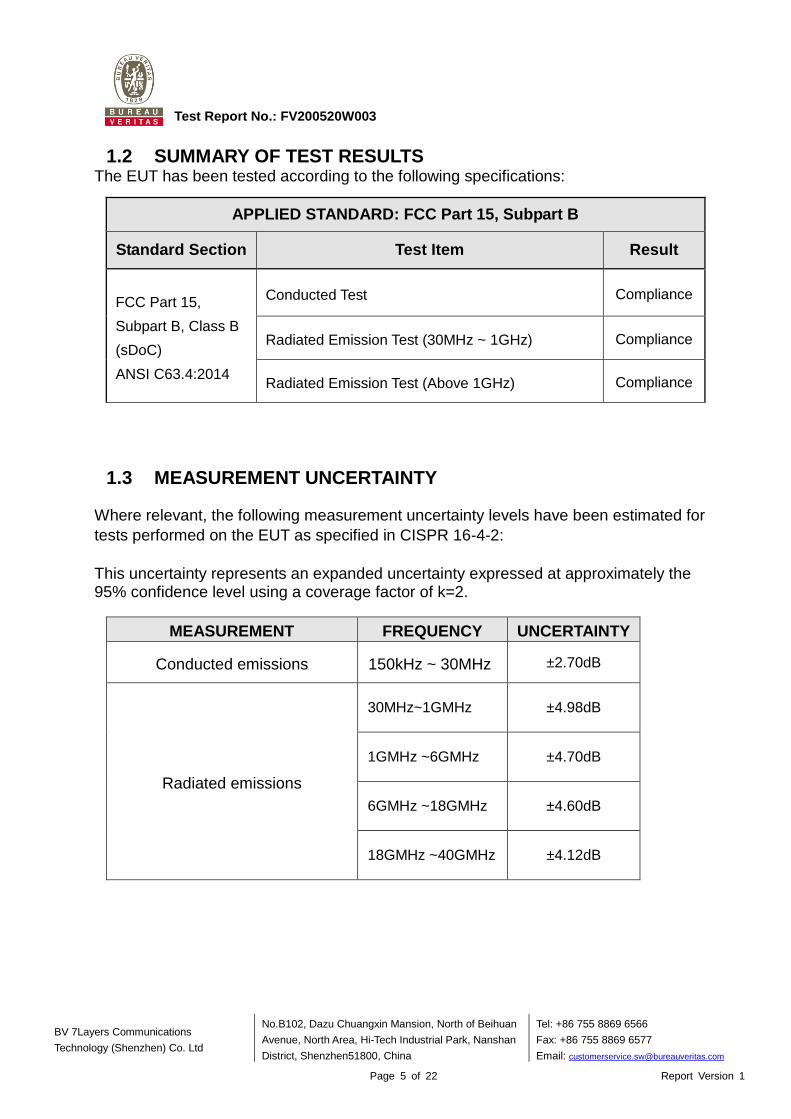
1.2 SUMMARY OF TEST RESULTS The EUT has been tested according to the following specifications:
APPLIED STANDARD: FCC Part 15, Subpart B
Standard Section Test Item Result
FCC Part 15,
Subpart B, Class B
(sDoC)
ANSI C63.4:2014
Conducted Test Compliance
Radiated Emission Test (30MHz ~ 1GHz) Compliance
Radiated Emission Test (Above 1GHz) Compliance
1.3 MEASUREMENT UNCERTAINTY
Where relevant, the following measurement uncertainty levels have been estimated for
tests performed on the EUT as specified in CISPR 16-4-2:
This uncertainty represents an expanded uncertainty expressed at approximately the 95% confidence level using a coverage factor of k=2.
MEASUREMENT FREQUENCY UNCERTAINTY
Conducted emissions 150kHz ~ 30MHz ±2.70dB
Radiated emissions
30MHz~1GMHz ±4.98dB
1GMHz ~6GMHz ±4.70dB
6GMHz ~18GMHz ±4.60dB
18GMHz ~40GMHz ±4.12dB
BV 7Layers Communications
Technology (Shenzhen) Co. Ltd
No.B102, Dazu Chuangxin Mansion, North of Beihuan
Avenue, North Area, Hi-Tech Industrial Park, Nanshan
District, Shenzhen51800, China
Tel: +86 755 8869 6566
Fax: +86 755 8869 6577
Email: [email protected]
Page 6 of 22 Report Version 1
Test Report No.: FV200520W003
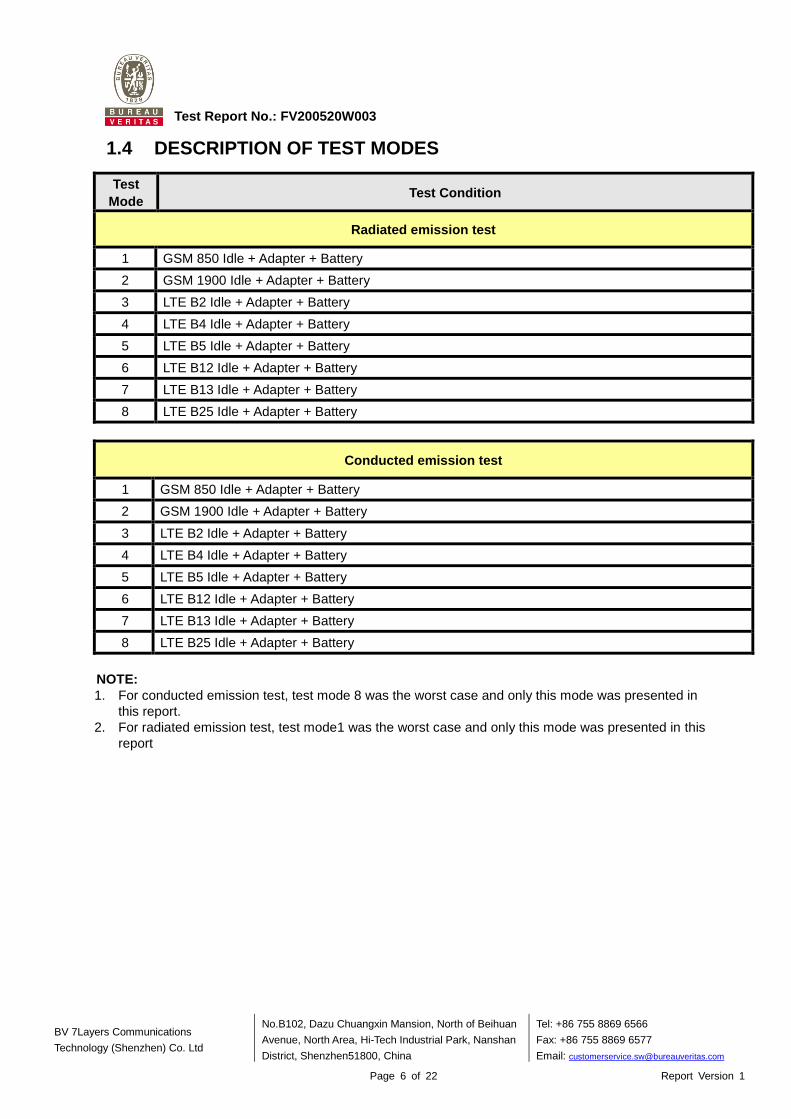
1.4 DESCRIPTION OF TEST MODES
Test
Mode Test Condition
Radiated emission test
1 GSM 850 Idle + Adapter + Battery
2 GSM 1900 Idle + Adapter + Battery
3 LTE B2 Idle + Adapter + Battery
4 LTE B4 Idle + Adapter + Battery
5 LTE B5 Idle + Adapter + Battery
6 LTE B12 Idle + Adapter + Battery
7 LTE B13 Idle + Adapter + Battery
8 LTE B25 Idle + Adapter + Battery
Conducted emission test
1 GSM 850 Idle + Adapter + Battery
2 GSM 1900 Idle + Adapter + Battery
3 LTE B2 Idle + Adapter + Battery
4 LTE B4 Idle + Adapter + Battery
5 LTE B5 Idle + Adapter + Battery
6 LTE B12 Idle + Adapter + Battery
7 LTE B13 Idle + Adapter + Battery
8 LTE B25 Idle + Adapter + Battery
NOTE:
1. For conducted emission test, test mode 8 was the worst case and only this mode was presented in
this report.
2. For radiated emission test, test mode1 was the worst case and only this mode was presented in this
report
BV 7Layers Communications
Technology (Shenzhen) Co. Ltd
No.B102, Dazu Chuangxin Mansion, North of Beihuan
Avenue, North Area, Hi-Tech Industrial Park, Nanshan
District, Shenzhen51800, China
Tel: +86 755 8869 6566
Fax: +86 755 8869 6577
Email: [email protected]
Page 7 of 22 Report Version 1
Test Report No.: FV200520W003
1.5 DESCRIPTION OF SUPPORT UNITS The EUT has been tested as an independent unit together with other necessary accessories or support units. The following support units or accessories were used to form a representative test configuration during the tests. FOR All TESTS
NO. PRODUCT BRAND MODEL NO. SERIAL NO. FCC ID
1 Adapter VIVO V0510B-EU N/A N/A
NO. SIGNAL CABLE DESCRIPTION OF THE ABOVE SUPPORT UNITS
1 N/A
BV 7Layers Communications
Technology (Shenzhen) Co. Ltd
No.B102, Dazu Chuangxin Mansion, North of Beihuan
Avenue, North Area, Hi-Tech Industrial Park, Nanshan
District, Shenzhen51800, China
Tel: +86 755 8869 6566
Fax: +86 755 8869 6577
Email: [email protected]
Page 8 of 22 Report Version 1
Test Report No.: FV200520W003
2 EMISSION TEST
2.1 CONDUCTED EMISSION MEASUREMENT
2.1.1 LIMITS OF CONDUCTED EMISSION MEASUREMENT
TEST STANDARD: FCC Part 15, Subpart B (Section: 15.107 a CLASS B)
FREQUENCY OF EMISSION (MHz) CONDUCTED LIMIT (dBµV)
0.15 ~ 0.5
0.5 ~ 5
5 ~ 30
Quasi-peak Average
66 to 56
56
60
56 to 46
46
50
TEST STANDARD: FCC Part 15, Subpart B (Section: 15.107 b CLASS A)
FREQUENCY OF EMISSION (MHz) CONDUCTED LIMIT (dBµV)
0.15 ~ 0.5
0.5 ~ 30
Quasi-peak Average
79
73
66
60
NOTE: 1.The lower limit shall apply at the transition frequencies.
2. The limit decreases in line with the logarithm of the frequency in the range of 0.15 to
0.50MHz.
3. All emanations from a class A/B digital device or system, including any network of conductors
and apparatus connected thereto, shall not exceed the level of field strengths specified above.
2.1.2 TEST INSTRUMENTS
Equipment Manufacturer Model No. Serial No. Last Cal. Next Cal.
EMI Test Receiver Rohde&Schwarz ESR3 101900 Feb. 28,20 Feb. 27, 21
EMC32 test software Rohde&Schwarz EMC32 NA NA NA
LISN network Rohde&Schwarz ENV216 101922 Feb. 28,20 Feb. 27, 21
NOTE: 1. The test was performed in CE shielded room.
.
BV 7Layers Communications
Technology (Shenzhen) Co. Ltd
No.B102, Dazu Chuangxin Mansion, North of Beihuan
Avenue, North Area, Hi-Tech Industrial Park, Nanshan
District, Shenzhen51800, China
Tel: +86 755 8869 6566
Fax: +86 755 8869 6577
Email: [email protected]
Page 9 of 22 Report Version 1
Test Report No.: FV200520W003
2.1.3 TEST PROCEDURES
a. The EUT was placed 0.4 meters from the conducting wall of the shielded room with
EUT being connected to the power mains through a line impedance stabilization
network (LISN). Other support units were connected to the power mains through
another LISN. The two LISNs provide 50 ohm/ 50uH of coupling impedance for the
measuring instrument.
b. Both lines of the power mains connected to the EUT were checked for maximum
conducted interference.
c. The frequency range from 150 kHz to 30MHz was searched. Emission levels under
(Limit - 20dB) were not recorded.
NOTE: All modes of operation were investigated and the worst-case emissions are reported.
2.1.4 DEVIATION FROM TEST STANDARD
No deviation.
BV 7Layers Communications
Technology (Shenzhen) Co. Ltd
No.B102, Dazu Chuangxin Mansion, North of Beihuan
Avenue, North Area, Hi-Tech Industrial Park, Nanshan
District, Shenzhen51800, China
Tel: +86 755 8869 6566
Fax: +86 755 8869 6577
Email: [email protected]
Page 10 of 22 Report Version 1
Test Report No.: FV200520W003
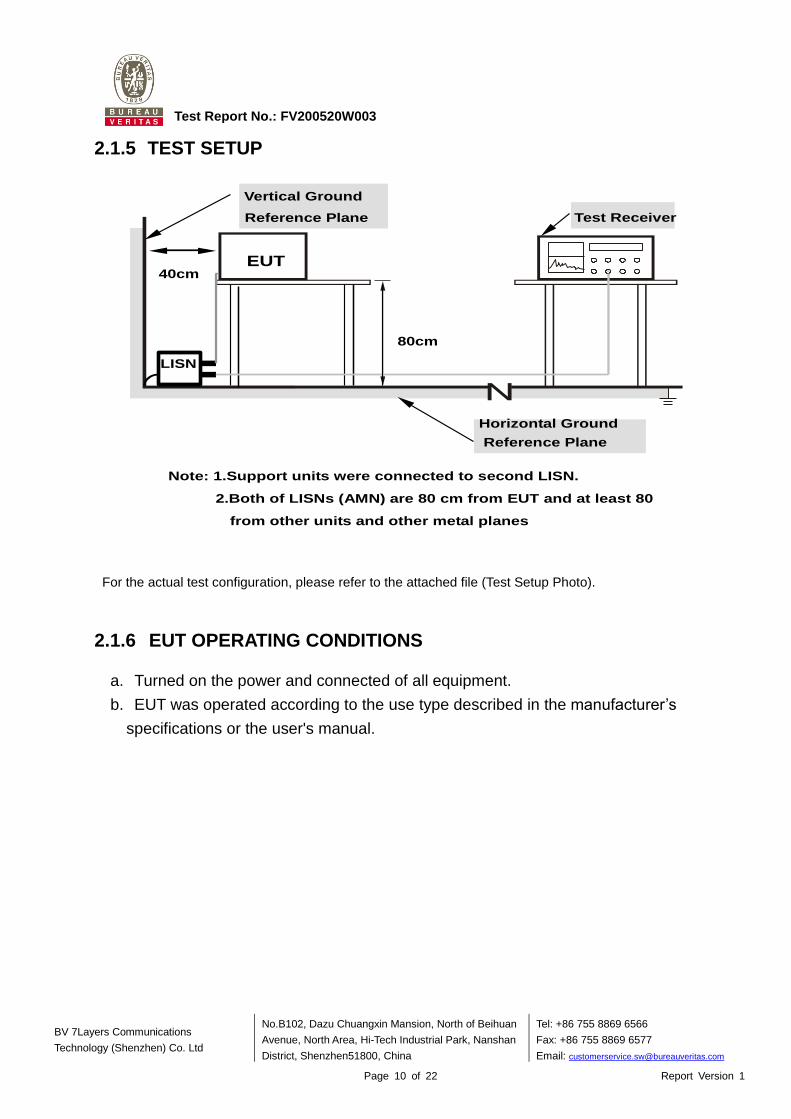
2.1.5 TEST SETUP
Note: 1.Support units were connected to second LISN.
2.Both of LISNs (AMN) are 80 cm from EUT and at least 80
cm from other units and other metal planes
support. units.
Vertical Ground
Reference Plane
40cm
80cm
Test Receiver
Horizontal Ground
Reference Plane
EUT
LISN
For the actual test configuration, please refer to the attached file (Test Setup Photo).
2.1.6 EUT OPERATING CONDITIONS
a. Turned on the power and connected of all equipment.
b. EUT was operated according to the use type described in the manufacturer’s
specifications or the user's manual.
BV 7Layers Communications
Technology (Shenzhen) Co. Ltd
No.B102, Dazu Chuangxin Mansion, North of Beihuan
Avenue, North Area, Hi-Tech Industrial Park, Nanshan
District, Shenzhen51800, China
Tel: +86 755 8869 6566
Fax: +86 755 8869 6577
Email: [email protected]
Page 11 of 22 Report Version 1
Test Report No.: FV200520W003
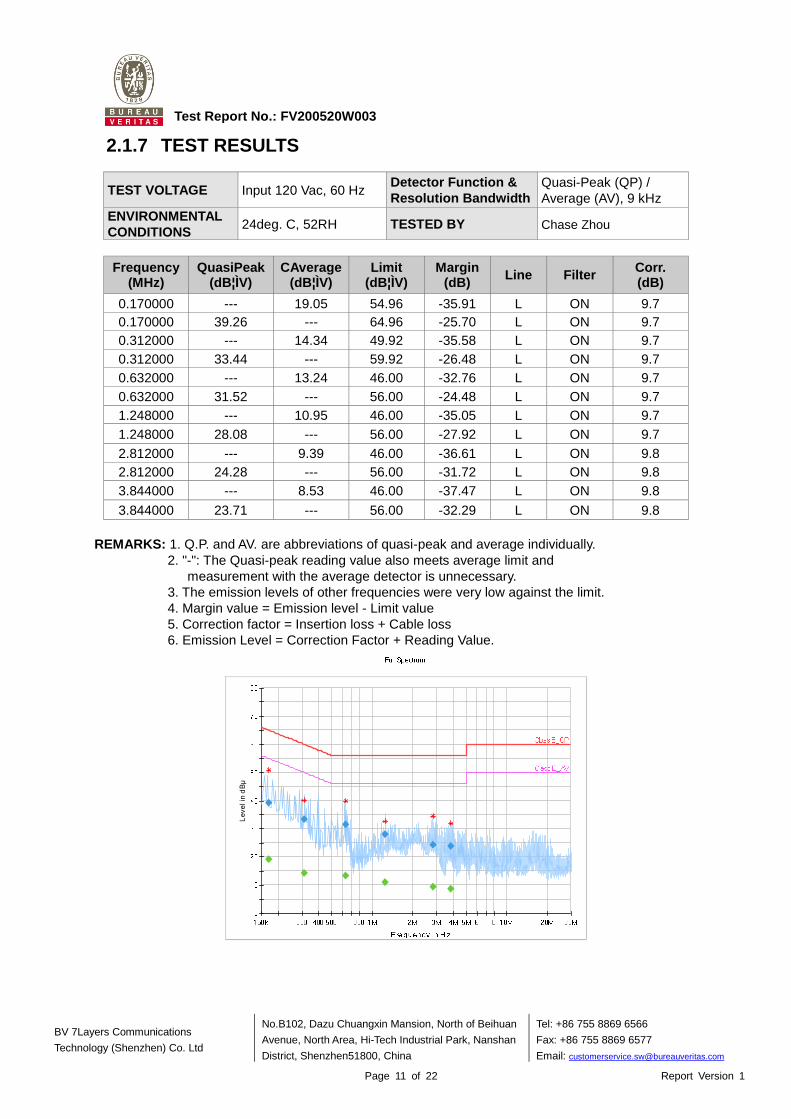
2.1.7 TEST RESULTS
TEST VOLTAGE Input 120 Vac, 60 Hz Detector Function &
Resolution Bandwidth
Quasi-Peak (QP) /
Average (AV), 9 kHz
ENVIRONMENTAL
CONDITIONS 24deg. C, 52RH TESTED BY Chase Zhou
Frequency (MHz)
QuasiPeak (dB¦ÌV)
CAverage (dB¦ÌV)
Limit (dB¦ÌV)
Margin (dB)
Line Filter Corr. (dB)
0.170000 --- 19.05 54.96 -35.91 L ON 9.7
0.170000 39.26 --- 64.96 -25.70 L ON 9.7
0.312000 --- 14.34 49.92 -35.58 L ON 9.7
0.312000 33.44 --- 59.92 -26.48 L ON 9.7
0.632000 --- 13.24 46.00 -32.76 L ON 9.7
0.632000 31.52 --- 56.00 -24.48 L ON 9.7
1.248000 --- 10.95 46.00 -35.05 L ON 9.7
1.248000 28.08 --- 56.00 -27.92 L ON 9.7
2.812000 --- 9.39 46.00 -36.61 L ON 9.8
2.812000 24.28 --- 56.00 -31.72 L ON 9.8
3.844000 --- 8.53 46.00 -37.47 L ON 9.8
3.844000 23.71 --- 56.00 -32.29 L ON 9.8
REMARKS: 1. Q.P. and AV. are abbreviations of quasi-peak and average individually.
2. "-": The Quasi-peak reading value also meets average limit and
measurement with the average detector is unnecessary.
3. The emission levels of other frequencies were very low against the limit.
4. Margin value = Emission level - Limit value
5. Correction factor = Insertion loss + Cable loss
6. Emission Level = Correction Factor + Reading Value.
Level in
dB
μ
BV 7Layers Communications
Technology (Shenzhen) Co. Ltd
No.B102, Dazu Chuangxin Mansion, North of Beihuan
Avenue, North Area, Hi-Tech Industrial Park, Nanshan
District, Shenzhen51800, China
Tel: +86 755 8869 6566
Fax: +86 755 8869 6577
Email: [email protected]
Page 12 of 22 Report Version 1
Test Report No.: FV200520W003
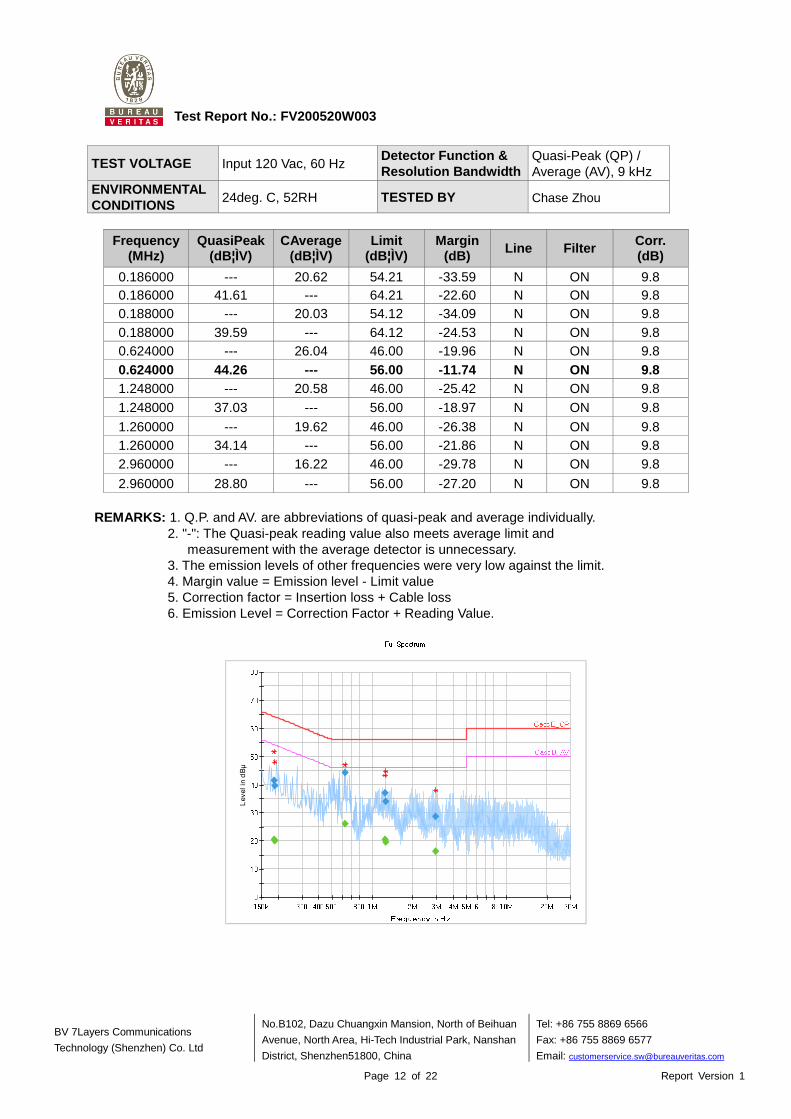
TEST VOLTAGE Input 120 Vac, 60 Hz Detector Function &
Resolution Bandwidth
Quasi-Peak (QP) /
Average (AV), 9 kHz
ENVIRONMENTAL
CONDITIONS 24deg. C, 52RH TESTED BY Chase Zhou
Frequency (MHz)
QuasiPeak (dB¦ÌV)
CAverage (dB¦ÌV)
Limit (dB¦ÌV)
Margin (dB)
Line Filter Corr. (dB)
0.186000 --- 20.62 54.21 -33.59 N ON 9.8
0.186000 41.61 --- 64.21 -22.60 N ON 9.8
0.188000 --- 20.03 54.12 -34.09 N ON 9.8
0.188000 39.59 --- 64.12 -24.53 N ON 9.8
0.624000 --- 26.04 46.00 -19.96 N ON 9.8
0.624000 44.26 --- 56.00 -11.74 N ON 9.8
1.248000 --- 20.58 46.00 -25.42 N ON 9.8
1.248000 37.03 --- 56.00 -18.97 N ON 9.8
1.260000 --- 19.62 46.00 -26.38 N ON 9.8
1.260000 34.14 --- 56.00 -21.86 N ON 9.8
2.960000 --- 16.22 46.00 -29.78 N ON 9.8
2.960000 28.80 --- 56.00 -27.20 N ON 9.8
REMARKS: 1. Q.P. and AV. are abbreviations of quasi-peak and average individually.
2. "-": The Quasi-peak reading value also meets average limit and
measurement with the average detector is unnecessary.
3. The emission levels of other frequencies were very low against the limit.
4. Margin value = Emission level - Limit value
5. Correction factor = Insertion loss + Cable loss
6. Emission Level = Correction Factor + Reading Value.
Level in
dB
μ
BV 7Layers Communications
Technology (Shenzhen) Co. Ltd
No.B102, Dazu Chuangxin Mansion, North of Beihuan
Avenue, North Area, Hi-Tech Industrial Park, Nanshan
District, Shenzhen51800, China
Tel: +86 755 8869 6566
Fax: +86 755 8869 6577
Email: [email protected]
Page 13 of 22 Report Version 1
Test Report No.: FV200520W003
2.2 RADIATED EMISSION MEASUREMENT
2.2.1 LIMITS OF RADIATED EMISSION MEASUREMENT
TEST STANDARD: FCC Part 15, Subpart B (Section: 15.109)
Emissions radiated outside of the specified bands, shall be according to the general radiated limits as following:
Radiated Emissions Limits at 3 meters (dBμV/m)
Frequencies (MHz)
FCC 15B / ICES-003, Class A
FCC 15B / ICES-003, Class B
30-88 49 40
88-216 53.5 43.5
216-960 56 46
960-1000 59.5 54
Above 1000 Avg: 59.5 Peak: 79.5
Avg: 54 Peak: 74
Frequency Range (For unintentional radiators)
Highest frequency generated or used in the device or on which the device operates or
tunes (MHz)
Upper frequency of measurement range (MHz)
Below 1.705 30
1.705-108 1000
108-500 2000
500-1000 5000
Above 1000 5th harmonic of the highest frequency
or 40GHz, whichever is lower
NOTE: 1. The lower limit shall apply at the transition frequencies.
2. Emission level (dBuV/m) = 20 log Emission level (uV/m).
3. As shown in 15.35(b), for frequencies above 1000MHz, the field strength limits are based on
average detector, however, the peak field strength of any emission shall not exceed the
maximum permitted average limits, specified above by more than 20dB under any condition of
modulation.
4. QP detector shall be applied if not specified.
BV 7Layers Communications
Technology (Shenzhen) Co. Ltd
No.B102, Dazu Chuangxin Mansion, North of Beihuan
Avenue, North Area, Hi-Tech Industrial Park, Nanshan
District, Shenzhen51800, China
Tel: +86 755 8869 6566
Fax: +86 755 8869 6577
Email: [email protected]
Page 14 of 22 Report Version 1
Test Report No.: FV200520W003
2.2.2 TEST INSTRUMENTS
Frequency range below1GHz
Equipment Manufacturer Model No. Serial No. Last Cal. Next Cal.
3m Semi-anechoic
Chamber ETS-LINDGREN 9m*6m*6m
Euroshieldpn-
CT0001143-121
6
Feb. 28,20 Feb. 27,21
Bilog Antenna ETS-LINDGREN 3143B 00161965 Feb. 28,20 Feb. 27,21
MXE EMI Receiver KEYSIGHT N9038A-544 MY54450026 Feb. 28,20 Feb. 27,21
Signal Pre-Amplifier EMSI EMC 9135 980249 Jun. 24,19 Jun. 23,20
Frequency range above 1GHz
Equipment Manufacturer Model No. Serial No. Last Cal. Next Cal.
3m Semi-anechoic
Chamber ETS-LINDGREN 9m*6m*6m
Euroshieldpn-
CT0001143-121
6
Feb. 28,20 Feb. 27,21
Horn Antenna ETS-LINDGREN 3117 00168728 Feb. 28,20 Feb. 27,21
MXE EMI Receiver KEYSIGHT N9038A-544 MY54450026 Feb. 28,20 Feb. 27,21
Signal Pre-Amplifier EMSI EMC 012645B 980257 Jun. 24,19 Jun. 23,20
NOTE: 1. The test was performed in 3m chamber.
2. The FCC Site Registration No. is 525120; The Designation No. is CN1171.
BV 7Layers Communications
Technology (Shenzhen) Co. Ltd
No.B102, Dazu Chuangxin Mansion, North of Beihuan
Avenue, North Area, Hi-Tech Industrial Park, Nanshan
District, Shenzhen51800, China
Tel: +86 755 8869 6566
Fax: +86 755 8869 6577
Email: [email protected]
Page 15 of 22 Report Version 1
Test Report No.: FV200520W003
2.2.3 TEST PROCEDURE
<Frequency Range below 1GHz>
The basic test procedure was in accordance with ANSI C63.4:2014 (section 12).
a. The EUT was placed on the top of a rotating table 0.8 meters above the ground at a 3 meter semi-anechoic chamber room. The table was rotated 360 degrees to determine the position of the highest radiation.
b. The EUT was set 3 meters away from the interference-receiving antenna, which was mounted on the top of a variable-height antenna tower.
c. The height of antenna is varied from 1 meter to 4 meters above the ground to determine the maximum value of the field strength. Both horizontal and vertical polarizations of the antenna are set to make the measurement.
d. For each suspected emission, the EUT was arranged to its worst case and then the antenna was tuned to heights from 1 meter to 4 meters and the rotatable table was turned from 0 degrees to 360 degrees to find the maximum reading.
e. The test-receiver system was set to quasi-peak detect function and specified bandwidth with maximum hold mode when the test frequency is below 1GHz.
NOTE:
1. The resolution bandwidth of test receiver/spectrum analyzer is 120kHz for Quasi-peak detection
(QP) at frequency below 1GHz.
2. Emission level(dBuV/m)=Raw Value(dBuV) + Correction Factor(dB/m)
3. Correction Factor(dB/m) = Antenna Factor (dB/m) + Cable Factor (dB) (if the raw value not
contains the amplifier);
4. Correction Factor(dB/m) = Antenna Factor (dB/m) + Cable Factor (dB) – Amplifier Gain(dB) (if
the raw value contains the amplifier).
5. Margin value = Emission level – Limit value.
BV 7Layers Communications
Technology (Shenzhen) Co. Ltd
No.B102, Dazu Chuangxin Mansion, North of Beihuan
Avenue, North Area, Hi-Tech Industrial Park, Nanshan
District, Shenzhen51800, China
Tel: +86 755 8869 6566
Fax: +86 755 8869 6577
Email: [email protected]
Page 16 of 22 Report Version 1
Test Report No.: FV200520W003
<Frequency Range above 1GHz>
a. The EUT was placed on the top of a rotating table 0.8 meters above the ground at a 3 meter fully-anechoic chamber room. The table was rotated 360 degrees to determine the position of the highest radiation.
b. The EUT was set 3 meters away from the interference-receiving antenna, which was mounted on the top of a variable-height antenna tower.
c. The height of antenna is varied from one meter to four meters above the ground to determine the maximum value of the field strength. Both horizontal and vertical polarizations of the antenna are set to make the measurement. The bore sight should be used during the test above 1GHz.
d. For each suspected emission, the EUT was arranged to its worst case and then the antenna was tuned to heights from 1 meter to 4 meters and the rotatable table was turned from 0 degrees to 360 degrees to find the maximum reading.
e. The test-receiver system was set to peak and average detect function and specified bandwidth with maximum hold mode when the test frequency is above 1 GHz
NOTE:
1. The resolution bandwidth of test receiver/spectrum analyzer is 120kHz for Quasi-peak detection
(QP) at frequency below 1GHz.
2. The resolution bandwidth is 1MHz and video bandwidth of test receiver/spectrum analyzer is 3MHz
for Peak detection at frequency above 1GHz. The resolution bandwidth of test receiver/spectrum
analyzer is 1 MHz and video bandwidth of test receiver/spectrum analyzer is 1Hz for Average
detection (AV) at frequency above 1GHz.
3. For measurement of frequency above 1000 MHz, the EUT was set 3 meters away from the receiver
antenna.
4. Emission level(dBuV/m)=Raw Value(dBuV) + Correction Factor(dB/m)
5. Correction Factor(dB/m) = Antenna Factor (dB/m) + Cable Factor (dB) (if the raw value not contains
the amplifier);
6. Correction Factor(dB/m) = Antenna Factor (dB/m) + Cable Factor (dB) – Amplifier Gain(dB) (if the
raw value contains the amplifier)
7. Margin value = Emission level – Limit value.
2.2.4 DEVIATION FROM TEST STANDARD
No deviation.
BV 7Layers Communications
Technology (Shenzhen) Co. Ltd
No.B102, Dazu Chuangxin Mansion, North of Beihuan
Avenue, North Area, Hi-Tech Industrial Park, Nanshan
District, Shenzhen51800, China
Tel: +86 755 8869 6566
Fax: +86 755 8869 6577
Email: [email protected]
Page 17 of 22 Report Version 1
Test Report No.: FV200520W003
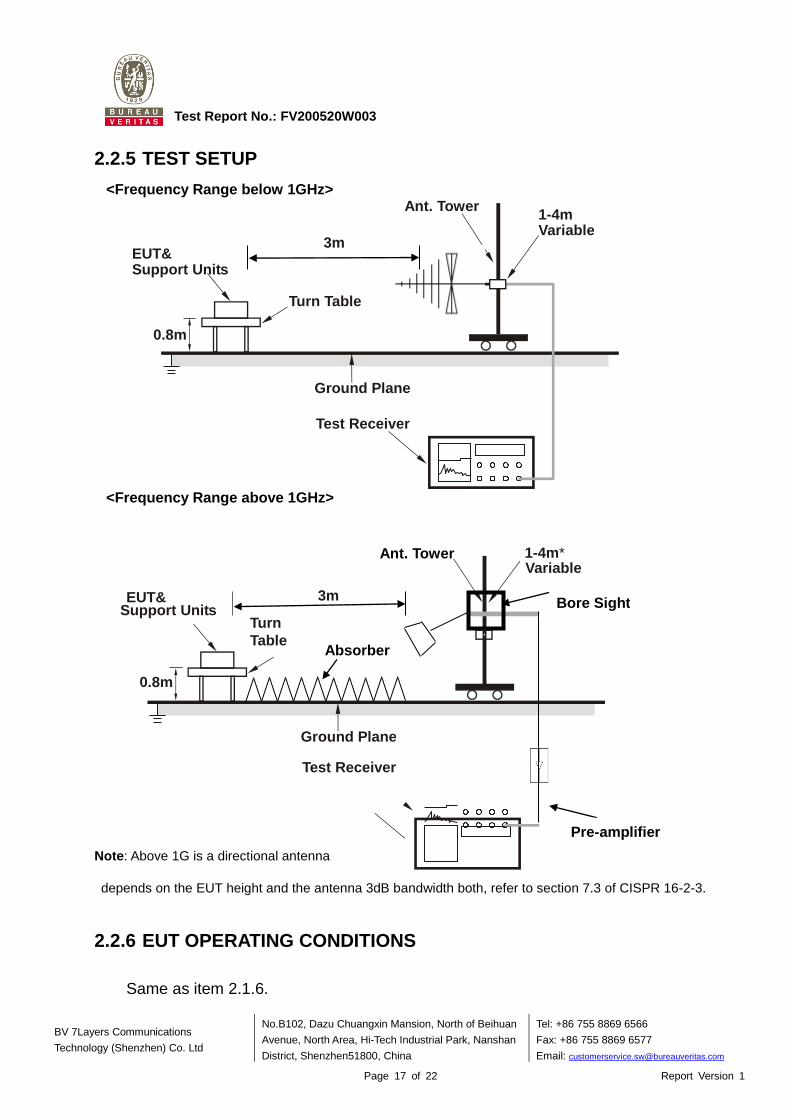
2.2.5 TEST SETUP
<Frequency Range below 1GHz>
<Frequency Range above 1GHz>
Note: Above 1G is a directional antenna
depends on the EUT height and the antenna 3dB bandwidth both, refer to section 7.3 of CISPR 16-2-3.
2.2.6 EUT OPERATING CONDITIONS
Same as item 2.1.6.
Ant. Tower 1-4m
Variable
Turn Table
EUT&
Support Units
Ground Plane
Test Receiver
0.8m
3m
3m
1-4m*
Bore Sight
Turn
Table
EUT& Support Units
Ground Plane
Test Receiver
0.8m
Absorber
Ant. Tower
Pre-amplifier
Variable

BV 7Layers Communications
Technology (Shenzhen) Co. Ltd
No.B102, Dazu Chuangxin Mansion, North of Beihuan
Avenue, North Area, Hi-Tech Industrial Park, Nanshan
District, Shenzhen51800, China
Tel: +86 755 8869 6566
Fax: +86 755 8869 6577
Email: [email protected]
Page 18 of 22 Report Version 1
Test Report No.: FV200520W003
2.2.7 TEST RESULTS
TEST VOLTAGE Input 120 Vac, 60 Hz FREQUENCY RANGE 30-1000 MHz
ENVIRONMENTAL
CONDITIONS 23deg. C, 70 %RH
DETECTOR FUNCTION
& RESOLUTION
BANDWIDTH
Quasi-Peak, 120 kHz
TESTED BY Tony
ANTENNA POLARITY & TEST DISTANCE: HORIZONTAL AT 3 M
FREQ.
(MHz)
EMISSION
LEVEL
(dBuV/m)
READ
LEVEL
(dBuV)
LIMIT
(dBuV/m)
MARGIN
(dB)
ANTENNA
FACTOR
(dB /m)
CABLE
LOSS
(dB)
PREAMP
FACTOR
(dB)
ANTENNA
HEIGHT
(cm)
TABLE
ANGLE
(Degree)
REMARK
30.97 18.06 37.83 40 -21.94 16.8 0.79 37.36 200 66 QP
69.77 26.27 54.91 40 -13.73 7.49 1.2 37.33 200 85 QP
165.8 27.47 52.06 43.5 -16.03 10.44 1.67 36.7 200 112 QP
277.35 23.88 44.85 46 -22.12 13.6 2.13 36.7 200 156 QP
340.4 26.66 45.71 46 -19.34 15.35 2.38 36.78 200 144 QP
422.85 25.95 42.62 46 -20.05 17.5 2.7 36.87 200 199 QP
REMARKS: 1. Peak detector quick scan is showed on the graph and final quasi-peak detector data is
measured corresponding to relevant limit and recorded in the data table.
2. Negative sign (-) in the margin column signify levels below the limit.
3. Frequency range scanned: 30MHz to 1000MHz.
4. Only emissions significantly above equipment noise floor are reported.
BV 7Layers Communications
Technology (Shenzhen) Co. Ltd
No.B102, Dazu Chuangxin Mansion, North of Beihuan
Avenue, North Area, Hi-Tech Industrial Park, Nanshan
District, Shenzhen51800, China
Tel: +86 755 8869 6566
Fax: +86 755 8869 6577
Email: [email protected]
Page 19 of 22 Report Version 1
Test Report No.: FV200520W003
TEST VOLTAGE Input 120 Vac, 60 Hz FREQUENCY RANGE 30-1000 MHz
ENVIRONMENTAL
CONDITIONS 23deg. C, 70 %RH
DETECTOR FUNCTION
& RESOLUTION
BANDWIDTH
Quasi-Peak, 120 kHz
TESTED BY Tony
ANTENNA POLARITY & TEST DISTANCE: VERTICAL AT 3 M
FREQ.
(MHz)
EMISSION
LEVEL
(dBuV/m)
READ
LEVEL
(dBuV)
LIMIT
(dBuV/m)
MARGIN
(dB)
ANTENNA
FACTOR
(dB /m)
CABLE
LOSS
(dB)
PREAMP
FACTOR
(dB)
ANTENNA
HEIGHT
(cm)
TABLE
ANGLE
(Degree)
REMARK
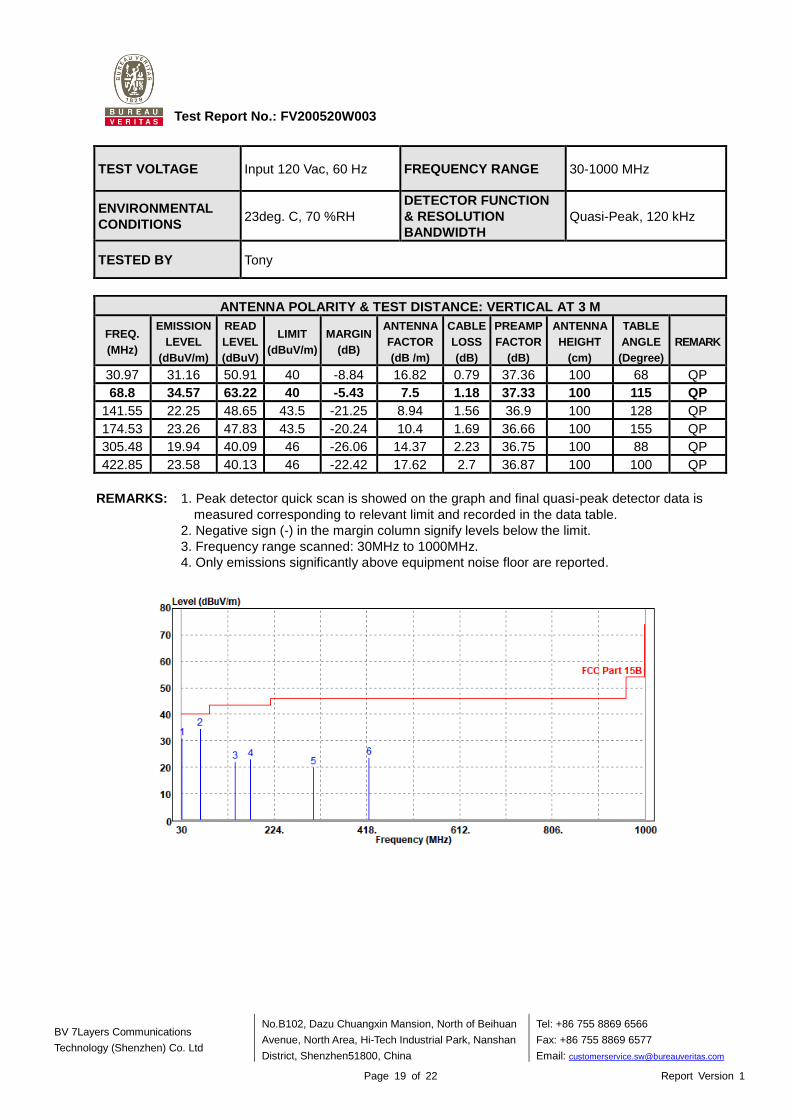
30.97 31.16 50.91 40 -8.84 16.82 0.79 37.36 100 68 QP
68.8 34.57 63.22 40 -5.43 7.5 1.18 37.33 100 115 QP
141.55 22.25 48.65 43.5 -21.25 8.94 1.56 36.9 100 128 QP
174.53 23.26 47.83 43.5 -20.24 10.4 1.69 36.66 100 155 QP
305.48 19.94 40.09 46 -26.06 14.37 2.23 36.75 100 88 QP
422.85 23.58 40.13 46 -22.42 17.62 2.7 36.87 100 100 QP
REMARKS: 1. Peak detector quick scan is showed on the graph and final quasi-peak detector data is
measured corresponding to relevant limit and recorded in the data table.
2. Negative sign (-) in the margin column signify levels below the limit.
3. Frequency range scanned: 30MHz to 1000MHz.
4. Only emissions significantly above equipment noise floor are reported.
BV 7Layers Communications
Technology (Shenzhen) Co. Ltd
No.B102, Dazu Chuangxin Mansion, North of Beihuan
Avenue, North Area, Hi-Tech Industrial Park, Nanshan
District, Shenzhen51800, China
Tel: +86 755 8869 6566
Fax: +86 755 8869 6577
Email: [email protected]
Page 20 of 22 Report Version 1
Test Report No.: FV200520W003
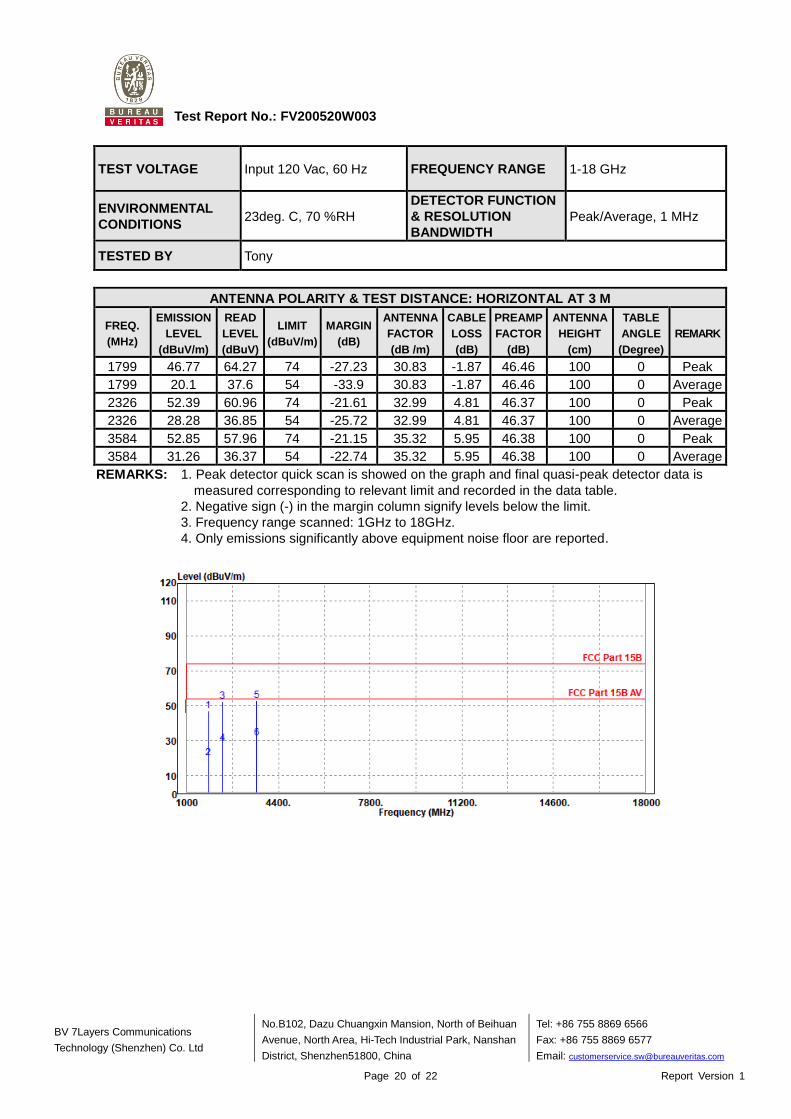
TEST VOLTAGE Input 120 Vac, 60 Hz FREQUENCY RANGE 1-18 GHz
ENVIRONMENTAL
CONDITIONS 23deg. C, 70 %RH
DETECTOR FUNCTION
& RESOLUTION
BANDWIDTH
Peak/Average, 1 MHz
TESTED BY Tony
ANTENNA POLARITY & TEST DISTANCE: HORIZONTAL AT 3 M
FREQ.
(MHz)
EMISSION
LEVEL
(dBuV/m)
READ
LEVEL
(dBuV)
LIMIT
(dBuV/m)
MARGIN
(dB)
ANTENNA
FACTOR
(dB /m)
CABLE
LOSS
(dB)
PREAMP
FACTOR
(dB)
ANTENNA
HEIGHT
(cm)
TABLE
ANGLE
(Degree)
REMARK
1799 46.77 64.27 74 -27.23 30.83 -1.87 46.46 100 0 Peak
1799 20.1 37.6 54 -33.9 30.83 -1.87 46.46 100 0 Average
2326 52.39 60.96 74 -21.61 32.99 4.81 46.37 100 0 Peak
2326 28.28 36.85 54 -25.72 32.99 4.81 46.37 100 0 Average
3584 52.85 57.96 74 -21.15 35.32 5.95 46.38 100 0 Peak
3584 31.26 36.37 54 -22.74 35.32 5.95 46.38 100 0 Average
REMARKS: 1. Peak detector quick scan is showed on the graph and final quasi-peak detector data is
measured corresponding to relevant limit and recorded in the data table.
2. Negative sign (-) in the margin column signify levels below the limit.
3. Frequency range scanned: 1GHz to 18GHz.
4. Only emissions significantly above equipment noise floor are reported.

BV 7Layers Communications
Technology (Shenzhen) Co. Ltd
No.B102, Dazu Chuangxin Mansion, North of Beihuan
Avenue, North Area, Hi-Tech Industrial Park, Nanshan
District, Shenzhen51800, China
Tel: +86 755 8869 6566
Fax: +86 755 8869 6577
Email: [email protected]
Page 21 of 22 Report Version 1
Test Report No.: FV200520W003
TEST VOLTAGE Input 120 Vac, 60 Hz FREQUENCY RANGE 1-18 GHz
ENVIRONMENTAL
CONDITIONS 23deg. C, 70 %RH
DETECTOR FUNCTION
& RESOLUTION
BANDWIDTH
Peak/Average, 1 MHz
TESTED BY Tony
ANTENNA POLARITY & TEST DISTANCE: VERTICAL AT 3 M
FREQ.
(MHz)
EMISSION
LEVEL
(dBuV/m)
READ
LEVEL
(dBuV)
LIMIT
(dBuV/m)
MARGIN
(dB)
ANTENNA
FACTOR
(dB /m)
CABLE
LOSS
(dB)
PREAMP
FACTOR
(dB)
ANTENNA
HEIGHT
(cm)
TABLE
ANGLE
(Degree)
REMARK
2326 48.52 58.03 74 -25.48 32.05 4.81 46.37 200 0 Peak
2326 27.7 37.21 54 -26.3 32.05 4.81 46.37 200 0 Average
3584 54.07 60.61 74 -19.93 33.89 5.95 46.38 200 0 Peak
3584 30.32 36.86 54 -23.68 33.89 5.95 46.38 200 0 Average
5760 49.16 50.91 74 -24.84 36.66 7.77 46.18 200 0 Peak
5760 35.54 37.29 54 -18.46 36.66 7.77 46.18 200 0 Average
REMARKS: 1. Peak detector quick scan is showed on the graph and final quasi-peak detector data is
measured corresponding to relevant limit and recorded in the data table.
2. Negative sign (-) in the margin column signify levels below the limit.
3. Frequency range scanned: 1GHz to 18GHz.
4. Only emissions significantly above equipment noise floor are reported.
BV 7Layers Communications
Technology (Shenzhen) Co. Ltd
No.B102, Dazu Chuangxin Mansion, North of Beihuan
Avenue, North Area, Hi-Tech Industrial Park, Nanshan
District, Shenzhen51800, China
Tel: +86 755 8869 6566
Fax: +86 755 8869 6577
Email: [email protected]
Page 22 of 22 Report Version 1
Test Report No.: FV200520W003
3 APPENDIX A – MODIFICATIONS RECORDERS FOR ENGINEERING
CHANGES TO THE EUT BY THE LAB
No any modifications were made to the EUT by the lab during the test.
---END---