emission characteristics of methanol-in-canola oil...
TRANSCRIPT

Fuel 113 (2013) 97–106
Contents lists available at SciVerse ScienceDirect
Fuel
journal homepage: www.elsevier .com/locate / fuel
Emission characteristics of methanol-in-canola oil emulsionsin a combustion chamber
0016-2361/$ - see front matter � 2013 Elsevier Ltd. All rights reserved.http://dx.doi.org/10.1016/j.fuel.2013.04.083
⇑ Corresponding author. Address: 118C, Thompson Hall, MS 3367 TAMU, CollegeStation, TX 77843-3367, USA. Tel.: +1 979 458 1900; fax: +1 979 862 7969.
E-mail address: [email protected] (J.L. Alvarado).
Shreyas Bhimani a, Jorge L. Alvarado b,⇑, Kalyan Annamalai a, Charles Marsh c,d
a Department of Mechanical Engineering, Texas A&M University, College Station, TX 77843, USAb Department of Engineering Technology and Industrial Distribution, Texas A&M University, 118 Thompson Hall, 3367 TAMU, College Station, TX 77843-3367, USAc US Army, Engineer Research and Development Center, Construction Engineering Research Laboratory, 2902 Newmark Drive, Champaign, IL 61822-1076, USAd Department of Nuclear Plasma and Radiological Engineering at the University of Illinois at Urbana–Champaign, 104 South Wright Street, Urbana, IL 61801, USA
h i g h l i g h t s
� Stable canola oil emulsions were made using Span 80, canola oil, and methanol.� Emulsions produced lower NOx, CO and unburned HC emissions than pure canola oil.� Higher amount of methanol in the emulsions led to lesser NOx, UHC and CO emissions.� Increased vorticity at higher swirl angle led to better mixing and lower emissions.
a r t i c l e i n f o
Article history:Received 13 January 2013Received in revised form 28 April 2013Accepted 29 April 2013Available online 28 May 2013
Keywords:Canola oilMethanolSwirlerEmulsionTwin-fluid atomizer
a b s t r a c t
This paper focuses on the emulsification and combustion characteristics of different methanol-in-canolaoil blends subject to different conditions including swirl number and equivalence ratio. Exhaust emis-sions data such as nitrogen oxides (NOx), unburned hydrocarbons (UHC’s), carbon monoxide (CO) andcarbon dioxide (CO2) emission levels were measured and analyzed thoroughly. Stable methanol-in-canola oil emulsions were made by using a combination of Span 80 and Tween 80 surfactants. The threedifferent fuels studied were; pure canola oil, 89-9 emulsion [9% methanol – in – 89% canola oil emulsionwith 2% surfactant (w/w)] and 85-12.5 emulsion [12.5% methanol – in – 85% canola oil emulsion with2.5% surfactant (w/w)]. All the experiments were conducted in a 30 kW combustion chamber equippedwith a twin fluid atomizer and a radial vane swirler. The swirler vanes were positioned at 60� and 51�angles (with respect to vertical axis) in order to achieve swirl numbers (SNs) of 1.40 and 1.0, respectively.The fuels were tested at equivalence ratios (/) of 0.83, 0.91, 1.0, 1.05 and 1.11.
Ultimate analysis, higher heating value (HHV), kinematic viscosity and density were used to character-ize the fuel properties. Experimental results showed that fuel type and swirl number had a major influ-ence on emission levels. All the emulsions produced lower NOx, CO and unburned hydrocarbon emissionsthan pure canola oil at both swirl numbers and all equivalence ratios. The emulsions also produced higherCO2 emissions than pure canola oil. On comparing the performance of the emulsions, it was seen that theaddition of methanol to the blend had a definite positive impact on the combustion characteristics. It wasobserved that higher percentage of methanol in the emulsions led to lesser NOx, UHC and CO emissions.The vorticity imparted to the secondary air by the swirler also affected emission levels considerably.Increased vorticity at higher swirl angle led to better mixing of air and fuel, minimizing emission levelsspecifically at swirl number of 1.4.
� 2013 Elsevier Ltd. All rights reserved.
1. Introduction
In the past decade, two important factors have influenced theworld’s energy market. First, a massive increase in the demand ofconventional fossil fuels resulting in a rapid increase in their cost
and the ever increasing difficulty being faced in finding andextracting more of these fuels from miles below the earth crust.Second, the concern for global warming and general health of pop-ulation has led to stricter regulations on emissions of greenhousegases like carbon dioxide (CO2) and other major air pollutants likenitrogen oxides (NOx), sulfur oxides (SOx), carbon monoxide (CO),soot and unburned hydrocarbons (UHC’s). The above factors havemotivated researchers to explore alternative energy sources likebiofuels derived from agricultural products.

Nomenclature
CC combustion chamberCO carbon monoxideCO2 carbon dioxideHHV higher heating valueHLB hydrophilic lipophilic balanceLPM liters per minuteN2O nitrous oxideNG natural gasNO nitrogen oxideNO2 nitrogen dioxideNOx nitrogen oxides (mainly a mixture of nitrogen oxide and
nitrogen dioxide)O2 oxygenppmvd parts per million by volume on a dry basisppmvdc parts per million by volume on a dry basis corrected to
15% oxygen in the exhaustR inner radius of the outer annulusRh outer radius of the inner annulusSMD Sauter mean diameterSN swirl numberSO2 sulfur dioxideSOx sulfur oxidesUHC unburned hydrocarbonsv/v volume basisw/w weight basisX desired HLB number
XNO measured/uncorrected NO mole fraction (ppmvd units)XNO,std corrected NO mole fraction (ppmvdc units)XO2 measured oxygen mole fraction in the exhaust gas
streamXO2,a mole fraction of oxygen in ambient air, 0.21XO2,std standard oxygen mole fraction, 0.15 (15% O2 in the ex-
haust)/ equivalence ratiod0 Sauter mean diameter (lm)UR relative velocity of primary combustion air to the veloc-
ity of the fuelA:Fst stoichiometric air to fuel ratioQG volumetric flow rate of the primary combustion airQL volumetric flow rate of the liquid fuelVG velocity of primary combustion airVL velocity of the liquid fuelUaccuracy uncertainty due to the accuracy of instrumentUresolution uncertainty due to the resolution of instrumentUtotal total uncertainty in the instrumentmf mass fraction of the liquid component in the emulsiona vane anglelL viscosity of liquid fuel (kg/ms)lm micrometerqL density of liquid fuel (kg/m3)r surface tension of liquid fuel (kg/s2)
98 S. Bhimani et al. / Fuel 113 (2013) 97–106
Amongst the many available biofuels, biodiesel and ethanol arethe most common and widely used liquid biofuels in diesel en-gines. Straight vegetable oils (SVO) are also quite promising alter-native fuels as the energy characteristics of these oils are very closeto that of fuel oil. The use of vegetable oils (VO) as fuels has beenmainly in the form of biodiesel, blends with diesel or in their pre-heated refined form. However, very few studies involving the useof emulsified low grade alcohols in straight vegetable oils, as fuelsfor combustion have been published. Most of the published litera-ture involves the use of emulsified fuels for compression ignitiondiesel engines. In the current experimental study, methanol wasemulsified in pure canola oil in order to decrease the viscosity ofcanola oil and impart better flow properties to it at room temper-ature. The advantage of using methanol in canola oil emulsions(MCOE) is manifold. Firstly, canola oil is a sulfur free fuel and hasvery less nitrogen content. So, NOx and SOx formation should begreatly reduced due to the absence of fuel bound nitrogen and sul-fur. Unlike conventional fossil fuels, the CO2 produced during thecombustion of canola oil is recycled during the cultivation of bio-mass and as such it is a CO2 neutral fuel. Secondly, emulsionscan be used to offset the amount of time and energy typicallyneeded to produce suitable biodiesel fuels for use in boilers and en-gines. Economically, making vegetable oil (VO) based emulsionsshould be cheaper than making biodiesel because biodiesel pro-duction involves additional chemical processes after VO has beenextracted from the crop. Thirdly, emulsions containing highly vol-atile micro-methanol droplets trapped inside less volatile canolaoil should exhibit a micro-explosion effect during combustion. Ithas been reported that micro-explosions result in lower fuel emis-sion [1]. Additionally, canola oil has negligible ash content indicat-ing that it can be directly used in internal combustion engines.When used in boilers, it is almost a foul free fuel.
Many researchers [2–5] have performed combustion experi-ments of alcohol blended fuels in diesel engines and have foundthat NOx emissions and exhaust smoke levels produced from alco-
hol blended fuels is lesser as compared to pure vegetable oil anddiesel. The studies have also revealed that blended fuels lead tohigher brake specific fuel consumption (BSFC) [2–5].
While there has been extensive literature on the use of alcoholblended fuels in I.C. engines, there are very few publications aboutthe study of emulsified fuels for stationary burners. Research workdone by Krumdieck and Daily [6] indicated that 10% ethanol addi-tion to 90% pyrolysis oil (v/v) gave better atomization quality, im-proved the performance of the combustor and resulted in betterflame stability. Mafra et al. [7] tested liquefied petroleum gas ina burner equipped with an adjustable swirler. From the experi-ments, the authors [7] concluded that the highest swirl numberof 1.315 and the lowest fuel equivalence ratio of 0.61 gave minimalNO formation. Ishak and Jaafar [8] also ran combustion experi-ments with diesel fuel in a liquid fuel burner system having a ra-dial swirler. A 26% reduction in NOx emissions was achieved at60� vane angle (SN = 1.427) compared to the 10� case. CO emis-sions were reduced by 48% for a vane angle of 70�.
Houlihan [1] has given a theoretical illustration about howemulsified fuel technology can deliver ‘‘the triple-crown’’ benefitsincluding a reduction in NOx and particulate matter, better fuelefficiency and a decrease in greenhouse gases, which is a difficultundertaking when dealing with most fossil fuels. Houlihan [1]claims that all the three benefits are due to the micro-explosionphenomena. Kadota and Yamasaki [9] have indicated that theoccurrence of micro-explosions in the case of water-in-fuel emul-sions gives researchers more design flexibility in the selection offuel atomizing devices. Also, the reduction of flame temperaturedue to the amount of water present in the emulsions had a directimpact in decreasing thermal NOx. Kitamura et al. [10] and Ferran-te et al. [11] have been successful in detecting micro-explosions toa certain extent during the combustion of emulsified fuels.
The main objective of the current study is to understand theeffect of equivalence ratio, swirl number and different methanol-in-canola oil emulsions on the emissions produced during their

Table 1Ultimate analysis of pure canola oil.
Element % Weight
Carbon 80.22
S. Bhimani et al. / Fuel 113 (2013) 97–106 99
combustion. Through this study, an attempt has been made to sug-gest the use of alcohol-in-vegetable oil emulsion (AVOE) as analternate fuel in stationary burners like electric utility boilers forelectricity generation and in furnaces for heat production.
Hydrogen 10.9Oxygen 8.62Nitrogen 0.14Sulfur 0.004Water 0.115Ash 0.001HHVas received (kJ/kg) 40,175
2. Experimental materials
2.1. Fuels
One hundred percent natural canola oil of the Wesson brandand 99.99% concentrated methanol (CH3OH) were purchased andused in all the tests. A combination of Span 80 (C24H44O6) andTween 80 (C64H124O26) surfactants were used after reviewing thework done by Morais et al. [12] and Porras et al. [13] which sug-gested that a mixture of hydrophilic and hydrophobic surfactantsyields a more stable emulsion. The hydrophilic–lipophilic balance(HLB) number of Span 80 and Tween 80 were 4.3 and 15.0, respec-tively [12]. The required HLB number of canola oil was 7 [14]. Sur-factants were added to the blends in specific amounts such that theHLB of the emulsifier combination was the same as the requiredHLB of the parent (canola) oil [15]. The mathematical equations gi-ven by Mollet et al. [16] were used to calculate the mass percent-age of Span 80 (A) and Tween 80 (B) that should be added to themethanol–canola oil blend to get a HLB of 7.0 (X).
ð%ÞA ¼ ½100 � ðX�HLBBÞ�ðHLBA �HLBBÞ
ð1Þ
ð%ÞB ¼ 100� ð%ÞA ð2Þ
2.2. Emulsion preparation
The two emulsions tested in this study include:
1. 89-9 Emulsion; having 9% methanol mixed in 89% canola oilwith 2% (75% Span 80 + 25% Tween 80) surfactant (w/w).
The concentration of 89-9 emulsion on a volume basis was 9.8%methanol emulsified in 88.40% canola oil with 1.8% (75% Span80 + 25% Tween 80) surfactant (v/v).
2. 85-12.5 Emulsion; having 12.5% methanol mixed in 85% canolaoil with 2.5% (75% Span 80 + 25% Tween 80) surfactant (w/w).
The concentration of 85-12.5 emulsion on a volume basis was14.66% methanol emulsified in 83.07% canola oil with 2.27% (75%Span 80 + 25% Tween 80) surfactant (v/v).
A standard mechanical blender was used to impart the shearforce required for stable emulsion formation. First, both surfactantswere mixed with canola oil for around 2 min using the blender.Methanol was then added after the surfactants were uniformly dis-tributed in the oil. The canola oil–methanol-surfactant mixtureswere blended together for 20 and 30 min for making 89-9 and85-12.5 emulsions, respectively. This was followed by stabilityand viscosity measurements.
2.3. Fuel properties
Pure canola oil sample was sent to Hazen Research, Inc. (locatedin Golden, Colorado) for conducting ultimate analysis (UA) andbomb calorimeter tests to find the elemental composition andhigher heating value (HHV) of canola oil. Hazen Research followedASTM D3176 and ASTM D5865 standards when performing the UAand HHV tests, respectively. Table 1 presents the results of both
tests. Table 2 shows the derivation of the chemical empirical for-mula of canola oil from its elemental composition.
The chemical empirical formulas of the emulsions were calcu-lated by considering the percentage mass of each liquid (methanol,canola oil, Span 80 and Tween 80) in a 100 g of methanol–canolaoil-surfactant blend and the contribution of all liquids to the num-ber of moles of each element in the blend. Details of similar calcu-lations can be found in the standard combustion textbookauthored by Annamalai and Puri [17] and the book published byFlagan and Seinfeld [18]. Tables 3 and 4 present the empirical for-mulas of the two emulsions used in the experimental study. It isworth noting that the amount of sulfur in all the fuel blends israther insignificant.
The viscosity of all the fuels was measured at 25 �C using aBrookfield rotational type viscometer. The stability period of theemulsions was estimated by filling them in vials and visuallyinspecting them every 1 h and checking for the separation of meth-anol and oil phases. The change in viscosity of pure canola oil dueto the addition of methanol and surfactants was calculated usingthe following formula,
ð%ÞReduction in Viscosity ¼ Viscositycanola oil � Viscosityemulsion
Viscositycanola oil
� �� 100
ð3Þ
Higher heating value (HHV) of the emulsions was estimatedusing the following equation under the assumption of ideal inertfluid mixing:
HHVemulsionkJkg
� �¼ ðmf ;canola oilHHVcanola oilÞ
þ ðmf ;methanolHHVmethanolÞþ ðmf ;Span 80HHVSpan 80Þþ ðmf ;Twen 80HHVTween 80Þ ð4Þ
The properties of all the fuels are summarized in Table 5.
3. Experimental facility
All the combustion experiments were conducted in a 30 kW(100,000 Btu/h) cylindrical combustion chamber located at theCoal and Biomass Energy Laboratory at Texas A&M University, Col-lege Station as shown in Fig. 1. The combustion chamber was orig-inally built for combusting pulverized coal and blends of coal withbiomass. The details of the coal fired facility can be found in the pa-per published by Lawrence et al. [19].
The coal fired facility was modified to combust liquid fuels forthe current study. The modification mainly included the removalof an old swiler, quarl and solid fuel feeding lines and replacingthem with a new swirler and a liquid fuel injection system. A radialvane type swirler made from concentric steel cylinders and 0.5 mmthick steel vanes was installed on top of the combustion chamber.

Table 2Chemical empirical formula of canola oil.
Element Mass percentage in pure canola oil (%) Chemical empirical formula of pure canola oil
C 80.22 C6.699H10.9O0.54N0.01S0.0001
H 10.9O 8.62 Empirical formula of canola oil normalized with respect to carbonN 0.14S 0.004 CH1.631O0.081N0.002S0.0001
Table 3Chemical empirical formula of 89-9 emulsion.
Element Mass percentage in 89-9 emulsion (%) Chemical empirical formula of 89-9 emulsion
C 77.11 C6.7599H11.358O0.784N0.009S0.0001
H 10.82O 11.95 Empirical formula of 89-9 emulsion normalized with respect to carbonN 0.12S 0.003 CH1.684O0.116N0.0013S0.00001
Table 4Chemical empirical formula of 85-12.5 emulsion.
Element Mass percentage in 85-12.5 emulsion (%) Chemical empirical formula of 85-12.5 emulsion
C 76.05 C6.6482H11.329O0.8513N0.0085S0.0001
H 10.82O 13.02 Empirical formula of 85-12.5 emulsion normalized with respect to carbonN 0.114S 0.003 CH1.704O0.128N0.0012S0.00001
Table 5Properties of tested fuels.
Fuel type Normalized chemical empiricalformula
Density (g/ml) Viscosity at 25 �C (cP) Percentage reductionin viscosity (%)
Stability (h) HHV (kJ/kg) as received
Pure canola oil CH1.631O0.081N0.002S0.0001 0.96 55 – – 40,17389-9 Emulsion CH1.684O0.116N0.0013S0.00001 0.90 38.8 29.5 7 38,39685-12.5 Emulsion CH1.704O0.128N0.0012S0.00001 0.88 41.2 25.1 4 37,506
100 S. Bhimani et al. / Fuel 113 (2013) 97–106
The swirler was used with two set of vanes, each set having a totalof 8 vanes. The two set of vanes were positioned at angles of 60�and 51� with respect to the normal axis of the hub. The followingequation derived by Beer and Chigier [20] was used to calculatethe swirl number at different vane angles.
SN ¼ 23�
1� ðRhR Þ
3
1� ðRhR Þ
2
24
35 � Tan ðaÞ ð5Þ
The swirl numbers at vane angles of 60� and 51� were 1.4 and1.0, respectively. Fig. 2 shows the swirler with vanes at 60� swirlangle.
A twin fluid atomizer purchased from Bete Spray Nozzles Com-pany, USA was used to spray the viscous fuels in the combustionchamber (CC). The liquid port of the nozzle was supplied with anemulsion of canola oil, and the gas port was supplied with com-pressed air. The nozzle had an orifice diameter of 0.5 mm fromwhich the fuel–air mixture was finely sprayed in a solid cone pat-tern. The twin fluid nozzle was positioned below an aluminumcone which in-turn was placed on top the inner cylinder of theswirler (see Figs. 3a and 3b). The system was designed to ensurethat all the secondary air passed through the swirler vanes to at-tain maximum rotary motion downstream which in turn containedthe liquid mist formed by the atomizer. The nozzle was placed suchthat the tip of the nozzle was positioned approximately 5 mmabove the edge of the swirler. Thermocouples were used mainlyto determine the chamber temperature during each experiment.
3.1. Experimental procedure
All the experiments were conducted for a constant thermal out-put of 20.2 kW (69,000 BTU/h) based on the calorific value of eachfuel blend. The liquid fuels were tested at equivalence ratios
/ ¼ Mass of airstoichiometricMass of airprovided
� �of 0.83, 0.91, 1.0, 1.05 and 1.11 and swirl
numbers of 1.4 (60� vane angle) and 1.0 (51� vane angle). For allexperiments, the primary air (compressed air supplied to the noz-zle) was set at a constant flow rate of 10 liters per minute (LPM).Different equivalence ratios were obtained only by varying the sec-ondary air (air passing through the swirler) while keeping the pri-mary air and fuel flow rate constant so that the thermal outputcould be maintained constant for all the fuel blends.
The combustion chamber (CC) was preheated to a temperatureof about 800 �C by burning natural gas (NG) with secondary air.The primary air was supplied to the nozzle during the preheatingphase in order to keep the nozzle cool. Once this temperaturewas achieved, the liquid fuel pump was switched on. The flow ofNG was gradually reduced and the flow rate of liquid fuel wasgradually increased to the desired value until only canola oilblends were being combusted. The flame was visible from the sighthole located 14 cm below the nozzle tip. All the liquid fuels werefirst combusted at stoichiometric conditions, then at fuel leanand fuel rich conditions. No emission readings were taken duringthe initial 45 min of stoichiometric liquid fuel combustion. Thiswas done to ensure that the temperature inside the CC, the flameand oxygen in the exhaust reached almost stable levels. Once the

Fig. 1. 30 kW combustion chamber for liquid fuel combustion.
Fig. 2. Swirler with a vane angle of 60� (SN = 1.4).Fig. 3a. Twin fluid atomizer.
S. Bhimani et al. / Fuel 113 (2013) 97–106 101
combustion process had stabilized, two readings for flue gas com-position were taken every 5 min for each equivalence ratio. When-ever the equivalence ratio was changed, it was necessary to waitfor approximately 10–15 min in order to attain stable conditionsinside the chamber before recording the emissions in the exhaustgas.
A Greenline 8000 electrochemical gas analyzer was connectedto the combustion chamber at the last gas sampling port located1.85 m below the nozzle tip. The gas analyzer provided a digitaland printed summary for the amount of O2, CO, CO2, NO, NO2,NOx, SO2, and CxHy (UHC) present in the exhaust gases. Three waterquenching jets (located approximately 38.1 cm below the last gas
sampling ports) sprayed water inside the CC to catch the particu-lates and cooled the hot gases before the colder exhaust gases werevented out through an exhaust system.
The air and fuel flow rates and stoichiometric air to fuel ratio(A:Fst) used during the combustion experiments are summarizedin Table 6. Note that the primary air for all the experiments was10 liters per minute.
4. Experimental results and discussions
Several combustion experiments were conducted to study theeffects of fuel blending, swirl number and equivalence ratio on

Fig. 3b. Aluminum cone and nozzle placed inside the hub of the swirler.
φφ
Fig. 4. NOx emissions from pure canola oil, 89-9 emulsion and 85-12.5 emulsion atSN of 1.4 for a constant heat output of 72,750 kJ/h.
φφ
Fig. 5. NOx emissions from pure canola oil, 89-9 emulsion and 85-12.5 emulsion atSN of 1.0 for a constant heat output of 72,750 kJ/h.
102 S. Bhimani et al. / Fuel 113 (2013) 97–106
exhaust gas emissions. The emission results are reported inppmvdc unit, corrected to 15% oxygen in the exhaust. The follow-ing formula given by Annamalai and Puri [17] was used to calculatethe corrected emissions.
XNO;std
XNO¼ ðXO2;a � XO2;stdÞ
XO2;a � XO2
� �ð6Þ
4.1. NOx emissions
During the combustion of clean fuels (which do not containnitrogen compounds) with air, NOx is formed mainly due to theN2O mechanism (/ < 0.8), Thermal NOx mechanism (/ = 0.8–1.0)and Prompt NOx mechanism (/ < 1.2) [1,2]. The effects of equiva-lence ratio, swirl number and fuel type on NOx formation are dis-cussed below.
4.1.1. Effect of equivalence ratio on NOx emissionsAll the fuels tested in this study had a minimal amount of fuel
bound nitrogen and they were combusted at / > 0.8. Figs. 4 and5 present the results of NOx concentration at different equivalenceratios.
The maximum temperature recorded by the thermocouple lo-cated 4–5 cm below the flame tip was about 1000 �C for all theexperiments which can be used to suggest different NOx formationmechanisms. Figs. 4 and 5 show that more NOx was produced atstoichiometric and lean conditions. It can be suggested that the
Table 6Fuel and air flow rates used during the combustion experiments.
Fuel type Equivalence ratio (/) Fuel flow rate (m
Pure canola oil (A:Fst = 12.6) 0.83 310.91 311 311.05 311.11 31
89-9 Emulsion (A:Fst = 12.1) 0.83 350.91 351 351.05 351.11 35
85-12.5 Emulsion (A:Fst = 11.9) 0.83 370.91 371 371.05 371.11 37
presence of excess air in the combustion chamber at lean condi-tions allowed more nitrogen to react with hydrocarbon groups atthe flame front leading to the formation of NOx through the PromptNOx mechanism. Prompt mechanism is independent of tempera-ture and residence time inside the furnace. Ishak and Jaafar [8]and Daho et al. [21] observed a similar decline in NOx emissionswhen the equivalence ratio was changed from fuel lean to fuel richduring fuel oil combustion. The results shown in Figs. 4 and 5 forcanola oil blends are consistent with previous findings for otherfuels [8,21].
However, the results shown in Figs. 4 and 5 were not in totalagreement with the postulated prompt NOx mechanism, whichstates that higher NOx concentrations should be found at fuel richcondition since higher amounts of unburned hydrocarbons arepresent at this condition [17]. The relative high amount of NOx atlean conditions can be attributed firstly to temperatures estimatedto be much higher than 1000 �C within the flame core and near thefuel injector leading to NOx production not only by the prompt-mechanism route but also by the thermal NOx mechanism. It is
l/min) Secondary air required (l/min) Total air required (l/min)
356 366326 336295 305280 290265 275
394 404361 371327 337310 320293 303
383 393350 360318 328301 311285 295
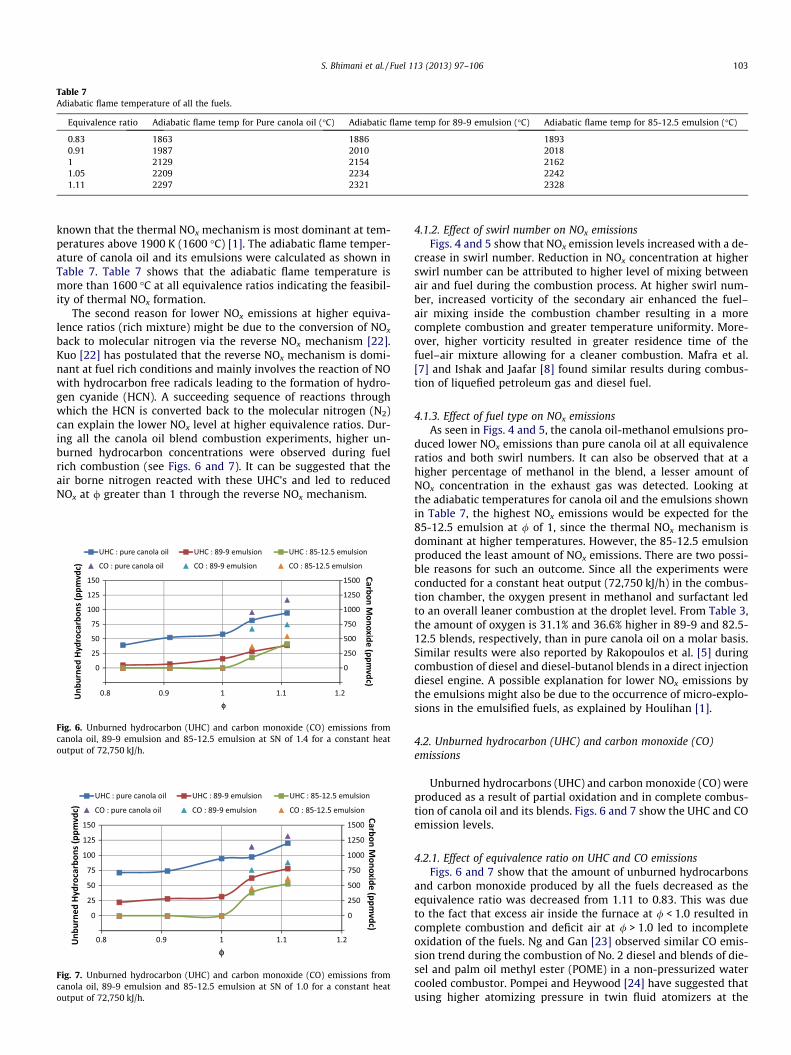
Table 7Adiabatic flame temperature of all the fuels.
Equivalence ratio Adiabatic flame temp for Pure canola oil (�C) Adiabatic flame temp for 89-9 emulsion (�C) Adiabatic flame temp for 85-12.5 emulsion (�C)
0.83 1863 1886 18930.91 1987 2010 20181 2129 2154 21621.05 2209 2234 22421.11 2297 2321 2328
S. Bhimani et al. / Fuel 113 (2013) 97–106 103
known that the thermal NOx mechanism is most dominant at tem-peratures above 1900 K (1600 �C) [1]. The adiabatic flame temper-ature of canola oil and its emulsions were calculated as shown inTable 7. Table 7 shows that the adiabatic flame temperature ismore than 1600 �C at all equivalence ratios indicating the feasibil-ity of thermal NOx formation.
The second reason for lower NOx emissions at higher equiva-lence ratios (rich mixture) might be due to the conversion of NOx
back to molecular nitrogen via the reverse NOx mechanism [22].Kuo [22] has postulated that the reverse NOx mechanism is domi-nant at fuel rich conditions and mainly involves the reaction of NOwith hydrocarbon free radicals leading to the formation of hydro-gen cyanide (HCN). A succeeding sequence of reactions throughwhich the HCN is converted back to the molecular nitrogen (N2)can explain the lower NOx level at higher equivalence ratios. Dur-ing all the canola oil blend combustion experiments, higher un-burned hydrocarbon concentrations were observed during fuelrich combustion (see Figs. 6 and 7). It can be suggested that theair borne nitrogen reacted with these UHC’s and led to reducedNOx at / greater than 1 through the reverse NOx mechanism.
φφ
Fig. 6. Unburned hydrocarbon (UHC) and carbon monoxide (CO) emissions fromcanola oil, 89-9 emulsion and 85-12.5 emulsion at SN of 1.4 for a constant heatoutput of 72,750 kJ/h.
φφ
Fig. 7. Unburned hydrocarbon (UHC) and carbon monoxide (CO) emissions fromcanola oil, 89-9 emulsion and 85-12.5 emulsion at SN of 1.0 for a constant heatoutput of 72,750 kJ/h.
4.1.2. Effect of swirl number on NOx emissionsFigs. 4 and 5 show that NOx emission levels increased with a de-
crease in swirl number. Reduction in NOx concentration at higherswirl number can be attributed to higher level of mixing betweenair and fuel during the combustion process. At higher swirl num-ber, increased vorticity of the secondary air enhanced the fuel–air mixing inside the combustion chamber resulting in a morecomplete combustion and greater temperature uniformity. More-over, higher vorticity resulted in greater residence time of thefuel–air mixture allowing for a cleaner combustion. Mafra et al.[7] and Ishak and Jaafar [8] found similar results during combus-tion of liquefied petroleum gas and diesel fuel.
4.1.3. Effect of fuel type on NOx emissionsAs seen in Figs. 4 and 5, the canola oil-methanol emulsions pro-
duced lower NOx emissions than pure canola oil at all equivalenceratios and both swirl numbers. It can also be observed that at ahigher percentage of methanol in the blend, a lesser amount ofNOx concentration in the exhaust gas was detected. Looking atthe adiabatic temperatures for canola oil and the emulsions shownin Table 7, the highest NOx emissions would be expected for the85-12.5 emulsion at / of 1, since the thermal NOx mechanism isdominant at higher temperatures. However, the 85-12.5 emulsionproduced the least amount of NOx emissions. There are two possi-ble reasons for such an outcome. Since all the experiments wereconducted for a constant heat output (72,750 kJ/h) in the combus-tion chamber, the oxygen present in methanol and surfactant ledto an overall leaner combustion at the droplet level. From Table 3,the amount of oxygen is 31.1% and 36.6% higher in 89-9 and 82.5-12.5 blends, respectively, than in pure canola oil on a molar basis.Similar results were also reported by Rakopoulos et al. [5] duringcombustion of diesel and diesel-butanol blends in a direct injectiondiesel engine. A possible explanation for lower NOx emissions bythe emulsions might also be due to the occurrence of micro-explo-sions in the emulsified fuels, as explained by Houlihan [1].
4.2. Unburned hydrocarbon (UHC) and carbon monoxide (CO)emissions
Unburned hydrocarbons (UHC) and carbon monoxide (CO) wereproduced as a result of partial oxidation and in complete combus-tion of canola oil and its blends. Figs. 6 and 7 show the UHC and COemission levels.
4.2.1. Effect of equivalence ratio on UHC and CO emissionsFigs. 6 and 7 show that the amount of unburned hydrocarbons
and carbon monoxide produced by all the fuels decreased as theequivalence ratio was decreased from 1.11 to 0.83. This was dueto the fact that excess air inside the furnace at / < 1.0 resulted incomplete combustion and deficit air at / > 1.0 led to incompleteoxidation of the fuels. Ng and Gan [23] observed similar CO emis-sion trend during the combustion of No. 2 diesel and blends of die-sel and palm oil methyl ester (POME) in a non-pressurized watercooled combustor. Pompei and Heywood [24] have suggested thatusing higher atomizing pressure in twin fluid atomizers at the

φφ
Fig. 9. CO2 emissions from pure canola oil, 89-9 emulsion and 85-12.5 emulsion atSN of 1.0 for a constant heat output of 72,750 kJ/h.
104 S. Bhimani et al. / Fuel 113 (2013) 97–106
same equivalence ratio can help reduce CO emissions to a largeextent.
4.2.2. Effect of swirl number on UHC and CO emissionsBy comparing Figs. 6 and 7, it is seen that the UHC and CO emis-
sion levels were inversely related to swirl number. All the fuelsshowed a reduction in UHC and CO concentrations when the swirlnumber was increased from a SN of 1.0 to 1.4. This effect can beattributed to the enhanced fuel–air mixing at a 60� vane angleresulting in a more complete combustion process. Moreover, thehigher vorticity imparted to the secondary air at higher vane an-gles increased the residence time and level of mixing of the air–fuelmixture leading to reduced emissions.
4.2.3. Effect of fuel type on UHC and CO emissionsFrom Figs. 6 and 7, it is seen that the emulsions produced lesser
UHC and CO emissions than pure canola oil at all combustion con-ditions and both swirl angles. The mixing of methanol (CH3OH) andsurfactants in canola oil resulted in emulsions having more fuelbound oxygen on a molar basis than pure canola oil. This additionalamount of fuel-bound oxygen helped minimize the formation oflocal fuel rich zones inside the flame resulting in efficient combus-tion of the emulsions as compared to canola oil as seen in similarstudies [5].
4.3. Carbon dioxide (CO2) emissions
The carbon dioxide (%) produced during the combustion of purecanola oil and its blends with methanol are presented in Figs. 8 and9.
4.3.1. Effect of equivalence ratio on CO2 emissionsFigs. 8 and 9 show that the peak of CO2 formation for all the
fuels was at the stoichiometric condition. On the lean side (/< 1), the excess amount of air, diluted the carbon dioxide insidethe furnace. When the fuels were burned at rich conditions (/> 1), the lack of sufficient amount of oxygen prevented the com-plete oxidation of carbon to carbon dioxide, which also resultedin greater levels of unburned hydrocarbons.
4.3.2. Effect of swirl number on CO2 emissionsFigs. 8 and 9 show that CO2 production by all the fuels was pro-
portional to the swirl number. Comparing the performance of eachfuel at / of 0.83, it is seen that CO2 production for all the fuels in-creased when the swirl number was increased from 1.0 to 1.4. Thisresult was as expected because the amount of unburned hydrocar-bons emissions decreased at higher swirl number (see Figs. 6 and7). The secondary air induced higher vorticity at a vane angle of60� as compared to that at 51�. Due to the higher amount of turbu-lence, the fuel and air were mixed much better and the residence
φφ
Fig. 8. CO2 emissions from pure canola oil, 89-9 emulsion and 85-12.5 emulsion atSN of 1.4 for a constant heat output of 72,750 kJ/h.
time of this mixture was also slightly increased. These two effectstogether gave higher CO2 production for all the fuels at a SN of 1.4.
4.3.3. Effect of fuel type on CO2 emissionsFigs. 8 and 9 show that both emulsions produced more CO2 than
pure canola oil at fuel lean combustion conditions under the sameheat throughput (20.2 kW). The same trend was seen during fuelrich combustion except for few coinciding points representing sim-ilar CO2 values. From Figs. 8 and 9, it can also be noticed that the85-12.5 emulsion produced higher concentrations of CO2 at allequivalence ratios as compared to canola oil and 89-9 emulsion.This was because the 85-12.5 emulsion had the highest quantityof fuel-bound oxygen, which helped minimize the formation of lo-cal fuel rich zones inside the combustion chamber resulting in anoverall leaner and efficient combustion process.
5. Uncertainty analysis
Kegel [25] defines uncertainty as an estimate of the intervalbounding the measured value within which the true value lies. Ta-ble 8 lists all the instruments used in the study and their uncer-tainty parameters taken from the equipment’s manuals. Theformula for calculating the total instrument uncertainty has beentaken from Lawrence [19] and is shown below.
Utotal ¼ffiffiffiffiffiffiffiffiffiffiffiffiffiffiffiffiffiffiffiffiffiffiffiffiffiffiffiffiffiffiffiffiffiffiffiffiffiffiffiffiffiffiffiffiffiffiffiffiffiðU2
accuracyÞ þ ðU2resolutionÞ
qð7Þ
6. Droplet size calculation
Fuel sprays contain droplets within a certain range of sizes. In or-der to estimate the droplet size distribution, a mean or averagediameter calculation can be helpful especially in applications likecombustion where there is continuous heat and mass transfer be-tween dispersed liquid and surrounding oxidizing gases. The mostimportant size variable for combustion applications is the Sautermean diameter. Sauter mean diameter (SMD) is defined as the diam-eter of that droplet whose volume to surface ratio value is the sameas the arithmetic mean of volume to surface values on the total num-ber of drops belonging to the spray under examination [26].
Nozzles have different design and construction, and so variouscorrelations for SMD have been proposed for each type of design.For twin fluid atomizers, the correlation proposed by Nukiyamaand Tanasawa [27] is used routinely to estimate SMD. The follow-ing equation proposed by Nukiyama and Tanasawa [27] was usedto calculate the Sauter mean diameter of droplets of canola and itscorresponding emulsions in this study.
d0 ¼0:585
UR
� �� r
qL
� �0:5
þ 1:415 � 106 � lLffiffiffiffiffiffiffiffiffirqL
p !0:45
Q L
Q G
� �1:5
ð8Þ

Table 8Instrument uncertainty.
Instrument Accuracy Units Resolution Units Total instrument uncertainty
Primary air flow meter ±1 l/min 0.1 l/min 1 l/minSecondary air flow meter ±15 l/min 1 l/min 15 l/minFuel flow meter ±0.5 l/h 0.5 l/h 0.7 l/hViscometer ±1 % 0.1 cP 0.1 cPO2 analyzer ±0.1 % 0.1 % Variesa
CO2 analyzer ±3 % 0.01 % Variesa
CO analyzer ±4 % 1 ppmvd Variesa
NOx analyzer ±4 ppmvd 1 ppmvd 4 ppmvdCxHy analyzer ±10 ppmvd 1 ppmvd 10 ppmvd
a Depends on amount of oxygen present in the exhaust, which dictates the accuracy of the emission within its corresponding range.
Table 9SMD values for droplets of canola oil and its emulsions.
Fuel type r (kg/s2) qL (kg/m3) QL (m3/s) QG (m3/s) Nozzle orifice area (m2) VL (m/s) VG (m/s) UR lL (kg/m s) SMD (lm)
Canola oil 0.03 962 5.3E�07 1.7E�04 2E�07 2.7 852 318 0.05 32.489-9 Emulsion 0.026 890 5.9E�07 1.7E�04 2E�07 3.0 852 284 0.04 33.785-12.5 Emulsion 0.026 880 6.1E�07 1.7E�04 2E�07 3.1 852 274 0.04 35.8
S. Bhimani et al. / Fuel 113 (2013) 97–106 105
The surface tension of canola oil has been taken from the workpublished by Shu et al. [28]. The surface tension of the emulsionswas estimated using the equation by considering the mass fractionof canola oil and methanol in the blend. Since, Span 80 and Tween80 were added in very small amounts to the emulsions, their con-tribution to the surface tension was not taken into account.
remulsion ¼ ðmf ;canola oil � rcanola oilÞ þ ðmf ;methanol � rmethanolÞ ð9Þ
Table 9 lists the experimental parameters used to calculate theSMD of fuel droplets. Broniarz-Press et al. [29] studied theatomization of water-in-mineral oil emulsions and found that thevalues of SMD increased with an increase in emulsion viscosityand the amount of oil in the blends. From Table 9, it is seen thateven though the emulsions have lesser oil content and lesserviscosity than pure canola oil, they still have slightly higherSMD values. This might be due to the higher volumetric flowrates used when combusting the emulsions in the chamber.Also, precise measurements of the surface tension of bothemulsions might help in getting more accurate SMD values ofemulsion droplets.
7. Conclusions
A comprehensive extended experimental investigation wasconducted to understand the influence of equivalence ratio, swirlnumber and fuel type on the emissions produced during the com-bustion of pure canola oil and its blended emulsions with metha-nol. Methanol was added to canola oil mainly to reduce theviscosity of pure canola oil and to impart better flow propertiesat room temperature. The results of the present study may be sum-marized as follows:
1. Viscosity of pure canola oil was influenced by the amount ofmethanol and surfactant added to it. The viscosity of 89-9 and85-12.5 emulsions was less than the viscosity of pure canolaoil by 29.4% and 25.1%, respectively. Since the 85-12.5 emulsionhad a higher percentage of surfactant, it had a slightly greaterviscosity than the 89-9 emulsion. Overall, addition of methanolto canola oil led to reduced viscosity of the blends.
2. Stability of the emulsions was inversely proportional to theamount of methanol added to the blend. The 89-9 emulsionwas more stable than the 85-12.5 emulsion.
3. The heating value of emulsions decreased with the amount ofmethanol present in the blends. The HHV of 89-9 emulsionand 85-12.5 emulsion was less than the HHV of pure canolaoil by 4.4% and 6.6%, respectively. The reduction was due tothe relatively low HHV of methanol.
4. From the experimental results, it was revealed that the swirlnumber and fuel-type had a significant influence on the exhaustemissions produced by canola oil and its blended emulsions. Allthe fuels produced lesser NOx, UHC and CO emissions at a SN of1.4 than at a SN of 1.0. Higher CO2 concentrations were alsoobserved at a SN of 1.4. The higher vorticity imparted to the sec-ondary air at a swirl number of 1.4 helped improve the mixingof fuel and secondary air in a way that resulted in a more effi-cient combustion process.
5. Even though canola oil and its emulsions were all combusted ata constant thermal output of 72,750 kJ/h (69,000 Btu/h), pollu-tant levels were affected by the amount of methanol presentin the blends. In general, higher the methanol content in theblend led to lower emissions. The 85-12.5 emulsion producedthe lowest NOx, UHC and CO emissions and the highest CO2 con-centration at a swirl number of 1.4. This result can be attributedto an overall leaner combustion of the fuel due to the presenceof methanol and surfactant bound oxygen. The higher degree offuel and air mixing at a higher swirl angle also contributed to amore complete combustion.
6. It was observed that even though the emulsions had lesser oilcontent and lesser viscosity than pure canola oil, they hadslightly higher SMD values. This might be due to the higher vol-umetric flow rates when combusting the emulsions. Precisemeasurements of surface tension of both emulsions shouldresults in a more accurate approximation of SMD values ofthe emulsion droplets.
In summary, the combination of a swirl number of 1.4 and addi-tion of 12.5% methanol (w/w) to pure canola oil proved to give theleast NOx, CO and UHC emissions and the highest CO2 levels.
Acknowledgements
The authors would like to thank Ben Lawrence and UlyssesFranca for their invaluable help in the hardware modification ofthe combustion chamber and assistance during the combustionexperiments.
106 S. Bhimani et al. / Fuel 113 (2013) 97–106
References
[1] Houlihan T. The triple crown. Power Eng 2009:44.[2] Yoshimoto Y, Onodera M, Tamaki H. Performance and emission characteristics
of diesel engines fueled by vegetable oils. SAE; 2001.[3] Yoshimoto Y, Onodera M. Performance of a diesel engine fueled by rapeseed oil
blended with oxygenated organic compounds. SAE; 2002.[4] Ziejewski M, Goettler H, Pratt GL. Comparative analysis of the long-term
performance of a diesel engine on vegetable oil based alternate fuels. SAE;1986.
[5] Rakopoulos DC, Rakopoulos CD, Giakoumis EG, Dimaratos AM, Kyritsis DC.Effects of butanol-diesel fuel blends on the performance and emissionsof a high-speed DI diesel engine. Energy Convers Manage 2010;51:1989–97.
[6] Krumdieck SP, Daily JW. Evaluating the feasibility of biomass pyrolysisoil for spray combustion applications. Combust Sci Technol 1998;134:351–65.
[7] Mafra MR, Fassani FL, Zanoelo EF, Bizzo WA. Influence of swirl number and fuelequivalence ratio on NO emission in an experimental LPG-fired chamber. ApplTherm Eng 2010;30:928–34.
[8] Ishak MSA, Jaafar MNM. The effect of swirl number on reducing emissionsfrom liquid fuel burner system. J Mech 2005;19:48–56.
[9] Kadota T, Yamasaki H. Recent advances in the combustion of water fuelemulsion. Progress Energy Combust 2002;28:385–404.
[10] Kitamura Y, Huang Q, Oka Y, Takahashi T. Flashing of superheated water-in-oilemulsions. J Chem Eng Jpn 1990;23:711–5.
[11] Ferrante L, Miccio M, Miccio F, Solimene R. Fluidized bed combustion of liquidbiofuels: application of integrated diagnostics for micro-explosionscharacterization. Energy Fuel 2008;22:4213–22.
[12] de Morais JM, Henrique dos Santos OD, Delicato T, Azzini Goncalves R, Alves daRocha-Filho P. Physicochemical characterization of canola oil/water nano-emulsions obtained by determination of required HLB number and emulsionphase inversion methods. J Disper Sci Technol 2006;27:109–15.
[13] Porras M, Solans C, Gonzalez C, Gutierrez J. Properties of water-in-oil (W/O)nanoemulsion prepared by a low-energy emulsifiaction method. Colloids SurfA 2008;324:181–8.
[14] http://www.theherbarie.com/files/resource-center/formulating/Required_HLB_for_Oils_and_Lipids.pdf [30.09.12].
[15] Marszal L. HLB of nonionic surfactants: PIT and EPI methods. Nonionicsurfactants. Phys Chem 1987:493–547.
[16] Mollet H, Grubenmann A. Formulation technology – emulsions, suspensions,solid forms. Germany: Wiley-VCH; 2001.
[17] Annamalai K, Puri IK. Combustion science and engineering. 2nd ed. Taylor andFrancis Group; 2007.
[18] Flagan RC, Seinfeld JH. Fundamentals of air pollution engineering. NewJersey: Prentice Hall; 1988.
[19] Lawrence B, Cofiring of coal and dairy biomass in a 100,000 BTU/hr furnace.Master’s thesis. In: Mechanical Engineering Department, Texas A&MUniversity, College Station; 2007.
[20] Beer JM, Chigier NA. Combustion aerodynamics. New York: John Wiley andSons Inc.; 1972.
[21] Daho T, Vaitilingom G, Sanogo O. Optimization of the combustion of blends ofdomestic fuel oil and cottonseed oil in a non-modified domestic boiler. Fuel2009;88:1261–8.
[22] Kuo KK. Principles of combustion. 2nd ed. Hoboken: John Wiley and Sons Inc.;2005.
[23] Ng HK, Gan S. Combustion performance and exhaust emissions from the non-pressurised combustion of palm oil biodiesel blends. Appl Therm Eng 2010;30:2476–84.
[24] Pompei F, Heywood JB. The role of mixing in burner-generated carbonmonoxide and nitric oxide. Combust Flame 1972;19:407–18.
[25] Kegel TM, Basic measurement uncertainty. In: 71st International School ofHydrocarbon Measurement, Oklahoma City, OK; 1996.
[26] Chigier NA. The atomization and burning of liquid fuel sprays. Progress EnergyCombust Sci 1976:2.
[27] Nukiyama S, Tanasawa Y. Experiments on the atomization of liquids in anairstream. Jpn Soc Mech Eng 1939;5:68–75.
[28] Shu Q, Wang J, Peng B, Wang D, Wang G. Predicting the surface tension ofbiodiesel fuels by a mixture topological index method, at 313 K. Fuel2008;87:3586–90.
[29] Broniarz-Press L, Ochowiak M, Rozanski J, Woziwodzki S. The atomization ofwater–oil emulsions. Exp Therm Fluid Sci 2009;33:955–62.