employer health benefit survey release slides tuesday, august 20, 2013
TRANSCRIPT
Employer Health Benefit Survey
Release SlidesTuesday, August 20, 2013
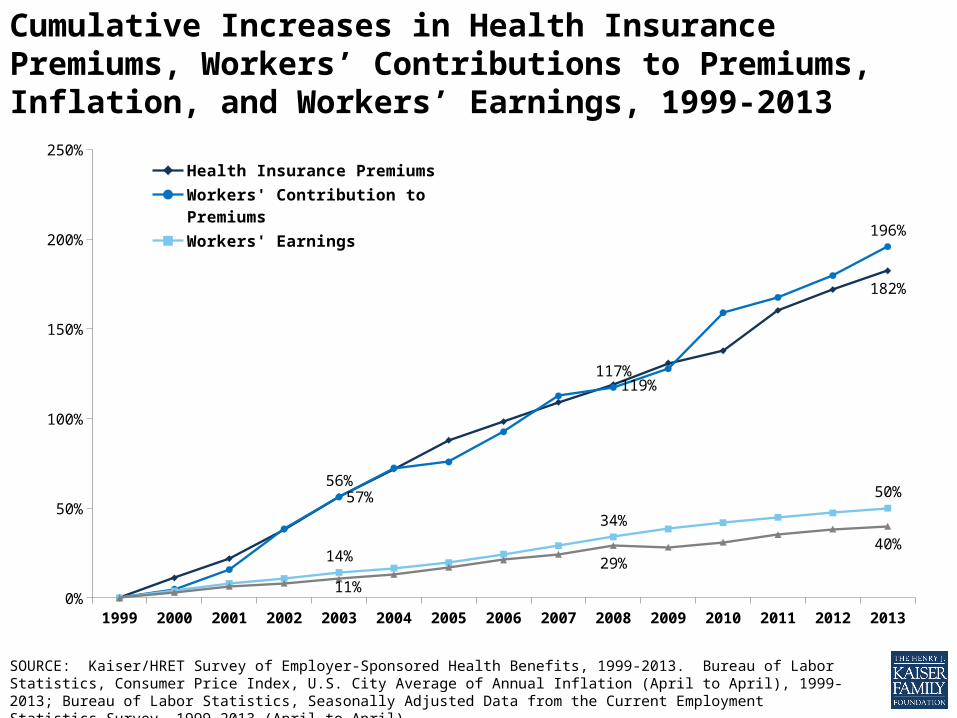
Cumulative Increases in Health Insurance Premiums, Workers’ Contributions to Premiums, Inflation, and Workers’ Earnings, 1999-2013
1999 2000 2001 2002 2003 2004 2005 2006 2007 2008 2009 2010 2011 2012 20130%
50%
100%
150%
200%
250%
57%
119%
182%
56%
117%
196%
14%
34%
50%
11%
29%40%
Health Insurance PremiumsWorkers' Contribution to PremiumsWorkers' EarningsOverall Inflation
SOURCE: Kaiser/HRET Survey of Employer-Sponsored Health Benefits, 1999-2013. Bureau of Labor Statistics, Consumer Price Index, U.S. City Average of Annual Inflation (April to April), 1999-2013; Bureau of Labor Statistics, Seasonally Adjusted Data from the Current Employment Statistics Survey, 1999-2013 (April to April).
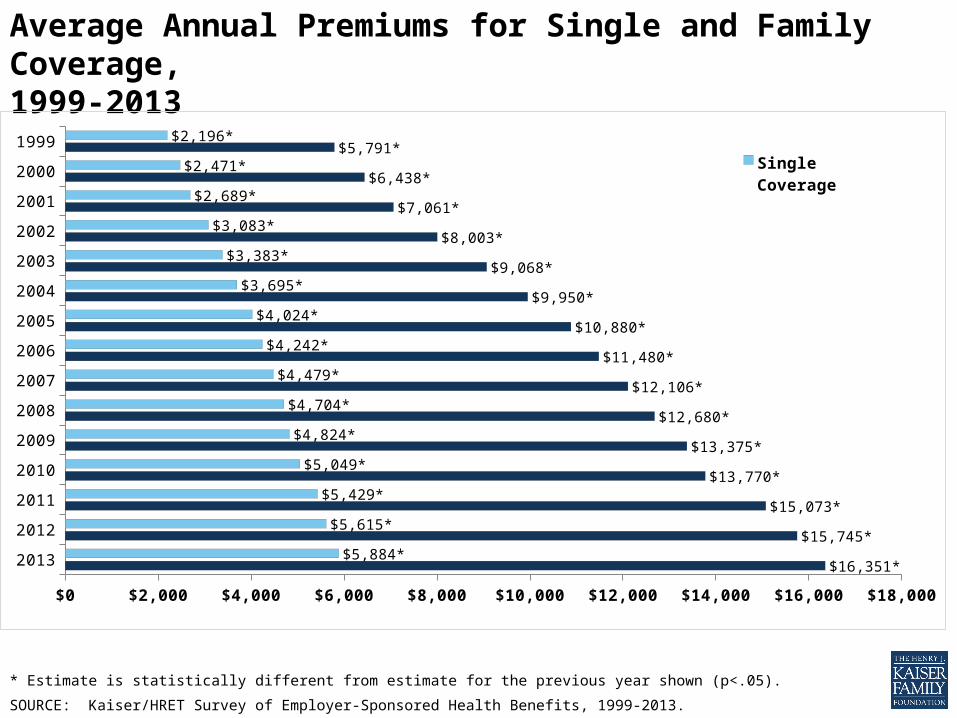
* Estimate is statistically different from estimate for the previous year shown (p<.05).
SOURCE: Kaiser/HRET Survey of Employer-Sponsored Health Benefits, 1999-2013.
Average Annual Premiums for Single and Family Coverage, 1999-2013
2013
2012
2011
2010
2009
2008
2007
2006
2005
2004
2003
2002
2001
2000
1999
$0 $2,000 $4,000 $6,000 $8,000 $10,000 $12,000 $14,000 $16,000 $18,000
$16,351*
$15,745*
$15,073*
$13,770*
$13,375*
$12,680*
$12,106*
$11,480*
$10,880*
$9,950*
$9,068*
$8,003*
$7,061*
$6,438*
$5,791*
$5,884*
$5,615*
$5,429*
$5,049*
$4,824*
$4,704*
$4,479*
$4,242*
$4,024*
$3,695*
$3,383*
$3,083*
$2,689*
$2,471*
$2,196*
Single CoverageFamily Coverage

Premium Worker Contribution* Premium* Worker Contribution*$0
$2,000
$4,000
$6,000
$8,000
$10,000
$12,000
$14,000
$16,000
$18,000
$5,711
$862
$15,581
$5,284$5,967
$1,065
$16,715
$4,226
All Small Firms (3-199 Workers)All Large Firms (200 or More Workers)
Single Coverage Family Coverage
Average Annual Worker Premium Contributions and Total Premiums for Covered Workers, Single and Family Coverage, by Firm Size, 2013
* Estimates are statistically different between All Small Firms and All Large Firms (p<.05).
SOURCE: Kaiser/HRET Survey of Employer-Sponsored Health Benefits, 2013.
Man
y W
orke
rs a
re
Low
er-W
age
Man
y W
orke
rs a
re
Hig
her-
Wag
e
Family Coverage
$0
$2,000
$4,000
$6,000
$8,000
$10,000
$12,000
$14,000
$16,000
$18,000
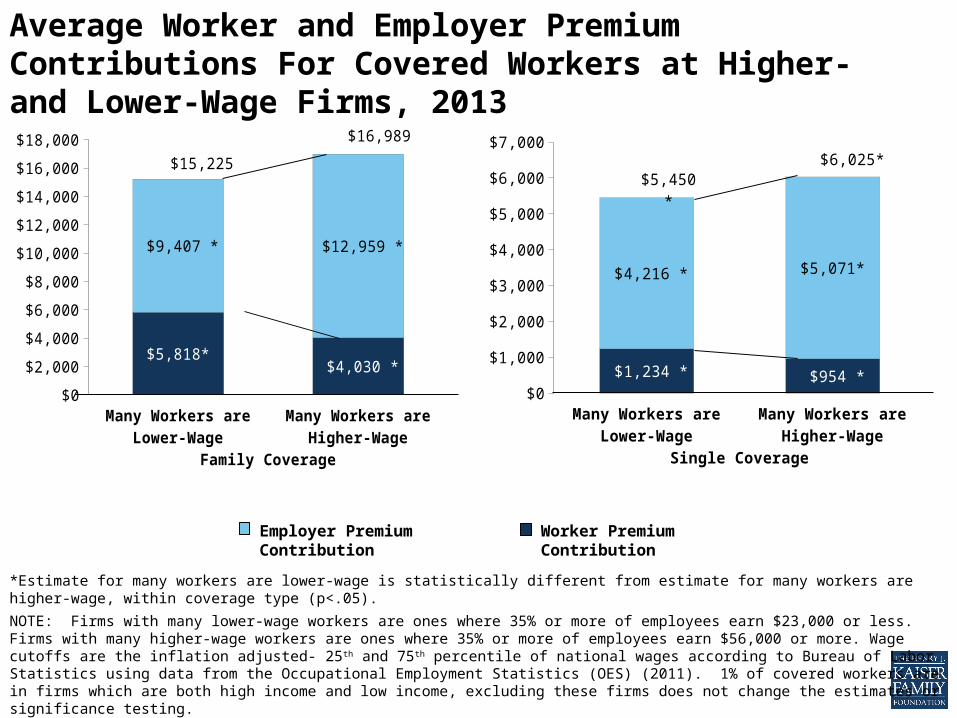
$5,818* $4,030 *
$9,407 * $12,959 *
$15,225
$16,989
Average Worker and Employer Premium Contributions For Covered Workers at Higher- and Lower-Wage Firms, 2013
*Estimate for many workers are lower-wage is statistically different from estimate for many workers are higher-wage, within coverage type (p<.05).
NOTE: Firms with many lower-wage workers are ones where 35% or more of employees earn $23,000 or less. Firms with many higher-wage workers are ones where 35% or more of employees earn $56,000 or more. Wage cutoffs are the inflation adjusted- 25 th and 75th percentile of national wages according to Bureau of Labor Statistics using data from the Occupational Employment Statistics (OES) (2011). 1% of covered workers are in firms which are both high income and low income, excluding these firms does not change the estimates or significance testing.
SOURCE: Kaiser/HRET Survey of Employer-Sponsored Health Benefits, 2013. National Compensation Survey: Occupational Earnings in theUnited States, 2010. http://www.bls.gov/ncs/ocs/sp/nctb1489.pdf.
Man
y W
orke
rs a
re
Low
er-W
age
Man
y W
orke
rs a
re
Hig
her-
Wag
e
Single Coverage
$0
$1,000
$2,000
$3,000
$4,000
$5,000
$6,000
$7,000
$1,234 * $954 *
$4,216 * $5,071*
$5,450 *$6,025*
Worker Premium ContributionEmployer Premium Contribution
1999 2000 2001 2002 2003 2004 2005 2006 2007 2008 2009 2010 2011 2012 20130%
10%
20%
30%
40%
50%
60%
70%
80%
90%
100%
66%68% 68% 66% 66%
63%60% 61% 59%
63%59%
69%*
60%* 61%57%
55% 57% 58% 58%55%
52%47% 49%
45%50%
47%
59%*
48%* 50%45%
All FirmsFirms with 3-9 Workers
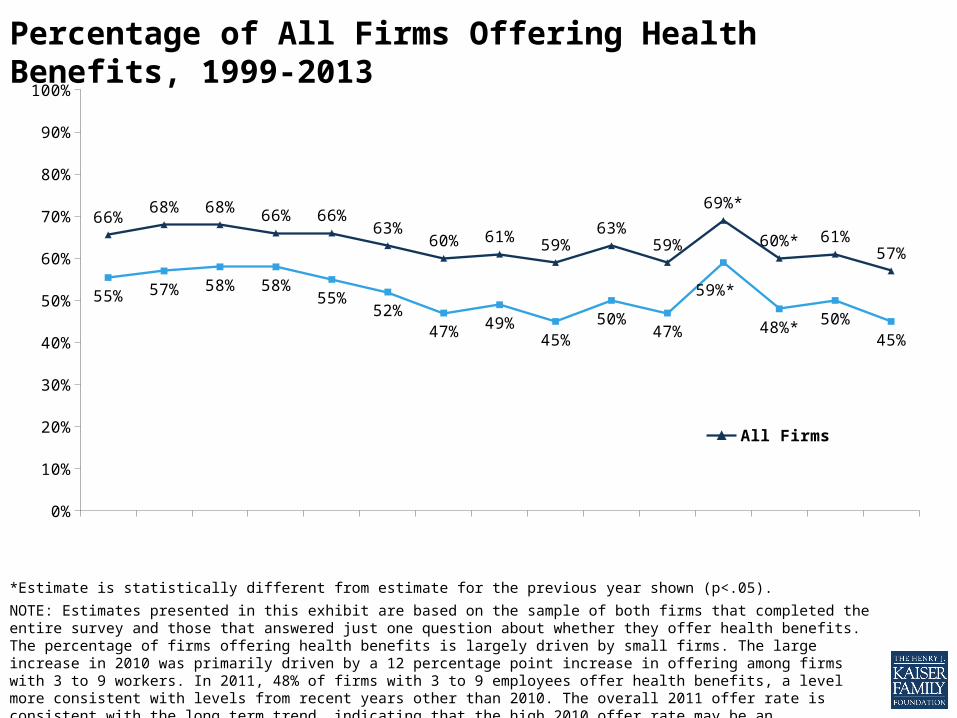
Percentage of All Firms Offering Health Benefits, 1999-2013
*Estimate is statistically different from estimate for the previous year shown (p<.05).
NOTE: Estimates presented in this exhibit are based on the sample of both firms that completed the entire survey and those that answered just one question about whether they offer health benefits. The percentage of firms offering health benefits is largely driven by small firms. The large increase in 2010 was primarily driven by a 12 percentage point increase in offering among firms with 3 to 9 workers. In 2011, 48% of firms with 3 to 9 employees offer health benefits, a level more consistent with levels from recent years other than 2010. The overall 2011 offer rate is consistent with the long term trend, indicating that the high 2010 offer rate may be an aberration.
SOURCE: Kaiser/HRET Survey of Employer-Sponsored Health Benefits, 1999-2013.

93%
7%
SOURCE: Kaiser/HRET Survey of Employer-Sponsored Health Benefits, 2013.
Among Firms with 50 or More Workers, Percent of Firms Offering Health Benefits, 2013
Percent of Firms Offering Health Benefits
Percent of Firms that Do Not Offer Health Benefits
60%
23%
49%
69%
59%
23%
51%
58%
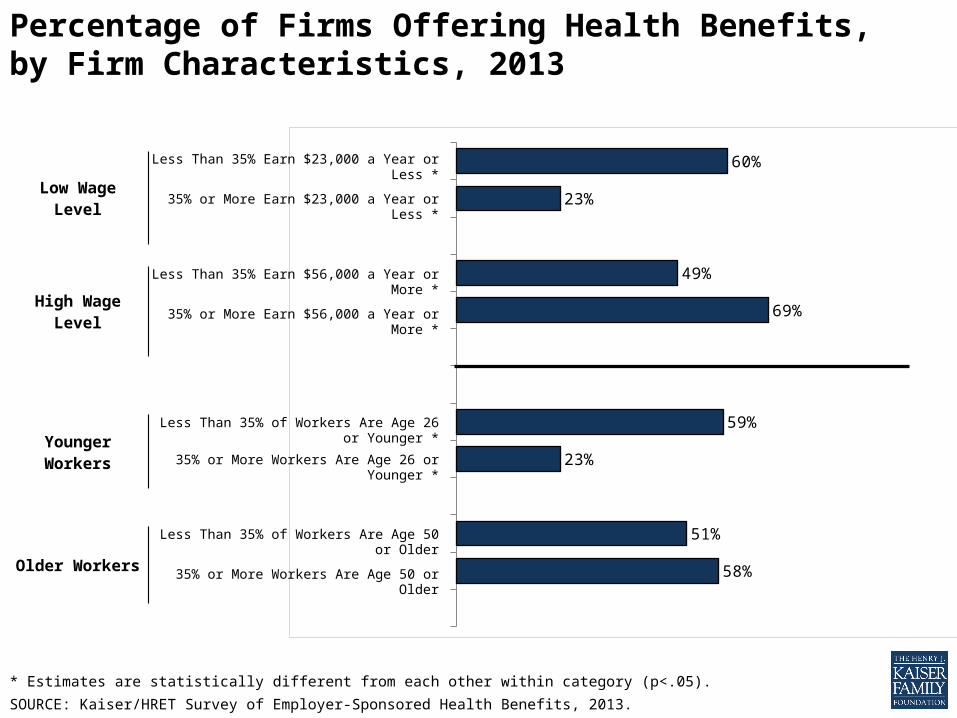
* Estimates are statistically different from each other within category (p<.05).
SOURCE: Kaiser/HRET Survey of Employer-Sponsored Health Benefits, 2013.
Percentage of Firms Offering Health Benefits, by Firm Characteristics, 2013
Low Wage Level
Less Than 35% Earn $23,000 a Year or Less *
35% or More Earn $23,000 a Year or Less *
High Wage Level
Less Than 35% Earn $56,000 a Year or More *
35% or More Earn $56,000 a Year or More *
Younger Workers
Less Than 35% of Workers Are Age 26 or Younger *
35% or More Workers Are Age 26 or Younger *
Older Workers
Less Than 35% of Workers Are Age 50 or Older
35% or More Workers Are Age 50 or Older
2013
2012
2011
2010
2009
2008
2007
2006
2005
2004
2003
2002
2001
2000
1999
1996
1993
1988
<1%
<1%
1%
1%
1%
2%
3%
3%
3%
5%
5%
4%
7%
8%
10%
27%
46%
73%
14%
16%
17%
19%
20%
20%
21%
20%
21%
25%
24%
27%
24%
29%
28%
31%
21%
16%
57%
56%
55%
58%
60%
58%
57%
60%
61%
55%
54%
52%
46%
42%
39%
28%
26%
11%
9%
9%
10%
8%
10%
12%
13%
13%
15%
15%
17%
18%
23%
21%
24%
14%
7%
20%
19%
17%
13%
8%
8%
5%
4%
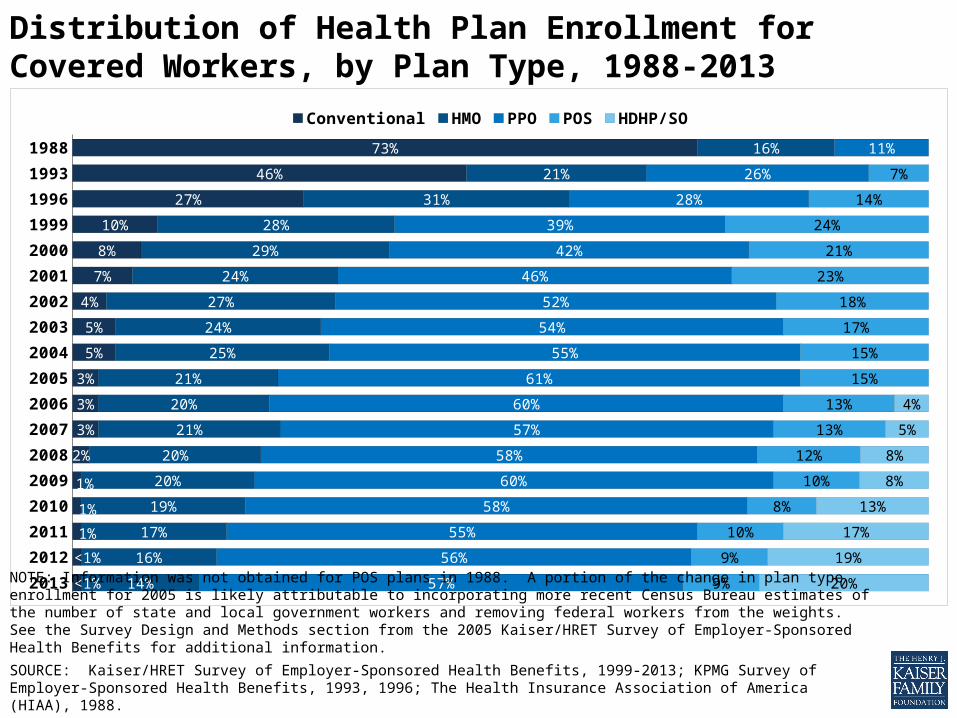
Conventional HMO PPO POS HDHP/SO
NOTE: Information was not obtained for POS plans in 1988. A portion of the change in plan type enrollment for 2005 is likely attributable to incorporating more recent Census Bureau estimates of the number of state and local government workers and removing federal workers from the weights. See the Survey Design and Methods section from the 2005 Kaiser/HRET Survey of Employer-Sponsored Health Benefits for additional information.
SOURCE: Kaiser/HRET Survey of Employer-Sponsored Health Benefits, 1999-2013; KPMG Survey of Employer-Sponsored Health Benefits, 1993, 1996; The Health Insurance Association of America (HIAA), 1988.
Distribution of Health Plan Enrollment for Covered Workers, by Plan Type, 1988-2013
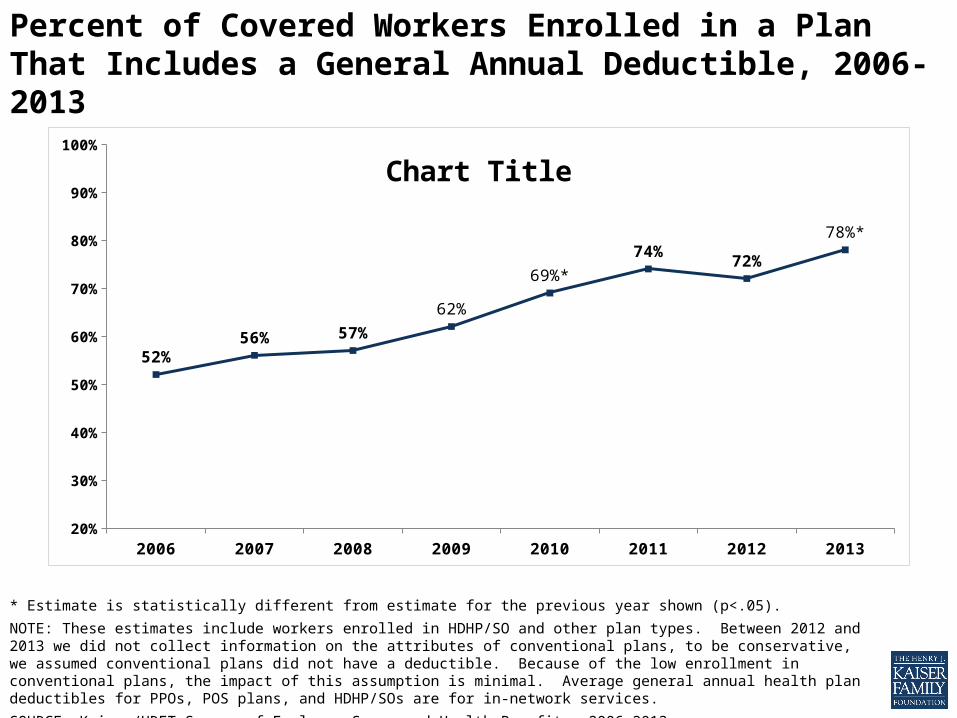
Percent of Covered Workers Enrolled in a Plan That Includes a General Annual Deductible, 2006-2013
2006 2007 2008 2009 2010 2011 2012 201320%
30%
40%
50%
60%
70%
80%
90%
100%
52%56% 57%
62%
69%*74% 72%
78%*
Chart Title
* Estimate is statistically different from estimate for the previous year shown (p<.05).
NOTE: These estimates include workers enrolled in HDHP/SO and other plan types. Between 2012 and 2013 we did not collect information on the attributes of conventional plans, to be conservative, we assumed conventional plans did not have a deductible. Because of the low enrollment in conventional plans, the impact of this assumption is minimal. Average general annual health plan deductibles for PPOs, POS plans, and HDHP/SOs are for in-network services.
SOURCE: Kaiser/HRET Survey of Employer-Sponsored Health Benefits, 2006-2013.
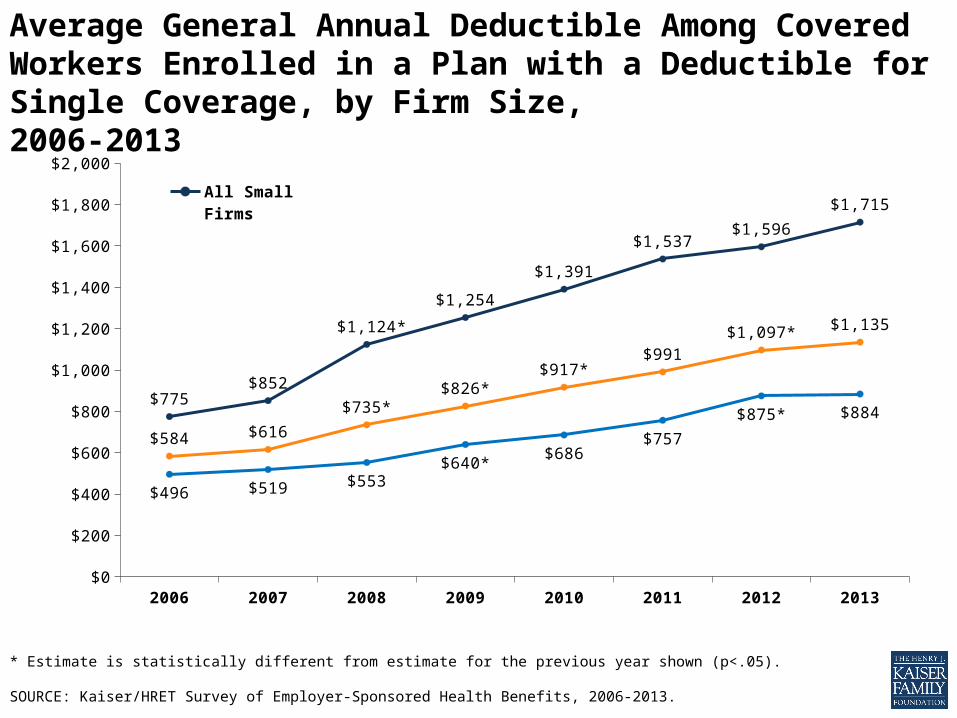
2006 2007 2008 2009 2010 2011 2012 2013$0
$200
$400
$600
$800
$1,000
$1,200
$1,400
$1,600
$1,800
$2,000
$775 $852
$1,124*
$1,254
$1,391
$1,537 $1,596
$1,715
$496 $519 $553 $640* $686
$757
$875* $884
$584 $616
$735* $826*
$917* $991
$1,097* $1,135
All Small FirmsAll Large FirmsAll Firms
Average General Annual Deductible Among Covered Workers Enrolled in a Plan with a Deductible for Single Coverage, by Firm Size, 2006-2013
* Estimate is statistically different from estimate for the previous year shown (p<.05).
SOURCE: Kaiser/HRET Survey of Employer-Sponsored Health Benefits, 2006-2013.
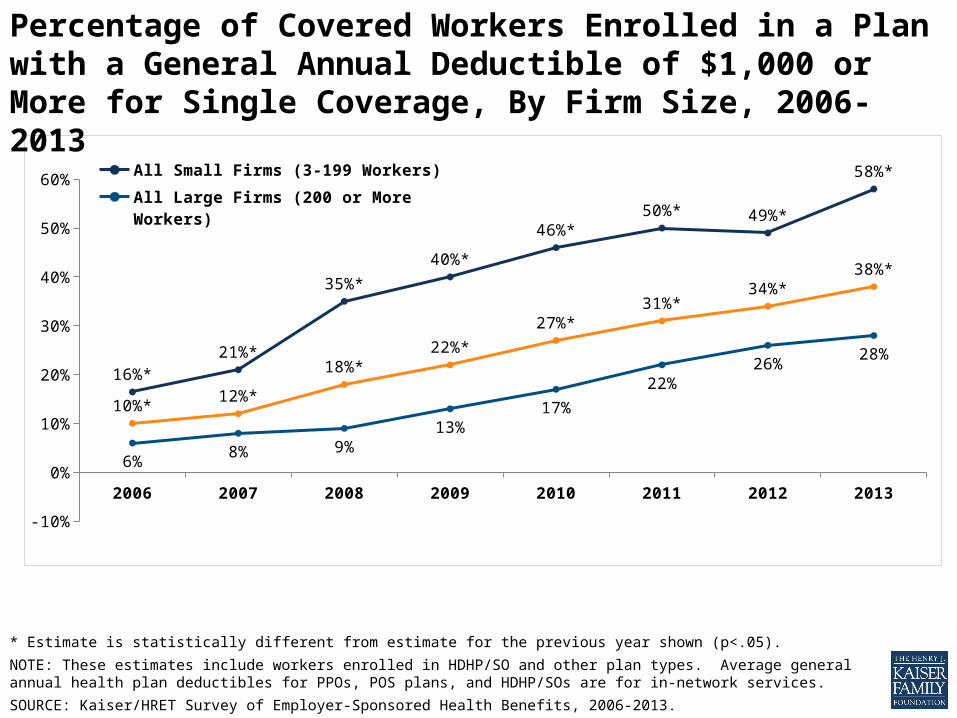
2006 2007 2008 2009 2010 2011 2012 2013
-10%
0%
10%
20%
30%
40%
50%
60%
16%*21%*
35%*
40%*
46%*50%* 49%*
58%*
6%8% 9%
13%17%
22%26%
28%
10%* 12%*
18%*22%*
27%*31%*
34%*38%*
All Small Firms (3-199 Workers)All Large Firms (200 or More Workers)All Firms
* Estimate is statistically different from estimate for the previous year shown (p<.05).
NOTE: These estimates include workers enrolled in HDHP/SO and other plan types. Average general annual health plan deductibles for PPOs, POS plans, and HDHP/SOs are for in-network services.
SOURCE: Kaiser/HRET Survey of Employer-Sponsored Health Benefits, 2006-2013.
Percentage of Covered Workers Enrolled in a Plan with a General Annual Deductible of $1,000 or More for Single Coverage, By Firm Size, 2006-2013
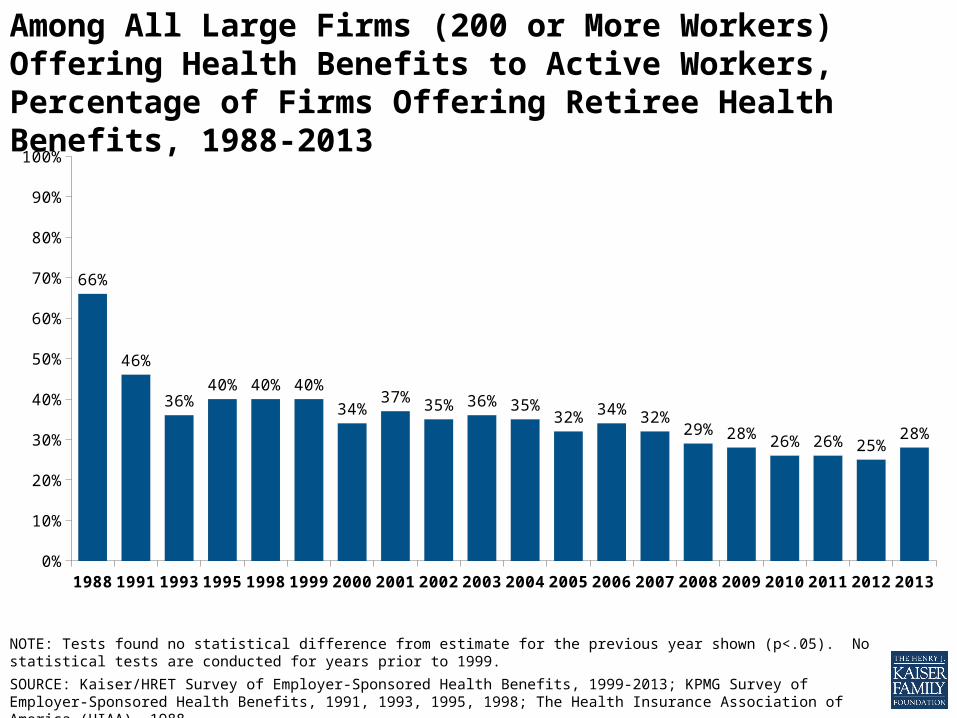
Among All Large Firms (200 or More Workers) Offering Health Benefits to Active Workers, Percentage of Firms Offering Retiree Health Benefits, 1988-2013
1988 1991 1993 1995 1998 1999 2000 2001 2002 2003 2004 2005 2006 2007 2008 2009 2010 2011 2012 20130%
10%
20%
30%
40%
50%
60%
70%
80%
90%
100%
66%
46%
36%40% 40% 40%
34%37% 35% 36% 35%
32% 34% 32%29% 28% 26% 26% 25%
28%
NOTE: Tests found no statistical difference from estimate for the previous year shown (p<.05). No statistical tests are conducted for years prior to 1999.
SOURCE: Kaiser/HRET Survey of Employer-Sponsored Health Benefits, 1999-2013; KPMG Survey of Employer-Sponsored Health Benefits, 1991, 1993, 1995, 1998; The Health Insurance Association of America (HIAA), 1988.
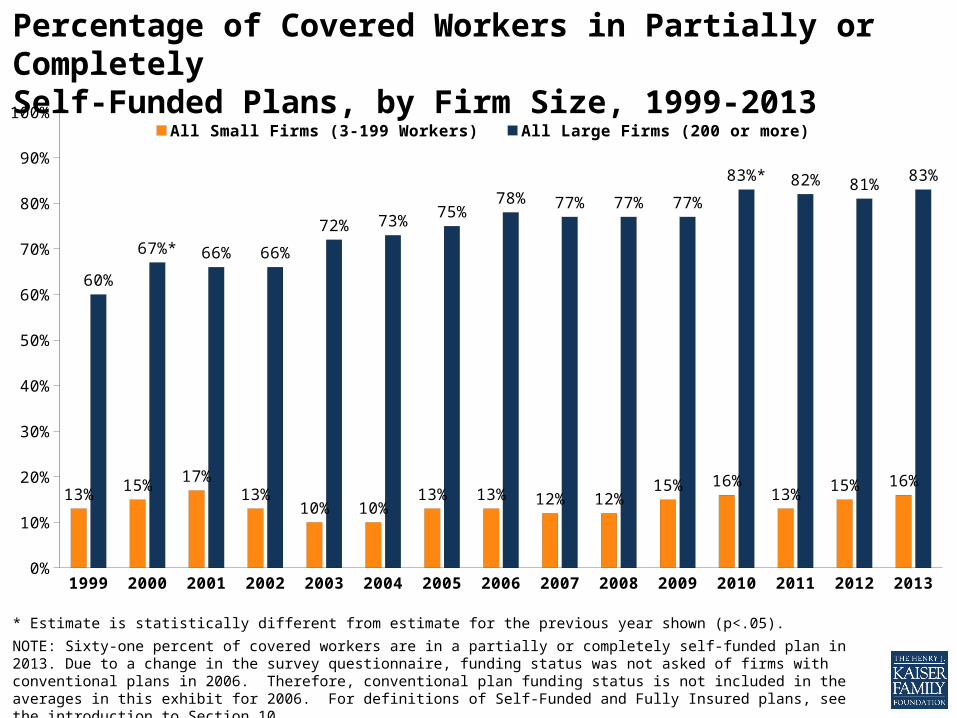
Percentage of Covered Workers in Partially or Completely Self-Funded Plans, by Firm Size, 1999-2013
1999 2000 2001 2002 2003 2004 2005 2006 2007 2008 2009 2010 2011 2012 20130%
10%
20%
30%
40%
50%
60%
70%
80%
90%
100%
13% 15% 17%13%
10% 10%13% 13% 12% 12%
15% 16%13% 15% 16%
60%
67%* 66% 66%
72% 73% 75%78% 77% 77% 77%
83%* 82% 81% 83%
All Small Firms (3-199 Workers) All Large Firms (200 or more)
* Estimate is statistically different from estimate for the previous year shown (p<.05).
NOTE: Sixty-one percent of covered workers are in a partially or completely self-funded plan in 2013. Due to a change in the survey questionnaire, funding status was not asked of firms with conventional plans in 2006. Therefore, conventional plan funding status is not included in the averages in this exhibit for 2006. For definitions of Self-Funded and Fully Insured plans, see the introduction to Section 10.
SOURCE: Kaiser/HRET Survey of Employer-Sponsored Health Benefits, 1999-2013.
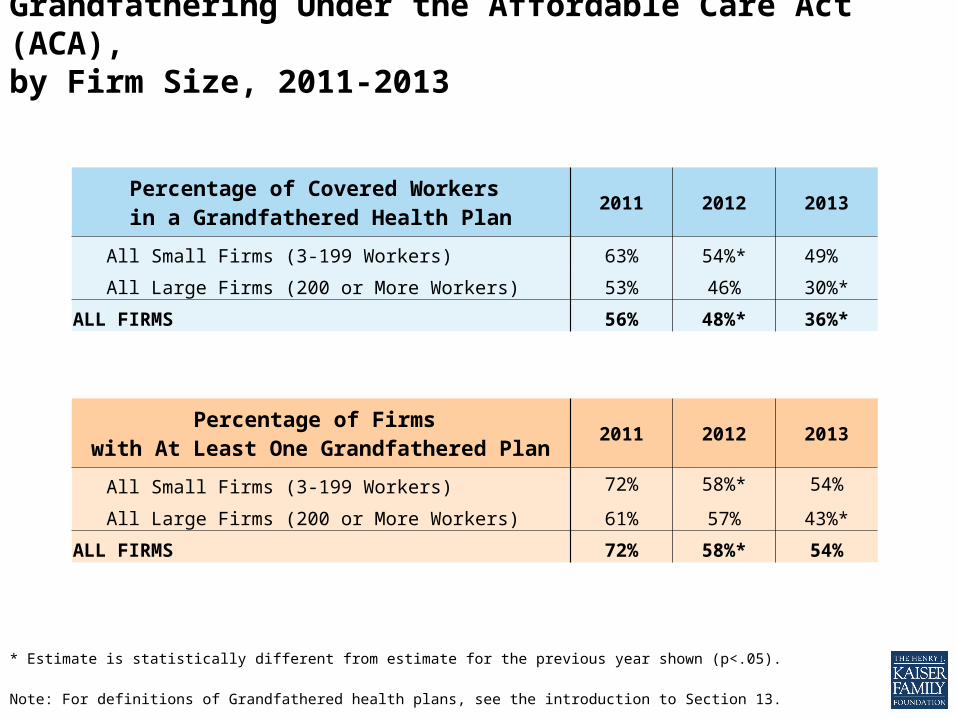
Grandfathering Under the Affordable Care Act (ACA), by Firm Size, 2011-2013
Percentage of Covered Workers in a Grandfathered Health Plan 2011 2012 2013
All Small Firms (3-199 Workers) 63% 54%* 49%
All Large Firms (200 or More Workers) 53% 46% 30%*
ALL FIRMS 56% 48%* 36%*
Percentage of Firms with At Least One Grandfathered Plan 2011 2012 2013
All Small Firms (3-199 Workers) 72% 58%* 54%
All Large Firms (200 or More Workers) 61% 57% 43%*
ALL FIRMS 72% 58%* 54%
* Estimate is statistically different from estimate for the previous year shown (p<.05).
Note: For definitions of Grandfathered health plans, see the introduction to Section 13.
Source: Kaiser/HRET Survey of Employer-Sponsored Health Benefits, 2011-2013.

Among Firms Offering Health Benefits, Distribution of Firms’ Opinions on the Effectiveness of the Following Strategies to Contain Health Insurance Costs, 2013
SOURCE: Kaiser/HRET Survey of Employer-Sponsored Health Benefits, 2013.
0%
20%
40%
60%
80%
100%
1% 4% 2% 4% 4%9%
14% 15%20% 24%
24%21%
29%26%
27%
32%
41% 32%33%
37%
35%
20% 22% 17%8%
Don’t Know Not At All Effective Not Too Effective Somewhat Effective Very Effective
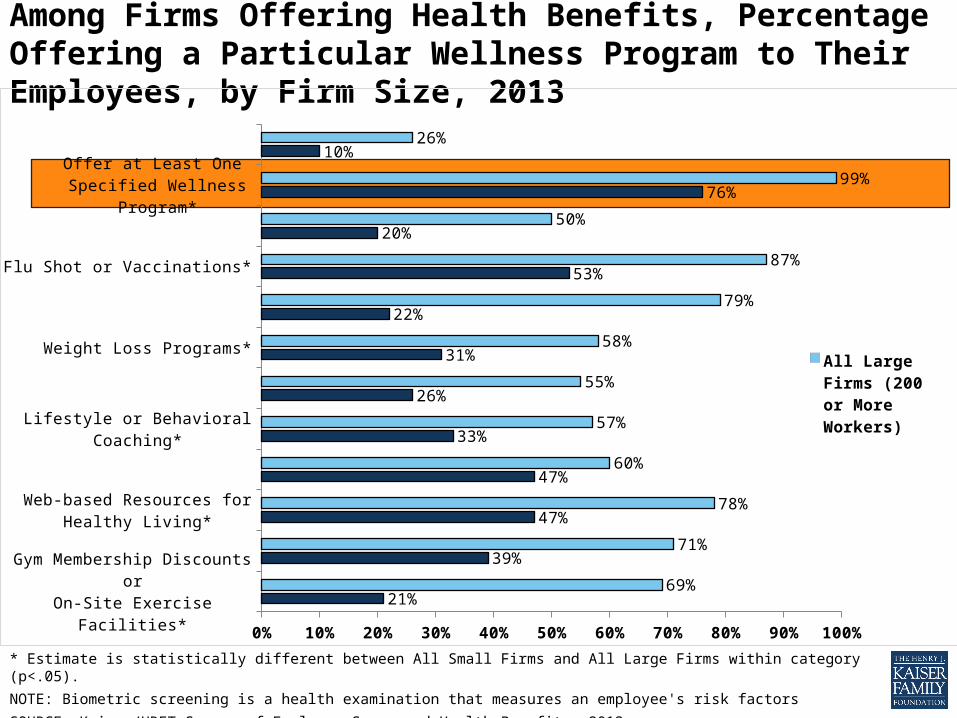
Among Firms Offering Health Benefits, Percentage Offering a Particular Wellness Program to Their Employees, by Firm Size, 2013
* Estimate is statistically different between All Small Firms and All Large Firms within category (p<.05).
NOTE: Biometric screening is a health examination that measures an employee's risk factors
SOURCE: Kaiser/HRET Survey of Employer-Sponsored Health Benefits, 2013.
Gym Membership Discounts orOn-Site Exercise Facilities*
Smoking Cessation Program*
Web-based Resources for Healthy Living*
Wellness Newsletter*
Lifestyle or Behavioral Coaching*
Biometric Screening*
Weight Loss Programs*
Employee Assistance Program (EAP)*
Flu Shot or Vaccinations*
Class in Nutrition/Healthy Living*
Offer at Least One Specified Wellness Program*
Other Wellness Program*
0% 10% 20% 30% 40% 50% 60% 70% 80% 90% 100%
21%
39%
47%
47%
33%
26%
31%
22%
53%
20%
76%
10%
69%
71%
78%
60%
57%
55%
58%
79%
87%
50%
99%
26%
All Large Firms (200 or More Workers)
All Small Firms (3-199 Workers)

Among Firms Offering Health Benefits, The Use of Financial Incentives for Participating in Various Health Programs, by Firm Size, 2013
Offers at least one Wellness Program~
Offers at least one Disease Management Program Biometric Screening``
Opportunity for Health Risk Assessment‡
0%
20%
40%
60%
80%
100% 99%
77%
55% 55%
76%
57%
26% 23%
77%
57%
27% 24%
36%
8% 11%
54%
8%2%
10%2%
Large Firms (200 or more Workers)Small Firms (3-199 Workers)All Firms
Offers Incentives to
employees who participate*
Offers reward or penalties for em-
ployees who meet biometric out-
come*
Offers In-centive to complete*
*Percent of firms offering incentives is among firms offering health benefits who also offer the specified health program or activity.
~ Includes the following wellness programs: weight loss programs, biometric screenings, gym membership discounts or on-site exercise facilities, smoking cessation program, lifestyle or behavioral coaching, classes in nutrition or healthy living, web-based resources for healthy living, flu shots or vaccinations, or employee assistance programs (EAP) or a wellness newsletter.
^Among Firms Offering Health and Wellness Benefits. Any financial incentive indicates firms that offer employees who participate in wellness programs one of the following incentives: smaller premium contributions, smaller deductibles, higher HRA or HSA contributions, or gift cards, travel, merchandise, or cash.
``Biometric screening is a health examination that measures an employee's risk factors such as cholesterol, blood pressure, stress, and nutrition.‡ A health risk assessment includes questions about medical history, health status, and lifestyle and is designed to identify the health risks of the person being assessed.
SOURCE: Kaiser/HRET Survey of Employer-Sponsored Health Benefits, 2013.
Percentage of Offering
Firms
Percentage of Offering
Firms
Percentage of Offering
Firms
Percentage of Offering
Firms
Offers Incentive to Employees
who Participate*^
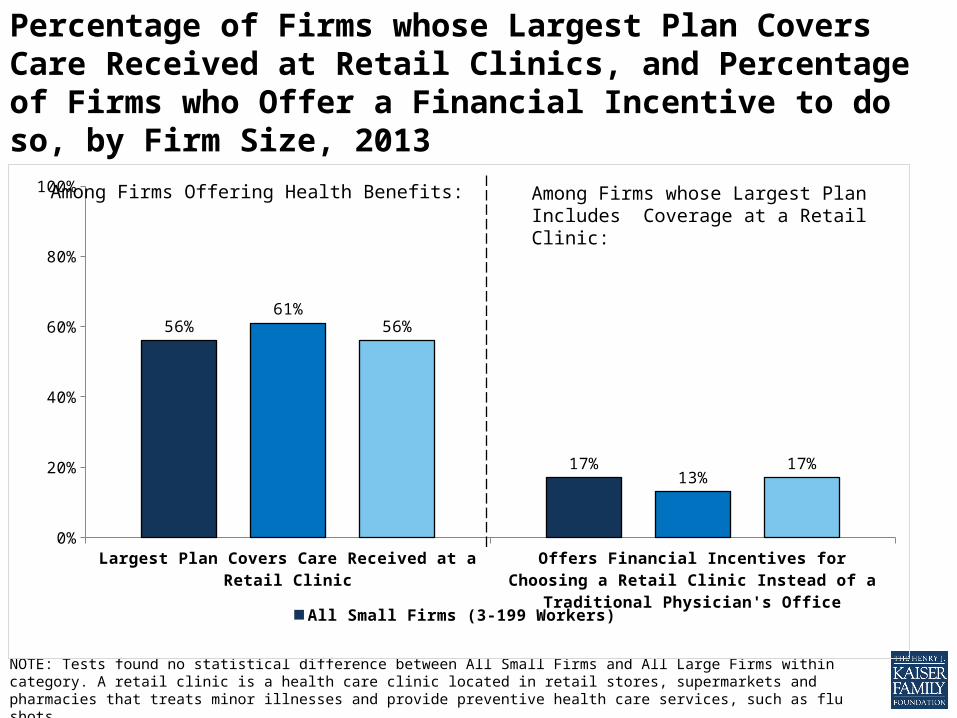
Percentage of Firms whose Largest Plan Covers Care Received at Retail Clinics, and Percentage of Firms who Offer a Financial Incentive to do so, by Firm Size, 2013
NOTE: Tests found no statistical difference between All Small Firms and All Large Firms within category. A retail clinic is a health care clinic located in retail stores, supermarkets and pharmacies that treats minor illnesses and provide preventive health care services, such as flu shots.
SOURCE: Kaiser/HRET Survey of Employer-Sponsored Health Benefits, 2013.
Largest Plan Covers Care Received at a Retail Clinic Offers Financial Incentives for Choosing a Retail Clinic Instead of a Traditional Physician's Office
0%
20%
40%
60%
80%
100%
56%
17%
61%
13%
56%
17%
All Small Firms (3-199 Workers) All Large Firms (200 or More Workers) ALL FIRMS
Among Firms Offering Health Benefits: Among Firms whose Largest Plan Includes Coverage at a Retail Clinic:
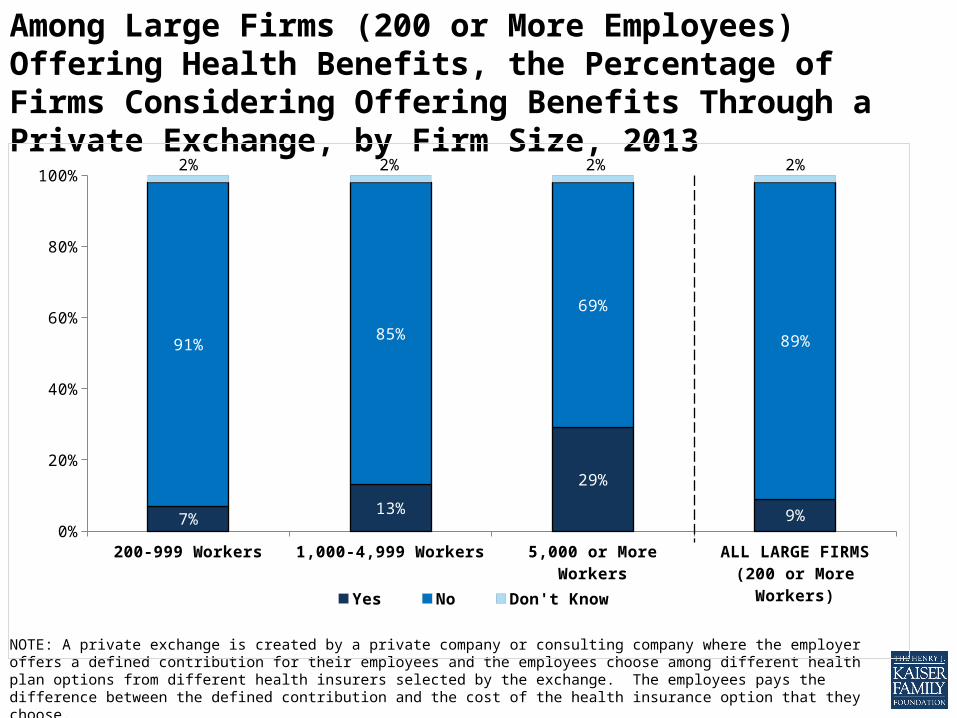
Among Large Firms (200 or More Employees) Offering Health Benefits, the Percentage of Firms Considering Offering Benefits Through a Private Exchange, by Firm Size, 2013
NOTE: A private exchange is created by a private company or consulting company where the employer offers a defined contribution for their employees and the employees choose among different health plan options from different health insurers selected by the exchange. The employees pays the difference between the defined contribution and the cost of the health insurance option that they choose.
SOURCE: Kaiser/HRET Survey of Employer-Sponsored Health Benefits, 2013.
200-999 Workers 1,000-4,999 Workers 5,000 or More Workers ALL LARGE FIRMS (200 or More Workers)
0%
20%
40%
60%
80%
100%
7%13%
29%
9%
91%85%
69%
89%
2% 2% 2% 2%
Yes No Don't Know
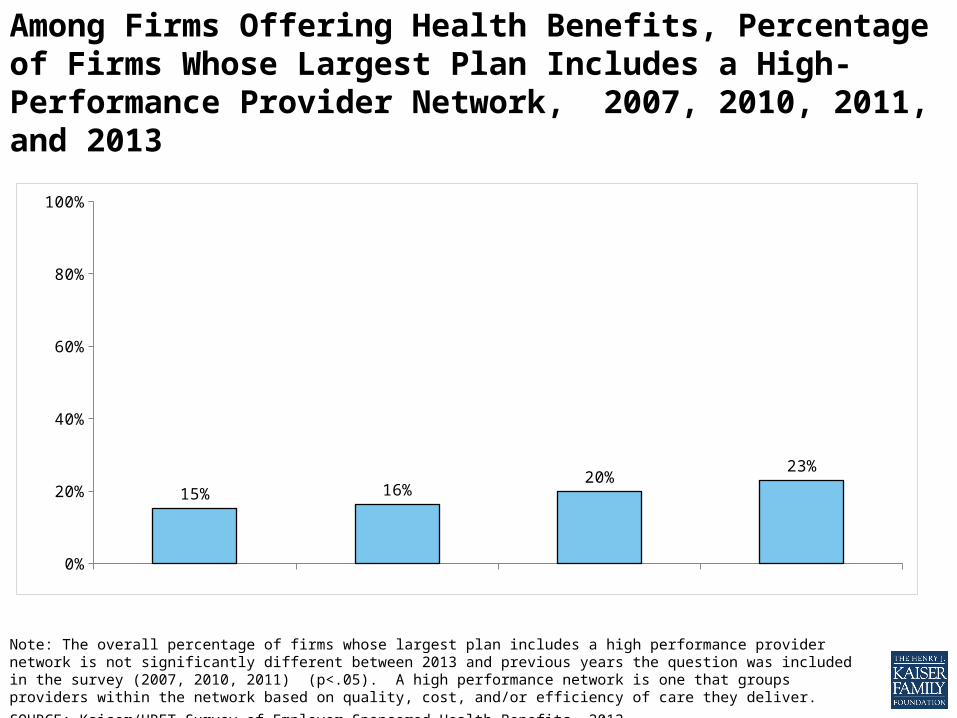
Among Firms Offering Health Benefits, Percentage of Firms Whose Largest Plan Includes a High-Performance Provider Network, 2007, 2010, 2011, and 2013
Note: The overall percentage of firms whose largest plan includes a high performance provider network is not significantly different between 2013 and previous years the question was included in the survey (2007, 2010, 2011) (p<.05). A high performance network is one that groups providers within the network based on quality, cost, and/or efficiency of care they deliver.
SOURCE: Kaiser/HRET Survey of Employer-Sponsored Health Benefits, 2013.
2007 2010 2011 20130%
20%
40%
60%
80%
100%
15% 16%20%
23%
