emulsion processing with a rotating
TRANSCRIPT

Research Collection
Doctoral Thesis
Emulsion processing with a rotating membrane (ROME)
Author(s): Eisner, Verena
Publication Date: 2007
Permanent Link: https://doi.org/10.3929/ethz-a-005460221
Rights / License: In Copyright - Non-Commercial Use Permitted
This page was generated automatically upon download from the ETH Zurich Research Collection. For moreinformation please consult the Terms of use.
ETH Library

Dissertation ETH number 17153
Emulsion Processing with a RotatingMembrane (ROME)
A dissertation submitted to
ETH Zurich
for the degree of
Doctor of Sciences (Dr. sc. ETH Zürich)
presented by
Verena Eisner
Dipl.-Ing. University of Karlsruhe (TH)
born 1st May 1978
citizen of Germany
accepted on the recommendation of
Prof. Dr.-Ing. Erich J. Windhab, examiner
Prof. Dr. Edmundo Brito de la Fucnte, co-examiner
2007

Copyright (g) 2007 Verena Eisner
Laboratory of Food Process Engineering (ETH Zurich)All rights reserved.
Emulsion Processing with a Rotating Membrane (ROME)
ISBN: 978-3-905609-33-9
Food Process Engineering series no. 29
Published and distributed by:
Laboratory of Food Process EngineeringInstitute of Food Science and Nutrition
Swiss Federal Institute of Technology (ETH) Zurich
ETH Zentrum, LFO
8092 Zurich
Switzerland
http ://www.ilw.agrl.ethz.ch/vt/
Printed in Switzerland by:
ETH Reprozcntrale HönggcrbcrgHTL C45
8093 Zurich
Switzerland

Je planmässiger die Menschen vorgehen, desto wirksamer
trifft sie der Zufall.
Friedrich Dürrenmatt

Seite Leer /
BD\i
lank 1*2«-j
iv

Acknowledgements
Bei meiner Suche nach einem interessanten Thema für eine Doktorarbeit hat mir
ein Professor Folgendes zu bedenken gegeben: Die Zeit der Promotion ist nicht
alleine eine Zeit des Arbeitens und Forschens. Sie ist weit mehr als das. Es ist ei¬
ne der schönsten Zeiten überhaupt, in der Freundschaften fürs Leben geschlossen
werden, gemeinsame Unternehmungen sehr wichtig sind und die eigene Persön¬
lichkeit weiter entwickelt und geprägt wird - vorausgesetzt man ist selbst bereit
dazu sich darauf einzulassen.
In diesem Sinne mochte ich meinen Dank an die vielen Menschen aussprechen,die alle auf ihre Weise diese Phase meines Lebens bereichert und zum Gelingen
dieser Arbeit beigetragen haben:
Mein erster Dank gilt meinem Doktorvater, Prof. Dr.-Ing. Erich J. Windhab.
Er wusste immer genau manchmal besser als ich selbst - wieviel er mir zutrauen
und zumuten konnte. Er Hess mir den nötigen Freiraum, um gedanklich und ex¬
perimentell kreativ zu sein ohne mir seine Unterstützung zu verwehren, wenn ich
darum bat. Sein Vertrauen in mich und meine Arbeit, das auch durch die Distanz
bis in die Niederlande nicht erschüttert werden konnte, ehrt mich besonders.
I wish to express my gratitude to Prof. Dr. Edmundo Brito de la Fuente for
taking over the co-examination of my thesis. It was a great pleasure for mc to
meet him in the last time of my PhD work in Zurich. His invitation to Fresenius
Kabi in Bad Homburg after I already left to the Netherlands motivated me a lot.
Special thanks for the fruit- and helpful discussions during that day.Ein ganz besonders grosser Dank gehört dem Team des Laboratoriums für Le¬
bensmittelverfahrenstechnik. Unser „Doppelpack" Bruno Pfister und Dani Kiechl
hat mit seinen vielen Ideen und handwerklichem Geschick dazu beigetragen, dass
so manches Problem im Labor und Pilot Plant Alltag schnell gelöst werden konn¬
te. Ihr erfrischender Humor konnte so manches mal das gefrustete Forschergemütaufheitern. Vielen Dank auch an Jan Corsano, der viel Zeit investierte, um die T-
Flow Messzelle und die Membrankäfige zu konstruieren und zu bauen. Er scheute
sich nicht davor jedes Detail sorgfältig zu diskutieren und auch mal weite Strecken
zu fahren, um besondere Ergebnisse zu erzielen. Dr. Rok Gunde hat sehr gewis¬senhaft und präzise die REM-Aufnahmen der Membranporen durchgeführt. Ohne
seine Geduld und Ausdauer wäre es nicht möglich gewesen in so kurzer Zeit eine
derartige Datenmenge zu erzeugen. Und Daniel Bcckcl am Material Department,nichtmetallische Werkstoffe hat bereitwillig seinen wohlverdienten Feierabend für
mich geopfert, wenn ich mal „ganz schnell" REM-Bilder gebraucht habe. Ich möch-
v

te es natürlich auch nicht versäumen mich bei den anderen guten Seelen in der
Gruppe zu bedanken: Rita Bertozzi, Anna Emslander, Peter Bigler und Bernhard
Koller.
Vielen Dank an die Kollegen vom Technopark, die mich und meine „rotierende
Membran" herzlich aufgenommen haben und unterstützten wo sie nur konnten,
auch wenn wir ihre Gastfreundschaft manchmal sehr in Anspruch genommen ha¬
ben. Danke an Hans Wildmoser, Beat Birkhofer, Stefan Padar, Ketan Joshi und
Jeelani Shaik. Vielen Dank an Beate Kornbrust, die nicht nur ihre Pumpen sondern
auch ihren Arbeitsplatz mit mir teilte. Ein ganz grosses Dankeschön an Yvonne
Mehrle, die mit ihrer guten Laune und ihrer unkomplizierten Art so viele Dinge
erleichert und sogar erst möglich gemacht hat. Bei ihr möchte ich mich vor allem
auch für die moralische Unterstützung während meiner schwierigen Schwanger¬
schaft, meines Mutterschutzes und auch für die administrativen Hilfe am Ende
meiner Dissertation bedanken, die sie mir aufgrund 1000 km Distanz abnahm:
Danke vielmals - das war nicht selbstverständlich.
Meine Kollegen im „Zentrum" haben die Zeit in Zürich zu einem unvergleich¬
lichem Erlebnis gemacht. Marco Dressler, Carsten Cramer, Irene Marti, Paolo
Arancio, Nadina Müller-Fischer, Christoph Lustcnberger, Christoph Denkel, Tim
Althaus, Paul Beck, André Braun, Manuela Duxenneuner, Andreas Baumann, Mi¬
chael Pollard und David Megias-Alguacil. Peter Fischer öffnete irgendwann seine
Tür zum E 21 und war mir fortan eine grosse moralische und fachliche Unter¬
stützung und half beim Korrekturlesen meiner Arbeit. Meine Nachfolgerin Muriel
Graber hat mir mit ihren Fragen geholfen, Struktur in meine Arbeit zu bringen
und hält mich auch heute noch über „unser" Projekt auf dem Laufenden. Vielen
Dank für die kritischen Korrekturen.
Den vielen neugierigen Fragen, konstruktiven Diskussionen und gewissenhaften
Ausführungen meiner Studenten habe ich es zu verdanken, dass ich nie die Freude
an meiner Arbeit verloren habe. Danke dafür an Christina Hauert, Annina Zihlcr,
Tanja Zürcher, Rolf Oertig, Brigitte Kunz und Torsten Schade.
Eines vor allem machte meine Promotionszeit zu etwas Besonderem: Ich hätte
mir keine besseren Bürokollegen vorstellen können als Vishwa und Philipp. Ich
hatte wunderbare vier Jahre im E 21 und wusste, dass ich mich immer auf die
Beiden verlassen konnte. Philipp mein Pate - hatte immer ein offenes Ohr für
fachliche Probleme. Er erstaunte mich immer wieder mit seinem „Lexikon"wissen
und erheiterte den Büroalltag mit seinen treffsicheren und trockenen Kommenta¬
ren. Vishwa war immer da, wenn ich eine Schulter zum Anlehnen brauchte und
hörte mir geduldig zu, auch wenn ich vor Freude oder vor Wut überschäumte.
Danke Euch - hope we will stay in touch for ever!
Dankeschön an Lili, die mir vor allem in der Endphase der Promotionszeit mit
Rat und Tat auch ausserhalb der Bürozeiten zur Verfügung stand und die mich
auch in den Niederlanden nicht vergessen hat.
Einen Dank möchte ich an Gary Hall richten, der mein Englisch druckfähig
vi

korrigiert hat.
Ein ganz spezieller Dank geht an meine Eltern, die mich grossartig unterstützt
haben schon vor, aber auch während meiner Zeit in der Schweiz. Sie haben mir
das Vertrauen geschenkt, dass man braucht, um wichtige Entscheidungen selbst zu
treffen und den nötigen Rückhalt gegeben, um diese Entscheidungen auch tragen
zu können. Ein grosses Dankeschön an meine Schwester Simone, die immer wusste,
wann ich sie brauchte und die immer für mich da ist. Meinem Mann Matthias habe
ich es zu verdanken, dass ich diese Arbeit begonnen und auch zu Ende gebrachthabe. Er hat mich bestärkt, wenn ich Zweifel hatte und hatte Verständnis für
meine vielen Nacht- und Wochenendschichten. Vielen Dank für das Layouten und
Korrekturlesen meiner Arbeit. Ihm und unserem kleinen Cornelius ist diese Arbeit
gewidmet.Diese Arbeit wurde finanziert durch die schweizerische Kommission für Techno¬
logie und Innovation (KTI).
vii

1
Seite Leer /
Blank Seal

ft
Contents
List of Figures xi
List of Tables xv
Notation xvii
Summary xxi
Zusammenfassung xxiii
1 Introduction 1
2 Background 3
2.1 Emulsions 3
2.1.1 Introduction 3
2.1.2 Manufacturing process 4
2.1.3 Comparison of the mechanical emulsification methods. . .
10
2.2 Porous Media 13
2.3 Droplet formation on a single pore 15
2.3.1 Forces acting on a droplet detaching at a pore 16
2.3.2 Droplet detaching Capillary number Cadetach 19
2.4 Flow behaviour in a Taylor Couette geometry 19
2.4.1 Influence of a superimposed axial flow 22
2.4.2 Influence of the radial flow 23
2.4.3 Influence of temperature 24
2.4.4 Influence on the stability of an emulsion 25
2.5 Emulsion rheology 25
2.5.1 Rheology of Multiple Emulsions 27
3 Materials and Methods 29
3.1 Properties of the materials used for emulsions 29
3.1.1 Water 29
3.1.2 Oil 29
3.1.3 Emulsifiers 30
3.2 T-Flow cell - A model flow cell 30
ix

Contents
3.3 Co-flow cell 33
3.4 Rotating membrane (ROME) set-up - A pilot plant device 33
3.5 High pressure homogcniser for inner emulsion of a water-in-oil-in-
water (w/O/w) double emulsion 36
3.6 Modification of the pore size and surface of microstructured mem¬
branes 37
3.7 Tensile strength of the membrane module 39
3.8 Density 42
3.9 Tensiometry 42
3.10 Particle Size and Size Distribution 42
3.10.1 Microscopic analysis 42
3.10.2 Droplet size and droplet size distribution 43
3.11 Rheological characterisation 44
3.11.1 Viscosity Measurements 44
3.11.2 Mathematical Model 45
4 Results 47
4.1 Introduction 47
4.2 Measurements of the viscosity of the emulsions 47
4.3 Oil droplet formation in a T-flow cell in a simple emulsion system 54
4.3.1 Introduction 54
4.3.2 Influence of Dml on droplet detachment and droplet size.
57
4.3.3 Influence of the intcrfacial tension 7 on droplet detachment
and droplet size 59
4.3.4 Influence of the disperse phase flow rate Qdisp 0Ii dropletdetachment and droplet size 60
4.3.5 Influence of the ratio of vcont to v^p on the droplet diameter
ddrop in the dripping regime 61
4.3.6 Comparision between Co-flow and T-flow cells 63
4.4 Experiments with the rotating membrane (ROME) 64
4.4.1 Influence of the flow profile in an annular gap on the dropletsize 65
4.4.2 Influence of the membrane type on the droplet size....
72
4.4.3 Influence of the gap width s on the droplet size 77
4.4.4 Influence of the disperse phase volume fraction f on the
droplet sizes 87
4.5 Multiple emulsions: Comparison of rotor stator and ROME....
97
5 Conclusions 101
Bibliography 105

List of Figures
2.1 Different types of emulsions 4
2.2 Operation of emulsion process illustrated on the basis of a oil-in-
watcr (O/W) emulsion with water soluble surfactants (modificationof Karbstein, 1994) 5
2.3 Principle of membrane emulsification (exemplified with a W/O/W
emulsion) 8
2.4 Mechanisms of the production of either a double emulsion or a
simple emulsion by phase inversion under similar conditions....
9
2.5 Droplet creation by different mechanical emulsification processes
(personal communication with Prof. H. Schuchmann) 11
2.6 Schematic diagram of forces acting on a droplet detaching from a
membrane pore 17
2.7 Taylor vortices in a Couette system with a rotating inner cylinder. 20
2.8 Influence of a superimposed radial and tangential flow caused by
Taylor vortices at the rotating inner cylinder on droplets at different
positions 25
3.1 Schematic sketch of the set-up of the new developed T-flow cell. A
syringe pump is used to feed the to-be-dispersed phase. Dropletformation and detachment is observed by a CCD camera 31
3.2 The new developed T-flow cell implemented in a flow loop showingthe set-up when observing the droplet formation on a membrane
from the side 31
3.3 Principle of the rotating membrane (ROME) set-up 33
3.4 Photography of the rotating membrane (ROME) with a coated con¬
trolled pore distance nano (CPDN) membrane 34
3.5 Flow diagram of the pilot plant set-up of the ROME 35
3.6 Reduction of the pore diameter dpore with the PACVD method while
keeping the pore shape unchanged 38
3.7 scanning electron microscope (SEM) images of a micro-structured
membrane 39
3.8 Strength of a cylindrical membrane 40
3.9 Measurement of the interfacial tension 7 with the pendant dropletmethod 43
XI

List of Figures
4.1 Dynamic viscosity r)ema of an 0/W emulsion with different disperse
phase fractions <p as a function of the rotational speed n of the
rheometer 49
4.2 Dynamic viscosity r/erau of a W/O/W emulsion with different inner
and outer disperse phase fractions <p as a function of the rotational
speed n of the rheometer 49
4.3 Dynamic viscosity ?7emu of a water-in-oil (W/O) emulsion with differ¬
ent disperse phase fractions tp as a function of the rotational speed
n of the rheometer 50
4.4 Critical Taylor number 2'acrjt,i as a function of the disperse phase
<f for O/W emulsion in an 1 mm gap 52
4.5 Dynamic viscosity 7/emu for emulsions with different disperse phasefractions ip, calculated with the Einstein equation 53
4.6 Correlation between the maximum packing concentration Qmax and
the dimensionless droplet Reynolds Number Redmp 53
4.7 Flow regimes in a T-flow cell: Dripping and jetting 55
4.8 Image sequence of droplet detachment at a single pore; disperse
phase: demineralised water; continuous phase: 1 % by volume poly-
glycerol polyricinoleates (PGPR.) in sunflower oil (SFO); Qdisp =
0.31111-min"1, vcont = 11.95-10_3m-s_1, O.lSimages-s"1 56
4.9 Possible varieties of droplet detachment during single pore cross-
flow emulsification depending on the velocities of the continuous
and the disperse phase 56
4.10 Droplet diameter Gfarop as a function of the velocity vcont of the con¬
tinuous phase vc; Q&sp = 0.3ml-min-' (disperse/continuous phase:demineralised water/1% by volume PGPR in SFO, channel height:1 mm) 58
4.11 Droplet diameter ddrop as a function of the continuous phase ve¬
locity vCOnt; Qdisp = 0.3ml-min_1; disperse/continuous phase: dem¬
ineralised water/ 1 % by volume PGPR in SFO 59
4.12 Velocity of the continuous phase vcont as a function of the flow rate
Qdisp of the disperse phase in the transition region between drippingand jetting; disperse/continuous phase: demineralised water/ 1 %
by volume PGPR in SFO 60
4.13 Droplet diameter ddrop as a function of the velocity ratio of the
continuous phase and the disperse phase utorit/'fdisP; water in SFO. 61
4.14 Droplet diameter ddrop as a function of the disperse flow rate Qdispfor different velocities of the continuous phase ucont in the T-flow
cell; water in SFO 63
4.15 Droplet diameter droplet as a function of the disperse flow rate Qdispfor different velocities vcont of the continuous phase in the Co-flow
cell; water in SFO 64
Xll

List of Figures
4.16 Droplet size frequency distribution q^lgx) of an O/W emulsion as
a function of the droplet diameter ddrop with ip — 0.1 and a gap
width s of 1 mm 66
4.17 Dimcnsionless droplet diameter D = (idrop/^pore and dimcnsionlcss
Taylor number Ta as a function of the rotational speed of the mem¬
brane module 66
4.18 Droplet size frequency distribution <fö(lgx) as a function of the
droplet diameter for a W/O/W emulsion with ip% — 0.1 and a gap
width of 1 mm 68
4.19 Dimensionless droplet diameter D and the Taylor number Ta as
a function of the rotational speed n for a W/O/W emulsion with
if] — 0.3 and ip2 — 0.1 in a 1 mm gap 69
4.20 Droplet size frequency distribution </3(lgx) as a function of the ro¬
tational speed n for a W/O emulsion 69
4.21 Dimcnsionless droplet diameter D and dimensionless Taylor num¬
ber Ta as a function of rotational speed n for W/O emulsion....
70
4.22 Dimcnsionless droplet diameter Dasa function of the rotational
speed n for an O/W emulsion with ip — 0.1 and by volume 1%
Tween 80 as emulsifier 73
4.23 Dimensionless droplet diameter D as a function of the rotational
speed n for a W/O/W emulsion with p\ = 0.3 and </?2 — 0.1 and byvolume 1 % Tween 80 in W2 and by volume 5 % PGPR 90 in the oil
phase 74
4.24 Dimensionless droplet diameter I) as a function of rotational speedn for W/O emulsion with ip = 0.1 and by volume 1 % PGPR 90.
. .76
4.25 Droplet diameter d50,3 plotted against the Reynolds number Re for
an O/W emulsion with p=0.5 and either Tween 80 or Tween 20 as
emulsifier 78
4.26 Droplet diameter <i50]3 plotted against the shear rate j for an O/Wemulsion with ip — 0.5 and Tween 80 or Tween 20 as emulsifier.
. .79
4.27 Droplet diameter dg,o,3 plotted against the shear rate 7 for an O/Wemulsion with ip = 0.5 and Tween 80 or Tween 20 as emulsifiers.
.80
4.28 The span3 values are plotted against the droplet diameter dso,3 for
an O/W emulsion with ip— 0.5 and either Tween 80 or Tween 20 as
emulsifiers 81
4.29 Droplet diameter rfgo,3 as a function of shear rate 7 in the annular
gap of 1mm and 2 mm in width for O/W and W/O/W emulsions
with <p = 0.3 82
4.30 The span3 as a function of the droplet diameter c?50j3 in the annular
gap of 1 mm and 2 mm for O/W and W/O/W emulsions with tp =
<p2 - 0.3 83
XUl
List of Figures
4.31 Microscopic image of W/O/W double emulsions: water-in-oil drop¬lets, which are themselves droplets in a water phase 84
4.32 Droplet diameter d503 as a function of the shear rate 7 for W/Oemulsions and gap widths of lmm and 2 mm for <p — 0.1 85
4.33 Droplet diameter d50j3 as a function of the Taylor number Ta for
W/O emulsions and gap widths of 1 mm and 2 mm 86
4.34 Droplet diameter dso,3 as a function of the disperse phase fraction
ip for emulsions of the W/O and O/W types at a gap width of 1 mm.
The rotational speed n was set to 2000 rpm, 4000 rpm, 6000 rpm
and8000rpm 89
4.35 Taylor number Ta as a function of the disperse phase fraction ip
for emulsions of the types W/O and O/W at gap width of 1 mm.
The rotational speed n was varied between 2000 rpm, 4000 rpm,
eOOOrpm and 8000rpm 90
4.36 Droplet diameter as a function of the Taylor number Ta for O/Wemulsions at gap width of 1 mm. The rotational speed was varied
between 2000 rpm, 4000 rpm, 6000 rpm and 8000 rpm 91
4.37 Droplet diameter d50i3 as a function of the Taylor number Ta for
W/O emulsions at gap width of 1 mm. The rotational speed was
varied between 2000 rpm, 4000 rpm, 6000 rpm and 8000 rpm. ...91
4.38 Spans as a function of the disperse phase fraction ip for emulsions of
the types W/O and O/W at gap width of 1 mm. The rotational speedwas varied between 2000 rpm, 4000 rpm, 6000 rpm and 8000 rpm. . 92
4.39 Droplet diameter d50j3 as function of the outer disperse phase frac¬
tion (p2 of W/O/W emulsions for different inner disperse phase frac¬
tions (fi 94
4.40 Droplet diameter rf50>3 as a function of the shear rate 7 for O/Wemulsions with disperse phase fractions <p = 0.3 and 0.5 and gap
widths s of 1 mm and 2 mm 96
4.41 Sauter mean diameters d\p. °f the multiple emulsions plotted againstthe peripheral velocity v of the rotor/membrane, produced either
in a rotor stator device or the ROME 99
4.42 Microscopic images of multiple emulsions produced either in a rotor
stator device or the rotating membrane (ROME) 100
xiv

List of Tables
4.1 Disperse phase fraction (p, respectively cp2 for W/0 , O/W and
W/O/W emulsions 48
4.2 Parameters &o and hi to calculate the dynamic viscosity T]emu with
the model by Pal (1998) 52
4.3 Concentration of PGPR, the corresponding critical micellar concen¬
tration (cmc) value and the resulting droplet diameter d<jrop for
Qdisp = 0.3ml-min_1, disperse/continuous phase: demineralised
water/SFO 58
4.4 Influence of the gap width s: Test parameters for O/W and W/Oemulsions 78
4.5 Influence of the gap width s: Test parameters for W/O/W emulsion. 83
4.6 Influence of the disperse phase fraction Lp: Test parameters for O/Wand W/0 emulsions 88
4.7 Influence of the disperse phase fractions ip\ Test parameters for
W/O/W emulsions 94
4.8 Components of the multiple emulsions, which were produced either
in a rotor stator device or in the rotating membrane (ROME). ...98
4.9 Process parameters of the first emulsification step for the inner
emulsion in a high pressure homogeniser 98
4.10 Process parameters for the second emulsification step in either a
rotor stator device or the rotating membrane (ROME) 98
xv

Seite Leer /
Blank leaf
XVI

Notation
Latin Letters
Symbol Meaning
c concentration
d diameter
^1,2 Sauter mean diameter
E energy
Ey energy density
/ number fraction
F force
h distance between dropsI lengthm mass
M torquen number of revolutions
p pressure
^di,2 transmembrane pressure
P power
Q flow rate
r radius
s gap width
span width of a particle size distribution
t time
v velocityV volume
VfX dispersing volume
w membrane thickness
x mass fraction
xvu
Notation
Greek Letters
Symbol Meaning
(cont.) (cont.)
a central angle
ß term placeholder
7 interfacial tension
7 shear rate
77 dynamic viscosityA wavelength
p density
(7t tensile strengtht shear stress
if central angle$ packing concentration
9 contact anglelü angular velocity
Dimensionless Numbers
Symbol Meaning
(cont.) (cont.)
Ca Capillary number
D dimensionless droplet diameter <idroPMNe Newton number
Re Reynolds number
Ro Rossby or Kiebel number
Ta Taylor number
We Weber number
xvm

Indices
Symbol Meaning
(cont.) (cont.)
0 azirnuthal
ax axial
cent centrifugalcont continuous phasecrit critical
detach detaching (droplet)disp disperse phase
droplet dropletdrum (centrifuge) drum
D viscous dragDL dynamic lift
emu emulsion
i inner
1 intrinsic
k capillary (pressure)m membrane
L liquidmax maximal
min minimal
n neck
o outer
p pressure
pore pore
r radial
rel relative
rot rotatingSP static pressure difference
w wall

Notation
Abbreviations
Symbol Meaning
(cont.) (cont.)
ADLC amorphous, diamond-like carbon
CCD charge coupled device
cmc critical micellar concentration
CPDN controlled pore distance nano
IILB hydrophilic-lipophilic-balance
O/W oil-in-water
O/W/C) oil-in-water-in-oil
PACVD plasma assisted chemical vapour depositionPGPR polyglyccrol polyricinoleatesP1DS polarisation intensity differential of scattered lightPVD physical vapour depositionROME rotating membrane
SEM scanning electron microscopeSFO sunflower oil
SPG Shirasu Porous Glass
W/O water-in-oil
W/O/W water-in-oil-in-water
xx

Summary
Emulsions are dispersions of at least two liquids, which are immiscible with them¬
selves. Emulsions are wide spread in different application fields, including cosmetic
and pharmaceutical products (e.g., crèmes), washing and cleaning detergents and
also in food products, such as butter, mayonnaise and salad dressings. In conven¬
tional emulsification apparatus like rotor stator, high pressure homogeniser and
ultrasound small droplet sizes and size distributions are reached under high shear
stresses usually coupled with a strong increase in the temperature. Not only in
the food industry, but also in pharmaceutical products high temperatures and
shear stresses can mutate or even destroy sensitive product components. This
often results in an obsolescence or even in a complete loss of the product. Cross-
flow membrane emulsification was detected to produce emulsions in a gentle way.
The to-be-dispersed phase is pressed through the membrane and forms dropletsat the pores. The droplets arc detached from the pores by the cross-flow of the
continuous phase. Since the droplet detachment is coupled with the velocity of
the continuous phase, different droplet sizes are obtained, when the flow rate of
the continuous phase is changed. As a consequence, a variation in disperse phasefractions results in different droplet size and size distributions, since in most of
the cases the disperse phase fraction is adjusted by varying the flow rate of the
continuous phase.In the presented work a newly developed ROME emulsification process design is
reported. The aim was to bridge the gap between the conventional emulsification
processes using droplet break up and the gentle cross-flow emulsification process.
To de-couple the detaching forces of the droplets from the velocity of the continu¬
ous phase, the membrane is fixed cylindrical on a shaft and is rotating during the
emulsification process. When the rotational speed is sufficiently high enough, the
effect of the flow rate of the continuous phase can be neglected. A further increase
of the rotational speed results in early droplet detachment. As a consequence, the
droplet size is small with a narrow size distribution. The effect of several process
parameters, such as the rotational speed n of the membrane, the gap width s and
disperse phase fraction <p was studied for three types of emulsions O/W, W/O, and
w/o/w.
Particular attention was given to the influence of the flow profile in the annu¬
lar gap on the results of the emulsification process. It was assumed that different
types of emulsions generate specific flow profiles due to their individual properties.The design of the ROME emulsification apparatus generates, for small rotational
xxi

Summary
speed n, a laminar Couette flow between a rotating inner cylinder and a static
outer cylinder. When the angular velocity of the membrane is increased continu¬
ously, the flow profile changed to a laminar Taylor vortex flow and resulted in the
end in a turbulent wavy vortex flow. The flow profiles have different impacts on
the obtained droplet sizes and size distributions.
The influence of the used membrane on the droplet size and size distribution
were expected to be significant. The pore distance and the wettability of the
membrane surface were especially found to have a significant effect on the re¬
sults of the emulsification process. By using a membrane with controlled pore
distances the coalescence of droplets, which are growing at neighbouring pores,
should be reduced or even avoided. The adoption of the wetting properties on the
hydrophobicity or hydrophilicity of the to-be-dispersed phase should have an ad¬
ditional reducing influence on the droplet size. Before the effect of the membrane
properties on the quality of the emulsion is studied with the ROME emulsification
apparatus, an insight into the phenomena on the membrane surface is provided in
a T-flow cell.
The experiments with the ROME emulsification apparatus went along with an¬
alytical measurements, which completed the studies of the produced emulsions.
Beside the measurements of the droplet size and the size distributions, measure¬
ments of the viscosities of the emulsions and optical analysis of the droplets were
the important investigations.In summary, a new membrane emulsification apparatus was developed, which
combines the gentle way of cross-flow membrane emulsification with the high effi¬
ciency of droplet size reduction of conventional emulsification devices. This studyprovides an insight into the effect of the new technique on three main type of
emulsions O/W, W/O, and W/O/W. This work may be regarded as a first experi¬mental step in pointing out the influence of specific parameters on the quality of
the produced emulsions.
xxii

Zusammenfassung
Emulsionen sind Dispersionen, bestehend aus mindestens zwei Flüssigkeiten, die
nicht miteinander vermischt werden können. Emulsionen treten in sehr vielen ver¬
schiedenen industriellen Anwendungen auf, wie z. B. in kosmetischen und phar¬mazeutischen Produkten (Crèmes), Wasch- und Reinigungsmitteln und auch im
Lcbensmittelbereich, wie beispielsweise Butter, Mayonnaise und Salatsaucen. In
konventionellen Emulgierverfahren (Rotor-Stator, Hochdruckhomogenisator und
Ultraschall) werden kleine Tropfendurchmesser mit engen Grössenverteilungen er¬
reicht. Diese machen sich dabei hohe Scherraten zu nutze, die häufig eine starke
Erwärmung des Produkts zur Folge haben. Nicht nur im Lebensmittelbereich, son¬
dern auch bei pharmazeutischen Produkten können dabei empfindliche Kompo¬nenten verändert oder gar zerstört werden. Dies führt häufig zu einem Wcrtvcrlust
oder gar zur vollständigen Zerstörung des Produkts. Membranverfahren dagegenhaben sich als eine besonders schonende Emulgiermethode erwiesen. Die dispersePhase wird dabei durch die Membranporen gedrückt und bildet Tropfen an den
Poren. Die Tropfen werden anschliessend durch die überströmende kontinuierli¬
che Phase abgelöst. Da die Tropfenablösung an die Überströmungsgeschwindgkeitder kontinuierlichen Phase gekoppelt ist, werden unterschiedliche Tropfengrössenerreicht, wenn der Dispersphasenanteil verändert wird. Dies wird dadurch verur¬
sacht, dass der Dispersphasenanteil meist über den Durchfluss der kontinuierlichen
Phase eingestellt wird.
In der vorliegenden Arbeit wurde ein neuartiges Emulgierverfahren entwickelt,bei der die Membran rotierend eingebaut ist. Das Ziel der Arbeit war es die Lücke
zwischen konventionellen Emulgierverfahren, in denen Tropfenaufbruch stattfindet
und den schonenden Membranverfahren zu schliessen. Die Kräfte, die die Tropfenvon der Pore ablösen, wurden von der Überströmungsgeschwindigkeit der konti¬
nuierlichen Phase getrennt, indem die Membran zylindrisch eingebaut wurde und
während des Emulgierprozesses rotierte. Sobald die Umdrehungsgeschwindigkeitder Membran ausreichend hoch ist kann der Einfluss der kontinuierlichen Phase
vernachlässigt werden. Wird die Rotation der Membran weiter erhöht hat dies
eine frühere Ablösung der Tropfen von den Poren zur Folge. Dies führt zu kleine¬
ren Tropfengrössen und engen Tropfengrössenverteilungen. Der Einfluss mehrerer
Prozessparameter, wie z.B. die Umdrehungsgeschwindigkeit n der Membran, die
Spaltweite s und das Dispcrsphasenverhältnis <p wurde für die drei EmulsionstypenÖl-in-Wasser (O/W), Wasser-in-Öl (W/O) und Wasscr-in-Öl-in-Wasser (W/O/W)untersucht.
xxiii

Zusammenfassung
Besondere Aufmerksamkeit galt dem Einfluss des Strömungsprofils im Scher¬
spalt auf die Emulgierergebnisse. Es wurde angenommen, dass unterschiedliche
Emulsionstypen aufgrund ihrer individuellen Eigenschaften spezifische Strömungs¬
profile verursachen. Für sehr kleine Umdrehungsgeschwindigkeiten der Membran
wurde eine laminare Couetteströmung zwischen einem rotierenden inneren Zy¬linder und einem ruhenden äusseren Zylinder erzeugt. Wurde die Umdrehungsge¬
schwindigkeit der Membran stetig erhöht ging das Strömungsprofil zunächst in ein
laminares Taylorwirbelprofil und schliesslich in ein turbulentes wellenartiges Wir-
bclprofil über. Die verschiedenen Strömungsprofile beeinnussten die Tropfengrösseund die Grössenverteilung unterschiedlich.
Es wurde vermutet, dass der Einfluss der verwendeten Membran auf die re¬
sultierenden Tropfcngrössen und Grössenverteilungen bedeutend ist. Dabei wurde
angenommen, dass besonders durch den Porenabstand und die Oberflächeneigen-schaften der Membran die Emulgierergebnisse beeinflusst werden. Die Verwen¬
dung einer Membran mit definierten Porenabständen soll Tropfcnkoaleszcnz auf
der Membranoberfläche zwischen zwei benachbarten Poren reduzieren oder sogar
vollständig vermeiden. Die Anpassung der Oberflächeneigenschaft der Membran
an die disperse Phase soll einen zusätzlichen Einfluss auf die Verkleinerung der
Tropfengrösse haben. Bevor der Effekt der Mcmbrancigenschaften auf die Qua¬lität der Emulsionen beim Einsatz im rotierenden Emulgierapparat untersucht
wurde, wurden in einer T-Profil Messzelle die Vorgänge an der Membranoberflä¬
che mikroskopisch beobachtet. Die daraus erhaltenen Erkenntnisse wurden bei der
Entwicklung der rotierenden Membrananlage berücksichtigt.Parallel zu den Experimenten in der rotierenden Membrananlage wurden analy¬
tische Messungen durchgeführt, die die Untersuchungen der hergestellten Emulsio¬
nen vervollständigen. Neben den Messungen der Tropfengrösse und der Grössen¬
verteilung waren die Analyse der Viskosität und die mikroskopischen Aufnahmen
der Tropfen von grosser Bedeutung.Im Rahmen dieser Arbeit wurde eine neiiartige rotierende Membrananlage ent¬
wickelt, die die schonende Herstellung des Membranverfahrens mit der hohen Effi¬
zienz der Tropfenzerkleinerung der konventionellen Emulgierverfahren verbindet.
Diese Arbeit ermöglicht einen Einblick in den Einfluss dieser neuen technischen
Entwicklung auf die drei wichtigsten Emulsionstypen O/W, W/O und W/O/W.Die vorliegende Arbeit kann als erster experimenteller Schritt angesehen werden,welcher den Einfluss einzelner Parameter auf die Qualität der hergestellten Emul¬
sionen beschreibt.
xxiv

1 Introduction
Dispersion processing of a liquid in another immiscible liquid in order to produceemulsion-based products, is a major field of interest for pharmaceutical-, food-,cosmetics and chemical industries. Conventional processes are in general con¬
tinuous processes in which a disperse microstructure is generated under laminar
and/or turbulent flow conditions. Small droplets of the disperse microstructure
are beneficial for the stability of the emulsions (e.g., creaming or sedimentation
can be reduced) or even is an essential quality criterion as it is in parenteralnutrition. For this reason it is of great interest to develop a method, which sat¬
isfies this claim. In conventional emulsification processes, like rotor stator, high
pressure homogeniser and ultrasound, small droplets of the disperse phase can be
achieved, but with quite a high strain of the liquids. Materials, which are sensitive
to stress and high temperatures can be mutated or even destroyed. In contrast
to the emulsification apparatuses mentioned above the strain on the phases in a
cross-flow emulsification device is reduced, but at the expense of small droplets in
the same size as achieved with the above mentioned emulsification devices.
Based on this background the aim of the presented PhD work was identified.
In several steps the development of a new membrane apparatus, which combines
a gentle way of emulsion production with small droplet sizes and a narrow size
distribution in pilot plant scale should be realised.
In a first step a new membrane was developed, which supports the production of
small droplets and narrow size distributions. The use of a controlled pore distance
membrane with a regular pore shape and defined surface properties (wettabilityand roughness) was expected to support the tendency to obtain small dropletsizes and narrow size distributions. In a second step the impact of membrane
properties and flow profiles on the quality of the emulsions was determined during
experiments in a laboratory scale.
In a third step, the findings from the second step were transferred to a continu¬
ous pilot plant scale process device. The fixation of the newly designed membrane
on a rotating hollow shaft in an annular gap was supposed to be beneficial for
the droplet detachment process. The effect of process parameters, like rotational
speed n, gap width s and disperse phase fraction <p was evaluated from the basis
of the three types of emulsions W/O, O/W and W/O/W.
Quality criteria of the emulsions such as droplet size ddTop, size distribution as
well as emulsion properties like dynamic viscosity r/ and density p were quantifiedto show the efficiency of the newly membrane emulsification method.
1

2

2 Background
2.1 Emulsions
2.1.1 Introduction
Emulsions are disperse multiple phase systems. They are made out of at least
two nearly immiscible fluids, one being dispersed in the other. The disperse phaseforms droplets, which arc surrounded by the continuous phase. Because of their
disperse state, emulsions have a large interface between their liquid phases. Chem¬
ical reactions, diffusion or substitution of material between the phases are much
faster when compared to a non dispersed state. The disperse phase volume frac¬
tion may vary from nearly zero to almost one.
Emulsions are thermodynamical instable because of the large interface between
the two phases. This is valid for the so called macro emulsions, which are most
relevant for industrial applications in the food industry. Without any stabilisingsupports, droplet sedimentation or creaming, aggregation and coalescence occur.
In the worst case both phases can separate completely. Emulsions must not be
necessarily stable over a long time period for all kind of applications, but only as
long as it is necessary for the specific application. For this reason adjuvants arc
added to the emulsion.
In strongly diluted emulsions, droplets arc agitated by Brownian motion, and
the emulsion properties are similar to those of the continuous phase. Since this
is the case for the emulsions dealt within the present work, in this chapter no
deeper explanation for other cases will be given. When the emulsion has a higherconcentration, namely above the random-close-packing volume fraction, which is
64 % for monodisperse droplets, the internal dynamics are severely restricted and
the emulsion behaves as a viscoelastic solid (Bibette et al, 2002).Three main types of emulsions exist, which are important, or potentially so, in
foods. They are shown in Figure 2.1. In the simplest cases the two phases are
water and oil. In O/W emulsions droplets of oil (lipophilic phase) are dispersedin an aqueous continuous phase (hydrophilic phase). These exist in many forms
(mayonnaises, cream liqueurs, creamers, whippable toppings, ice cream mixes)and their properties can be controlled by varying both the adjuvants used and the
components present in the aqueous phase. W/O emulsions are typified by butter,
margarines and fat-based spreads in general. Their stability depends more on
3
2 Background
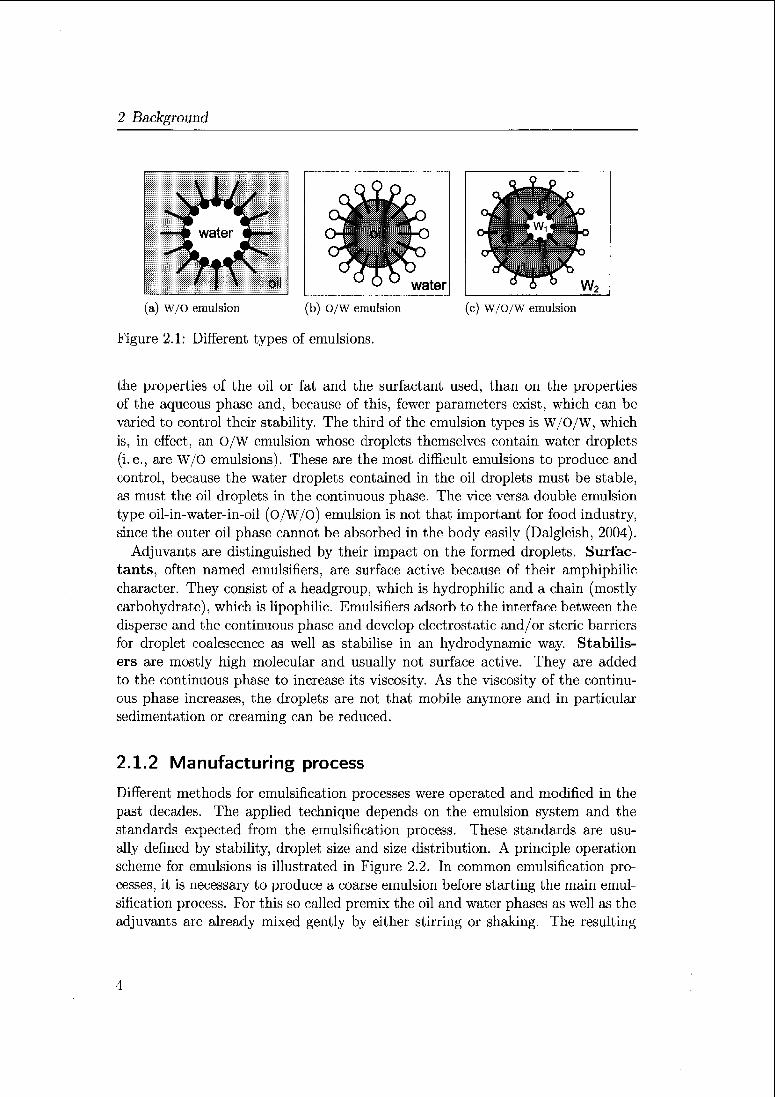
(a) W/O emulsion (b) O/W emulsion (c) W/O/W emulsion
Figure 2.1: Different types of emulsions.
the properties of the oil or fat and the surfactant used, than on the propertiesof the aqueous phase and, because of this, fewer parameters exist, which can be
varied to control their stability. The third of the emulsion types is W/O/W, which
is, in effect, an O/W emulsion whose droplets themselves contain water droplets
(i.e., are W/O emulsions). These are the most difficult emulsions to produce and
control, because the water droplets contained in the oil droplets must be stable,as must the oil droplets in the continuous phase. The vice versa double emulsion
type oil-in-water-in-oil (O/W/O) emulsion is not that important for food industry,since the outer oil phase cannot be absorbed in the body easily (Dalglcish, 2004).Adjuvants are distinguished by their impact on the formed droplets. Surfac¬
tants, often named emulsifiers, are surface active because of their amphiphiliccharacter. They consist of a headgroup, which is hydrophilic and a chain (mostlycarbohydrate), which is lipophilic. Emulsifiers adsorb to the interface between the
disperse and the continuous phase and develop electrostatic and/or steric barriers
for droplet coalescence as well as stabilise in an hydrodynamic way. Stabilis¬
ers are mostly high molecular and usually not surface active. They are added
to the continuous phase to increase its viscosity. As the viscosity of the continu¬
ous phase increases, the droplets are not that mobile anymore and in particularsedimentation or creaming can be reduced.
2.1.2 Manufacturing process
Different methods for emulsification processes were operated and modified in the
past decades. The applied technique depends on the emulsion system and the
standards expected from the emulsification process. These standards are usu¬
ally defined by stability, droplet size and size distribution. A principle operationscheme for emulsions is illustrated in Figure 2.2. In common emulsification pro¬
cesses, it is necessary to produce a coarse emulsion before starting the main emul¬
sification process. For this so called premix the oil and water phases as well as the
adjuvants arc already mixed gently by either stirring or shaking. The resulting
4

2.1 Emulsions
raw emulsion
continuous
phase __
emulsifier
disperse
phase -
o— •©•ino r"
>• stabilisation • I
coalescense
stable droplets
r
mechanical
energy
Figure 2.2: Operation of emulsion process illustrated on the basis of a O/W emul¬
sion with water soluble surfactants (modification of Karbstein, 1994).
coarse emulsion consists of very large and polydisperse droplets, which will be
broken up and stabilised when the fine emulsification step is finished. Kaufmann
(2002) pointed out that a combination of stresses affecting the droplets and the
time of deformation must be strong enough to cause droplet break up.
The resulting droplets have to be stabilised by surfactants as soon as the dropletbreak up is finished. Several specific mechanisms make sure that the surfactant
cover the newly created free surface of the droplet before coalescence or other
instabilities occur.
Since the design of a new technique was one main part of this work, the most
commonly used conventional apparatus will be described briefly. For a better
overview, the existing emulsification methods are separated with respect to the
different mechanism of droplet creation: droplet break up and droplet formation.
Agitator
Agitators are the oldest group among the emulsification devices and vary onlyin the geometry and size of the impellers. In Schubert and Armbruster (1989)mechanisms of those apparatus arc described briefly. Droplet break up of the
disperse phase is mainly caused by shear stresses in turbulent flow. The energy,
respectively power, which has to be expended for the stirring process dissipates in a
huge volume, compared to other emulsification apparatus. This is the reason whystirrers are used mostly to prepare coarse emulsions, which will undergo another
emulsification step to form a fine emulsion.
5

2 Background
Rotor Stator Systems
Rotor Stator Systems are assembled and maintained easily and running times are
quite high. This is the reason why they are the most frequently used emulsification
devices in industry. In rotor stator systems, the milling energy is inserted by the
rotating parts of the apparatus. Schubert and Armbrustcr (1989) listed the most
important parameters for rotor stator devices. The volume necessary for dropletbreak up in the rotor stator head is kept as small as possible and ranges usuallyfrom 0.01ml to 20 ml. Because of this, rotor stator systems are more suitable for
fine emulsification processes as compared to the stirrers described before.
Rotor stator systems exist in different geometrical designs from lab scale up to
production scale of several cubic metres. They can be run batchwisc and quasi-
continuously and it is possible to combine several processing steps in one appara¬
tus (e.g., mixing of components, emulsification and adjusting of temperature for
pasteurisation and/or cooling).
Among the most common types of rotor stator systems, beside the simple mixing
element, rank the colloid mills and the toothed disc dispersing machines. In the
dispersing zone of these machines high shear stresses arc applied to deform and
disrupt large droplets. Therefore, high-energy inputs are required and shear-
sensitive ingredients, stich as proteins or starches, may lose functional properties
(Charcosset et ai, 2004).In colloid mills, the gently mixed phases are pressed through an annular gap.
The disperse phase is sheared in the gap between rotor and stator, and disrupted
finally. The wings on the rotor accelerate the medium in the tangential direction
before entering the annular gap. This results in a gently mixed two phase system
and a coarse disruption in relatively large sized droplets. Commercially available
surfaces of rotor and stator are mainly toothed (Schubert and Armbruster, 1989).Holley and Weisser (I982a,b) found, for some emulsification processes, smooth
surfaces of both parts advantageous for producing homogeneous droplet sizes. The
width of the annular gap can be adjusted by different positions of the rotor on the
shaft. Different residence times and intensities of stress in the gap are additional
effects resulting from rearranging the rotational part. Commonly used colloid
mills are qualified for the production of intermediate- to high-viscous emulsions.
Minimal viscosity has to be around 20mPa-s. Manufacturing tolerances of rotor
and stator have to be relatively small, because the power density in the gap has
to be uniform over the whole height to get quite monodisperscd emulsions.
Toothed disc dispersing machines accelerate the medium with centrifugal
forces, resulting in an additional pumping effect. The liquid system is sucked from
the bottom of the head and leaves the dispersing zone in a radial direction. One
principal problem, occurring in toothed disc dispersing machines, is the entrap¬ment of air bubbles. Closed machines with a combination of stirring elements
and toothed disc dispergator provide vacuum atmosphere to avoid foaming. In
6

2.1 Emulsions
contrast to colloid mills high viscous media cannot be dispersed easily, because
the sucking effect is reduced with increasing viscosity and an additional pump
element is necessary.
High Pressure Homogeniser
High pressure homogenisers mainly consist of a high pressure pump and a ho¬
mogenising valve. Especially the geometry of the nozzle is influencing the flow
conditions which are also responsible for the dispersing mechanisms and its effi¬
ciency. The simplest form of a homogenising valve is the orifice valve developed by
Stang (1998); the flow is not diverted but only accelerated. Beside radial difhisors
like the standard valves, there are high pressure homogenisers using the principleof opposing jet streams. Examples arc the Microfluidizer® (US-Patent 4533254),which was also used in this work and the jet-dispersing system (Klinksiek and
Koglin, 1992). The emulsion is divided into at least two partial streams, which
are later united again.
The machines used for cmulsification processes by using high pressure ho¬
mogenisers differ in the mechanism causing droplet deformation and disruption.One example for that is the détermination of droplet disruption. It is determined
by the stress acting on a droplet,but also the interfacial tension in the moment of
deformation as well as the viscosity ratio depends on the type of apparatus used
(Tesch and Schubert, 2001).
Ultrasound Emulsification
There are different possible mechanisms of droplet disruption under the influence
of ultrasound. Cavitation is generally regarded as crucial for droplet disruption in
sound fields under practical conditions. There are many examples of experimen¬tal results that show, parameters positively influencing cavitation in liquids also
improve emulsification in terms of smaller droplets after disruption. Cavitation is
attributed to shock waves, liquid jets or turbulence on a micro scale following a
collapsing cavitation bubble (Lauterborn and Ohl, 1997). Nevertheless, the reason
for droplet disruption in a cavitating liquid, i.e., whether droplets arc disruptedinstantaneously by only few cavitation events or successively in a large number
of steps, is not fully understood. Experimental investigations have proved the
applicability of ultrasound for continuous emulsification. The efficiency of this
technique, in terms of mean droplet size as function of energy density, is com¬
parable to that of high-pressure systems (Behrend and Ax, 2000). Nevertheless,
droplet size distribution obtained, often fail to meet the requirements.
7

2 Background
Figure 2.3: Principle of membrane emulsification (exemplified with a W/O/W emul¬
sion).
Membrane Emulsification
In contrast to conventional apparatuses, droplets are formed at pores and, for the
ideal case, no droplet break up or disruption occurs. Techniques to produce emul¬
sions using membranes can be divided in two groups: either a coarse premixedemulsion is pressed through the membrane to reduce the droplet size of the dis¬
persed phase, or the pure to-be-dispersed phase is pressed through the membrane
and forms droplets at the pore openings in the membrane surface, the dropletsare detached by the cross-flowing continuous phase. A scheme of the membrane
emulsification process is shown in Figure 2.3. The first technique, which may be
called dead-end or premix membrane emulsification, gives a reasonable emulsion
flux (about 10m3-in~2-h~1 at 1.5 MPa). Despite that, up to now only one research
group has published results on this process.(Suzuki et al, 1994, 1998)Suzuki (1999) found the tendency for this premix emulsification process to result
in phase inversion during dead-end. The coarse emulsion is pressed through the
pores of the membrane, which is better wettable by the disperse phase than by the
continuous phase. After phase inversion, a nearly monodisperse inverse emulsion
can be reached. For highly concentrated emulsions, this method was successfullyused.
In addition to this phenomenon, multiple emulsions can be produced by mem¬
brane emulsification processes under similar conditions. An emulsion is pressed
through the pores and dispersed as (emulsion) droplets into the outer continuous
phase. Inner droplets are dispersed in a continuous phase, which itself forms an¬
other dispersed phase in the outer phase. The different mechanisms of producingeither a simple emulsion by phase inversion or a double emulsion is illustrated in
Figure 2.4.
8

2.1 Emulsions
Figure 2.4: Mechanisms of the production of either a double emulsion or a simpleemulsion by phase inversion under similar conditions.
The effect of different factors on cross-flow membrane emulsification perfor¬mance was studied by several groups and reviewed by Joscelyne and Trâgardh
(2000). Typically, droplets of lum to 10 urn are obtained and disperse phasefluxes of 0.01m3-m~2-h_1 to 0.1m3-m_2-h_1 are feasible. Process parameters arc
important for the average droplet size, droplet size distribution and the disperse
phase flux. Several publications describe the influence of single process parametersor combinations of them.
One of the most popular advantages of membrane emulsification over other
techniques is the lower energy density requirement, which also implies that less
shear stress is exerted on the ingredients. Another feature is the monodispersity of
the droplets, obtained under certain conditions. Making use of the advantages of
the technique, amongst other things, some specific applications have been studied
such as a low-fat spread product, which is already commercialised, different drug-
delivery systems like anti-cancer drug, that was encapsulated in oil and after
injection into the blood system it was slowly released in the target organ.
It is crucial to select the correct membrane for different applications. The mate¬
rials of the membranes used range from ceramics, different metals or metal-alloys,to plastics and glass. Membrane parameters such as wettability, pore size, pore
distance and pore geometry, as well as pore arrangement have a strong influence
on the emulsification results. Mostly for membrane emulsification process, tube
modules are used, in minority of cases membranes in flat sheets are applied.
Thus, cross-flow membrane emulsification has potential to produce monodis-
pcrse emulsions, perhaps even nano-sized, and emulsions with shear sensitive
components with relatively low energy input. However, a limiting factor for emul¬
sion production on a commercial scale will be a low disperse phase flux. From
literature research, it is clear that the disperse phase flux largely depends on
properties of the membrane, yet, these parameters did not gain much attention.
9

2 Background
Gijsbertsen-Abrahamse (2003) try to get a better knowledge of how membrane
parameters affect the disperse phase flux. With such insight it would enable the
targeted development of membranes, optimal for the process of cross-flow mem¬
brane cmulsification for a given application. Nevertheless, for a commercial use
of this technique, the problem regarding the low disperse phase flux is not yet an¬
swered satisfactorily. Therefore, the objective of this research is to find a simplesolution for increasing the disperse phase flux, while keeping the droplet size con¬
stant and being independent of the resulting disperse phase fraction that means
the continuous phase flux is no longer the driving force for droplet detachment.
MicroChannel
Beside the mentioned and above described membrane emulsification process, mi-
crochanncl cmulsification is receiving more and more attention for lab scale studies.
When the cross-flow (T-flow) method is used in the microfluidic device, dropletsof the to-be-dispersed phase arc formed and detached analogous to membrane
emulsification. The disperse phase channel is formed in such a way, that the to-be
dispersed phase is cleaved off into droplets by the continuous phase, which acts
as the shear force. This occurs automatically when instabilities of the interfacial
tension forces are reached. These instabilities occur, when the droplets grow to
a critical size. Application of additional shear around the droplets is not neces¬
sary, but is required for effective release from the edge and to make W/O cells
successfully and continuously. Only monodisperse emulsions are produced in that
way, because in-/stability conditions are responsible for the detachment. Monodis¬
perse droplets of order of 17 /an have been produced using cross-flow (Husny and
Cooper-White, 2006; Husny et al, 2006; Nisisako et ai, 2002, 2004, 2005, 2006).Recently even double emulsions have been prepared by using the T-flow chan¬
nel. The size of the resultant double emulsions, as well as the number of internal
droplets within double emulsion droplets, coiild be controlled by relative flow rates
of all the phases. For large scale production this method is not favoured up to
now, since it is not possible to produce a huge amount of droplets in a short time.
2.1.3 Comparison of the mechanical emulsification methods
Emulsification apparatus are quite different in principle of operation to what was
described in subsection 2.1.2. Because of that characteristic parameter for emul¬
sions as well as comparable parameters for process set-ups had to be analysed.Karbstein (1994) pointed out that conventional emulsification apparatus can be
compared in one diagram by plotting the droplet diameter versus energy densityas shown in Figure 2.5. Energy density Ey is defined as the energy input E into
the dispersing volume Vd- This dispersing volume is, in most of the cases, difficult
10
2.1 Emulsions
10
Ol4-»
tu
E«J
ra
<U
E
3
«3
1 ;
0,1
Kartastein, 1994
S tang, 1998
Schröder, 1999
Behrend, 2000
membrane
(recirculation)
1 % 50
"H i "
104 1Q5 106 107 108
specific energy Ev
/ (J /m3)
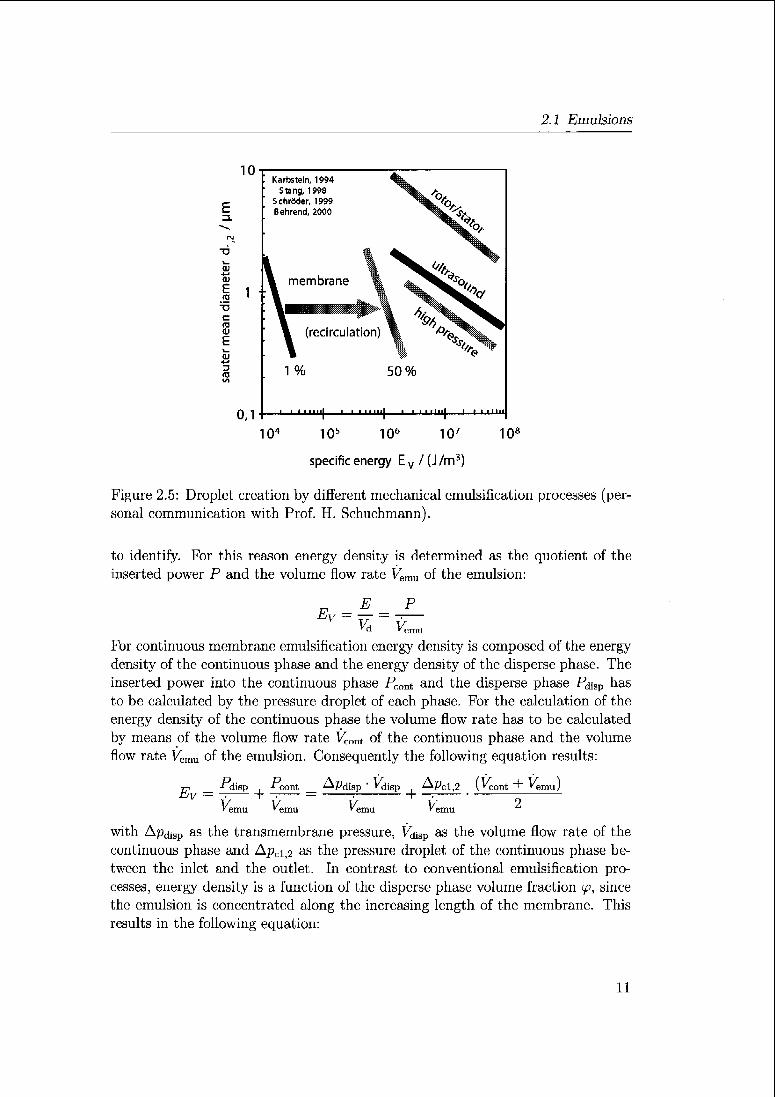
Figure 2.5: Droplet creation by different mechanical cmulsification processes (per¬sonal communication with Prof. H. Schuchmann).
to identify. For this reason energy density is determined as the quotient of the
inserted power P and the volume flow rate Vemu of the emulsion:
Ev — TT
E_Vd va
For continuous membrane emulsification energy density is composed of the energy
density of the continuous phase and the energy density of the disperse phase. The
inserted power into the continuous phase Pcont and the disperse phase PdiSp has
to be calculated by the pressure droplet of each phase. For the calculation of the
energy density of the continuous phase the volume flow rate has to be calculated
by means of the volume flow rate V^ont of the continuous phase and the volume
flow rate Vemu of the emulsion. Consequently the following equation results:
77,-Pdisp
.
-Pcont APdisp Vdjsp Apcl)2-C/y —
— 1 -— : 1 r—
'emu »emu 'emu 'emu
,2 (^cont + Kmu)
with ApdiSp as the transmembrane pressure, VdiSp as the volume flow rate of the
continuous phase and Apcl2 as the pressure droplet of the continuous phase be¬
tween the inlet and the outlet. In contrast to conventional emulsification pro¬
cesses, energy density is a function of the disperse phase volume fraction cp, since
the emulsion is concentrated along the increasing length of the membrane. This
results in the following equation:
11

2 Background
Ev = Apdi8p ip + Apci,2 •
—^—
For the most favourable case, which means no recoalescence occurs, pressure
droplet of the continuous phase is nearly zero, so only the capillary pressure has to
be overcome, Schröder (1999) found the following dependency of Ev, the capillary
pressure d^ and the interfacial tension 7:
4 • 7 • cos 0Ev = Pd,k
• V = —-1 ¥>^pore
When the pore diameter dpore is substituted by the droplet diameter cfarop arid it
is assumed that the contact angle is almost zero, the following equation results:
dmin.theor = D • 4 • 7 • E~] if
where D is the ratio between the size of the droplet and the pore size. This factor
may vary as it could be shown in the presented work between one and twelve,which depends very much on the emulsion types and ingredients used.
Karbstein (1994) and Schröder (1999) could show clearly the significant low
energy input, when emulsions are produced by membrane devices as shown in
Figure 2.5 as a comparison of the above described membrane apparatuses. The
Sauter mean diameter d1)2 of the droplets is used as the characteristic parameter
of the produced emulsions, which is compared between the different emulsification
apparatus. The Sauter mean diameter d1)2 is defined as the diameter of a spherethat has the same volume/surface area ratio as a particle of interest. This results
in the following equation:
with Vdisp as the actual volume of the droplets and ^4disp as the surface area.
2.2 Porous Media
Membranes are defined as interfacial areas, which are able to separate at least two
different phases and select the material passing through it (Schroder, 1999), and
are commonly used for separation processes. Characteristic parameters for mem¬
branes are well known and documented in Wilk (1996) for different applicationsin separation processes, but only a few of them are also relevant for emulsification
processes.
Vladisavljevic and Williams (2005) recently summarised developments in manu¬
facturing emulsions. The first investigation on using membrane emulsification can
be traced back to the later 1980s, when Nakashima and Shimizu (1986) fabricated
12

2.2 Porous Media
a particular glass membrane, called Shirasu Porous Glass (SFG), and successfully
produced highly uniform-sized kerosene-in-watcr and water-in-kerosene emulsions
(Nakashima et al, 1991). Since this time the method has continued to attract
attention due to its effectiveness in producing narrow droplet size distributions
at low energy consumption. Beside a newly developed membrane, especially for
emulsification processes, which is the SPG membrane, investigations of a broad
range of other types of membranes, such as ceramic, metallic, polymeric and mi-
croenginecred devices, have been reported. Vladisavljevic and Williams (2005)compared different membranes and membrane materials by the form of the mem¬
brane, the nature of its surface, mean pore size and a typical effective membrane
surface area. Additional parameters are well known and important parameters in
separation processes should also be considered for emulsification devices: High flux
and high transmembrane pressures, high mechanical resistance, resistance againstchemicals and high temperatures (important for the cleaning process in industrial
applications), high life time and possibility of regeneration and the membrane
material itself should not react with the emulsion materials in any way (Wilk,1996).
In the following paragraphs some parameters are described in more detail, be¬
cause they were the main factor, which were considered when the choice for the
membranes, used in that work, were made:
The form of the membrane is an important criterion for the whole emulsi¬
fication process and apparatus. Once it is clear how the apparatus should work
(e. g., batchwisc or continuous wise) and the boundary conditions (e. g., size of the
apparatus, process temperatures) are worked out, the form and implementationof the membrane can be fixed. Well known are tubular and hollow fiber forms.
Normally the fabrication is limited to a maximal and minimal length and diame¬
ter of those membranes. Another commercially available geometry of membranes
is the fiat version. Usually they are sold in sheets of different sizes. One of the
smallest types are microengineered Aquamarijn® microsieves, which is a uniform
membrane made out of silicon nitride of 1 urn thickness and contains circular pores
arranged in groups of 100 identical pores with pore diameter ranging from 1.5 pm
to 7 urn. The maximum length of the squared sheet is 4.5 mm. For that reason
those membranes are only used for laboratory purposes and experiments to getinformation about droplet detachment on single pores (Gijsbcrtscn-Abrahamse,2003).The nature of the membrane surface can be discussed for different factors.
One important property of the surface is the hydrophobicity or hydrophilicity.When the membrane will be used for a water-in-oil emulsion, water droplets are
pressed through the pores and should not touch the surface of the membrane. To
avoid that the surface of the membrane should be hydrophobic. In some cases it
is necessary to change the membrane surface from hydrophillic to hydrophobic.Therefore the whole membrane can be covered with a narrow layer of another
13

2 Background
material, which has the acquired properties. One special method of membrane
coating will be discussed separately in section 3.6.
Mean pore size is another important factor to characterise and compare dif¬
ferent membranes. Since the mean pore size is known, the mean droplet size of the
emulsion can be estimated. But this value has to be carefully interpreted. Mean
pore size is usually an arithmetic average over the single pore sizes occurring on the
whole membrane surface. That means pore size distribution is not considered and
huge differences in the pore sizes are neglected. In many publications the geometry
of the pores is not round, but the openings have regular shapes like rectangular or
square or even some irregular shapes (Schröder, 1999; Suzuki, 1999; Vladisavljevicet ai, 2004). Mean pore size is calculated as the equivalent circle diameter of a
circle with the same area. For an estimation and for a rough comparison between
different membranes, mean pore sizes are the most suitable dimension. For exact
and concrete comparison, other factors, like pore size distribution, pore distance
and also pore shape, have to be considered additionally.For an emulsification process the pore size of the membrane is important, be¬
cause the resulting droplet size depends on that value. Schröder (1999) and Pengand Williams (1998) found in experiments with single pores a droplet/pore di¬
ameter ratio D = dArop/dpore of three to ten. For glass or ceramic membranes,similar values for D were found ((Gijsbertsen-Abrahamsc, 2003; Williams et a/.,
1998). Also higher values of D with a silicon nitride membrane were found by
Gijsbertsen-Abrahamsc (2003). Values of D varied between three and 37. Not
only different properties of the membrane surface, which are obviously influenced
by the membrane material, but also the pore size, shape and distance are impor¬tant reasons for the differing results.
The fabrication of regular pore shapes, e. g., round or rectangular, and controlled
pore distances is not possible for every membrane material and manufacturingmethod. Sintering processes are often used for membranes based on syntheticmaterial or glass. During this manufacturing, controlled pore shapes and distances
cannot be realised. Since most of the application fields for membranes are filtration
processes, the defined pore geometry and pattern was only of little importance up
to now. In turn, membrane emulsification processes do not follow a standard
process or standard composition, which results in a wide variety of membrane
material and design.The reason for not yet standardised emulsification processes is the individual
reaction of different emulsion material and the influences of its properties (e. g.,
viscosity and interfacial tension) on membrane material and design. Nevertheless
the influence of pore size, shape and distances were identified as important factors
for droplet size and size distribution, which result in different qualities of the final
emulsions. Only a few publications, Gijsbertsen-Abrahamsc (2003) and van der
Graaf et al. (2005), show explicitly the influence of pore distance on the droplet
size, while the influence is a matter of common knowledge. The distance of the
14

2.3 Droplet formation on a single pore
pores for most of the membranes, mentioned in literature was not further the main
part of investigations. Only a few experiments have been done up to now, to getinformation about the detailed influence of the pore distance on the droplet size
and droplet size distribution.
At least membranes are only one part, even though an important one, imple¬mented in a complex set-tip. Membrane material and design have also to be
selected considering the sort of process (static or continuous) and regarding emul¬
sion material (viscosity, interfacial tension and chemical properties). Beside the
development of a new style of membrane fixation and the rotating mechanism
involved, one focus of the presented work was the creation of a new membrane
with defined pore size, shape and distances, to make sure that influences of these
three parameters on the emulsion quality can be neglected.
2.3 Droplet formation on a single pore
Droplet formation has been studied for different geometries of the pores or mi-
crochannels, as well as for several fixtures of the pores, capillaries or microchannels
into the flow channel (Cramer et ai, 2004; Menetrier-Dercmble and Tabeling, 2006;van der Graaf et al, 2005; Xu et ai, 2006). Most of the reported experimentswere done in a Co-flow regime, which means the disperse phase enters the contin¬
uous phase in the same direction as the continuous phase flow. A brief literature
review of droplet formation at a capillary tip in a Co-flow is given by Cramer et al.
(2004).As a model system for membrane emulsification, droplet formation from a single
pore in a T-shaped junction is more suitable. Van der Graaf et al. (2005) used a
T-shaped microchanncl junction to resemble the situation during cross-flow mem¬
brane emulsification.
In principle two different droplet formation mechanisms can be distinguished- dripping and jetting. Both mechanisms exist in Co-flow and T-shaped flow.
Dripping describes detachment of a series of single droplets for a relative low
disperse phase throughput or a small ratio Vdisp/V^011t. V represents the volume
flow rate of the disperse phase for the index d and the continuous phase for the
index c. It is reported that droplets first form a hemisphere, then the dropletis deformed by the acting forces and last form a neck before detachment. This
necking process is a dynamic process that takes a certain time, which explainsthe influence of both the disperse phase flow rate and the properties of both fluid
phases on the final droplet size. In the jetting regime, the to-be-dispersed phaseis pushed through the pores at a higher velocity. As a consequence, liquid jets
emerge from the pore and are stretched by the continuous phase flow. At a certain
length, the jet becomes instable and breaks up into single droplets due to Rayleighinstabilities.
15

2 Background
Both dripping and jetting are controlled by process parameters such as the flow
forces acting during droplet detaching and the material parameters of the fluid.
2.3.1 Forces acting on a droplet detaching at a pore
In principle droplet detachment can be divided into three steps. At the end
of the first step the fluid forming the droplet reaches the opening of the pore.
From that point on, droplet formation above the pore starts. This step is called
expansion step, wherein the droplet phase first forms a hemisphere at the pore
opening. When the droplet expansion reaches a critical point a constriction of the
droplet takes place right above the pore opening. The droplet is connected to the
pore with a tube-like neck as long as the detaching forces arc small (Bals, 2002).When the forces acting on the droplet are in balance the step of detaching of the
droplet starts (Schröder, 1999). Finally, the droplet detaches off the pore opening.Van der Graaf et al. (2005) recently observed that the continuous phase intrudes
into the pore, when a neck starts to be formed. In the same publication the authors
could determine that the droplet detachment starts on the opposite side of the
continuous phase flow direction at the pore opening when hexadecane dropletsare formed in water. In contrast droplet formation in aqueous ethanol solutions
starts at a distance from the pore opening and for droplets with Tween 20 the
droplets do not snap off at the opposite side of the pore opening of the continuous
phase flow direction, but near the pore opening on the side of the pore facing the
continuous flow. These results show clearly the dependency of the mechanism on
the material used for the emulsification process.
Most of the models describing droplet detachment are based on a force balance
on the droplet. The forces acting on a droplet determine the droplet formation
and detachment (Wang and Wang, 2000). These forces can be classified in holdingand detaching forces. The first mentioned forces hold the droplet on the pore or
membrane surface, the second one detach the droplet from the pore or membrane
surface. When the detaching forces become stronger than the holding forces, the
droplet begins to pinch off and breaks away.
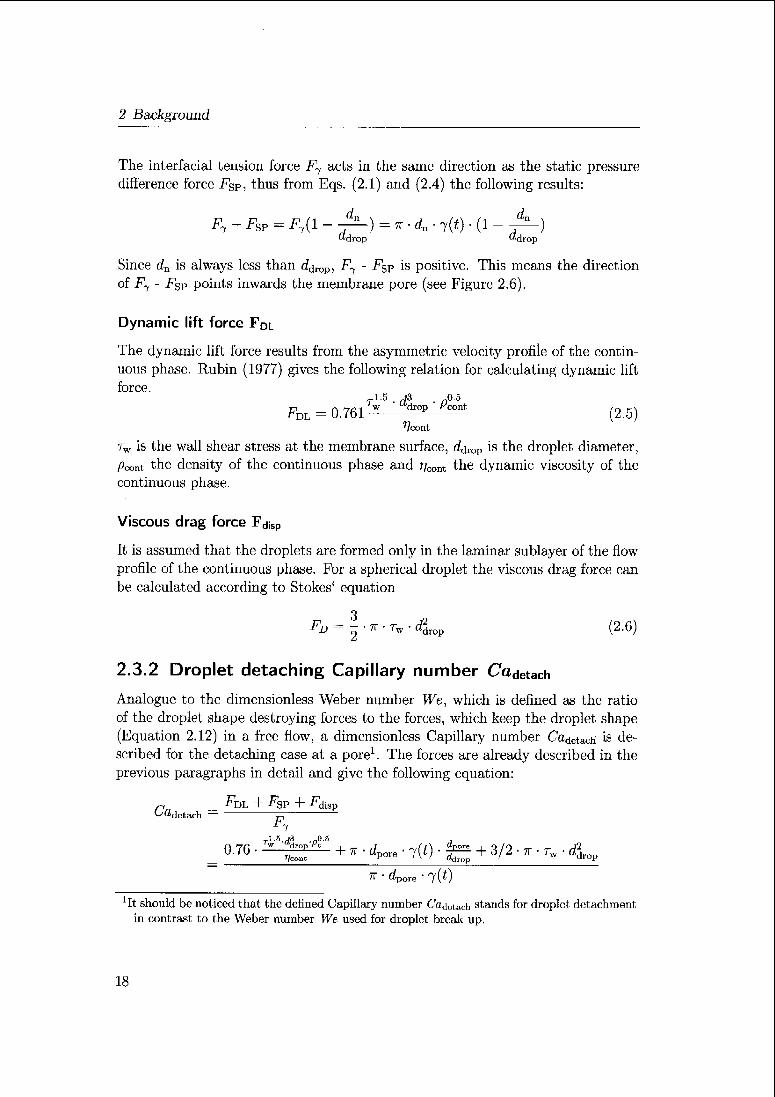
The main forces acting on a droplet before its detachment are schematicallyshown in Figure 2.6. Among the occurring forces, the interfacial tension force
F7 is a holding force, while static pressure difference force FSp, the dynamic lift
force FDL and the viscous drag force Fdisp are detaching forces. An increase in
F1 ~ F$p results in larger droplet diameter at detachment, while an increase in
Fdl and Fd[sp will decrease the diameter of the droplets at detachment. The other
forces like the inertial force, buoyancy force and gravity force are negligible in our
calculation.
The main force for holding the droplet at the pore is the time dependent inter-
facial tension force F7(£). It represents the effect of the adhesion of the dropletaround the edge of the pore opening, and the direction of the force is to act against
16

2.3 Droplet formation on a single pore
Figure 2.6: Schematic diagram of forces acting on a droplet detaching from a
membrane pore.
the droplet detachment. In the following, the force balance depicted in Figure 2.6
is discussed in more detail.
Interfacial tension force F7
F7 = ir • d • 7(t) (2.1)
wherein j(t) is the time dependent interfacial tension, d is the droplet diameter
which is dpore for the expansion step, and the smallest neck diameter dn for the
step of detachment.
Static pressure difference force FSP
The static pressure difference force FgP is a force due to static pressure difference
between the disperse phase and the continuous phase.
^SP = (Pdisp - Pcoirt)Ai (2.2)
with pdisp as the pressure of the disperse phase on the membrane surface, jDcont
as the pressure of the continuous phase on the membrane surface and Am the
membrane surface area. Eq. (2.2) can be rewritten for a quasi-static state as
follows:
Pdisp-
Pcont = Apdik (2.3)
Here Apd.k is the pressure difference, which is necessary to overcome the capillaryeffect
An-4'7(t)
udrop
with rfdrop as the droplet diameter. For the static pressure difference force results
(2.4)rsp — ,
~
—:— — r-,
"drop74drop
17
2 Background
The interfacial tension force F1 acts in the same direction as the static pressure
difference force Fgp, thus from Eqs. (2.1) and (2.4) the following results:
F7-Fsp = JRy(l-^-) = 7r-dB-7(*)-(l-^)"drop "drop
Since da is always less than <idrop! F1 - Fgp is positive. This means the direction
of F1 - Fgp points inwards the membrane pore (see Figure 2.6).
Dynamic lift force FDL
The dynamic lift force results from the asymmetric velocity profile of the contin¬
uous phase. Rubin (1977) gives the following relation for calculating dynamic lift
force.1.5
.
J3.
„0.5
FBL = 0.761^- 'drQp (cont(2.5)
^/cont
tw is the wall shear stress at the membrane surface, ddrop is the droplet diameter,
/Wt the density of the continuous phase and r/COIlt the dynamic viscosity of the
continuous phase.
Viscous drag force Fdisp
It is assumed that the droplets are formed only in the laminar sublayer of the flow
profile of the continuous phase. For a spherical droplet the viscous drag force can
be calculated according to Stokes' equation
3FD = - TV rw • c4op (2.6)
2.3.2 Droplet detaching Capillary number Caaetach
Analogue to the dimensionlcss Weber number We, which is defined as the ratio
of the droplet shape destroying forces to the forces, which keep the droplet shape
(Equation 2.12) in a free flow, a dimensionless Capillary number Cödotach is tie-
scribed for the detaching case at a pore1. The forces are already described in the
previous paragraphs in detail and give the following equation:
n _
-PdL + -FsP + ^disp(-^detach
—
&
0-76-!Jd|^+^^e-7(0-^ + 3/2.7r-rw-dLp7T • dpore • 7(i)
xIt should be noticed that the defined Capillary number C'adctach stands for droplet detachment
in contrast to the Weber number We used for droplet break up.
18
2.4 Flow behaviour in a Taylor Couette geometry
With the simplification1.5 m 2 • 0.76
and further transformations the following equation results:
x-t "drop "drop 7"w '
"drop i* . y^w Ptont '
"drop-.«-'«detach — ~. 1" -:
'
7TT" U H J
"pore »'pore 1\~) ^cont ' TT
Recalling the definition of the dimensionless Weber number We in Equation 2.12
it is shown that the Capillary number Cßdetach f°r the droplet detachment at a
pore includes the Weber number We, which describes the droplet break up in a
free flow. The additional terms respects the influence of the geometry of the pore
on droplet detachment.
2.4 Flow behaviour in a Taylor Couette geometry
The term Taylor Couette flow refers to the laminar flow of a viscous liquid in
the space between two coaxial cylinders with one of the cylinder rotating at some
angular velocity relative to the other cylinder (Baier et al, 2000). In most appli¬cations the outer cylinder is fixed, while the inner one rotates. Depending on the
rotational speed, the flow of the liquid inside the gap can be adjusted to differ¬
ent regimes ranging from laminar over vortices to various degrees of turbulence.
Since Taylor's pioneering paper (Taylor, 1923), this flow has received attention
in numerous studies. Also the number of applications in different fields is con¬
stantly increasing. It is used, when the radial mixing should be high, while keepingthe shear rate and the axial mixing as low as possible, which should be the case
for example in filtration processes. The efficiency for filtration processes can be
increased compared to laminar flows, when a rotational crossflow filtration appa¬
ratus is used in the Taylor Couette regime as it was shown in Breitschuh (1998).Emulsification process, by using a ROME, was only done by Vladisavljevic and
Williams (2006), but they did not enter the regime of vortices or turbulences in
the annulus. In contrast, the extension to flow of two liquid phases or emulsions
in a Taylor Couette geometry has received relatively little attention.
Taylor Couette flow develops with the rotational speed of the inner cylinder.For low rotational speeds of the inner cylinder a laminar flow can be observed.
For a practical description of the laminar flow field the dimensionless rotational
Reynolds number iüerol was defined and used according to Breitschuh (1998)
Reiot = LÜLIL1 (2.7)
wherein p is the density of the fluid in the gap width, u the angular velocity of
the rotating inner cylinder, r-, the radius of the inner cylinder and s the gap width.
19

2 Background
Figure 2.7: Taylor vortices in a Couette system with a rotating inner cylinder.
The corresponding density p in the gap width s can be calculated from
P~
S^disp '
Pdisp ~r Retint " Pcont \^"")
wherein x^ and xcout are the mass fractions of the disperse and the continuous
phase respectively.The dynamical viscosity 7? of an emulsion cannot be calculated by adding the
shares of the single phase viscosities. Since the resulting viscosity is beside the
viscosity of the disperse and the continuous phase also affected by the average
droplet size, size distribution and the applied shear-rate. Hence rheological mea¬
surements of the final emulsions under the same temperature conditions, as can be
found during the process or mathematical models for correlations, are necessary
to get the right values of the emulsion viscosity.For the laminar flow in the gap an exact solution for the velocity field exists.
The velocity v can be described as follows:
la__
JL
Ur = l>ax = 0 Vo=Ui-ri £—% (2.9)
where the indices r, 0 and ax represent the radial, azimuthal and axial directions
of the cylindrical coordinate system, respectively. The angular velocity of the
inner cylinder is denoted by ui\, while the inner and outer radii are represented by
r\ and r0, respectively. It should be noted that Equation 2.9 is the solution for
the laminar velocity field under the idealisation of infinitely long cylinders where
endwall effects are ignored; this solution is not realised exactly in an physical
experiment or simulation that includes endwall effects (Hwang and Yang, 2004).When the rotational speed of the inner cylinder exceeds a critical value, the
velocity profile cannot be described by a laminar Couette flow any more. This
20

2.4 Flow behaviour in a Taylor Couette geometry
intersection region between laminar and laminar vortex flow is characterised byTaylor vortices, which can be described by the dimensionless Taylor number Ta
Ta = Re,ol - J-^~ (2.10)V n + r0
In this equation, the geometrical conditions are considered in more detail, com¬
pared to the rotational Reynolds number. If the Taylor number Ta based on cjt
exceeds a first critical value (Tacrit)i), the flow instability caused by the curved
streamlines of the main flow produces axisymraetric Taylor vortices, which was
first noticed by Taylor (1923). Pairs of counter-rotating toroidal vortices appear
which surround the inner cylinder like a vortex ring shown in Figure 2.7. The
diameter of the vortices equals approximately the gap width. The critical Taylornumber Tacri^i was found to be 41.3. This value is valid for a one phase system and
a small ratio between the radius of the outer cylinder r0 and the gap width s. As
the rotational speed further increases the Taylor number reaches a second critical
value (TaCIit,2) and the Taylor vortices become unsteady and non-axisymmetric,called wavy vortices.
Independent of the flow properties and the occurrence or missing of vortices
the average shear rate 7 in a cylindrical gap can be described with the followingequation:
f = 2^-n-^~ß (2.11)'o
' i
with n as the number of revolutions.
To show clearly, that droplet size is a result of membrane detachment and not of
disruption in the shear gap the droplet destroying stress tw acting on the dropletin the annular shear gap and the droplet form conserving interfacial tension have
to be set into ratio. This ratio is described by the Weber number We.
We =
Tw ' ddrop(2.12)
4-7v '
with rw for the wall shear stress at the membrane surface, (idrop as the characteristic
length, which is the droplet diameter in this case and 7 as the interfacial tension
between the disperse and the continuous phase. The wall shear stress rw is directlyproportional to the shear rate in the gap, since the following equation is valid:
r = 77-7 (2-13)
with 77 as the dynamic viscosity of the emulsion. Droplet break up can be described
with the critical Weber number Wecrit, which describes the point from which on
droplet break up occurs. This critical Weber number is reached, when the force,which is responsible for droplet break tip is getting bigger compared to the force,which keeps the droplet shape.
21

2 Background
The mathematical description of a Taylor Couette flow is rather complex, in
particular for multiple phase systems. For a simple, but substantiated estimation
and a practical description, dimensionlcss numbers are suitable.
2.4.1 Influence of a superimposed axial flow
One of the most common emulsiflcation processes is the cross-flow emulsiflcation.
The continuous phase overflows the membrane and is responsible for droplet de¬
tachment from the pore openings and also for the transportation of the dropletsout of the emulsiflcation chamber. Additional to the simple Taylor Couette flow
an axial flow can be overlayed and influences the flow profile. The flow profile of
a simple axial flow can be described by the dimensionless axial Reynolds number
Re„ =^ (2.14)
with p as the density of the fluid, which is basically an average density of the
density of the continuous phase and the density of the emulsion. Since, at the inlet
of the membrane set-up, the pure continuous phase enters the annular gap and is
concentrated by the droplet phase along the membrane to reach the final dispersephase volume fraction ip at the end of the membrane length. The calculations arc
analogue to Equation 2.8. v^ describes the overflow velocity of the continuous
phase over the membrane surface, s the gap width of the flow channel and 77 the
average dynamical viscosity of the pure continuous phase and the emulsion.
The superimposition of a laminar Taylor Couette flow by an axial flow results in
a helical flow around the rotating inner cylinder. In the case of Taylor vortices with
a fully developed axial flow, Chung and Astill (1977) developed a linear stability
theory for the spiral flow. Gravas and Martin (1978) studied Taylor vortices in
the presence of an axial flow with various ratios of the inner radius to the fixed
outer radius. They reported that the axial flow stabilises the flow field and Tacrit,iis increased. But not only an increase of TaCIit,i was observed, also a decrease in
the torque required by rotating the inner cylinder at a given speed (Hwang and
Yang, 2004). The resulting flow profile consists of helical Taylor vortices in the
axial flow direction. Min and Lueptow (1994) studied this phenomenon more in
detail and could substantiate that the transition from laminar non-vortical flow to
vortex flow is stabilised by the axial flow, while the transition from laminar-vortex
flow to turbulent wavy vortex flow is destabilised by the superimposed axial flow.
This means, that the regime of laminar-vortex flow is more narrow than without
an superimposed axial flow. Some flow profiles appear similar to those when
there is no axial flow, except that the vortices translate with the axial flow at
a speed slightly greater than the bulk axial velocity. In contrast Wereley and
Lueptow (1999) claimed a linear superposition of the Taylor vortex flow and the
imposed axial flow. The axial velocity of the helical vortices is twice the rotational
22

2.4 Flow behaviour in a Taylor Couette geometry
frequency of the inner cylinder, indicating a coupling between the axial translation
of the vortices and the cylinder rotation. Little fluid transport between vortices
occurs for non-wavy vortices, but there is substantial transport between vortices
for wavy vortex flow.
The combination of an axial flow profile and a Taylor Couette profile can be
described with the dimensionless Rossby number Ro (also known as the Kibel
number), which describes the ratio of the inertial force to the Coriolis force for a
given flow of a rotating fluid:
Ro = |£ïïL = J^ (2.15)Rerot n • lu
with Vgx is the axial velocity, r; the radius of the rotating inner cylinder and u the
angular velocity of the rotating cylinder. When the Rossby number Ro is large,either because the axial flow is dominant or the rotational speed of the inner
cylinder is very low, the effect of the radius of the cylinder r\ can be neglected.When, in contrast, the Rossby number Ro is small, the effect of the rotation is
large and the effect of the axial flow is comparably small.
2.4.2 Influence of the radial flow
The influence of the radial flow towards the inner cylinder as well as the radiallyoutward flow for rotational crossflow filtration was studied by Min and Lueptow
(1994). They reported that the radial inflow at the inner cylinder delays the
appearance of the laminar vortex flow and prevents the appearance of certain flow
regimes that have a spiral vortex structure. That means a radial inflow stabilised
the flow profile in the gap. The Taylor vortices are shifted towards the inner
cylinder when a radially inward flow is superimposed. Experiments done by the
same authors with a radially outward flow showed different results for different
pore velocities. Radial outflow also stabilises the flow in the gap by increasing the
critical Taylor number for large Reynolds numbers in the pores. However, for small
Reynolds numbers in the pores the critical Taylor number decreases indicating less
stable flow. In contrast stability analysis indicated that an inward radial velocitystabilises the flow, while an outward radial velocity destabilised the flow (Bahl,1970). But during these analyses no attention was paid to the Reynolds number
in the pores. Nevertheless, the velocity profile is similar for all flow regimes from
the laminar vortex flow on, when a radial flow is superimposed.For a superimposition, Werclcy and Lueptow (1994) reported that in Taylor
vortex flow the radial outflow regions between vortices become more jet-like as
the Taylor number increased, probably because of the additional impact of the
centrifugal force on the outflow. On the other hand, radial inflow regions simplyprovide a route for mass conservation.
23

2 Background
P p pD D oQ 10 b
I I
(a) (b) (c)
Figure 2.8: Influence of a superimposed radial and tangential flow caused by Taylorvortices at the rotating inner cylinder on droplets at different positions.
The influence of the radial flow out of the porous inner cylinder for rotational
crossflow emulsification has not been studied up to now. The influence cannot
be described in general. Different situations have to be taken into account. The
position of the pore relative to a Taylor vortex plays an important role for droplet
creation, as it was already described briefly for a superimposed radial inflow into
the porous cylinder. In Figure 2.8 the three most relevant positions are shown.
One possible position is the pore opening right at the outflow region of a Taylor
vortex, which is shown in Figure 2.8a. A superposition leads to an increase of
the velocity of the Taylor vortex. If the resulting velocity reaches a critical value
jet-like streams can occur. Figure 2.8b shows the case, when the pore opening is
right at the inflow region of a Taylor vortex. A superimposition of the impulse of
the droplet and the inflow of the Taylor vortex results in a decrease of the radial
droplet velocity. In a worst case, it can happen that droplets are hindered from
coming out of a pore. In the third case the pore opening is positioned at the
tangential flow region of the Taylor vortex, which can be seen in Figure 2.8c. For
that case the droplet is simply detached by the velocity profile.
2.4.3 Influence of temperature
The influence of a temperature gradient between the surface of the inner cylinderand the inner wall of the outer cylinder on the Taylor Couette flow in the annulus
was studied by Becker and Kaye (1962). They found that a heated inner cylinderstabilised the flow and a heated outer cylinder destabilised it. This is only valid
when the temperature gradient is big enough. For an emulsification process an
additional cooling jacket in the outer cylinder is used. Assuming this case can
be treated like a heated inner cylinder the Taylor Couette flow is expected to
24

2.5 Emulsion rheology
be stabilised. This means, that the critical Taylor number is increased when
compared to a normal Couette flow without a temperature gradient. However,there is no detailed knowledge about the temperature gradient, which is necessary
to notice an influence.
2.4.4 Influence on the stability of an emulsion
Coalescence stability of emulsions subjected to Couette flow in laminar region was
studied by van Boekcl and Walstra (1981). They reported that Couette flow had
hardly an effect on the rate of coalescence of an emulsion that was unstable at
rest and it considerably decreased the rate of collisions leading to coalescence.
Coalescence depends on the interaction forces between droplets, type of surfac¬
tants, interparticle distance for collisions and, particularly, on the duration of an
encounter. Swift and Friedlander (1964) studied the influence of Taylor Cocuttc
flow on an emulsion stable at rest. They observed that oil-in-water emulsions that
were stable at rest, were also stable in Couette flow.
2.5 Emulsion rheology
Rheology is the study of the deformation and flow of matter, usually liquids or
fluids, and of the plastic flow of solids. The aim of rheological fluid characterisation
is to quantify the functional relationship between a deformation and the resultingshear- or normal stresses acting in the rheometric flow either under steady or
dynamical flow conditions.
The flow characteristics of emulsions are a subject of considerable importancefrom both fundamental and applied points of view. At a fundamental level, the
rheology of emulsions is a direct manifestation of the various interaction forces that
occur in the system. The various processes that occur in emulsion systems such
as creaming and sedimentation, flocculation, coalescence, Ostwald ripening and
phase inversion may be investigated using various rheological techniques (Tadros,1994). In addition, the properties of the interfacial film (surfactant, polymer or
mixture of these) can be studied from investigations of the interfacial rheology of
the film such as its viscosity and elasticity (Erni et al, 2003).The properties of the emulsion, which affect the rheological behaviour will be
described in the following. One of the most important factors that affect emulsion
rheology is the volume fraction of the disperse phase <p. In very diluted
emulsions (<p < 0.01), the relative dynamic viscosity ?7rei of the system may be
related to ip using the simple Einstein equation (as for solid/liquid dispersions)(Einstein, 1906)
*7cont
25

2 Background
As the volume fraction of the emulsion increases, the relative viscosity becomes a
more complex function of <p and a polynominal representing the variation of ?7rei
with (p is more convenient:
T?rGl = l + j^fy V
where k\ is Einstein's coefficient (equal to 2.5 for hard spheres), &2 is a coefficient
that accounts for the hydrodynamic interaction between the droplets and is equalto 6.2 (Batchelor, 1977). This term is usually sufficient to describe the viscosity
of dispersions up to ip = 0.2. Above this volume fraction, higher order interaction
terms (j > 3) are necessary.
Another factor, which influences the viscosity of the emulsion is the viscosityof the disperse phase. This problem was considered by Taylor, who extended
Einstein's hydrodynamic treatment for suspensions to the case of droplets in a
liquid medium. Taylor assumed that the emulsifier film around the droplets would
not prevent the transmission of tangential and normal stresses from the continuous
phase to the disperse phase. These stresses produce fluid convection within the
droplets, which reduces the flow circulation around them. Taylor (1923) derived
the following expression for the relative viscosity r/rei
r/rei = 1 + 2.5 —z—tp
\ ^disp + 7/cont /
wherein r/diSp is the viscosity of the disperse phase and T)cont is the viscosity of
the continuous phase. For both extreme cases, rj^isp 3> r]coni and vice versa the
equation can be simplified. For r/disp 3> 77conti as m most of the cases for O/W
emulsions, the equation reduces to the Einstein equation. On the other hand,when 77disp -C 7/cont the term in brackets becomes equal to 0.4 and the Einstein
coefficient becomes equal to 1. The Einstein coefficient can therefore assume
values between 1 and 2.5, depending the relative ratio rjdisp/r]cont. This analysis
assumes a deformable droplet which can be avoided when a surfactant or polymerfilm is present at the interface and hardened the surface of the droplet. In that
case the emulsion can be treated as a solid/liquid dispersion.The third factor that affects emulsion rheology is the droplet size distribu¬
tion. This is particularly relevant at high volume fractions. At high shear rate, the
droplets are completely deflocculated and they are equidistant from each other.
At a critical distance of separation between the droplets, which is closely con¬
nected to droplet size, the viscosity shows a rapid increase. The average distance
of separation between the droplets, h, is related to the droplet diameter ddIop bythe simple expression
Vmaxh — d,drop
yjl/3
26

2.5 Emulsion rheology
where (pmax is the maximum packing fraction, equal to 0.74 for hexagonally packed
monodisperse spheres. With most emulsions, «/Wx can reach a value higher than
0.74 as a result of polydispersity. As it can be seen clearly, with small dropletsthe critical value of h is reached at lower ip values than with larger droplets.
2.5.1 Rheology of Multiple Emulsions
The understanding of the rheological behaviour of multiple emulsions is quite im¬
portant in the formulation, mixing, processing, handling and storage of such sys¬
tems. Furthermore, rheological studies can provide useful information on the sta¬
bility and internal microstructure of multiple emulsion. While there is a substan¬
tial amount of literature published on the rheology of simple emulsions (Grmelaet al, 2001; Yu et ai, 2002), little attention has been given to multiple emul¬
sions (Pal, 1996). Nevertheless, several publications indicate that the viscosity of
the multiple W/O/W emulsions, in the Newtonian flow range, can be described
adequately by the Mooney equation (Mooney, 1951):
,
fl• ¥>i
l-Ki-ip-i
where r/rcl is the relative viscosity of the multiple emulsion (defined as the ratio
of the multiple emulsion viscosity to the external continuous-phase viscosity),ipi is the volume fraction of the primary (inner) emulsion in the whole multiple
emulsion, and K\ and K2 are empirical constants. Thus, the key factor governingthe rheology of the multiple emulsion is ip\, which is the volume fraction of the
total dispersed phase in the multiple emulsion.
Mooney's equation can be rewritten to:
^~#i + K2-ln77rpl
This expression has been found to be very useful in calculating the swelling or
shrinkage of the multiple droplets. The shrinking or swelling of the multiple
droplets occurs due to the transport of water from the internal aqueous phaseto the external aqueous phase or vice versa. The driving force for the transport
of water is the osmotic pressure gradient as well the Laplace pressure. It should
be noted that the swelling or shrinkage of the multiple emulsion droplets results
in a direct increase or decrease of ip\\ consequently, the relative viscosity of the
multiple W/O/W emulsion changes significantly with time (ageing).
27

28
3 Materials and Methods
3.1 Properties of the materials used for emulsions
3.1.1 Water
Both demineralised and tap water were used as the aqueous phase. For the ex¬
periments in the T-flow cell, as well as in the Co-flow cell to carry out data about
single droplet detachment, demineralised water was used to prevent the influence
of any impurities. After clarifying that the results of the emulsification process in
the ROME set-up were showing negligible differences (< 0.5%) while using dem¬
ineralised water or tap water, the decision was made for tap water, since it is more
economic than demineralised water.
As the dispersed phase the volume fraction varied between 5% and 40% byvolume. No additional additives were given to the water. In the case where the
water was used as the continuous phase, the emulsifiers Tween 20 and Tween 80
were applied with concentrations ranged by volume between 0.5% and 5%. For
particular experiments, to get information about the stability of multiple W/O/Wemulsions guar gum was used as a stabiliser.
3.1.2 Oil
In first experiments with the ROME set-up, different vegetable oils were tested
to produce simple W/O and O/W emulsions. Different aspects were taken into
account to make a decision for one oil. The main attention was turned to purity,but also to the degree of resin and to the aroma. After evaluation, commerciallyavailable SFO (Florin AG, Muttenz, CH) was used for every experiment (T-flowand Co-flow cell, ROME set-up and rotor stator device). No additional purification
step was necessary, since the effect of untreated and cleaned SFO was evaluated
as negligible. Furthermore, purification would have been very cost intensive and
time consuming. Also, refined SFO would not be suitable for applications in the
food industry. The density of the used SFO was 910kg-m~3 and the viscosity was
64mPa-s.
When the oil was used as the dispersed phase, the volume fraction varied be¬
tween 5 % and 40 % by volume without any additives. As the continuous phase, oil
was mixed with 0.5%, 1% and 5% by volume PGPR. First trials with oilsolublc
Span 20 and Span 80 were stopped after receiving non reproducible results.
29

3 Materials and Methods
3.1.3 Emulsifiers
Emulsifiers rediice the interfacial tension between two immiscible phases. Duringemulsification processes, this normally produces smaller droplets, which lead to
more stable emulsions. The produced emulsions had to be stabilised to keep the
properties of the emulsions constant for a certain time, wherein the measurements
could be carried out. Hence emulsifiers were added to the continuous phase in
simple emulsions and the inner continuous and the outer continuous phase in
multiple emulsions.
Polyglycerol polyricinoleate PGPR 90 (E 467; Danisco A/S, Grindsted, DK)was used as an oil soluble cmulsifier. PGPR is an synthetically derived cmulsificr
that is commonly used to replace some amount of the cocoa butter in chocolate
in lower grade candy bars, margarine, spreads and bakery products. PGPR is a
viscous liquid comprised of polyglycerol esters of polycondensed fatty acids from
castor oil. It is strongly lipophilic, fat and oil soluble and water insoluble.
As emulsifiers in the oil phase, Span 20 and Span 80 also were used for first
experiments. Since the results were not reproducible, phase inversion occured and
the emulsions were not stable over more than 2 hours, theses emulsifiers were
rejected.
Tween 20 (Polyoxyethylene (20) sorbitan monolauratc, E 432; Fluka GmbH,
Buchs, CH) is a polysorbate surfactant whose stabilising effect on the emulsion and
food-grade character allow it to be used as a detergent and emulsifier in a number
of domestic, scientific and pharmaceutical applications. It is distinguished from
other members in the Tween range by the length of the polyoxyethylene chain.
Tween 20 was used as a hydrophilic emulsifier (HLB = 16.7) in simple as well as
in multiple emulsions. The empiric formula is C^II-[u02q and the molar mass
amounts 1227.54 g-mol"1. The cmc is 34-10-3M.
Tween 80 (Polyoxyethylene (20) sorbitan monooleate; Fluka GmbH, Buchs,
CH) is a nonionic detergent and emulsifier derived from polyoxylated sorbitol and
oleic acid, and is licensed as emulsifier for food. Tween 80 was used as a hydrophilicemulsifier (HLB — 15) in simple emulsions. The empiric formula is Ce4-ff124026 and
the molar mass lSlOg-mol"1. The cmc is 11-10~3M.
3.2 T-Flow cell - A model flow cell
Droplet formation and detachment from each single pore on a membrane surface
has an enormous influence on the quality of an emulsion. Since droplet size and
droplet size distribution are among other factors caused by the detaching mecha¬
nism, this process has to be clarified for the used fluid system, in order to compass
the best results. In the presented work this was studied in a special developedT-flow cell.
30

3.2 T-Flow cell A model Row cell
CCD Camera
O
Ô
Disperse Phase
Continuous Phase
Figure 3.1: Schematic sketch of the set-up of the new developed T-flow cell. A
syringe pump is used to feed the to-be-dispersed phase. Droplet formation and
detachment is observed by a CCD camera.
Figure 3.2: The new developed T-flow cell implemented in a flow loop showingthe set-up when observing the droplet formation on a membrane from the side.
31

3 Materials and Methods
The T-Üow cell mainly consisted of a rectangular flow channel, with 230 mm in
length, 25 mm in width and a variable adjustable height between 1 mm and 10 mm.
For particular observations in a steady state, an open channel was provided. The
calculated cross section area varied between 2.5 cm x 1 cm and 2.5 cm x 0.1 cm. In
the centre of the bottom of the flow channel a membrane module with a diameter of
30 mm was placed. Membranes composed of different materials were tested in that
way. To simplify the droplet formation process also a single hole with a diameter
of 200 urn drilled in an acrylic plate was used. This assembly made it possible to
observe the detachment of a single droplet without the influence of steric hindrance
of neighbour droplets. Furthermore, the view of the camera was not obstructed
by other droplets and the process of droplet formation and detachment at a single
pore could be recorded easily. The to-be-dispersed phase was introduced via a
syringe pump (Microlab ML530B series, Hamilton Company, Bonaduz, CH) in
preselected volume flow rates into a chamber with a volume of 50 ml under the
membrane fixation. The T-fiow cell was operated statically or continuously. For a
static operation, the continuous phase was filled in the channel, which was closed
with an acrylic glass cover. In the case of continuous operation, the channel was
connected to a flow loop pump system for a continuous operation process. The
whole set-up, excluding the pumps, was mounted on a vibration free table to avoid
shocks.
The droplet formation process was recorded using a CCD-camera (DFW-V50Û,Sony) with an ultra zoom lens (Navitar, Rochester, NY, USA). The data were
sent to Fire-i (version 3) and analysed with IrfanVicw (version 3.95). The frame
rate was set at 15 to 30 frames per second, depending on the frequency of dropletformation. A shutter speed in the range of 7 ms to 22 ms was used. The flow rate
of the continuous phase varied between öOml-min"1 and 940ml-min~"1, which cor¬
responds to a velocity of 2.4cm-min"1 to 376cm-min~1 for a channel height of 1 cm
to 240 cm-miii-1 and 3760cm-min_1 for a channel height of 0.1 cm. The volume
flow rate of the disperse phase varied between 0.075 ml-min-1 and 0.6 ml-min-1.
The corresponding pore velocities depend on the used membrane and the pore
opening area. For the case of a single pore membrane of 200 pm, the velocities
were varied between 9.95-10_4m-s_1 and 7.96m-s_1. Experiments with a channel
height of 1 mm resulted in the problem that the disperse phase touched the ceil¬
ing before detaching from the pore, even when the ratio of the flow rates of the
continuous and disperse phase were set very high. For this reason most of the
experiments were carried out with 10 mm channel height.
For each process condition, at least 15 droplets were analysed. Prior to recordingthe droplet formation and detachment, the flow loop was subjected to the process
conditions for 5 min in order to allow for a quasi steady state inside the flow
channel.
32

3.3 Co-Row cell
3.3 Co-flow cell
Most of the reported experiments on droplet formation at a single pore or capillaryin literature are performed in a Co-flow regime. For a better comparison also
experiments in a Co-flow cell were done. The tube-shaped flow cell consisted
of Duran® glass (Schott, Mainz, D) with an inner diameter of 21.96mm and a
length of 255 mm. The continuous phase was circulated by a gear pump (MCP-Zstandard, Ismatec SA, Glattbrugg, CH), whereas the dispersed phase was pumped
by a syringe pump (Hamilton, Microlab ML530B scries) through a stainless steel
capillary, which was mounted concentric in the flow channel of the continuous
phase. The capillary inner diameter was 200 urn and the outer diameter 600 urn.
Observation of the droplet detachment was effected with the same camera systemused for the T-flow cell.
3.4 Rotating membrane (ROME) set-up — A pilot
plant device
Membrane emulsification is a technique, which has been known for about 20 years.
Three distinct methods of operation are used up to now: premix membrane emulsi¬
fication, microchannel emulsification and, the most studied form, cross-flow mem¬
brane emulsification. In cross-flow membrane emulsification the to-bc-dispcrsedphase is pressed through the pores of a microporous membrane while the contin¬
uous phase flows along the membrane surface. Droplets grow at pores until, upon
reaching a critical size, they detach. Detachment is determined by the balance
between the different forces acting on the droplet. As a groat advantage comparedto conventional emulsification methods the gentle way of droplet production is al¬
ways pointed out. In this context one has also to highlight the present limitation
of the membrane technique used for emulsification. Since the detaching forces are
coupled with the flow rate of the continuous phase, the amount and concentration
of an emulsion cannot be varied easily by changing the flow velocity of the outer
Figure 3.3: Principle of the rotating membrane (ROME) set-up.
33

3 Materials and Methods
Figure 3.4: Photography of the rotating membrane (ROME) with a coated CPDN
membrane.
phase without influencing the droplet size and size distribution. Furthermore the
disperse phase volume fraction cannot be varied in a wide range by changing the
throughput of the droplet phase, because of the linear correlation between the
disperse phase flow and the transmembrane pressure. When the transmembrane
pressure is too high the membrane can be destroyed. As a third limitation, which
is actually a consequence of the two phenomena mentioned before, it is obvious
that the product flow rate cannot be set independent of the disperse phase frac¬
tion, since the continuous phase flow has to be adapted to the disperse phase flow
rate. But for industrial applications techniques with high flow rates arc essential
according to economical aspects.
Following these limitations as a guideline, a new concept was developed. The
shear stress was de-coupled off the flow rate of the continuous phase. This was
realised in a new ROME set-up. The cylindrically fixed membrane is rotating in
a gap with variable width s, while the to-be-dispersed phase is pressed from the
inner part of the cylinder through the membrane. Droplets are formed at the
pores and are detached by the forces based on the rotation. The continuous phaseflows over the membrane surface in the annular gap and carries along the droplets.Afterwards, the emulsion is transported out of the apparatus. The axial flow of
the continuous phase accepts the role of transportation and is not responsible any
more for droplet detachment, as shown in Figure 3.3.
34
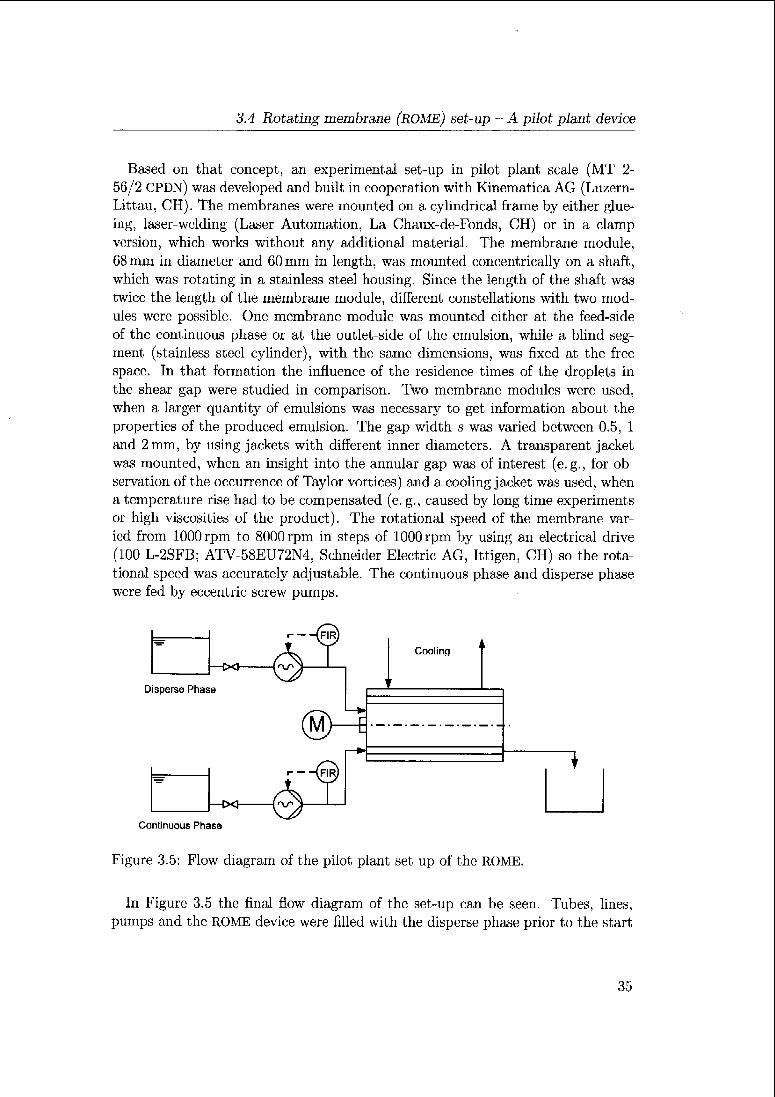
3.4 Rotating membrane (ROME) set-up - A pilot plant device
Based on that concept, an experimental set-up in pilot plant scale (MT 2-
56/2 CPDN) was developed and built in cooperation with Kinematica AG (Luzern-Littau, CH). The membranes were mounted on a cylindrical frame by either glue¬
ing, laser-welding (Laser Automation, La Chaux-de-Fonds, CH) or in a clamp
version, which works without any additional material. The membrane module,68 mm in diameter and 60mm in length, was mounted concentrically on a shaft,which was rotating in a stainless steel hovising. Since the length of the shaft was
twice the length of the membrane module, different constellations with two mod¬
ules were possible. One membrane module was mounted cither at the feed-side
of the continuous phase or at the outlet-side of the emulsion, while a blind seg¬
ment (stainless steel cylinder), with the same dimensions, was fixed at the free
space. In that formation the influence of the residence times of the droplets in
the shear gap were studied in comparison. Two membrane modules were used,when a larger quantity of emulsions was necessary to get information about the
properties of the produced emulsion. The gap width s was varied between 0.5, 1
and 2 mm, by using jackets with different inner diameters. A transparent jacketwas mounted, when an insight into the annular gap was of interest (e.g., for ob¬
servation of the occurrence of Taylor vortices) and a cooling jacket was used, when
a temperature rise had to be compensated (c. g., caused by long time experimentsor high viscosities of the product). The rotational speed of the membrane var¬
ied from 1000 rpm to 8000 rpm in steps of 1000 rpm by using an electrical drive
(100 L-2SFB; ATV-58EU72N4, Schneider Electric AG, Ittigen, CH) so the rota¬
tional speed was accurately adjustable. The continuous phase and disperse phasewere fed by eccentric screw pumps.
[X] lr\s<
Disperse Phase
—XI I'xn
Continuous Phase
Cooling
Figure 3.5: Flow diagram of the pilot plant set-up of the ROME.
In Figure 3.5 the final flow diagram of the set-up can be seen. Tubes, lines,
pumps and the ROME device were filled with the disperse phase prior to the start
35

3 Materials and Methods
of the experiments in order to avoid gas inclusions. After preparation of the
disperse phase and the continuous phase, including stabilisers and cmulsificrs as
well as prc-emulsification, if necessary, the spiral pump of the disperse phase was
set to flow rates of 200ml-min_1. Since the axial face seal between the shaft and
the gap had to be smeared continuously by the disperse phase, it was necessary
to set the disperse phase flow rate before the shaft was rotated. Furthermore
the disperse phase volume flow rate was always kept constant at 200ml-min-1
unless otherwise noted, in order to avoid any influences of the disperse phase flow
profile. After replacing gas inclusions by the disperse phase the bleeder screws
were closed carefully. The continuous phase volume flow rate was set to volumes
between SOOml-min1 and 3800 ml-min""1, which corresponds to volume flow rate
ratios of </? — 0.05 and ip — 0.4. Both disperse and continuous phase flow rates
were controlled with volume flow rate sensors (B.I.O-Tech e. K., Vilshofen, D).Temperatures were measured continuously at both feed inlets and at the outlet of
the emulsion. The inlet temperatures amounted to room temperature with a value
21 ± 2°C. The outlet temperature of the emulsion was regulated by the cooling
jacket and was always kept under 45 °C Since the membranes were more or less
sensitive to the transmembrane pressure, a pressure sensor was mounted at the
disperse phase inlet, in order to control the progression during the emulsification
process.
When the process was considered to be stable, samples were taken for further
analysis. The process was defined stable when the transmembrane pressure, the
temperatures and the volume flow rate of the emulsion were constant for more
than one minute.
3.5 High pressure homogeniser for inner emulsion
of a W/O/W double emulsion
The inner W/O emulsion, which represents the disperse phase of the multipleemulsion was prepared by using a high pressure homogeniser (Microfluidizcr®M-110 EH, Micron"uidics, Newton MA, USA). The homogeniser was operated by
using a ceramic interaction chamber F20Y with a channel width of 75 urn in series
connexion with an module H30Z with a gap width of 200 um in a row. The disperseand the continuous phase including the emulsifier, were first gently mixed by
stirring. The two phase mix was then emulsified within 1000 bar in two passes. For
quality control samples were taken for analysis of droplet size and size distribution,which was done by using both laser diffraction and light microscopy. In addition
samples were taken for short time (maximum four weeks) stability tests.
36

3.6 Modification of the pore size and surface of microstructured membranes
3.6 Modification of the pore size and surface of
microstructured membranes
The core of the new ROME apparatus is the membrane module. The aim of the
project was to combine the advantage of a specially designed membrane with
the advantage of the new developed ROME set-up. Since emulsification processes
with different types of emulsions (w/O, O/W, W/O/w) and different compositionswere carried out over the whole period of the project, the development of a new
membrane and a new membrane module was continuoTisly adapted to the new
insights.
In the very beginning a filtration membrane, which was considered to be robust
and strong enough for the high centrifugal forces occurring during the process was
used. Since the pores were rather undefined in size and shape and the surface was
quite rough, the influences on the resulting droplet sizes and size distributions
were very complex.
Gijsbcrtsen-Abrahamse (2003) could visualise by microscopic observations that
droplets interact due to steric hindrance and collisions downstream, which effects
the droplet diameter. Steric hindrance means droplets forming at different pores
do touch each other while growing. Steric hindrance can be prevented by using a
membrane with a low porosity. The distance between the pores have to be largerthan the diameter of the droplets. However, collisions downstream in the emulsion
flow cannot be prevented by this procedure.A special membrane with uniform pore sizes and standardised pore distances
was generated to make the grade of a new membrane emulsification process.
Therefore flat photo-etched nickel based microsieves supplied by Stork Veco B. V.
(Eerbeek, NL) were used as the skeletal structure. The material is based on a
nickel alloy with 99 % purity.
The microstructurc of those membranes is developed in an electroforming pro¬
cess. A metal substrate with the negative pattern of the to be produced membraneis used as a basis. In a first step this metal sheet has to be cleaned and degreased.Second a photo-sensitive coating is applied. With an UV exposure through a photomask an image transfer takes place. After that procedure the photo-sensitive layeris treated with chemicals, which react with the lighted parts and destroy the layerat these points. After this developing step the whole sheet is rinsed and the etched
parts are washed out. As the last step the matrix will be dried.
The matrix is then fixed at the cathode in an electroforming bath. The anode
consists of nickel pellets. Nickel ions are transferred through the liquid when cur¬
rent is connected. An electronic deposition of metal molecules to matrix founda¬
tion on areas not masked with photo-resist takes place. With time this depositionis increasing and the nickel layer is growing. With this technique, the thickness of
the nickel layer can be varied by adjusting electric power and deposition time.
37
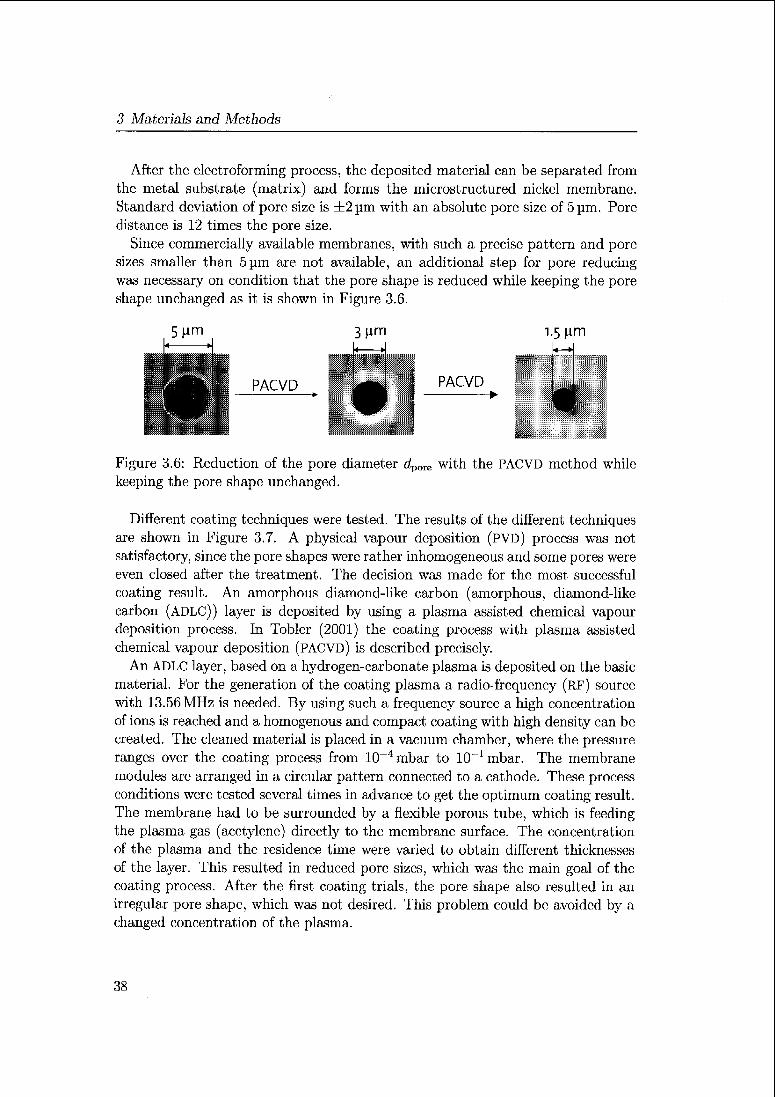
3 Materials and Methods
After the electroforming process, the deposited material can be separated from
the metal substrate (matrix) and forms the microstructured nickel membrane.
Standard deviation of pore size is ±2 urn with an absolute pore size of 5 urn. Pore
distance is 12 times the pore size.
Since commercially available membranes, with such a precise pattern and pore
sizes smaller than Sum are not available, an additional step for pore reducingwas necessary on condition that the pore shape is reduced while keeping the pore
shape unchanged as it is shown in Figure 3.6.
Figure 3.6: Reduction of the pore diameter <ipore with the PACVD method while
keeping the pore shape unchanged.
Different coating techniques were tested. The results of the different techniquesare shown in Figure 3.7. A physical vapour deposition (PVI)) process was not
satisfactory, since the pore shapes were rather inhomogeneous and some pores were
even closed after the treatment. The decision was made for the most successful
coating result. An amorphous diamond-like carbon (amorphous, diamond-like
carbon (ADLC)) layer is deposited by using a plasma assisted chemical vapour
deposition process. In Tobler (2001) the coating process with plasma assisted
chemical vapour deposition (PACVD) is described precisely.An ADLC layer, based on a hydrogen-carbonate plasma is deposited on the basic
material. For the generation of the coating plasma a radio-frequency (RF) source
with 13.56 MHz is needed. By using such a frequency source a high concentration
of ions is reached and a homogenous and compact coating with high density can be
created. The cleaned material is placed in a vacuum chamber, where the pressure
ranges over the coating process from 10~4 mbar to 10-1 mbar. The membrane
modules arc arranged in a circular pattern connected to a cathode. These process
conditions were tested several times in advance to get the optimum coating result.
The membrane had to be surrounded by a flexible porous tube, which is feedingthe plasma gas (acetylene) directly to the membrane surface. The concentration
of the plasma and the residence time were varied to obtain different thicknesses
of the layer. This resulted in reduced pore sizes, which was the main goal of the
coating process. After the first coating trials, the pore shape also resulted in an
irregular pore shape, which was not desired. This problem could be avoided by a
changed concentration of the plasma.
38
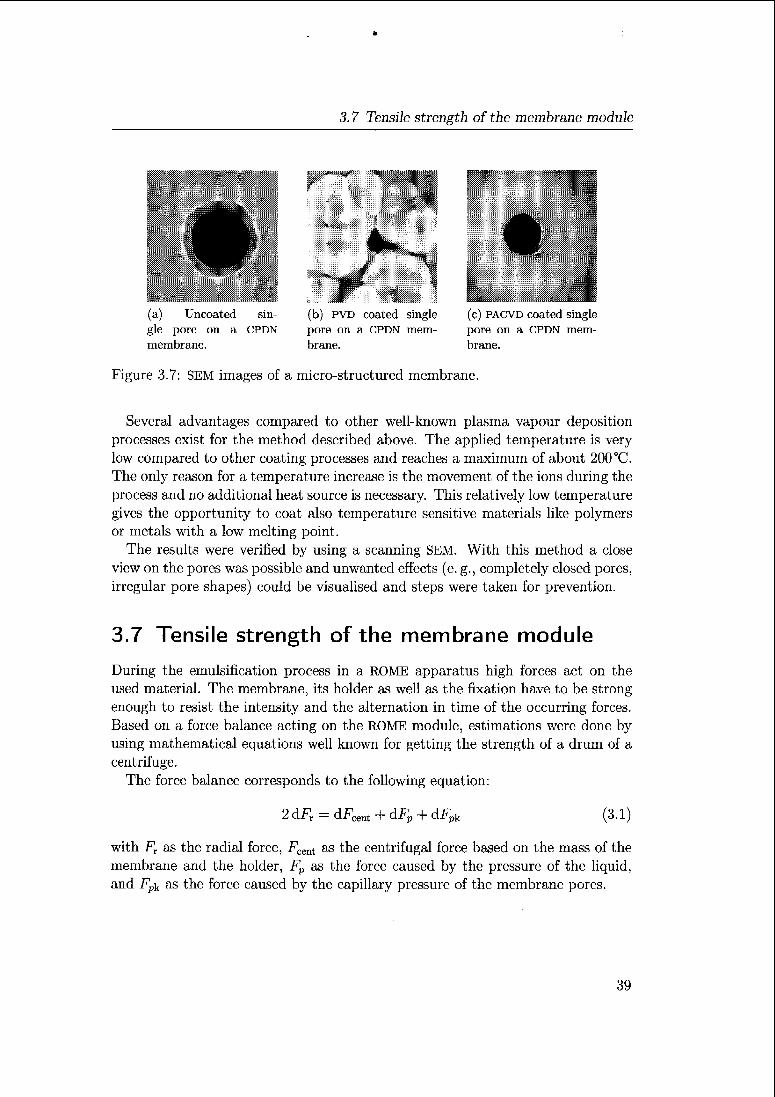
3.7 Tensile strength of the membrane module
(a) Uncoated sin- (b) PVD coated single (c) PACVD coated single
gle pore on a CPDN pore on a GPDN mem- pore on a CPDN mem-
membrane, brane. brane.
Figure 3.7: SEM images of a micro-structured membrane.
Several advantages compared to other well-known plasma vapotir deposition
processes exist for the method described above. The applied temperature is very
low compared to other coating processes and reaches a maximum of about 200 °C.
The only reason for a temperature increase is the movement of the ions during the
process and no additional heat source is necessary. This relatively low temperature
gives the opportunity to coat also temperature sensitive materials like polymersor metals with a low melting point.The results were verified by using a scanning SEM. With this method a close
view on the pores was possible and unwanted effects (e. g., completely closed pores,
irregular pore shapes) could be visualised and steps were taken for prevention.
3.7 Tensile strength of the membrane module
During the emulsification process in a ROME apparatus high forces act on the
used material. The membrane, its holder as well as the fixation have to be strong
enough to resist the intensity and the alternation in time of the occurring forces.
Based on a force balance acting on the ROME module, estimations were done by
using mathematical equations well known for getting the strength of a drum of a
centrifuge.The force balance corresponds to the following equation:
2 dFr - dFcent + dFp + dFpk (3.1)
with FT as the radial force, Fcent as the centrifugal force based on the mass of the
membrane and the holder, Fp as the force caused by the pressure of the liquid,and Fpk as the force caused by the capillary pressure of the membrane pores.
39

3 Materials and Methods
Figure 3.8: Strength of a cylindrical membrane.
The radial force, which is keeping the module in form is defined with the fol¬
lowing equation:
dFr — at • w • I • d(a/2) — ^ • crt • w • I • da
with o\ for the tensile strength of the membrane, w as the thickness of the mem¬
brane, I as the length of the membrane module and a as the central angle of the
membrane segment.
The centrifugal force Fcent is defined as:
dFcent = dmdvum • rm u2
with mdrum as the mass of the cylinder (including membrane and holder) and u>
as the angular velocity of the ROME.
The pressure force Fp is consists of the following parameters:
dFp = p - dAm = \ pdisp • to'2 (rjj - r\) I r • da
with p as the pressure at the inner membrane surface. This pressure is caused bythe rotation. pdisp is the density of the liquid inside the cylinder, uj is the angular
velocity of the rotation, T\\ is the inner radius of the membrane and rL is the radius
of the liquid, I is the length of the cylinder.
40

3.7 Tensile strength of the membrane module
The capillary pressure Fv^ is defined with the following equation:
„ Pd,k• rm
W
with pd,k for the capillary pressure in the pores.
It can be assumed that the thickness of the membrane w is very small as com¬
pared to the radius towards the middle of the thickness of the membrane rm:
w«rra
To simplify the equation further, it can be assumed that the inner part of the
cylindrical module is completely filled with the to-be-dispcrscd phase:
rL = 0
Equation 3.1 can be then solved to
°t~ (An + 0.5 • pdisp • rm/w) rfri lu2 +
Pdh'2
with the density of the membrane pm — 8900kg-m~3, p<jisp — 1000kg-m~3, rm —
29 mm and w — 90 urn. pdl>2 was assumed to be 5 bar, which is the highest value of
the transmembrane pressure allowed. The strength was calculated for the highestpossible angular velocity u, which was established by
u ~ 2 -K n
with n — 8000 rpm. The necessary tensile strength was achieved as
o-t = 261.3 MPa
Metallic nickel (which was used as the membrane material in most of the cases in
a 99% alloy) has a strength of about 403 MPa, which is about 1.54 times higher,than the required value. One has to consider that the pores in the membrane
decimate the strength of the material, which results in a decrease of the strength.On the other hand, the reinforcement on the reverse side of the membrane, which
support the membrane in a quadratic mesh is supposed to increase the strengthof the material. Additionally the membrane does not consist of pure nickel, but
is a 99 % nickel-alloy, which is also expected to increase the strength.In summary of the interaction between the influencing factors, the estimation
of the strength of the membrane on the basis of a pure nickel sheet seems to be
suitable.
41

3 Materials and Methods
3.8 Density
The densities of the different phases were mainly measured using the oscillatingU-tube method (DMA-38, Anton Paar, Graz, A). The liquid temperature was
adjusted by a Peltier element to 15 °C to 40"C with an accuracy of 0.3°C.
When phase separation of the emulsion emerges in a very short time, the os¬
cillating U-tube method is no longer beneficial. In these cases the density was
investigated by measuring the weight of a defined emulsion volume with a weightbalance and evaluating the density by using the following equation:
m
with m as the mass of the emulsion filled into the volume V.
3.9 Tensiometry
Interfacial tension measurements between droplet phase and continuous phase
were carried out by using the pendant droplet method. This method involves
the determination of the profile of a droplet of one liquid immersed in another
liquid at mechanical equilibrium between gravity and surface forces. An extensive
review of this method based on equations developed by Harkins and Brown has
been published by Miller and Fainerman (1998).Basically an oil, water or W/O-emulsion droplet was formed and maintained at
the tip of a capillary, which was submerged in the continuous phase. The capillarywas a straight needle in vertical alignment with the opening facing downward,
when the droplet phase was of higher density than the continuous phase. The
needle had to be bent, so that the capillary tip faced upwards when the phasewith the lower density was forming the droplet as it is shown in Figure 3.9.
A commercially available droplet volume tensiometer (TVT, Lauda, Lauda-
Königshofen, D), equipped with a CCD camera and combined with a software
developed by Gundc et al. (2001) and improved by Erni (2006) was used to obtain
the interfacial tension. Basically, the obtained values were used for calculatingthe dimensionless Reynolds and Taylor numbers, which describe the flow profilein the shear gap.
3.10 Particle Size and Size Distribution
3.10.1 Microscopic analysis
Microscopic analysis was done to underline and visualise the results, received bylaser diffraction analysis as well as to investigate the filling degree of the inner
42
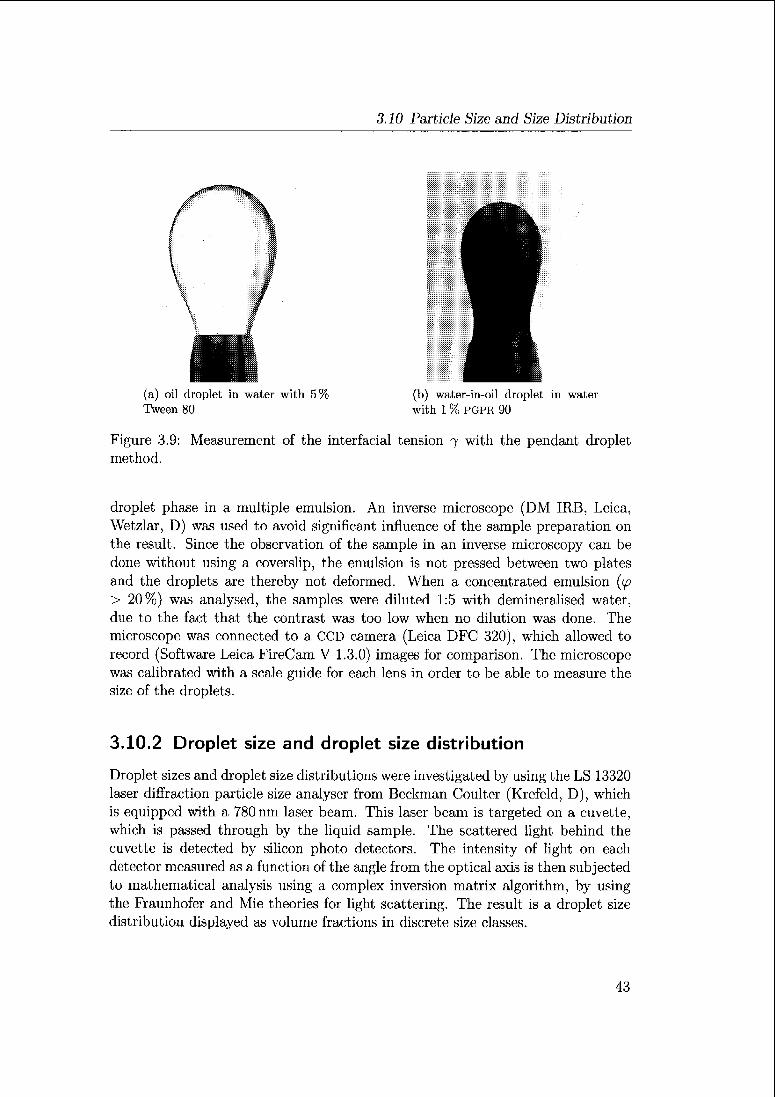
3.10 Particle Size and Size Distribution
(a) oil droplet in water with 5% (b) water-in-oil droplet in water
Tween 80 with 1 % PGPR 90
Figure 3.9: Measurement of the interfacial tension 7 with the pendant dropletmethod.
droplet phase in a multiple emulsion. An inverse microscope (DM IRB, Leica,
Wetzlar, D) was used to avoid significant influence of the sample preparation on
the result. Since the observation of the sample in an inverse microscopy can be
done without using a coverslip, the emulsion is not pressed between two platesand the droplets are thereby not deformed. When a concentrated emulsion (<p> 20%) was analysed, the samples were diluted 1:5 with demineralised water,due to the fact that the contrast was too low when no dilution was done. The
microscope was connected to a CCD camera (Leica DFC 320), which allowed to
record (Software Leica FireCam V 1.3.0) images for comparison. The microscopewas calibrated with a scale guide for each lens in order to be able to measure the
size of the droplets.
3.10.2 Droplet size and droplet size distribution
Droplet sizes and droplet size distributions were investigated by using the LS 13320
laser diffraction particle size analyser from Beckman Coulter (Krefeld, D), which
is equipped with a 780 nm laser beam. This laser beam is targeted on a cuvette,which is passed through by the liquid sample. The scattered light behind the
cuvette is detected by silicon photo detectors. The intensity of light on each
detector measured as a function of the angle from the optical axis is then subjectedto mathematical analysis using a complex inversion matrix algorithm, by usingthe Fraunhofer and Mie theories for light scattering. The result is a droplet size
distribution displayed as volume fractions in discrete size classes.
43

3 Materials und Methods
The instrument measures particle sizes over the range of 0.040 to 2000 urn. The
laser beam accurately measures particles of an apparent cross-sectional diame¬
ter above 0.39 urn, which corresponds to A/2, with A as the wavelength of the
laser light source. For particles with an apparent cross-sectional diameter below
0.39 um, the LS 13320 employs the polarisation intensity differential of scattered
light (PIDS) system, which uses polarised light of 450 nm, 600 nm, and 900 nm
wavelength. Noise reduction was done by recalculation of the achieved data by
subtracting data of the background measurements.
The procedure of sample preparation and measurements was developed and
adapted to the emulsions over the whole time of the studies, since different typesof emulsions were produced over the time. Finally, specific sequences were fixed
for particular types of emulsions. Mainly emulsions of the type W/O were treated
in a special way, since the viscosity of the oil phase is higher compared to the water
phase and problems occur during the measurements by air bubbles, disruption of
droplets and inhomogeneous distribution.
In general the emulsion was first diluted 1:5 in its corresponding continuous
phase, which means either in demineralised water or in SFO. Afterwards the
diluted emulsion was filled dropwise into the Universal Liquid Module (ULM), in
which 120 ml of the corresponding continuous phase was already circulated bya stirrer. Measurements were started, when the concentration of the dropletsexceeded a lower limit, which was given by the software of the instrument with
8% for obscuration of the laser beam and 40% for the intensity of the PIDS
lamp. The stirrer was rotating constantly with 60 % of the maximum speed (whichcorresponds to 121-h-1 pumped liquid) during filling and measurement process.
Data were recorded and transferred to the analytical software over 1 min.
A measure of the width of droplet size distribution is given by
"50,3
in terms of volume based distribution characteristics as used within this work.
Smaller span3 values represent narrower size distributions, which is a criterion for
high quality of emulsions.
3.11 Rheological characterisation
3.11.1 Viscosity Measurements
Viscosity measurements of all simple and multiple emulsions were carried out in a
rotational rheometer (Anton Paar, Physica MCP», 300, Graz, A). Viscosities were
measured using a concentric cylinder system according to DIN 53019. Analogousto the ROME apparatus the emulsions are sheared in an armulus gap between the
44

3.11 Rheological characterisation
outer cup wall and the surface of the rotating inner bob. The inner radius r\ was
13.33 mm and the outer radius r0— 14.46 mm. The rotating bob had a cone angle
of 120°. The filling volume was 22 ml. The length L of the gap was 40 mm (CC27).Emulsions were directly filled into the cup after production to avoid creaming
or sedimentation as far as possible. The emulsion was tempered to the starting
temperature before the measurement. Since the temperature profiles during the
measurements should mirror the temperature ranges during the ROME process, two
different methods were used. First, the temperature was fixed at a certain value
between 20 °C and 40 °C, while the shear rate was either fixed or increased linearlyfrom 0 to 1000 s-1; second, the temperature linearly increased from 15 °C to 45 °C
within steps of 5°C per minute, while the shear rate was fixed with 7 — 100 s""1.
3.11.2 Mathematical Model
Pal (1998) reported a model to approximate the relative viscosity. Since the shear
rate in the annulus gap of the rotating membrane (ROME) reaches values up to
24 000 s-1 it was not possible to measure the corresponding viscosities in a com¬
mon rheometcr. Beside the simple Einstein equation a more complex correlation
methods was necessary, which takes into account the effects of shear-rate, average
droplet size, droplet size distribution, viscosity of the continuous phase and vis¬
cosity of the disperse phase on the viscosity of the emulsion. Pal (1998) reportedthat a good correlation for emulsions with low to intermediate disperse phase con¬
centrations <p — 0.70 was obtained if the data were correlated as <£>max[l — VTe\ ]versus Redrop.
$max is the maximum packing concentration, and i?,e<jrop is the Reynolds number
for one droplet defined as
Pcont 7 (frj
r)re\ represents the relative viscosity and rji stands for the intrinsic viscosity, which
is defined as
_
„ r \ridiSp/Vc0nt + 0-4'7/1 — z.j
•
/ 1 1
^disp/^/cont ~T J-.
with r/disp for the viscosity of the disperse phase and r/cont the viscosity of the
continuous phase.
Calculation of maximum packing concentration $max
Pal (1998) used the theoretical expressions of Ouchiyama and Tanaka (1984) to
calculate the maximum packing concentration of emulsions. Originally this theory
45

3 Materials and Methods
was used to predict the maximum packing concentration for solid-in-liquid suspen¬
sions. Since a reasonable agreement was found for the experimentally measured
values of $raax with the theoretically calculated ones, the theoretical expressionfrom Ouchiyaina and Tanaka (1984) was used to calculate the maximum packingconcentration of emulsions. $max is given by:
E^•jji
T.(di~d) fi + -ßZ (dj + d) -(dj~dywhere ß is defined by:
h
/? = l + -(8<
+ d)2 (dj+d)u
E äj-fi-df I'
d = VJjfj
*max represents the maximum packing concentration of a monodisperse emulsion,
fj is the number fraction of droplets of diameter dj, d is the number-average
diameter of the emulsion, and the abbreviation ( d3 ~ d J is defined as:
(dj~d)=0[dj ~ dj =dj-d
for
for
dj < di
dj > d
The maximum packing concentration for monodisperse emulsions ($^) was as¬
sumed to be a cubic packing with 0.74. Pal (1998) reported that $max goes
through a maximum value.
Correlation of viscosity data
The relative viscosity of an emulsion is expected to be a function of the following
parameters:
Vrd = /(%*, $max, Äßdrop)
At any given $, 7/rei is a function of r/i, <&max and Re^op, where Redrnp is calculated
on the basis of the Sauter mean diameter rf1>2.The fitted line correlates with the following equation:
$1/2 1 r/reli/m
= ko + falogiReéropy
46

4 Results
4.1 Introduction
In this chapter the results for both, droplet formation at a single pore and emul-
sification process in the ROME apparatus are presented. First the experiments for
droplet detachment at a single pore in a T-flow cell are introduced. Using a simple
W/O system the detachment of the droplet at a pore on the membrane surface and
the effect of process parameters were studied. As the most relevant process pa¬
rameters the disperse and continuous phase flows were figured out, mainly for the
emulsion production in the newly developed ROME device. Second, experiments
with the ROME device were done systematically using model emulsion systems to
evahiate the efficiency of the apparatus and process parameters. The effects of
the flow profiles in the annular gap, gap widths s and the disperse phase volume
fraction <p were studied. A summary, including the most relevant results, is given
at the end of this chapter.
4.2 Measurements of the viscosity of the
emulsions
The dynamic viscosity rjemii of the emulsion is, beside the density p of the emul¬
sion, one main property, which has a significant influence on the behaviour of the
emulsion in flow profiles. The dynamic viscosities 77emu of the emulsion types W/O,
O/W and W/O/W were measured in a shear-rate controlled rheometer for different
disperse phase volume fractions if and applied temperatures as they appear in the
ROME apparatus. Since it was not possible to apply the same shear stress 7 as it
occurs in the rotating membrane (ROME) apparatus, calculations were done using
the Einstein equation and the Pal (1998) model to fit the data. All emulsions were
measured at 20 °C using an increasing rotational speed nof the rheometer from 0
to 1000 rpm at a rate of lOrpm-min-1.Model emulsions were prepared in a rotor stator device while the droplet size
was adjusted to be similar for different disperse phase fractions <p to avoid the
influence of different droplet sizes ddrop on the dynamic viscosity r/ernu of the re¬
sulting emulsion. Demineralised water was used for the aqueous phase and for the
oil phase, unpurified SFO. The water soluble emulsifier was Tween 20 by volume
47

4 Results
Table 4.1: Disperse phase fraction <p, respectively <p>2 for W/O , O/W and W/O/Wemulsions.
W/O O/W W/O/W
<p/<p2 0.4, 0.5, 0.6 0.1, 0.2, 0.3 0.3, 0.5
0.4, 0.5, 0.6
1 % and for the oil soluble emulsifier, PGPR 90 was used. For O/W emulsions with
the concentration 1 % by volume and in the W/O/W emulsion with 5 % by volume.
Effect of the dispersed phase fraction (p
Three types of emulsions W/O, O/W and W/O/W were produced with disperse
phase fractions if, respectively <p2 in the range between 0.1 and 0.6. A detailed
list for the studied disperse phase fractions cp for the particular type of emulsion
is given in Table 4.1.
The experiments were carried out at 20 °C in a Searle geometry described in
section 3.11.1. In Figure 4.1 the dynamic viscosities r;emil of O/W emulsions are
shown as a function of the applied rotational speed n. An increase in the disperse
phase fraction ip results in an increase of the dynamic viscosity rjeimi. While the
dynamic viscosity ?7emil is nearly constant over a wide range of the rotational
speed n a sharp bend with a sudden increase of the dynamic viscosity ?yemu can be
observed for the disperse phase fractions ip — 0.1,0.2,0.3 and 0.4. The dynamic
viscosity ijemu for ip — 0.6 instead is slightly decreasing from the rotational speedn — 100 rpm.
In Figure 4.2 the dynamic viscosities 77emu for W/O/W emulsions are shown as a
function of the rotational speed n. The inner and outer disperse phase fractions
cpi and tp2 were varied in four different combinations. The outer disperse phasefraction <p>2 was 0.3 or 0.5, while the inner disperse phase fraction tpA varied between
0.1, 0.3 and 0.4. The viscosity behaviour of an O/W emulsion with <p = 0.3 is also
plotted in this graph to show the influence of the inner disperse fraction fi in a
W/O/W emulsion. The dynamic viscosity r/cmu of the W/O/W emulsion is constant
over a wide range of the rotational speed n. For an outer disperse phase fraction
<P2 = 0.3 a sharp bend with a strong increase of the dynamic viscosity ?7emu is
observed at a rotational speed n about 550 rpm.
Similar curve progressions were achieved for W/O emulsions, which are presentedin Figure 4.3. The experiments were again carried out at 20 "C. The dynamicviscosities r)ema are shown as a function of the rotational speed n of the inner bob
of the rheometer. For disperse phase fractions <p — 0.4,0.5 and 0.6 the dynamic
viscosity 7/emu shows at relative low rotational speeds n up to 100 rpm a linear
behaviour. A further increase of the rotational speed n results in a slight decrease
48

4.2 Measurements of the viscosity of the emulsions
100
rcj
o
3
E
ou
10
IO
u phi = 0.1 ä phi = 0.2 * phi = 0.3
phi = 0.4 * phi-0.5 »phi-0.6- * * ««»««-mm..
a AAA 1 1 1 1 11 mniiiiiHnmmur-
^ A A A A A A AûAAAA,
n D n !
IOO IOOO
rotational speed n in rpm
Figure 4.1: Dynamic viscosity »7emu of an O/W emulsion with different disperse
phase fractions <p as a function of the rotational speed n of the rheometer.
100
.•? 10
OU
>
ni
T3
A phii=o.4, phi2=o.3 a phii=o.3, phi2=o.3 AO/Wphi=o.3
phh=o.3, phi2= 0.5 phii=o.i, phi2=o.B
H I i i i iïlïil
IO 100
rotational speed n in rpm
1000
Figure 4.2: Dynamic viscosity r)cmu of a W/O/W emulsion with different inner and
outer disperse phase fractions <p as a function of the rotational speed n of the
rheometer.
49

4 Results
100 -\
c
O
E
_£ 10
E
J?
o
>
AAA A AÀAAAAAAAAiiMllMMitlllaHMa
« « OMMH«MW
i phi = 0.4 a phi = 0.5 phi = 0.6
io TOO
rotational speed n in rpm
1000
Figure 4.3: Dynamic viscosity i]emn of a W/0 emulsion with different disperse phasefractions tp as a function of the rotational speed n of the rhcomcter.
of the dynamic viscosity r/emu for the disperse fraction ip — 0.4, while the dynamic
viscosity 7/erau for ip = 0.5 keeps constant. The curve for the disperse phase fraction
<p ~ 0.6 shows a sharp bend at ~ 300 rpm with a strong increase of the dynamic
viscosity 7?emu for a further increase of the rotational speed n. The differences,
compared to the results obtained with O/W and W/O/W emulsions, arc the values
of the dynamic viscosities r/emu in reversed order with respect to the values of the
disperse phase fraction <p.
For the three presented types of emulsion, the influence of the disperse phasefraction ip can be described simultaneously, since the effects for the different types
of emulsions are similar. An increase of the fluid with the higher viscosity, which is
the oil phase in the discussed case, results in an increase of the dynamic viscosity
Tfemu of the emulsion. For the individual emulsions it means an increase of the
dynamic viscosity r}emu of the emulsion for O/W and W/O/W emulsions, when the
disperse phase fraction ip, respectively <p>2 is increasing. In contrast an increase
of the disperse phase fraction </? results in a decrease of the dynamic viscosity
7/emu of W/O emulsions, since the phase with the higher viscosity (— oil phase) is
decreasing by volume. The value of the dynamic viscosity 77emu of the emulsions for
<p, respectively if2 = 0.5 is nearly the same for the three types of emulsions. While
the dynamic viscosity is r]emu = 10.8mPa-s for W/O, the relative viscosity for O/Wemulsion is r)emu — ll.OmPa-s and for W/O/W emulsion it is 77emu — 11.4mPa-s.
This means the influence of the fluid of disperse phase, water phase or oil phase,
can be neglected.
50
4.2 Measurements of the viscosity of the emulsions
The sharp bends, which were observed for all types of emulsions, can be traced
back to the occurrence of the laminar Taylor vortex regime (according to sec¬
tions 2.4 and 4.4.1). The disperse phase fraction (p influence the relative density
() and the dynamic viscosity %mu of the emulsion. These, again, have an influence
on the occurrence of the Taylor vortices. According to Equations 2.10 and 2.7
the ratio of p to n is proportional to the Taylor number Ta. While the density
p can be calculated by the mass fraction of the particular phase as it is shown
in Equation 2.15, the dynamic viscosity r/emu has to be measured for different
disperse phase fractions (p. The relative density p is increasing with an increase
of the water phase, which means an increase of the disperse phase fraction ip for
W/O emulsion and an decrease of (p for O/W and W/O/W emulsions. The dynamic
viscosity r)einu of the emulsions changes with the disperse phase fraction <p as it
is described above. That means an increase of the disperse phase fraction p, re¬
spectively <p2 for O/W or W/O/W emulsions results in a decrease of the critical
Taylor number ï'Ocrit,!- As a consequence, the occurrence of Taylor vortices needs
higher rotational speed n the higher the disperse phase fraction ip, which results
in the shifted sharp bend of the different curves in Figures 4.1 and 4.2. For W/O
emulsions, an increase of the disperse phase fraction ip restilts in an increase of
the critical Taylor number Ta^t,!, which caused the occurrence of Taylor vortices
for lower rotational speed n the higher the disperse phase fraction p as presentedin Figure 4.3.
While the critical Taylor number ï7aCTit,i for pure liquid systems has the value
of 43.1, a shift to smaller critical Taylor numbers Xiscrit.i were observed for the
emulsions systems. In Figure 4.4 the critical Taylor number racritii is plotted
against the disperse phase fraction ip of an O/W emulsion. The critical Taylornumbers Tacritti for ip — 0.1 was 28.2, for ip — 0.2 was 32.6, for p — 0.3 was
35.2 and for p — 0.4 it was 35.7. The reduction of the critical value of the
Taylor number Tacr\t can be described with the influence of the droplets in the
continuous phase. The lower the droplet concentration the stronger the reduction
of the critical Taylor number TaCIitti- One explanation for this phenomenon could
be the higher flexibility of the droplets, when the disperse phase fraction p> is very
small.
It is assumed that the Newtonian part of the curves represent the true value
of the dynamic viscosity r/emu for the emulsion also for higher shear rates. That
means an interpolation of the dynamic viscosity ?7einu to higher shear rates 7,
which appear in the ROME device, is not changing the value of the viscosity. The
measured values of the dynamic viscosity r)emu in the range of Newtonian behaviour
were used for further calculations and descriptions of the flow profile.In Figure 4.5 the relative viscosity 7/rei is plotted as a function of the disperse
phase fraction p. For disperse phase fractions p < 0.4 a linear dependency of
the relative viscosity r]Te\ of the emulsion and the disperse phase fraction p were
observed. Disperse phase fractions ip > 0.4 result in an exponential increase of the
51

4 Results
40
t 35
iS
3
c
TO
25
_
20
U
ö 15
10
0.0 o.i 0.2 0.3 0.4
disperse phase fraction <p
0.5
Figure 4.4: Critical Taylor number Thcrit,i as a function of the disperse phase <p
for 0/W emulsion in an 1 mm gap.
Table 4.2: Parameters ko and A4 to calculate the dynamic viscosity r]e
model by Pal (1998)
with the
V 0.1 0.2 0.3 0.4 0.5
di,2 pm 7.88 5.49 6.48 7.09 0-11
$ma* 0.943 0.943 0.943 0.943 0.943
ko 0.652 0.556 0.368 0.486 0.352
h 0.0426 0.0193 0.0081 0.0200 0.0102
dynamic viscosity r/emu of the emulsion. As a consequence the Einstein equationis only valid for low concentrated emulsions below a disperse phase fraction <p ~
0.4. Also for higher concentrated emulsions a theoretical model is existing. As
already described in section 3.11.2 the maximum packing concentration <&max of a
polydispersed emulsion is set in correlation to the dimensionless droplet ReynoldsNumber ifcdrop- The correlation between the maximum packing concentration
$max and the droplet Reynolds number RedTop was defined for certain ranges of
the disperse phase fraction ip. These equations were not valid with the defined
parameters k0 and A4. A fitting of the data result in another set of parameters k0and fri valid for the used model emulsion systems. These data are presented in
Figure 4.6 and Table 4.2.
52

4.2 Measurements of the viscosity of the emulsions
30
25
20
>
>
m
15
10 y = 16.01x4-0.195
R2 = 0.9765
5 S769Xy = 0.7454e
R2 = 0.9717
0.2 0.4 0.6
disperse phase fraction <p
0.8
Figure 4.5: Dynamic viscosity T]emu for emulsions with different disperse phasefractions (p, calculated with the Einstein equation
0.7
Xra
00.6
C
O
ro 0.5-M
Ceu
c O.4800
M 0.3um
CL
E 0.2
E
xre
E
0.1
• phi = 0.1
phi = 0.2
a phi = 0.3
phi = 0.4
phi = 0.5
o
1.E-05 1.E-04 1.E-03
droplet Reynolds number Redrop
1.E-02
Figure 4.6: Correlation between the maximum packing concentration <£>„the dimcnsionless droplet Reynolds Number 72edrop
and
53

4 Results
Conclusions
Measurements of the dynamic viscosity r]emu of the emulsion of O/W, W/O and
W/O/W emulsions were carried out in a Searle geometry with a shear-rate con¬
trolled method. The recipes of the emulsions were equal to those used in the
ROME apparatus to keep the comparability. The emulsions were prepared usinga rotor stator system, since only small amounts of emulsions were necessary for
the measurements. The droplet size and the droplet size distribution within the
particular types of the prepared emulsions were adjusted in order to neglect the
influence of the droplet size and size distribution on the dynamic viscosity r/emu .
In general the different types of emulsions behave like Newtonian fluids. When
the shear rates reach a critical value and the laminar Couette flow switch to a
laminar vortex flow, a strong increase in the curve of the dynamic viscosity 7/emu
is observed. This unexpected rise in the viscosity can be traced back to the
occurrence of Taylor vortices in the annular gap. As soon as the vortex flow is
shaped, this instability results in an increase of the torque M of the inner cylinderto abide the set shear rate 7. Since the wall shear stress rw corresponds linearly to
the torque M and at the same time the shear rate 7 is kept constant, the dynamic
viscosity r/Pnill is apparently increased according to Equation 2.13. In fact, the
dynamic viscosity 7yemu has the same value as it was in the laminar Couette flow.
The disperse phase fraction ip is reducing the critical Taylor number Tocrit,i.The higher the disperse phase fraction ip, the higher the resulting critical Taylornumber Tacrit,i.
Differences of the dynamic viscosities r]cmn of O/W and W/O/W emulsions for the
same disperse phase volume fraction </? are not visible. Assuming that the inner
water droplets in a W/O/W emulsion do not effect the viscoelastic flow behaviour
of the emulsion, the W/O/W emulsions can be treated as O/W emulsions.
4.3 Oil droplet formation in a T-flow cell in a
simple emulsion system
4.3.1 Introduction
To characterise the influence of the membrane wetting properties and the flow
profile on droplet formation, detachment, and droplet break up, a T-flow cell (seesection 3.2) implemented in a flow loop was used. As the to-be-dispersed phasedemineralised water was used, which was tempered to 20°C. SFO with 0.5 %, 1 %,3%, or 5% by volume PCPR 90 was used for the continuous phase, either steadyor circulated in the flow loop and adjusted also to 20°C.
Droplet formation and detachment was recorded and documented in video and
image sequences. Recording droplet detachment of a membrane surface by visual
54

4.3 Oil droplet formation in a T-ßow cell in a simple emulsion system
observation is hardly possible in most of the cases, because of the close packed
pores and the large number of droplets as a result of it. Since the observation of
droplet detachment was done parallel to the membrane surface, the view of the
camera on one pore/droplet was often screened by other droplets. To avoid this
problem and to simplify the observation a single pore membrane (pore diameter
dpore = 200 um was developed and used to obtain the data. After analysing the
droplet diameter by measuring the diameter, the results were discussed for diverse
parameters such as vcont, Qdif,p, and 7 as well as the dynamic viscosities r/ of the
continuous and the disperse phase. At the end the obtained data were comparedwith data achieved in a Co-flow cell by Cramer et al. (2004).
In general two different flow regimes were investigated during droplet detach¬
ment in the T-flow cell. Dripping appears for low flow rates of the continuous
and disperse phase. For this flow regime single droplets detach from the pore in
series. In contrast jetting develops for high disperse and continuous phase flow
rates. A jet is formed and leaves the pore, while the droplets are formed later on
out of the jet filament. Both flow regimes are schematically shown in Figure 4.7.
In the jetting regime droplets were observed about 50 mm downstream the pore,
recorded by a CCI) camera and analysed by image analysis. At that distance to the
pore opening, droplets arc already developed out of the jet filament and relaxed
to spherical shape. The velocity of the droplets is slowed down to the velocity of
the continuous phase îWt, which was necessary to take photos of the droplets.
/
(a) dripping regime (b) jetting regime
Figure 4.7: Flow regimes in a T-flow cell: Dripping and jetting.
Three different mechanisms of droplet detachment were observed. The occur¬
rence of the mechanisms depended on several parameters, which will be described
in the following section.
Most of the times the droplets detached directly at the pore opening (which was
also the case for the droplet detaching at higher velocities) as shown in Figure 4.8.
In some cases the droplet was sliding along the membrane surface after loosingthe contact to the pore, before it detached from the surface. The third variation
of droplet detaching for very small velocities 'vtont of the continuous phase was the
re-touching of the droplet with the membrane surface. The droplet size increased
over time, while the flow profile of the continuous phase deforms the droplet until
55

4 Results
Figure 4.8: Image sequence of droplet detachment at a single pore; disperse phase:demineralised water; continuous phase: 1 % by volume PGPR in SFO; Qdisp =
0.3ml-min_1, vcout — 11.95-10_3m-s_1, 0.13images-s_1.
^>27772 777, TZA 77777,
(a) regular droplet detachment
^77\ 777, T77.
(b) sliding at the surface
_^0 nOT77fy/7//, ^tA 777777,
(c) droplet retouching on the surface
Figure 4.9: Possible varieties of droplet detachment during single pore cross-flow
emulsification depending on the velocities of the continuous and the disperse phase.
the part of the droplet, which was abandoned from the upstream, touched the
surface again. Detaching from the pore opening as well as from the membrane
surface took place nearly at the same time. Since the non regular droplet detach¬
ment (case b and c in Figure 4.9) from the pores was not the focus of this work,no further detailed investigations were done at very small velocities vcotit of the
continuous phase. However it should be noted that different wetting propertiesof the membrane surface (caused by different materials and surface coatings) did
not avoid the appearance of the varieties of droplet detachment, described above,but the relevant velocity ranges were shifted.
As soon as a critical value of the velocity vcont of the continuous phase was
reached, a jet streamed out of the pore(s). The height of the jet stream had to be
smaller than the height of the channel, otherwise the jet stream touched the topof the T-flow cell. In the consequence droplet diameters afdrep were also influenced
by the break up caused by the collision with the cover and falsify the results.
For this reason experiments to determine the droplet diameter (idrop in the jetting
56

4.3 Oil droplet formation in a T-ßow cell in a simple emulsion system
regime were carried out with a flow cannel height of 10 mm. This height was
tested to be larger than the observed maximum heights of the jet streams. Even
so, the deviation of the measured droplet diameters d^op under same conditions
were bigger when compared to the results gained in the dripping regime.
Since both flow regimes can be reached easily during membrane emulsification
processes and the influence of the flow regimes on the resulting droplet diameters
efarop are significant, one focus of the analysis in the T-flow cell was the transition
from dripping to jetting.
4.3.2 Influence of vcont on droplet detachment and droplet
size
In Figure 4.10 the droplet diameter d<irop is plotted against the velocity of the
continuous phase vcont, for a fixed disperse flow rate of Qdisp — 0.3 ml-min-1. Other
disperse flow rates (Qdisp — 0.375 ml-min-1, 0.15 ml-min-1 and 0.075 ml-min-1)show a similar behaviour. For the disperse phase, dcmineralised water was used
and for the continuous phase, SFO and 1 % by volume PGPR. In the range from vcont
— 4.3-10-3 m-s-1 to 15-10-3m-s-1 dripping was observed. The droplet diameter
ddrop decreased from 3.6 mm to 2.1mm. For higher velocities of the continuous
phase vconi > 15-10-3m-s-1 jet streams were developed. The point at which
the flow of the disperse phase switched from dripping over to jetting was not
reproducible for different experiments. On the other hand when starting at high
velocity of the continuous phase vconi and reducing it stepwise the transition from
jetting to dripping was accurate and reproducible. Cramer (2004) describes a
similar effect for a Co-flow cell, in which droplets were formed at a capillary.
Starting already in the jetting regime with high velocities ucont of the continuous
phase, he reports a stepwise reduction of the velocity of the continuous phase vcoM
until the break up point moved upstream close to the capillary. Thus, an accurate,
reproducible transition point could be obtained. Analogue to his results, it was
observed that velocities of the continuous phase lower than 4.3-10-3 m-s-1 resulted
in a not reproducible droplet detachment and varied between the experimentsunder same conditions.
The reduction of the droplet diameter d^rop due to an increase of the velocity of
the continuous phase vconi can be explained by a shift in the force balance, which
affects the droplet detachment. The higher the velocity of the continuous phase
vconi, the higher the resulting wall shear stress rw, which increases the viscous
drag force Fdisp and the dynamic lift force FDL analogue Equations 2.6 and 2.5,
which both belong to the detaching forces. While simultaneously keeping the
interfacial force F7 constant, the force balance is shifted towards the detaching
forces. Droplet detachment occurs already for smaller droplet diameters cidrop7since the detaching forces are increased. This influence is independent of the flow
57
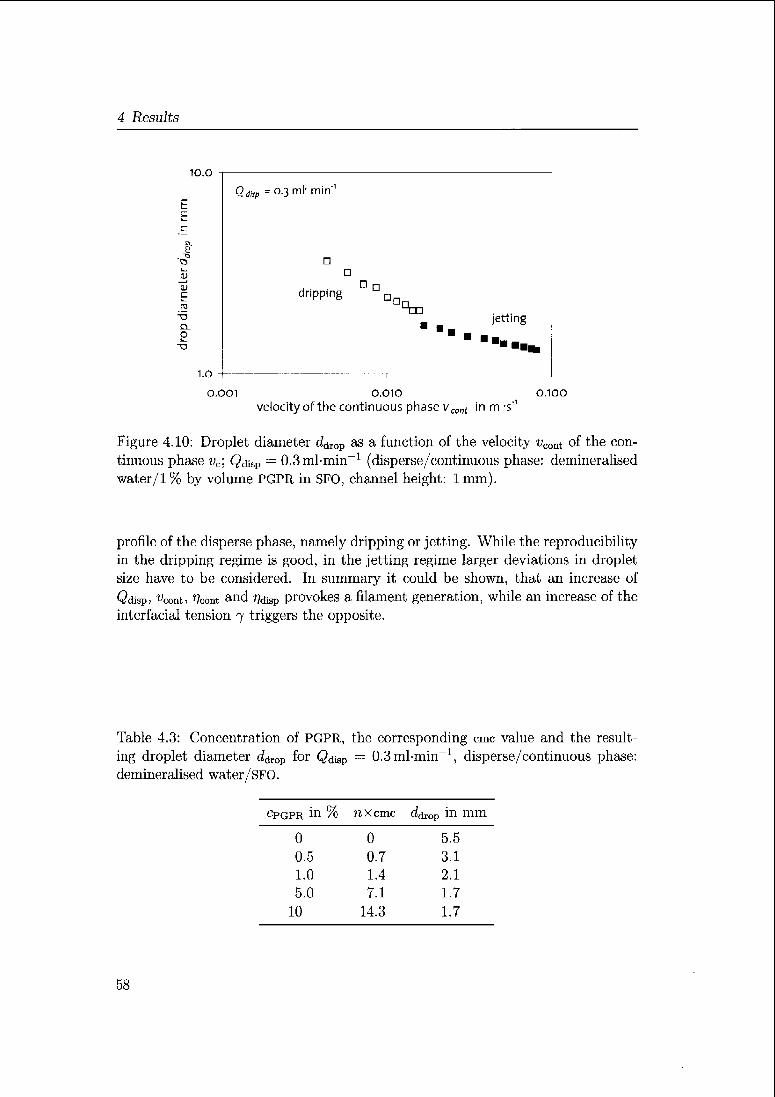
4 Results
lO.O
E
Eto
T3
Cl
Oi
Qrf/sp = 0.3 ml-min"
. . .
ü Ddripping D
CD
jetting
1.0
0.001 0.010 0.100
velocity of the continuous phase vcani in m -s"1
Figure 4.10: Droplet diameter ddrop as a function of the velocity vCOnt of the con¬
tinuous phase vc; <5disP — 0.3ml-mm-1 (disperse/continuous phase: demineralised
water/1 % by volume PGPR in SFO, channel height: 1 mm).
profile of the disperse phase, namely dripping or jetting. While the reproducibilityin the dripping regime is good, in the jetting regime larger deviations in dropletsize have to be considered. In summary it could be shown, that an increase of
Qdisp, ^cont, ?/cont and ^disp provokes a filament generation, while an increase of the
intcrfacial tension 7 triggers the opposite.
Table 4.3: Concentration of PGPR, the corresponding cmc value and the result¬
ing droplet diameter efarop f°r Qdisp — 0.3ml-min_1, disperse/continuous phase:demineralised water/SFO.
cpQPR in % nxeme Cfarop m mm
0 0 5.5
0.5 0.7 3.1
1.0 1.4 2.1
5.0 7.1 1.7
10 14.3 1.7
58

4.3 Oil droplet formation in a T-Üow cell in a simple emulsion system
10.0
E
<u
Enj
isCl
Ok_
I.O
O.OOI
0.0 vol-% PGPR
05 vol-% PGPR
1 o vol-% PGPR
50 vol-% PGPR o
dripping
o O o.
Qdlsp = 0.3 ml- min"1
0°oo00
AÄ,
A A
jetting
'a».
,
0.010 0.100
velocity of the continuous phase vcont in m -s'1
Figure 4.11: Droplet diameter d^rop as a function of the continuous phase velocity
fcont; Qdisp =- O.Sml-miir1; disperse/continuous phase: demineralised water/ 1%
by volume PGPR in SFO.
4.3.3 Influence of the interfacial tension 7 on dropletdetachment and droplet size
As shown in Figure 4.10 droplet diameter Gfarop reaches a plateau for higher ve¬
locities of the continuous phase vcont. From vçonf — 0.075 m-s"1 on the dropletdiameter ddrop is not decreasing further when the velocity of the continuous phase
^cont is increased. This limitation is caused by the interfacial tension 7 between
the two liquids. When an emulsifier is added to the continuous phase in different
concentrations (0, 0.5, 1 and 5 % by volume PGPR) the curves are shifted parallelto the ordinate, which is presented in Figure 4.11. The higher the concentration
of the emulsifier, the lower the interfacial tension 7. This results in a decrease
of the droplet diameter efarop at same flow parameters. When no emulsifier was
added it was not possible to measure the droplet size in the jetting regime, be¬
cause the droplets coalesce immediately after they developed out of the jet stream.
On the other hand side, when the concentration of the emulsifier was 5 % by vol¬
ume, which corresponded to 7.1 times the cmc value, the droplet diameter ddropdecreased only slightly compared to the droplet diameters efarop reached with an
emulsifier concentration of 1 % by volume (1.4 times the cmc). As a consequence
5 % by volume PGPR was used for the emulsification experiments done with the
ROME device, to justify the negligence of the influence of the interfacial tension 7
between the to-be-dispersed and the continuous phase.
59

4 Results
s1
<uLH
TO
_C
Q.
Ul
o
£Z
+-»
Ou
(LI
0.05
0.04
7 0.03
£
— 0.02
o
u
_o
>
0.01
jetting
dripping
vcont = 0.0067 Qd,sP'°7iAAR2 = 0.9908
o 0.1 0.2 0.3 0.4
Flow rate of the disperse phase Oölip in ml -min"1
Figure 4.12: Velocity of the continuous phase vconi as a function of the flow rate
Qdisp of the disperse phase in the transition region between dripping and jetting;
disperse/continuous phase: demineralised water/ 1 % by volume PCPR in SFO.
4.3.4 Influence of the disperse phase flow rate Qdisp on
droplet detachment and droplet size
Jetting appeared, when the velocity of the continuous phase vcont is zero and
the volume flow rate Qdisp of the disperse phase is sufficiently high enough. The
other extreme case of high velocities of the continuous phase vcout in combination
with volume flow rates of the disperse phase (2disp at almost zero, results also
in the jetting regime. Any other combination of the two parameters yCüIlt and
<9disP can be allocated either to the dripping or the jetting regime. The transition
from dripping to jetting depends on both parameters. In Figure 4.12 the velocityof the continuous phase vcont is plotted against the flow rate Qdisp of the dis¬
perse phase. For high flow rates Qdi&P of the disperse phase in the range between
0.3 ml-min-1 and 0.375 ml-min-1 moderate velocities of the continuous phase vcont
are sufficient to reach the transition point. In this case the values of vront vary
between 15.79-10~3m-s_1 and 14.57-10-3m-s-1. On the other hand side, lower
flow rates QdiSp of the disperse phase between 0.075 ml-min-1 and 0.15 ml-min-1
require higher velocities of the continuous phase vcont to reach the transition
point. Qdisp — 0.075 ml-min-1 corresponds to vconl — 46.78-10-3m-s-1, while
the transition point from dripping to jetting is reached with vcont = 25.67 m-s-1
for Qdisp — 0.15ml • m"1. A fit led to the following relation (R2 = 0.99):
Vcont- 6.7- 10-3Q,disp
60

4.3 Oil droplet formation in a T-Üow cell in a simple emulsion system
Small flow rates Qdisp of the disperse phase correspond with high values of the
velocity of the continuous phase vcont and vice versa at the transition point between
dripping and jetting. An increase of the velocity of the continuous phase wCOIlt
promote the appearance of jetting. The flow rate (Jdisp of the disperse phase can
be minimised to 0.05 ml-min"1, when vcont is reaching values of about 0.05 m-s-1
and the transition from dripping to jetting takes place.
4.3.5 Influence of the ratio of vcont to Vd,sp on the dropletdiameter ddrop in the dripping regime
In Figure 4.13 the resulting droplet diameters ddrop m dripping regimes are plotted
against the ratio of vcont to v,nsp for disperse flow rates Qdisp of 0.075 ml-min"1 to
0.375 ml-min-1. With decreasing the volume flow rate (Jdisp of the disperse phaseand increasing the velocity vcont of the continuous phase in that way, that the ratio
^cont/vdisp is kept constant, the droplet diameter ddrop is increasing. For different
disperse flow rates Qdisp, it was not possible to analyse the droplet sizes ddr0p within
the dripping regime in the same range of vcont to v^sp, because jetting occurred.
The same droplet diameters ddrop are reached for different Qdisp, when the ratio of
the continuous and the disperse phase 'uCOI1t/'üdisp is adapted. Figure 4.13 shows,that with decreasing Qdisp the ratio of vcont to i;disp has to be increased, when the
same droplet diameter ddrop should be reached.
10.o -| 1
00.375 ml/mm
0.3 ml/min
A 0.15 ml/min
x 0.075 ml/min
o
T3
I.O -I 1 1 1 r
O.OO O.IO 0.20 O.3O O4O O.5O
ratio of the phase velocities vcont/vdisp
Figure 4.13: Droplet diameter ddrop as a function of the velocity ratio of the
continuous phase and the disperse phase vCont/fdisP; water in SFO.
The data in Figure 4.13 can be discussed in three regions. The first part for small
ratios of vcout to Vd\sp shows a linear relationship between the droplet diameter
tu
ETO
-n
<H A
<0 A
\
61

4 Results
ddrop to the ratio of t>cont to t>diSp- When the flow rate Q&ap of the disperse phase
decreases, the ratio of vcotlt to v^isp has to be increased to obtain the same dropletdiameter dfoop. The slope of the curves is getting steeper, when the flow rate Qdispof the disperse phase increases. As a consequence the influence of the velocityof the continuous phase vcont diminishes at high enough flow rates Qdisp of the
disperse phase. The explanation for this phenomenon can be found in the dropletformation at the pore opening. When the flow rate QdmP of the disperse phase is
low, the droplet is growing very slowly and the shape of the droplet is at any time
a hemisphere. The droplet is shaped more elongated, when the growth rate is
higher, caused by a higher flow Qdisp rate of the disperse phase, which is basicallythe transition to the jetting regime. This deformation of the spherical shaperesults in a looser contact of the droplet to the brim of the pore opening. As
a consequence the droplet detaches from the pore earlier at higher disperse flow
rates Qdisp, when compared to a droplet with a lower growth rate.
The second part of the curve is characterised by the reduction of the slope and a
convergence to a tangent parallel to the axis of the abscissae. Again the influence
of the disperse flow rate Qdisp on the droplet diameter cfarop is higher, the higherthe value of Qdisp- The difference in the slopes of the curves compared to the curve
progression for small ratios of vcont to üdjsp can be explained with a reduction of the
influence of the velocity of the continuous phase vcoai. While in the first part, vconi
was directly proportional to the droplet diameter d^rop, when the disperse flow rate
<5disP was kept constant, the influence on the reduction of the droplet diameter
(idrop in the second part is decreasing. The third part is characterised by a more or
less tangential run of the curve parallel to a critical value of the droplet diameter
ddiop- Independent of the flow rate Qdisp of the disperse phase, an increase of the
velocity of the continuous phase vcont results in a minimum permissible value of
2 mm, which corresponds to 10 times the diameter of the pore dpare. Similar ratios
of droplet to pore diameter disp = ddropiet/^pore f°r single Pore experiments were
reported by Gijsbertsen-Abrahamse (2003); Peng and Williams (1998); Schroder
(1999), who reported values between 3 and 23 as well as 15 and 37. The critical
value of D — 10 was valid for all tested Qdisp and ratios of uCOnt to «disp- In contrast
the ratio of vcont to Vdisp varied between the different flow rates Qdisp of the disperse
phase, when the critical value is reached. The higher the flow rate Qdisp of the
disperse phase, the smaller the ratio of vconi to fdisp, when the critical value of 10
times the pore diameter dpore is reached. The difference in droplet diameter efaropfor disperse flow rates <5disP of 0.375 ml-min-1 and 0.3 ml-min"1 is negligible over
the whole curve progression and as a consequence also for the critical end value
of 2 mm. This leads to the conclusion, that an increase of the flow rate Qdisp of
the disperse phase above a critical value on docs not reduce the droplet diameter
ddrop anymore.
The disperse phase flow rate Qdisp seems to have a significant influence on the
droplet formation and as a result onthedropletdiametercfarop-InFigure4.1462

4.3 Oil droplet formation in a T-flow cell in a simple emulsion system
droplet diameter ddrop is plotted against the volume flow rate of the disperse
phase <5disP- The curves can be divided into two parts. The first part shows a
slight increase or even no change in droplet diameter ddrop! when the disperseflow rate Qdkp is increased. This was observed for Qdisp from 0.075 ml-min-1 to
0.3 ml-min-1. When the disperse flow rate Qdisp was increased further a steep
increase of the droplet diameter efarop was observed. In the region Qdisp from
0.375 ml-min-1 to 0.7 ml-min-1 droplet diameter ddmp is direct proportional to
the applied disperse flow rate Qdisp- At ucont — 0.0158 m-s-1 droplet diameters
ddiov increase slightly with rising disperse flow rate Qdisp-
4-5
E 4.0
E
r
3b
a
3-D
0)
fcni 2,ST3
Q.n
-a 2.0
1-5
0 v cont = 0 0043 m/s
D v cont = 0.0072 m/s
_
Avcont = 0.0101 m/s
X v cont = 0.0129 m/s0 0
+ vcont = 0.0158 m/sD
a
A
X
+
A
X
+
1 j 1 _, L L ,,
a
A
x
X
+ +
O.OI 0.10 1.00
disperse flow rate Qdlip in ml'min"1
Figure 4.14: Droplet diameter rjdrop as a function of the disperse flow rate Qdispfor different velocities of the continuous phase vcont in the T-flow cell; water in
SFO.
4.3.6 Comparision between Co-flow and T-flow cells
Experiments in a Co-flow cell (described in section 4.15) were carried out to com¬
pare these two droplet formation methods and detaching mechanisms with the
same fluid system. Data for these experiments are plotted analogous to Fig¬ure 4.14. The velocities of the continuous phase vcont differ slightly from the ones
applied in the experiments in the T-flow cell. Since stable flow profiles had to be
adjusted in both, Co-flow and T-flow cell, minor differences in droplet diameter
<iirop occurred, which can be neglected.Cramer (2004) studied similar flow conditions in a Co-flow cell. He was using
a mixture of water and 0.75 % K-carragcenan as disperse phase and SFO as con¬
tinuous phase. The disperse phase flow rates Qdwp were nearly the same when
63

4 Results
EE
tu
BEro
ID
Q.
O
4.0
3-5
3.0
2-5
£ 2.0
1-5
v cont = 0.0044 m/s
v cont = 0.0074 m/s
a v cont = 0.0104 m/s
xv cont = 0.0133 m/s
+ v cont = 0.0162 m/s
A
X
+
A i**
X x
+ +++ +
O.OI 0.10 1.00
disperse flow rate Od(5p in ml-min"1
Figure 4.15: Droplet diameter f/dropiet as a function of the disperse flow rate Qdispfor different velocities vcont of the continuous phase in the Co-flow cell; water in
SFO.
compared to the above described experiments, while the values of the velocities of
the continuous phase vcont were about one order of magnitude higher in his exper¬
iments. The resulting droplet diameters were 2 to 4 times smaller when comparedto the droplet diameters achieved in the T-flow cell.
The influence of the velocity vcoia of the continuous phase in the T-fiow cell is
higher when compared to the Co-flow cell. A decrease of the velocity ucont of the
disperse phase while keeping the volume flow rate Qdisp constant, results in larger
droplet sizes cfarop when compared to the results achieved in the Co-flow cell. As
a consequence the detaching forces acting on a droplet at the membrane surface
where increased in the rotating membrane (ROME) apparatus.
4.4 Experiments with the rotatingmembrane (ROME)
First a general overview of the influence of the flow profile on the resulting emul¬
sions is given based on O/W, W/O/W and W/0 model emulsions. Afterwards, the
particular effects of selected process parameters is presented.
64

4.4 Experiments with the rotating membrane (ROME)
4.4.1 Influence of the flow profile in an annular gap on the
droplet size
Emulsions can be produced using different methods and apparatus. The selection
of the cmulsification process can be based on the dispersing mechanism. In addi¬
tion, the results for the emulsification process very much depend on the properties
of the ingredients. The combination of the fluid properties and the emulsification
mechanism results in spécifie emulsion qualities. Based on that knowledge the
mechanism of droplet formation in the rotational cross-flow membrane emulsifica¬
tion apparatus was studied with respect to geometrical influences. These results
are presented in section 4.4.4. Since the influences of the apparatus as well as
of the fluid can be referred to the flow profile in the annular gap in most of the
cases, a general description of the flow regime in the annular gap is given in the
following section.
Example: oil-in-water emulsion
The disperse phase of an O/W emulsion consisted of unpurified SFO, while the
continuous phase was tap water with by volume 1 % Tween 80 as emulsifier. The
disperse phase fraction was tp = 0.1. The coated CPDN membrane module was
used with an average pore diameter dpore of 1.5 urn and an annular gap width s of
lmm.
The droplet size frequency distribution qa(lgx) of the O/W emulsion is plotted
for different rotational speeds n of the membrane in Figure 4.16. The increase of
the rotational speed n results in an decrease of the droplet size ddr0p- The size
distribution is getting wider with an increase of the rotational speed n. While the
volume density g3(lg x) for the rotational speeds 4000 rpm, 6000 rpm, and 8000 rpm
shows a monomodal distribution, the distribution for 2000 rpm is almost bimodal,
since a shoulder is detected.
A deeper insight in the flow profile is necessary to explain the results for the O/W
emulsions. When the rotational speed n of the membrane is increased, the shear
rates 7 in the annular gap, as well as on the membrane surface increase linearly
with the rotational speed n according to Equation 2.11. Higher shear rates 7
again generate an increase in the wall shear stress rw. The wall shear stress rw
provokes the droplet detachment at the membrane pores (compare section 2.3.1).The higher rw, the smaller the resulting droplet size ddvop. Thus the droplets,which are growing at the membrane pores, are detached at earlier development
stages, when the rotational speed n is increased. In other words, the droplets
are not forming a fully developed sphere, before detachment from the pores takes
place (compare section 4.3).As a representative characteristic of the droplet size distribution, the dimension-
less droplet diameter D can be chosen. To enable a comparison of data received
65

4 Results
X
no
2000 -é-4000 -«-6ooo -» 8000
0.01 0.1 1 10
drop diameter ddrop in pm
100 1000
Figure 4.16: Droplet size frequency distribution qz(lgx) of an 0/W emulsion as a
function of the droplet diameter ddrop with ip — 0.1 and a gap width s of 1 mm.
L.70
- 64.86 6544CD
| 60
ra
42.80
*
0
1/1 0 31.670
0 *
right axis
„T=300
Ë 20m
E 0
0 14.811213 10.06*
=5 10 -
0 -
0 6
1000
800
400
200
(2
E
c
>1TO
2000 4000 6OOO
rotational speed n in rpm
o
8000
Figure 4.17: Dirnensionless droplet diameter D — ddTop/dpore and dimcnsionless
Taylor number Ta as a function of the rotational speed of the membrane module.
66

4.4 Experiments with the rotating membrane (ROME)
with different pore sizes or membranes the dimensionless droplet diameter I) is
plotted as a function of the rotational speed n in Figure 4.17. Up to 2000 rpm, an
increase of the rotational speed n has no significant influence on the dimensionless
droplet size D. In the range between 2000 rpm and 5000 rpm the dimensionless
droplet diameter D is decreasing linearly with the rotational speed n. A fur¬
ther increase of the rotational speed n results, again, in a linear decrease of the
dimensionless droplet size D, but the reduction of the droplet size is slowed down.
The influence of the rotational speed n on the droplet size d^op is based on the
wall shear stress tw, which was already discussed in detail above. Leveling of the
curve for rotational speeds n above 5000 rpm can be explained by the flow profilein the annular gap. At low rotational speeds n up to 5000 rpm the flow profile in
the annular gap ean be described with a transition region. It is characterised by
the occurrence of Taylor vortices in a laminar flow. That means the flow regime
is still in a laminar range, but the Taylor vortices are completely developed. The
Taylor number Ta reaches the second critical value of Tacrjt,2 & 400 at a rotational
speed n around 4700 rpm. About Tacrit,2 the Taylor vortex flow becomes unstable
with the onset of non-axisymmetric wavy vortices. This flow profile has a reduced
influence on the droplet size of the emulsion, which can be seen in the flattening of
the curve in Figure 4.17. While the velocities of the Taylor vortices intensify the
wall shear stress tw, the influence of the wavy Taylor vortex flow on the dropletsize is reduced. Nevertheless, the droplet size d^op decreases further also in the
non-axisymmetric wavy vortex flow with increasing the rotational speed n, which
is caused by the higher shear stress 7 at the membrane surface.
Example: water-in-oil-in-water emulsion
W/O/W emulsions were prepared by using tap water for the inner and the outer
aqueous phase. While for the inner water phase Wi, pure water was used to
the outer water phase Wy a water soluble emulsifier was added; for the results
presented in this section by volume 1 % Twecn 20 was used. 5 % by volume
PCPR 90 was added as emulsifier to the oil phase O. The disperse phase fractions
were ipx — 0.3 and ^ — 0.1. A gap width s of 1mm was used.
The inner W/O eimilsion was produced in a high pressure homogeniser (Micro-fluidizer®). Two passes at a pressure of 1000 bar were necessary to achieve the
desired droplet size ddrov for the W\ phase. The W/O emulsion was the droplet
phase for the W/O/W emulsion. As the membrane module the CPDN membrane
was used.
In Figure 4.18 the droplet size frequency distribution </3(lgx) of a W/O/W emul¬
sion is plotted against the rotational speed n of the ROME. The droplet size
distribution is similar when compared to the results of the O/W emulsion. With
increasing the rotational speed n of the membrane the droplet sizes ddrop are de¬
creased.
67

4 Results
10 ÎOO
drop diameter ddrop in pm
1000
Figure 4.18: Droplet size frequency distribution g3(lg x) as a function of the dropletdiameter for a W/O/W emulsion with f2 — 0.1 and a gap width of 1 mm.
Analogue to the presented results for the O/W emulsion, the effect of the tran¬
sition from laminar Taylor vortex flow to wavy Taylor vortex flow is visualised in
Figure 4.19. Again the dimensionless droplet diameter D is decreasing with an
increase in the rotational speed n. In the transition region about TaCTlt,2 ~ 400 the
decrease in the droplet size rfdrop is flattened, but in contrast to the results achieved
for O/W emulsions the transition region starts already around TaCTnt2 ~ 350.
In general the reasons for the similar results achieved for W/O/W emulsions and
O/W emulsions are the analogous properties of their phases. The W/O/W emulsion
can be treated as oil droplets, to some extent filled with water, dispersed in the
outer continuous water phase W2. The flow profile of the continuous phase W2 in
the annular gap is the same for the O/W emulsion and the W/O/W emulsion, since
the continuous phase is identical.
Example: water in-oil emulsion
For the disperse phase, tap water was used and for the continuous phase, SFO.
The oil soluble emulsifier was by volume 1 % PGPR 90. The disperse phase fraction
was uo = 0.1 and the annular gap width s was 1 mm. The coated CPDN membrane
with a pore size of 1.5 pm was used.
In Figure 4.20 the droplet size frequency distribution q^(\.gx) is plotted as a
function of the rotational speed n. The droplet size ddrop is decreasing with an
increase of the rotational speed n. A closer look on the droplet size in Figure 4.21
reveals that the droplet sizes ddrop, which are reached for the applied rotational
speeds n are smaller than the droplet sizes G^rop obtained for the W/O/W emulsions
68

4.4 Experiments with the rotating membrane (ROME)
<LI
.—
g" I
5 «
.2 Q
c
tu
E
8o
70
6o
50
40
30
20
10
o
right axis o
o
2000 4000 6000
rotational speed n in rpm
600
500
400
cu
.0
300 3
200 ra1
100
SOOO
Figure 4.19: Dirrieiisionless droplet diameter D and the Taylor number Ta as
a function of the rotational speed n for a W/O/W emulsion with cpi — 0.3 and
V?2 — 0.1 in a 1 mm gap.
2.5
-2000 -A-4000 -«-6ooo 8000
0.01 0.1 1 io
Drop diameter ddrop in pm
100
Figure 4.20: Droplet size frequency distribution qs(lgx) as a function of the rota¬
tional speed n for a W/0 emulsion.
69

4 Results
10 -
0
iw
9' 8.43 Taylor vortex regime
- 90
8 -
0- 80
-M
1 7-656
0
*
" 70 £ni
s, .
-0 a6 -
060 5
-SO 1<= ^ 0 c
0 -a u_
\n h 4 40 0
c Q 0 >1IU ra
.1 3 "
- 30 h-
Q
2 -
1-93
140 1.48 20i.n
1<
0
)- 10
1 ' w
10 DO 3OOO 5000 7000
rotatio rial speed n in rpm
Figure 4.21: Dimensionless droplet diameter D and dimensionless Taylor number
Ta as a function of rotational speed n for W/O emulsion.
and 0/W emulsions. This phenomenon was observed for all tested W/O emulsions
also with different disperse phase fractions (p. As a result, the influence of the flow
behaviour was studied also for the W/O emulsions type.
Since the viscosity of the continuous phase 77cont in the W/O emulsions was about
60 times higher than the viscosity of the water phase in the O/W and W/O/Wemulsions the flow profiles in the annular gap are different. The values of the
dimensionless Taylor number Ta for the applied rotational speeds n ranges from
Ta = 11 to 94. These values describe a laminar Couette flow up to 7acrit,i ~ 43.1
and a laminar Taylor vortex flow up to the highest value, achieved for the W/O
emulsion. In contrast to the observed flow profiles for O/W and W/O/W emulsions,
the W/O emulsions were produced only in laminar flow fields.
Figure 4.21 shows a strong decrease of the dimensionless droplet size D at
rotational speeds n between 4000 rpm and 5000 rpm. The values of the Taylor
number Ta at that point range between Ta — 45 to 59 for W/O emulsions. As
described, detailed in section 2.4, the value for the first critical Taylor number
is ï'acrit,i ~ 43.1. The transition from laminar Couette flow to laminar Taylor
vortex flow results in a strong decrease of the droplet size. One reason for the
strong influence of the Taylor vortices on the droplet size d^rop is the additional
shear stress, acting on the droplet formed at the pore. The axisymmetric Taylorvortices apply an additional rotational speed in the annular gap in the same or
in the opposite direction as the axial crossflow of the continuous phase. Since the
angular velocity of the Taylor vortex is the same as the angular velocity of the
70

4.4 Experiments with the rotating membrane (ROME)
ROME, the rotational speed of the Taylor vortices can be calculated with
s
«vortex = 27T • U -
The absolute value of the additional velocity «vortex is large when compared to
the velocity applied by the rotational speed n of the membrane. The additional ve¬
locity for 8000 rpm and a gap width s of 1 mm for example is 0.42 m-s-1, while the
axial cross-flow velocity vcont varies between 7.16-10~5m-s_1 and 4.42-10~5m-s_1.
This means the axial velocity is increased at rotational speed of n — 8000 rpm
about 4500 times to 9500 times (depending on the disperse phase fraction ip).The narrower size distributions for increased rotational speeds n require an ad¬
ditional explanation. Surprisingly, the size distribution is getting narrower when,
in the same moment, the droplet size itself is also decreasing. One could assume
that in the case of small droplets a marginal small volume of disperse phase in
addition affects the droplet size and close connected to that the size distribution
enormously. Variations in the droplet volume can happen, when the droplet for¬
mation times, idropi between the start of a droplet development and the dropletdetachment differ slightly from each other. Since the absolute volume of disperse
phase is constant for the same droplet formation time £drop> when the volume flow
rate Qdisp is kept constant, the relative deviation of the droplet size ddrop should,in general, increase, when the droplet size ddrop decreases. One explanation for
this phenomenon can be found in the force balance at a droplet at a pore, which
was described in detail in section 2.3.1. It has to be pointed out that the force bal¬
ance as it was described in section 2.3.1 is not the precious solution for the ROME
process. Since the droplet detachment is not a static, but a dynamic process and
influenced by several parameters, the force balance can only be used as an esti¬
mation of the situation. The interfacial force F1 (Equation 2.1), which keeps the
droplet shape, is actually time dependent since the interfacial tension 7 changeswith time and the droplet size ddrop is increasing with time. The detaching forces
^sp, ^dl and /^disp are time dependent as well, mainly because the droplet diam¬
eter G?drop is changing. When the droplet formation time farop is high, which is the
case for low rotational speeds n, the development of the force balance influence
the variety of the droplet size <idroP and results in a wide droplet size distribution.
In contrast for short droplet formation times idrop at high rotational speeds n, the
detaching forces dominate the droplet detaching process, while the time depen¬dent interfacial force F1 has a minor influence. This results in a narrower size
distribution as it is shown in Figure 4.20.
Conclusions
The flow profile in the annular gap of the Couette geometry of the ROME apparatus
is influenced by the rotational speed n of the inner ROME. In general, an increase
71

4 Results
of the rotational speed n leads to a decrease in the droplet size dâmp. Dependingalso on geometrical parameters, like gap widths s, radius of the ROME r% and
radius of the outer jacket r0 and on parameters of the fluid, like dynamic viscosity
7/ and density p, the flow profile varies between laminar Couette flow, laminar
Taylor vortex flow and turbulent wavy vortex flow.
In the applied range of the rotational speed n O/W, as well as W/O/W, emulsions
were produced within laminar Taylor vortex flow and turbulent wavy vortex flow.
The transition from the laminar to the turbulent flow profile can be described
with the critical Taylor number Tacr-ltj2, which has a value of about 400. While
the effect of the Taylor vortices in the laminar flow on the droplet size d<jroP is
significant, the influence of the wavy Taylor vortices in the turbulent flow profileis less so.
For W/O emulsions the flow profile in the annular gap is characterised by a
laminar Couette flow and a laminar Taylor vortex flow. The transition from the
vortex-free Couette flow to the Taylor vortex flow is described with the critical
Taylor number Tacritji. The value of the critical Taylor number TaCIit,i is known
as about 43.1. A shift of this critical value can be caused by the disperse phasefraction ip of the emulsion, which was studied in detail and is discussed in sec¬
tion 4.4.4. The occurrence of the Taylor vortices results in a strong decrease of
the droplet size efarop-
4.4.2 Influence of the membrane type on the droplet size
One part of the presented work was the development of a new membrane for
errmlsification processes. As already discussed in section 3.6, the pore size dpmeand the pore distance are assumed to have an influence on the droplet size d^op and
size distribution of the produced emulsions. In the following, results for emulsions
manufactured with a conventional filtration mesh membrane and with the newly
developed CPDN membrane, either coated or uncoated, are compared with each
other.
O/W and W/O/W emulsions
The effect of the used membrane type depends on the emulsion type and not on
the individual properties of the emulsion (e. g., disperse phase fraction ip, type and
concentration of the emulsifier). Based on this, representative results are chosen
to show the influence of the membrane type on the droplet diameter ddrop-For the O/W type the emulsion with <p — 0.1 and 1% by volume Tween 80
is selected. The values are depicted in Figure 4.22. The dimensionless dropletdiameter D is plotted as a function of the rotational speed n for the filtration
mesh membrane and the coated CPDN membrane. Since the pore diameters dpoieof the two membrane types were different (3 um for the coated CPDN membrane
72
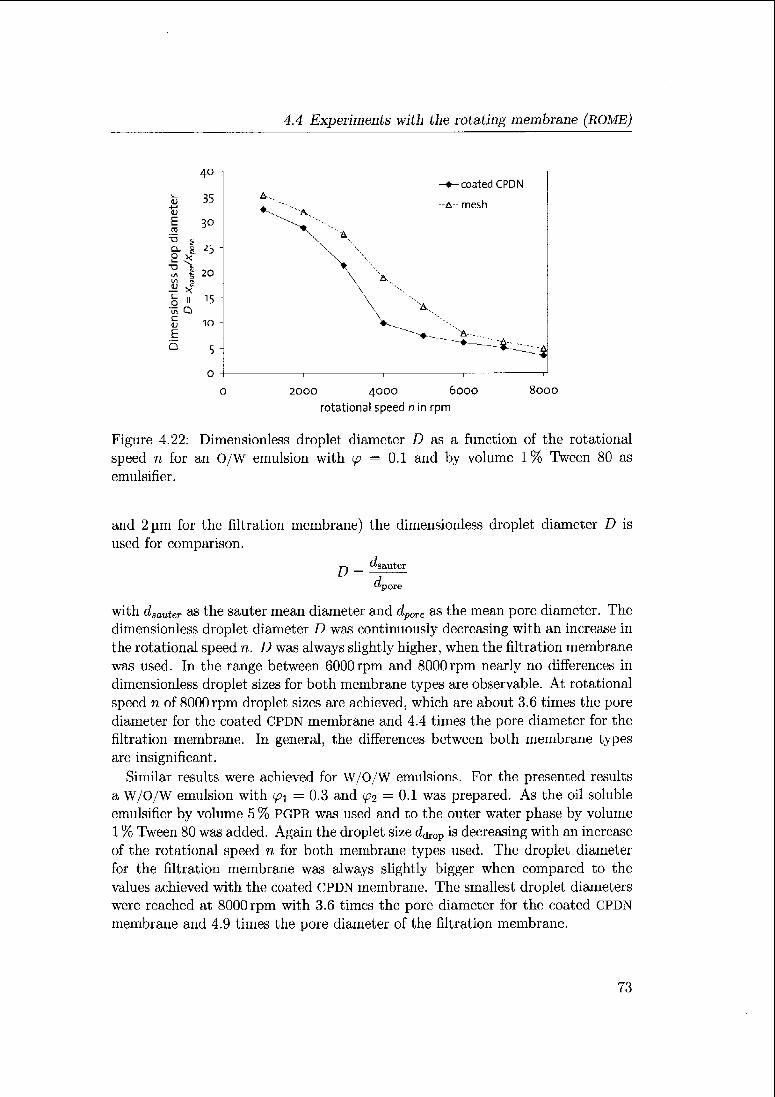
4.4 Experiments with the rotating membrane (ROME)
4°--coated CPDN
tj 35 A..~
"A..-A- mesh
E 30 - ""--.^^
'Ais (ü
Q. g. 25 "
P ><
"S ^^ I 20 \ '*•-Ü X"§ N 15w Q \ A-
Ë 10 -
E ~^+— "a-
D 5" ----*-:-^0 ! 1 t
c) 2000 4OOO 6000 8OOO
rotational speed n in rpm
Figure 4.22: Dimensionless droplet diameter D as a function of the rotational
speed n for an 0/W emulsion with ip = 0.1 and by vohimc 1% Tween 80 as
emulsifier.
and 2 pm for the filtration membrane) the dimensionless droplet diameter D is
used for comparison.
^sauterD =
-"pore
with dsauter as the sauter mean diameter and dpm.e as the mean pore diameter. The
dimensionless droplet diameter D was continuously decreasing with an increase in
the rotational speed n. D was always slightly higher, when the filtration membrane
was used. In the range between 6000 rpm and 8000 rpm nearly no differences in
dimensionless droplet sizes for both membrane types are observable. At rotational
speed n of 8000 rpm droplet sizes arc achieved, which are about 3.6 times the pore
diameter for the coated CPDN membrane and 4.4 times the pore diameter for the
filtration membrane. In general, the differences between both membrane types
are insignificant.
Similar results were achieved for W/O/W emulsions. For the presented results
a W/O/W emulsion with 93 j= 0.3 and ip2 — 0.1 was prepared. As the oil soluble
emulsifier by volume 5 % PGPR was used and to the outer water phase by volume
1 % Tween 80 was added. Again the droplet size d^p is deereasing with an increase
of the rotational speed n for both membrane types used. The droplet diameter
for the filtration membrane was always slightly bigger when compared to the
values achieved with the coated CPDN membrane. The smallest droplet diameters
were reached at 8000 rpm with 3.6 times the pore diameter for the coated CPDN
membrane and 4.9 times the pore diameter of the filtration membrane.
73

4 Results
35"
A -»--coated CPDN
Si 30 -
* "'-., a mesh
E \ "'-.,.2 25
- \ '"•'..,
£ -o120 -
V T3 15 "
C H
\ \
9 Q£ 10 -
<u
E
S 5"
A,
111
0 2000 4000 6000 8000
rotational speed n in rpm
Figure 4.23: Dimensionless droplet diameter D as a function of the rotational
speed n for a W/O/W emulsion with (p\ — 0.3 and </?2 = 0.1 and by volume 1%
Tween 80 in W2 and by volume 5 % PGPR 90 in the oil phase.
For both emulsion types O/W and W/O/W clearly an effect of the controlled pore
distance in comparison to an undefined pore system as it exists for the filtration
membrane, but is not significant as it was expected. One remarkable difference in
the progression of the curves should be pointed out: while the curve, which was
obtained for the filtration membrane, smoothly decreased, a sharp bend could
be observed for the curve achieved with the CPDN membrane. In the following
paragraphs, possible explanations are presented.
Assuming there is no droplet break up and no droplet coalescence in the bulk
occurs (as discussed in section 4.4.3), two different cases have to be considered.
Droplet coalescence might occur at the membrane surface between two neighbour¬
ing pores. Droplets grow at the pore until their diameter is bigger than the distance
to the next pore; the droplets touch each other, coalesce and the resulting bigger
droplet is detached from the membrane surface. This result in droplets twice as
big as the originally formed ones. Since not all pores arc active, also droplets with
the original droplet size of a non-coalesced droplet should exist. The pore distance
of the mesh filter is irregular and can be estimated with about 2 to 3 times the
pore diameter. As shown in Figure 4.22 and Figure 4.23 the minimal droplet size,
obtained with the filtration membrane was about 4.8 times the pore diameter for
an O/W emulsion. That means droplet coalescence occurs for all tested rotational
speeds, since the droplet diameters are always higher than the pore distances. The
situation for the CPDN membrane is different. The pore distance was defined as
20 times the pore diameter. When this value is compared with the dimensionless
74
4.4 Experiments with the rotating membrane (ROME)
droplet diameters D, it can be concluded that the transition from the coalescence
region to a non-coalescence region occurs between 2000 rpm and 4000 rpm for the
presented W/O/W emulsion and between 3000 rpm and 4000 rpm for the selected
O/W emulsion. As soon as the droplet diameters are smaller than the pore dis¬
tances, a sharp bend can be observed for the particular emulsions, which could be
an indication for the transition to a non coalescence range.
The dimensionless droplet diameters D, achieved with the CPDN membrane
are always slightly smaller than those obtained with the filtration membrane.
An explanation for this phenomenon could be the hydrophobicity of the CPDN
membrane surface. Thus the contact angle between the membrane surface and
the oil droplets detaching from the pores is very small. In contras the material of
the filtration membrane is stainless steel, which has a lower hydrophobicity.
Since the surfaces of the CPDN membrane and the filtration membrane are not
smooth, common methods to measure the wettability of the surface were not
successful. Therefore only a rough estimation of the wettability can be given.
The differences in the hydrophobicity of the used membranes could be the reason
for the slight difference in the droplet diameters ddrop-
W/O emulsion
The effect of three different membrane types on the droplet diameters was studied
using a W/O emulsion. Again, the filtration membrane module and both the un-
coated and the coated CPDN membrane with 5 urn pore diameter for the uncoated
and 3 pm for the coated type, were used. As a consequence the pore distance is
different and results in 12 times the pore diameter for the uncoated membrane
and 20 times the pore diameter for the coated membrane. The disperse phase
fraction was (p — 0.1 and the oil soluble emulsifier was by volume 0.5 % PGPR 90.
The gap width s was 1 mm.
As shown in Figure 4.24 for all tested types of membranes the droplet diameter
D is decreasing with an increase of the rotational speed n. While the largest di¬
mensionless droplet diameters D was achieved with the filtration membrane, the
smallest ones were obtained by using the coated CPDN membrane. As already dis¬
cussed in section 4.4.1 the droplet diameters d<jrop obtained for the W/O emulsion
are up to 10 times smaller when compared to the O/W and W/O/W emulsions.
Again a strong decrease in the dimensionless droplet diameter D can be observed
for the CPDN membranes (uncoated and coated) in the range between 4000 rpm
and 5000 rpm of the rotational speed n. This phenomenon cannot be explained
by the transition to a coalescence free range, since the dimensionless droplet di¬
ameter D is below the critical pore distance for all applied rotational speeds n.
Instead this decrease in the droplet diameter D is caused by the transition from
laminar flow to laminar Taylor vortex flow in the annular gap as already discussed
in section 4.4.1.
75

4 Results
tu+-*
tu
E
o ^~° è
in o
§ »
<u
E
3-5
2-5
1-5
0.5
uncoated CPDN
•-coated CPDN
A- mesh
-__A.
^
2000 4OOO 60OO
rotational speed n in rpm
8000
Figure 4.24: Dimensionless droplet diameter D as a function of rotational speed
n for W/0 emulsion with (p ~ 0.1 and by volume 1 % PGPR 90.
In contrast to the results presented for the O/W and W/O/W emulsions the dif¬
ferences between the filtration membrane and the coated CPDN membrane are
evident. The reason for the different results can be explained with the wettability
of the membrane surfaces. Since water droplets are repelled by the hydrophobi-
cally coated CPDN membrane surface, the droplet diameters cfarop are smaller when
compared to the droplet diameters ddrop achieved with the filtration membrane.
Conclusions
The effect of the two types of membranes studied for O/W and W/O/W emulsions
was very much the same. While the droplet diameters r/drop were, for the appliedrotational speeds n, nearly the same for both types of membranes, one very no¬
ticeable difference in the progression of the curves was observed. When the pore
distance for the CPDN membrane is higher than the achieved droplet diameter
ddrop the coalescence on the membrane surface is stopped and the droplet sizes
rfdrop are decreased abruptly. For a further increase of the rotational speed n the
droplet sizes efarop achieved with the filtration membrane approach the droplet size
oidrop produced with the CPDN membrane. For the rotational speed n of 8000 rpm
the droplet sizes ddrop achieved with both types of membranes had nearly the same
dimensionless droplet size D about 5 for O/W, as well as for W/O/W emulsions.
Three types of membranes were tested with W/O emulsions. In addition to
the filtration membrane and the CPDN membrane a coated CPDN membrane was
used. Compared to the uncoated CPDN membrane, the pore size d^op was reduced
76

4.4 Experiments with the rotating membrane (ROME)
from 5iim to 3 urn and, due to the carbon-like layer on the membrane surface,the surface had a higher hydrophobicity. Since the droplets in a W/O emulsion
are formed with an aqueous phase, the higher hydrophobicity of the membrane
surface provide a smaller contact angle between the droplet and the membrane
surface. As a result the dimcnsionless droplet sizes D, achieved with the coated
CFDN membrane were, over the whole range of the applied rotational speed n,
smaller than the droplet sizes achieved with the uneoated CPDN membrane and
the filtration membrane. Again, a strong increase of the droplet size <idroP c&n be
observed, when the droplet sizes got smaller than the pore sizes dpoTfi. In contrast
to the results achieved with the 0/W and W/O/W emulsions, the CPDN membranes,either coated or uneoated, pointed out as being beneficial for the droplet size.
4.4.3 Influence of the gap width s on the droplet size
Flow properties very much depend on the geometrical design of the used apparatus
as it was discussed already in section 2.4. In the ROME device the variation in
the gap width s was one possibility to take action to the aspect ratio in the
production chamber. To characterise the influence of the gap width s on dropletsize and size distribution of simple W/O and O/W emulsions as well as of double
emulsions of the W/O/W type, the width of the annular gap s was varied from
0.5 mm over lmm to 2 mm. Other geometrical factors (diameter and length of
the membrane module) were kept constant. The experiments were carried out
using a coated CPDN membrane with pore diameters of 1.5 um and eight different
rotational speeds between 1000 rpm and 8000 rpm in steps of 1000 rpm. For the
aqueous phase, tap water was used and for the oil phase, SFO. The disperse phasefractions varied between tp = 0.3 and 0.5 for the simple emulsions. In W/O/W
emulsions the inner disperse phase fraction was tp\ — 0.1 and the outer disperse
phase fraction ip2 was 0.3. These parameters are listed in Table 4.4.
O/W emulsions
In Figure 4.25 droplet diameters ddlop of O/W emulsions are plotted as a function
of the dimcnsionless Reynolds number Re. The disperse phase ratio was </? = 0.5
and as cmulsifiers either Tween 20 or Tween 80 were used in the concentration
of 1 % by volume. An increase of the gap width s leads to an increase of the
Reynolds number Re according to Equation 2.7. For shear rates 7 lower than
1000 s-1, which corresponds to d50,3 values higher than 70 urn, droplet sizes ddropvary strongly when different gap widths s were used. Since these shear rates 7
are achieved for rotational speeds of about 1000 rpm and below, one explanationfor this phenomenon could be an insufficient mixing, which was observed for these
settings. The inhomogeneous mixing is expressed by filament-like traces of emul¬
sion in the pure continuous phase at the outlet of the membrane device, which
77

4 Results
Table 4.4: Influence of the gap width s: Test parameters for 0/W and W/0 emul¬
sions.
Parameter O/W W/O
disperse phase SFO tap water
continuous phase tap water SFO
emulsifier by volume 1 % Tween 20
1 % Tween 80
0.5 % PGPR 90
disperse phase fraction ip 0.3, 0.5 0.1
gap width s 0.5 mm 1mm
1mm 2 mm
2 mm
membrane module coated CPDN membrane
pore diameter dpore — 1.5 urn
rotational speed n 1000 rpm to8000rpm
TOO
So
S6o
i_
OJ-M
E 40
T3
Cl.
I 20
û
A 0.5 mm, Tween 80
1 mm, Tween 80-0
A
Aa 2 mm, Tween 80
na 0.5 mm, Tween 20
oi mm, Tween 20
a 2 mm, Tween 20
m
0 A
gap
A
width 5
M
a
$«
A
Ä ft
o
1.E+03 6.E+03 i.E+04 2.E+04 2.E+04
Reynolds number Re
3.E+04
Figure 4.25: Droplet diameter d50j3 plotted against the Reynolds number Re for
an 0/W emulsion with <p—0.5 and either Tween 80 or Tween 20 as cmulsifier.
78

4.4 Experiments with the rotating membrane (ROME)
100
i
c
(LIf!LI
E
T3
Q.
O
8o
6o
40
20
Aa É
gap widths
0.5 mm, Tween 80
i mm, Tween 80
2 mm, Tween 80
D 0.5 mm, Tween 20
oi mm, Tween 20
A 2 mm, Tween 20
1.E+03 1.E+04 2.E+04 3.E+04shear rate y in s"1
4.E+04
Figure 4.26: Droplet diameter d50,3 plotted against the shear rate 7 for an 0/Wemulsion with ip — 0.5 and Tween 80 or Tween 20 as emulsifier.
changes to a homogeneous emulsion, when the rotational speed n is increased. An¬
other reason for the broad deviation of the droplet sizes cfarop at small shear rates 7
could be found in the analytical method for the determination of the droplet sizes.
The influence of the laser diffraction particle size analyser, in which the sample is
stirred during the measurements should not be neglected, when the droplet size
is around 100 um. Although attention was paid to reduce the frequency of the
stirrer as far as possible, while retaining satisfactory mixing, droplet break up in
the range between 70 urn to 100 um cannot be avoided completely. A third reason
for the broad dispersion of the droplet sizes at small Reynolds numbers Re could
be the relatively low detaching forces, which affect the droplets. Since the range
of the Reynolds numbers Re, in which the broad dispersion of the d50,3 values
occurs, varies between the different gap widths s, this aspect should have only a
minor influence.
In Figure 4.26 the average droplet sizes d50,3 are plotted against the shear rate
7 (according to Equation 2.11) as a function of the gap width s. A reduced gap
width s needs higher shear rates 7 to reach the same droplet size d<jr0p- Analogueto the relation between the droplet diameter d50,s and the Reynolds number Re
the values for the droplet diameter d5Q^ as a function of the shear rate 7 can be
fitted as shown in Figure 4.27. Below 70 pm, data points arc reproducible and
follow power law functions with exponents of —1.86 for gap width s of 0.5 mm,
—1.94 for a gap width s of 1 mm and —1.88 for a gap width s of 2 mm. Differences
in droplet sizes between the two emulsificrs Tween 20 and Tween 80 are not visible.
79

4 Results
100
90
E 80
.E 70
a
•qT1
+-*
CD
Eto
T3
CL
O1
T3
6O
50
40
3°
20
10
0.5 mm, Tween 80
1 mm, Tween 80
a 2 mm, Tween 80
0.5 mm, Tween 20
o 1 mm, Tween 20
A 2 mm, Tween 20
l.E+03 1.E+04 2.E+04 3.E+04
shear rate y in s"1
4.E+04
Figure 4.27: Droplet diameter d50i3 plotted against the shear rate 7 for an 0/W
emulsion with ip — 0.5 and Tween 80 or Tween 20 as emulsificrs.
Coming back to the basic idea of this work, high shear rates 7 should be avoided
for sensitive ingredients and as a consequence the wider gap widths should be
preferred, if this is required. The deviation of the droplet sizes as it can be seen in
Figure 4.28 show varies between the three gap widths. The span3, which represents
the droplet size distribution according to Equation 3.2, decreases linearly with
increasing droplet size over a wide range. One exception applies for droplets
smaller than 25 um, produced in gap widths s of 1 mm and 2 mm. A decrease in
the span3 values characterised this region of small droplet sizes, which represent
narrower size distributions and is a critérium for high quality of emulsions.
Finally a lower limit of the droplet sizes can be clearly seen for all gap widths.
The lowest ^50,3 values are in the range of 8 pm to 10 pm, which match 6.5 times
to 5.3 times the pore diameter. These ratios of the pore diameter to the dropletdiameter are in good agreement with Gijsbertsen-Abrahamse (2003).The desired decrease in the droplet size and also in the size distribution for
gap widths of 1 mm and 2 mm has to be analysed more in detail with respect to
a gentle treatment of the droplets. Since the new developed membrane emulsifi-
cation device is a combination of rotor stator and membrane emulsification, the
mechanism of droplet creation cannot be explained easily.
To show clearly, that droplet size cfarop is a result of membrane detachment
and not of disruption in the shear gap, the droplet destroying force acting on the
droplet in the annular shear gap and the droplet form conserving force have to
be set into ratio. This ratio is described by the Weber number We according to
80

4.4 Experiments with the rotating membrane (ROME)
1.8
1.6
1-4
1.2
g-1
I 0.8
o.6
0.4
0.2
o
4 *
Tween 80, 0.5 mm
Tween 80,1 mm
A Tween 80, 2 mm
*
20 40 60 80 IOO
drop diameter ds03 in pm
Figure 4.28: The span3 values are plotted against the droplet diameter ^50,3 for
an 0/W emulsion with <p — 0.5 and either Tween 80 or Tween 20 as emulsifiers.
Equation 2.12, which is repeated at this point to make the discussion easier
We =
^drop
4 7
Assuming, that droplet break up occurs in the annular gap, same maximal
droplet sizes c?drop should be achieved at same shear rates 7.
When the interfacial tension 7 is kept constant, the product of wall shear stress
rw and droplet diameter ddrop '^so has to be constant to obtain the same Weber
number We, which in the case of droplet break up is the critical Weber number
WeCI\t- When the critical Weber number W^it is achieved, it is assumed, that
droplet break up occurs, so the same droplet diameter <idrop has to be reached,when rw and 7 are constant. For the reported results the interfacial tension was not
changed between the experiments with different gap widths s and with the same
emulsifier, because the concentration was kept constant. Only for the experimentswith different emulsifiers, the interfacial tension differs slightly.
Since different droplet diameters ddrop are achieved for the same shear rate 7 and
constant interfacial tensions 7, only by varying the gap widths s as it is observable
for the results plotted in Figure 4.26 the droplet size ridrop has to be reached caused
by another mechanism, which is assumed to be the droplet detachment at the
membrane surface.
81

4 Results
0
90 -
1 80-
A
A
0/W, imm
iO/W, 2mm
% 7° 1-£ 60 -
O
0 W/O/W, l mm
a W/O/W, 2 mm
£ 50-OJ
E 40 -
A
A
O
~o 30 -
Clj
£ 20ID
10 -
A
0
A
0
^
O.E+00 5.E+O3 I.E+O4 2.E+04 2.E+04 3.E+04
shear rate y in s"1
Figure 4.29: Droplet diameter ri50j3 as a function of shear rate 7 in the annular
gap of 1mm and 2 mm in width for 0/W and W/O/W emulsions with ip — 0.3.
W/O/W emulsions
Experiments with double emulsions of the type W/O/W were done to show the
influence of the gap width « on the droplet size and on the filling degree of the
inner droplets. As the oil soluble cmulsifier 0.5 % by volume PGPR 90 was used,while the aqueous outer continuous phase was filled with 1 % by volume Tween 20.
The inner disperse phase fraction was epi =0.1 and the outer disperse phasefraction ip>2 = 0.3. Since the droplet phase W/O can be treated as filled oil dropsin an aqueous continuous phase, the analogy to the O/W type of emulsion is
obvious. Comparable results as presented for the O/W type of emulsion were
achieved for double emulsions of the W/O/W type as it is shown in Figure 4.29.
The disperse phase fraction ip2 — 0-3 was chosen to be the same as the disperse
phase fraction ip of the O/W emulsions to maintain the comparability. The slightly
bigger droplet diameters as compared to non-filled oil droplets in a simple emulsion
are explainable with the filling degree of <pi — 0.1. Nevertheless, the marginalincrease in the droplet size for W/O/W emulsion with <p>\ — 0.1 makes the ROME
device interesting for such complex emulsion systems. A detailed discussion of the
influence of the inner disperse phase fraction <p\ on the oil droplet size is given in
section 4.4.4.
Furthermore the intact W/O droplets arc another indicator for the gentle pro¬
cedure of the emulsification process, which has to be pointed out. If droplet break
up would occur in the annular gap because of high shear rates 7, the oil droplets
might loose their fillings. These unfilled oil droplets are visible in a light mi¬
croscopy. In Figure 4.31 microscopic images of a double emulsion produced at
82

4.4 Experiments with the rotating membrane (ROME)
1.8
1.6
1.4
1.2
1
a- 0.8
o.6
04
0.2
O
OAOOA
20
Tween 80,0.5 mm »Tween 80,1 mm
ATween8o, 2 mm O WOW, imm
A WOW, 2 mm
«AI
A O
4O 60 80
drop diameter d503 in pm
100 120
Figure 4.3Ü: The span3 as a function of the droplet diameter r/50i3 in the annular
gap of 1 mm and 2 mm for 0/W and W/O/W emulsions with <p — Lp2 — 0.3.
Table 4.5: Influence of the gap width s: Test parameters for W/O/W emulsion.
Parameter W/O/W
inner disperse phase Wiouter disperse/inner continuous phase 0
outer continuous phase W2emulsifier by volume
disperse phase fraction ipi
disperse phase fraction ip2
gap width s
membrane module
rotational speed n
tap water
SFO
tap water
1 % Tween 20 in W2
0.5 % PGPR 90 in O
0.1
0.3
1 mm, 2 mm
coated CPDN membrane
pore diameter dvore — 1.5 pm
lOÜOrpmtoSOOOrpm
83

4 Results
Figure 4.31: Microscopic image of W/O/W double emulsions: water-in-oil droplets,which are themselves droplets in a water phase.
6000 rpm are shown and proof the inviolacy of the filled oil droplets. Surprisinglythe span3 values of the W/O/W emulsion are in the same range as the span3 values
of the O/W emulsion, which is presented in Figure 4.30. It was expected, that the
span3 values are higher for the W/O/W emulsions compared to the span3 values
achieved for O/W emulsions, since the presence of the inner droplets should blow
up the oil droplets. Since the droplet size distribution is a critérium for the qualityof emulsions, especially for W/O/W emulsions, the fact that no further increase in
the span3 values is detectable represents the uniqueness of the ROME apparatus
once more.
W/O emulsions
W/O emulsions were produced either in a 1 mm or a 2 mm gap width. Experimentsin a 0.5 mm gap width resulted in a phase inversion. The obtained O/W emulsions
had a very broad size distribution and most of the time the droplets were largerthan 100 um. Since this phenomenon was not the main interest of this work
no further study was done on that topic. The process parameters were alreadydescribed at the beginning of this section and arc listed in Table 4.4.
W/O emulsions show different behaviours with respect to shear rate 7 for the
droplet diameter d^op when compared to the O/W and W/O/W emulsions. In
Figure 4.32 the droplet diameter dso,3 is plotted as a function of shear rate 7 for
W/O emulsions of ip — 0.1. The graph can be divided into two parts. In the first
region, below 7 <9000s_1 it can be seen that wider gap widths .s need highershear rates 7 to achieve the same droplet diameter c?drop- Above 7 > 9000 s-1 an
increase in the gap width s results in an decrease of the shear rate 7 to obtain the
same droplet size rfdrop- Similar results were achieved for disperse phase fractions
<p - 0.05, 0.15, 0.3 and 0.5.
84

4.4 Experiments with the rotating membrane (ROME)
100
o.E+oo 5E+03 1.E+04 2.E+04
shear rate y in s"1
2.E+04 3.E+04
Figure 4.32: Droplet diameter d50i3 as a function of the shear rate 7 for W/Oemulsions and gap widths of 1mm and 2 mm for <p — 0.1.
As already discussed in section 2.4 the appearance of Taylor vortices for W/Oemulsions were figured out to be important for the droplet size d^op and size dis¬
tribution. Figure 4.33 shows the correlation between the droplet diameter d50,zand the dimensionless Taylor number Ta on double logarithmic scale. The regionaround the critical Taylor number racritl which is set as TaCTlti = 41.3 is charac¬
terised by a decrease in the curves for both gap widths s. For a gap width s of
1 mm droplets in the same size as the pore diameter dVOTe or even lower are achieved
for 7000 rpm and 8000 rpm, which corresponds to Taylor numbers of Ta = 64.0
and Ta — 73.2. The corresponding droplet sizes ^50,3 are 1.29 urn and 0.91 urn.
For a 2 mm gap width the smallest droplet size is 7.8 urn, which corresponds to
5.2 times the pore diameter dpore, even though the critical Taylor number Tacritjiwas exceeded.
Since the dynamic viscosity 7?emu of the W/O emulsion is higher than the viscosi¬
ties of the O/W and W/O/W emulsions and the densities p differ only slightly from
each other, the flow patterns in the annular gap differ from each other accordingto Equation 2.7. While an increase of the rotational speed n from 1000 rpm to
8000 rpm causes transition from laminar to Taylor-vortex flow for W/O emulsions,the flow for O/W and W/O/W emulsions is already in the turbulent range at the
lowest rotational speed n of 1000 rpm. The transition from laminar to Taylorvortex flow can be seen as a steep decrease in the droplet diameter dArov. The de¬
crease in droplet diameters appears for 1 mm gap width at critical Taylor number
^crit,] — 54.9 and for 2 mm gap at a critical Tacrit,i — 51.3 for a W/O emulsion
and a disperse phase fraction of ip — 0.1. The raised values of the critical Tay-
85

4 Results
100
E
i_
<D+-»
(LI
£TO
"o
CL
o
10
0.1
A2imm
1 mm
io 100
Taylor number Ta
1000
Figure 4.33: Droplet diameter d50,3 as a function of the Taylor number Ta for W/0
emulsions and gap widths of 1 mm and 2 mm.
lor number TaCTl^\ compared to the common value of the critical Taylor number
3aCrit,i — 43.1 can be explained by the used two phase system existing of two
fluids.
The highest efficiency with respect to droplet size on the results of the W/O
emulsification process was achieved in a 1 mm gap width as shown in Figure 4.32.
The droplet sizes, which were obtained in a 2 mm gap were about ten times higherthan the droplet sizes in a 1mm gap width for the same rotational speeds n.
When the width of the annular gap was set to 0.5 mm, phase inversion occurs and
a highly concentrated <po/w — ^ — fw/o — 0-9 and high viscous O/W emulsion was
produced. Since this was not the main foais of the work, no further experiments
were done on that topic.
Conclusions
Emulsions of the types O/W, W/O and W/O/W were produced in the ROME device
using three different gap widths s of 0.5, 1 and 2 mm. The influence of the gap
width s on the droplet sizes ddrop of the emulsions is significant and can be traced
back to a correlation between s and the flow profile in the annular gap as it is
presented in the dimensionless Reynolds number Re.
For O/W and W/O/W emulsions similar results were achieved due to the fact
that the oil droplets can be treated either as filled (for W/O/W emulsions) or as
unfilled (for O/W emulsions). The wider s the higher the shear rate 7, which is
necessary to reach a certain droplet size Gfarop- The smallest droplet size d^rop,
86

4.4 Experiments with the rotating membrane (ROME)
which could be achieved was around 5 times higher than the pore diameter dpore-In contrast W/O emulsions were produced in the transition range between lam¬
inar flow and Taylor vortex flow using the same rotational speed n as for the O/Wand W/O/W emulsions. Droplet sizes efarop achieved in the laminar flow are 12 to
20 times higher than the pore diameters dporc, while in the Taylor vortex regime
droplet sizes d<irop arc in the same size as the pore diameter dvore.
4.4.4 Influence of the disperse phase volume fraction tp on
the droplet sizes
Introduction
In industrial applications the disperse phase volume fraction tp plays an impor¬tant role in most of the cases. The recipes of the emulsions are usually fixed and
allow no or only marginal changes. The droplet sizes obtained by emulsification
devices usually depend on the disperse phase fraction (p, as already presented in
section 2.1.2. Process parameters can be adapted over a certain range, but a lim¬
itation in droplet sizes was observed for different disperse phase fractions tp for all
apparatus. This makes it difficult to use one emulsification apparatus for different
applications, but with the same target droplet size. Also in conventional mem¬
brane emulsification set-ups, droplet sizes depend on the disperse phase fraction
tp as shown by Schröder (1999). Because of this restriction, the influence of the
disperse phase fraction tp in different emulsion types were studied in the ROME
device.
Simple emulsions of the types O/W and W/O
Simple emulsions of the types W/O and O/W were produced with several dispersephase fractions tp. W/O emulsions were made with disperse phase fractions of 0.05,
0.1, 0.15, 0.3 and 0.5, while the emulsions of the O/W type were manufactured with
disperse phase fractions tp of 0.1, 0.2 and 0.5. For the water soluble emulsifier byvolume 1 % Tween 20 was used and for the oil soluble emulsifier 0.5 % by volume
PGPR 90. 1 mm gap width was used and the coated CPDN membrane with a pore
diameter of 1.5 pm was mounted in the apparatus. The volume flow rate of the
disperse phase Qdisp was kept constant at 200 ml-miii-1 while the flow rate of the
continuous phase <5COIlt was adjusted to reach the desired disperse phase fraction
(p. The fixation of the volume flow rate of the disperse phase Qdisp enables to
neglect the influence of the pore velocities vpoiQ on droplet detachment as it is
discussed in section 4.3. The operating parameters are listed in Table 4.6.
In Figure 4.34 the droplet diameter 0^50,3 is plotted as a function of the dispersephase fraction tp and the rotational speed n of the membrane for both types of
simple emulsions, W/O and O/W. The droplet diameters d50,3 of the O/W cmul-
87

4 Results
Table 4.6: Influence of the disperse phase fraction ip: Test parameters for O/W
and W/0 emulsions.
Parameter O/W W/0
disperse phasecontinuous phaseemulsifier
disperse phase fraction <p
gap width s
membrane module
rotational speed
disperse volume flow rate Qdisp
SFO tap water
tap water SFO
1 % Twccn 20 0.5 % PGPR 90
1 % Tween 80
0.1, 0.2, 0.5 0.05, 0.1, 0.15
0.2, 0.3, 0.5
lmm
coated CPDN membrane
pore diameter eüpore= 1.5 um
1000rpmto8000rpm200ml-min_1
sions are higher for all tested rotational speeds n when compared to the dropletdiameters ^drop f°r the W/O emulsions. The droplet diameters ddrop &t constant
rotational speeds n for different disperse phase fractions <p are more or less iden¬
tical for O/W emulsions with a slight decrease for <p — 0.2. For the W/O emulsion
the results have to be differentiated further. Starting at the lowest rotational
speed 2000 rpm, the droplet diameter d50>3 is not influenced by the variation in
the disperse phase fraction (p from 0.05 to 0.3 and is around 27 urn. When p is
increased to 0.5 the droplet size ddrop lowers to 3.5 um. Droplet diameters ddropat rotational speed n of 4000 rpm arc constant for disperse phase fractions 0.05,0.1 and 0.15 at 14 urn. A strong decrease in droplet diameter d^xov is detected for
disperse phase fractions p — 0.3 and 0.5, which results in a droplet diameter of
about 3 urn. Over all tested disperse phase fractions the value of the droplet di¬
ameter ddrop at rotational speeds n of 6000 rpm was about 2.5 urn and at 8000 rpm
circa 1.7 pm. In general the droplet sizes ddrop for O/W emulsions are about 2.3
times to 7.9 times higher than the droplet diameters ddrop reacnea1 f°r W/O emul¬
sions for the same disperse phase fractions <p and rotational speeds n. Different
flow properties in the annular gap for both types of emulsions W/O and O/W are
responsible for the unequal results. These differences in the flow properties are
based on the viscosity of the particular continuous phase. Higher viscosities of
the continuous phase result in smaller droplet size as it was already reported in
literature. Since the viscosity of SFO is 60 times higher than the viscosity of water,smaller droplet diameters for W/O emulsions result. At disperse phase fractions
p below 0.5 the viscosity r\ of O/W emulsions are smaller as compared to W/Oemulsions. For p — 0.5 the viscosities for both types of emulsions were measured
88

4.4 Experiments with the rotating membrane (ROME)
loo -
^...
E
0"
—- 0/W, 2000
-- 0/W, 4000
-àr- 0/W, 6000
--• 0/W, 8000
0
n- ---
io-0-- W/0,2000 •—-_
bTO
a w/o, 4000T3
a.-A- W/0, 6000
T3 -0-- W/0, 8000 A- A- -
O— —- -0— -G—-- -G- G
0.01 O.I 1
disperse phase fraction <p
Figure 4.34: Droplet diameter d50,3 as a function of the disperse phase fraction <p
for emulsions of the W/0 and 0/W types at a gap width of 1 mm. The rotational
speed n was set to 2000 rpm, 4000 rpm, 6000 rpm and 8000 rpm.
10.5mPa-s. Furthermore the ratio of the density to the viscosity of the emulsions
has an influence on the flow profile in the annular gap. The density p of the 0/Wemulsions for disperse phase fractions (p < 0.5 are higher than the density for the
W/O emulsions with the same disperse phase ratio according to Equation 2.8. At
(p = 0.5 the densities of W/O and O/W emulsions are identical at 990kg-ma. The
ratio of the density p to the viscosity /; is proportional to the kinematic viscosityv and thereby to the Reynolds number Re, which characterised the flow profile.As a consequence of the different ratios of p to 77, the Reynolds number Re for
O/W emulsions are higher than for W/O emulsions.
As already explained in section 2.4 the Taylor number Ta is proportional to the
Reynolds number Re (according to Equation 2.10) and a concrete sign for the flow
behaviour in the annular gap. In Figure 4.35 the dimensionless Taylor number Ta
is plotted as a function of the disperse phase fraction (p. While the values of Ta
are decreasing when the disperse phase fraction ip is increasing for O/W emulsions,it is vice versa for W/O emulsions. However, it has to be pointed out that for O/Wemulsions the values of the Taylor number are 10 times to 100 times the values
reached for W/O emulsions. The critical Taylor number Taa\tii — 43.1 is exceeded
in all cases for O/W emulsions, while there is a transition region at low rotational
speeds for W/O emulsions. The curve for 2000 rpm subtends the line for the critical
Taylor number at <p — 0.3, while Tacrittl is reached for ip — 0.2 at n —4000rpm. At
rotational speeds n of 6000 rpm and 8000 rpm the critical Taylor number Tacrjt,iis overcome in the whole range of the adjusted disperse phase fractions cp.
89

4 Results
3.E+04
Q5 2.E+04 -
i_
OJ
£ 2.E+0413
£Z
"I 1-E-KJ4H
E 5.E+03u
O.E+00 —
0
Figure 4.35: Taylor number Ta as a function of the disperse phase fraction </? for
emulsions of the types W/O and O/W at gap width of 1 mm. The rotational speedn was varied between 2000 rpm, 4000 rpm, 6000 rpm and 8000 rpm.
The tendency of the droplet diameters cfarop, as it was presented in Figure 4.34,is in line with the corresponding Taylor numbers Ta. O/W emulsions show a
uniformly continuous development of the droplet size ddrop at a relatively high
level, while the flow, according to the corresponding Taylor numbers is in the
turbulent range. The turbulent flow does not have a strong influence on the
reduction of the droplet diameter when compared to the influence of the Taylorvortex flow. This phenomenon will be discussed in more detail in section 4.4.1.
A summary of these results is finally presented in Figure 4.36. The dropletdiameter 0(50,3 is plotted as a function of the dimensionless Taylor number Ta. A
steep decrease of the droplet size levels with an increase of the Taylor number
Ta, which can be observed for O/W emulsions. The same plot for W/O emulsions
shows a different progression as shown in Figure 4.37. Again it has to be pointed
out, that the scale of the Taylor number Ta is 10 times to 100 times smaller, than
the Taylor numbers Ta achieved for O/W emulsions, which was already discussed
for the previous graph. A sharp decrease of the droplet size is observed until the
critical Taylor number ri'acritjl is reached. At that point a saltus appeared and
the droplet sizes d^rop are reduced drastically. A further increase of the Taylornumber Ta has no significant influence of the droplet size 0(50,3.
The sharp decrease in the droplet size oîdrop for W/O emulsions matches exactlywith the occurrence of the Taylor vortices, which start from Tacrit,i = 43.1, but
is with respect to the disperse phase volume fraction </? slightly higher. This
means, that the change in the flow of the annular gap caused an increase in the
90
O/W, 2000
- O/W, 6000
- W/O, 2000
W/O, 6000
O/W, 4000*- O/W, 8009-'S-- W/O, 400b©--W/O, 8Ö00
450
400
350
300
250
200
150
100
5°
o
O.I 0.2 0.3 O.4
disperse phase fraction <p
0.5 0.6

4.4 Experiments with the rotating membrane (ROME)
100
E3_
80
C
fvjA
£ 60
L_
flj-M
(LI
b 40ra
D
D.
O20
Q
0
0.0E+00
0/W, phi=o.i
O/W, phi=o.2
A 0/W, phi=o.5
5.0E+03 L0E+04 1.5E+04
Taylor number 7a
2.0E+04 2.5E+04
Figure 4.36: Droplet diameter as a function of the Taylor number Ta for O/W emul¬
sions at gap width of 1mm. The rotational speed was varied between 2000 rpm,
4000 rpm, 6000 rpm and 8000 rpm.
50
45
E 40
S 35
£ 25
E 20
15
10
5
o
Q_
O
T3
•a W/0, 0.05
W/0, 0 l
• W/0, 0.15
_
CSC» XX W/0, 0.3
AW/0,0.5
-
D
X
•
-
D »* .
20 40 60
Taylor number Ta
80 100
Figure 4.37: Droplet diameter d50>3 as a function of the Taylor number Ta for
W/0 emulsions at gap width of 1 mm. The rotational speed was varied between
2000 rpm, 4000 rpm, 6000 rpm and 8000 rpm.
91

4 Results
detaching forces, which results in a decrease of the droplet size ddrop- Recallingthe description of Taylor vortices in section 2.4, the overlay of the forces, which
are acting on the droplets at the pore opening can be assumed as a vectorial
addition of the single detaching forces. In addition to the existing axial overflow
the Taylor vortices generate a displacing force parallel to the continuous phaseflow and rotated 90° to the rotation. This results in a steep decrease in dropletsize ddrop- Surprisingly droplet diameters ddron which arc reached in the Taylorvortex regime are not in the same range for all applied rotational speeds n. While
the droplet size rfdrop for 2000 rpm, 4000 rpm and 6000 rpm in the Taylor regimeare of about 3 urn, the droplet size ddlop for 8000 rpm is additional reduced to
1.8 pm, which is approximately the pore diameter of 1.5 pm. One explanation for
this phenomenon is the close connection between the rotational speed n of the
membrane and the angular velocity uj of the Taylor vortices. The angular velocityu of the Taylor vortices are the same as the angular velocity ui of the ROME.
This means that the resulting forces acting on the droplets are not only increased
because of the higher rotational speed n of the membrane, but additional with
the higher angular velocity u of the Taylor vortices. When 8000 rpm are set, the
summary of the increased forces might cross a certain value and result in the
smaller droplet sizes ddrop-
4 "
—- O/W, 2000 O/W, 4000
3-5 A O/W, 6ooo •- O/W, 8ooo
3 -
O W/O, 2000
A W/O, 6000
---- W/O, 4000
--G--W/0, 8000
2-5.-S
O 2 H
1-5 "
1
$-. xb^'A- —A1. "<? '
-Hi —— —~-
0.5
o -
¥O.l 0.2 0.3 O.4
disperse phase fraction <p
--*
--
0.5 0.6
Figure 4.38: Span3 as a function of the disperse phase fraction <p for emulsions of
the types W/O and O/W at gap width of 1 mm. The rotational speed was varied
between 2000 rpm, 4000 rpm, 6000 rpm and 8000 rpm.
The width of the droplet size distributions of both emulsion types W/O and
O/W are presented in Figure 4.38. The span3 values are plotted as a function of
the disperse phase fraction <p for selected rotational speeds n. While the width
92

4.4 Experiments with the rotating membrane (ROME)
of the size distribution is decreasing with an increase of the disperse phase vol¬
ume fraction p> for emulsions of the O/W type, an increase is observed for W/Oemulsions. The span3 vahies of W/O emulsions with <p — 0.1 have to be treated as
outliers, since it is not plausible to get a narrowed size distribution under these
conditions, while the span3 values for <p — 0.05 and ip — 0.15 follow the normal
trend. In general the higher span3 values for W/O emulsions are due to the fact
that droplet sizes are absolutely smaller when compared to the ones, obtained for
O/W emulsions. Slight differences in the droplet size d^ov provokes already visible
variations in the span3 values for small droplet sizes. The different trends in the
slope of the curves for W/O and O/W emulsions can be explained by the changesof the viscosities with an increase in the disperse phase fraction p. While the
viscosity 7?emu for W/O emulsions is decreasing, because of the added water phase,the viscosity r/emu of the O/W emulsion is increasing, due to the reason that more
oil phase is dispersed. This explanation assumes a remarkable influence of the
viscosity ryemu of the emulsion, but cannot be used as an explanation for the huge
discrepancy between the span3 values for p> — 0.5 for both emulsion types. At
that point the viscosity of W/O emulsion as well as of O/W emulsion is almost the
same at 10.7mPa-s.
Double emulsions of the type W/O/W
Double emulsions are high costs products, since the production is complex and the
application fields usually need ingredients of high values. To evaluate, whether the
newly developed ROME apparatus is beneficial for those emulsion types, the effect
of the volume fraction <p on W/O/W emulsions was investigated, by analysing the
effect of the inner disperse fraction p\ and the outer disperse fraction p2. The
influence of both, inner and outer droplet phase, has to be considered for the
quality of a W/O/W emulsion. For both water phases tap water was used and for
the oil phase SFO was used. The water soluble emulsifier was Tween 20 at 1 % byvolume. As the oil soluble emulsifier by volume 5 % PGPR 90 was used.
The inner W/O emulsion was produced in a high pressure homogeniser as de¬
scribed in section 3.5. As a second step the W/O/W emulsion was produced in the
ROME device with the coated membrane module CPDN 1.5um. In Table 4.7 the
detailed process parameters are listed.
In Figure 4.39 droplet diameter ddlop of the outer droplets W/O is plotted as
a function of the outer disperse phase fraction <p2. As representative rotational
speeds n 6000 rpm and 8000 rpm were chosen. The inner disperse phase fraction
was kept constant at p\ = 0.1. As reference also the droplet diameters ddrop of a
O/W emulsion for the same rotational speeds n and disperse phase fraction <p are
presented.
Again the disperse phase fraction ip does not seem to influence the dropletdiameter d50)3 between <p2 = 0.2 and 0.5. But for p>2 ~ 0.1 the progression of
93
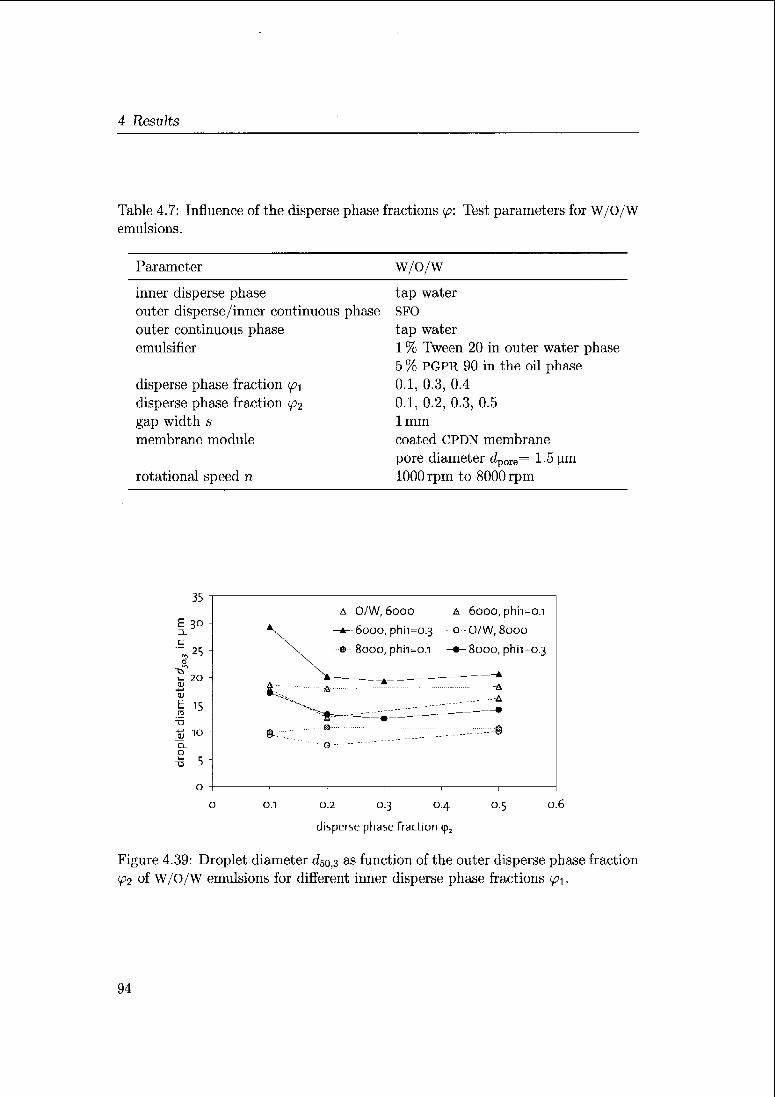
4 Results
Table 4.7: Influence of the disperse phase fractions f. Test parameters for W/O/Wemulsions.
Parameter W/O/W
inner disperse phaseouter disperse/inner continuous phaseouter continuous phaseemulsifier
disperse phase fraction ipi
disperse phase fraction tp2
gap width s
membrane module
rotational speed n
tap water
SFO
tap water
1 % Twcen 20 in outer water phase5 % PGPR 90 in the oil phase
0.1, 0.3, 0.4
0.1, 0.2, 0.3, 0.5
lmm
coated CPDN membrane
pore diameter dpore= 1.5 urn
1000rpmto8000rpm
35
£ 3DJL
C
rr\25
O
W't_ M>ni4-»
tu
E ISto
T3
4-<
CU10
o
()
5
A O/W, 6000 a 6000, phn=o.i
-a-- 6000, phh=o.3 0 O/W, 8000
^x ® 8000, phh=o.i -•-8000, phh=o.3
i,.*— -
-_ _^_ _
-—
A
___-—-A
A
-- -A
"-**-——«IUI--- ____-—-•
©-. ..
-
<
0.1 0.2 0.3 04
disperse phase fraction cp2
0.5 0.6
Figure 4.39: Droplet diameter ^50,3 as function of the outer disperse phase fraction
<+>2 °f W/O/W emulsions for different inner disperse phase fractions <pi.
94

4.4 Experiments with the rotating membrane (ROME)
the curves is different. The data points for the combination of n — 8000 rpm
with an O/W emulsion and a W/O/W emulsion with ip\ — 0.1 is following the
curve progression. For this range of the disperse phase fraction <p2, the results are
comparable to those for the O/W emulsions. In contrast the droplet diameters d^ropfor ip2 = 0.1 show a different behaviour. While the simple O/W emulsion shows
only a slight increase of about 5 % for n — 8000 rpm, the increase in droplet size
for n = 6000 rpm was about 12 %. W/O/W emulsions with an inner disperse phase
fraction of <pi = 0.1 show for both rotational speeds n, 6000 rpm and 8000 rpm,
no change in droplet size ddrop when compared to higher outer disperse fractions
yV A further increase in the inner disperse phase fraction <px leads to a significantincrease in droplet size. While the rise at n = 8000 rpm was about 30 % in droplet
size, the increase at 6000 rpm was with 45 % even higher. Since it is very complexto plot the results for the W/O/W emulsions with respect to all relevant parameters,
only a few representative settings were selected.
When the simple O/W emulsion is considered as a double emulsion with unfilled
oil droplets (ipi = 0), it is possible to discuss the results of both emulsion types
in common. With respect to an increase of the inner disperse phase fraction y?i
for both presented rotational speeds n =6000 rpm and 8000 rpm and increase in
the droplet size d^op is observed for all plotted outer disperse phase fractions
ip2. In other words, the higher the concentration of the inner droplet phase, the
bigger the oil droplets. This can be explained by the higher required space for
the inner aqueous droplet phase, which let the oil droplets grow. An increase of
the interfacial tension 7 between the oil phase and the outer aqueous phase can
be neglected, since the concentration of the cmulsifiers were selected of about 7
times cmc.
Influence of the combination of disperse phase fraction <p and gap width s
The effect of the gap width s on the droplet size ddTop, as well as the influence of
the disperse phase fraction <p were analysed and presented in the previous sections.
Not only a separate treatment, also the combination of these two parameters is of
interest.
In Figure 4.40 droplet sizes fi50;3 are plotted as a function of the shear rate 7
for O/W emulsions. As the gap width 1mm or 2 mm were used. The disperse
phase fractions were (p — 0.3 and <p — 0.5. The used membrane module was CPDN
with a pore size of 1.5 urn. The general curve progression was already discussed
in detail in section 4.4.1, so the focus here is the combined effect of gap width s
and disperse phase fraction (p. It can be observed that the different disperse phasefractions <p 0.3 and 0.5 do not have an influence on the droplet size ^50,3 when
different gap widths s were used. The slope of the curves for different disperse
phase fractions <p, but the same gap width s, are similar and also the droplet sizes
<i5o,3 are in the same range. One exception are the values for the highest shear rate
95

4 Results
!_ 80A «
c
f*ï
^60i^ A O(LI-MOJ
E 40ns
T3A
0Q.
S 20 -
T3
A
AA
0 -
A
oOW,o.5,imm
AOW,o.5,2mm
OW,o.3,imm
iOW,o.3,2mm
5000 10000 15000
shear rate y in s"1
20000 25000
Figure 4.40: Droplet diameter $50,3 as a function of the shear rate 7 for 0/W
emulsions with disperse phase fractions <p = 0.3 and 0.5 and gap widths s of 1 mm
and 2 mm.
7 for both gap width 1 mm and 2 mm. In this case the droplet diameters d<irop for
the emulsions with the lower disperse phase fractions ip are smaller, which means
1/4 to 1/7 as compared to the emulsions with <p — 0.5.
W/O/W emulsions were mainly produced in a 1 mm gap, since the process was
reproducible in most of the cases. Double emulsions were not produced in a
gap width of 0.5 mm, since the inner water droplets were released into the outer
water phase and a simple 0/W emulsion was produced. W/O/W emulsions in a
gap width of 2 mm were only possible for disperse phase fraction p>2 — 0.1. The
resulting droplet diameters are already presented in Figure 4.29. As a conclusion
the behaviour of W/O/W emulsions are similar to the behaviour of O/W emulsions
when the gap widths s and the disperse fraction p is combined, assumed the inner
droplets of the double emulsion are not destroyed.
Conclusions
The influence of the disperse phase fraction ip on the droplet size ddIop was studied
for simple O/W and W/O emulsions as well as for the inner and outer dispersefraction <pi and ip2 for W/O/W emulsions. It was pointed out that in contrast to
other emulsification devices, especially non-rotating cross-flow membrane set-ups,
no significant influence of the disperse phases could be detected, which aligns with
the results obtained by Cramer et al. (2004). Only an increase of the inner disperse
phase fraction p\ of W/O/W emulsions leads to an increase of the oil droplet size.
96
4.5 Multiple emulsions: Comparison of rotor stator and ROME
The novelty of the presented results is the fact, that the disperse volume frac¬
tion (pi can achieve values up to ipi — 0.4 for a double emulsion with very simple
ingredients. The highest reported value of tpi with membranes is 0.3 for a mixture
of emulsifiers (Mine et ai, 1996) or addition of polysaccharides to high concentra¬
tion of emulsifiers (Vladisavljevic et al, 2004). With the cross-flow ROME stable
double emulsions with <pi = 0.4 can be produced by using only one food-grade
emulsifier in the oil phase (PGPR) and one emulsifier in the outer water phase
(Tween 20), both in low concentrations.
4.5 Multiple emulsions: Comparison of rotor
stator and rotating membrane (ROME)
The development of a new membrane emulsification continuous pilot plant scale
process was the main goal of this work. The fixation of the newly designed mem¬
brane on a rotating hollow shaft in an annular gap was supposed to be beneficial
for the droplet detachment process and the reduction of the energy input. To
prove this presumption comparative studies were carried out by producing mul¬
tiple emulsions with the rotating membrane (ROMK) and a commercial available
rotor stator device. A wide range of parameters (e. g. disperse phase fraction ip,
geometries of rotor and stator, rotational speed of rotor/membrane n and annular
gap width s) were varied to get basic informations about the efficiency of the new
rotating membrane (ROME) apparatus.
For the oil phase SFO was used and tap water for the aqueous phase. The oil
soluble emulsifier was PGPR 90 and the water soluble emulsifier Tween 20. The
exact mixture of the components is listed in Table 4.8.
The inner droplet phase was produced in a high pressure homogeniser (Microflu-idizer®) as described in chapter 3.5, independent of the emulsification apparatus
used for the second emulsification step. Detailed process parameters for the first
emulsification step are listed in Table 4.9.
The second emulsification step was either done with a rotor stator apparatus or
the rotating membrane (ROME) set-up. In Table 4.10 the variable parameters for
both devices are listed.
Samples of the produced multiple emulsions were analysed and the droplet size
of the outer droplet phase were carried out. In principal it is shown that indepen¬dent of the used geometries multiple emulsions can be produced. In Figure 4.41
the droplet size d\ß (Sauter mean diameter) is plotted as a function of the pe¬
ripheral speed v of the rotor/membrane module. Since the diameter of the rotor
differ slightly from the diameter of membrane module, the rotational speed n was
replaced by the peripheral velocity v. This guarantees the comparability of the
results achieved with the two different emulsification devices.
97

4 Results
Table 4.8: Components of the multiple emulsions, which were produced either in
a rotor stator device or in the rotating membrane (ROME).
Parameter w/o/w
inner disperse phaseouter disperse/inner continuous phase
outer continuous phaseemulsifier
disperse phase fraction ^
disperse phase fraction <p2
tap water
SFO
tap water
1 % Twccn 20 in the outer water phase5 % PGPR 90 in the oil phase
0.1, 0.3, 0.4
0.1, 0.2, 0.3, 0.5
Table 4.9: Process parameters of the first emulsification step for the inner emulsion
in a high pressure homogeniser.
Parameter W/O/W
inner disperse phaseouter disperse/inner continuous phaseemulsifier
disperse phase fraction ip}
interaction chamber
passes
pressure
tempering
tempering medium
tap water
SFO
5 % PGPR 90 in the oil phase
0.1, 0.3, 0.4
200 urn and 75 um connected in series
2
1000 bar
with product and hydraulic oil
tap water (10-14°C)
Table 4.10: Process parameters for the second emulsification step in either a rotor
stator device or the rotating membrane (ROME).
Parameter rotor stator rotating membrane (ROME)
peripheral speed v
rotor
gapwidths
2.9~31.4m/stoothed disc with
(a) 8 teeth
(b) 24 teeth
K-geometry0.5,1and1.5mmgapwidths0.5,1and1.5mm
rotational speed n 1000 rpm to 8000 rpm
2.9-31.4 m/smesh wire
coated CPDN membrane
pore diameter dpore — 1.5 pm
lmm
98
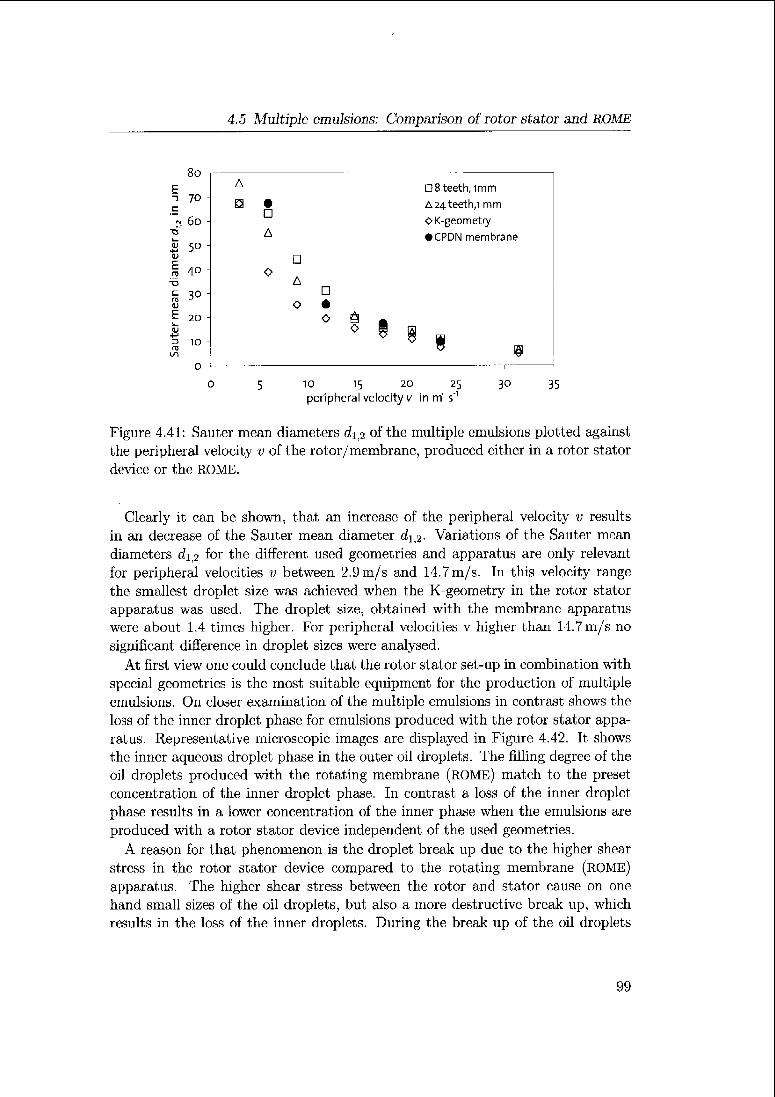
4.5 Multiple emulsions: Comparison of rotor stator and HOME
D8teeth,imm
A 24teeth,! mm
OK-geometry
• CPDN membrane
G
AD
o é
O Û *0 § 0
V |W m
50
10 15 20 25 30 35
peripheral velocity v in m' s1
Figure 4.41: Sauter mean diameters dip of the multiple emulsions plotted against
the peripheral velocity v of the rotor/membrane, produced either in a rotor stator
device or the ROME.
Clearly it can be shown, that an increase of the peripheral velocity v results
in an decrease of the Sauter mean diameter dip. Variations of the Sauter mean
diameters dip for the different used geometries and apparatus are only relevant
for peripheral velocities v between 2.9 m/s and 14.7 m/s. In this velocity range
the smallest droplet size was achieved when the K-geometry in the rotor stator
apparatus was used. The droplet size, obtained with the membrane apparatus
were about 1.4 times higher. For peripheral velocities v higher than 14.7 m/s no
significant difference in droplet sizes were analysed.At first view one could conclude that the rotor stator set-up in combination with
special geometries is the most suitable equipment for the production of multiple
emulsions. On closer examination of the multiple emulsions in contrast shows the
loss of the inner droplet phase for emulsions produced with the rotor stator appa¬
ratus. Representative microscopic images are displayed in Figure 4.42. It shows
the inner aqueous droplet phase in the outer oil droplets. The filling degree of the
oil droplets produced with the rotating membrane (ROME) match to the preset
concentration of the inner droplet phase. In contrast a loss of the inner droplet
phase results in a lower concentration of the inner phase when the emulsions are
produced with a rotor stator device independent of the used geometries.
A reason for that phenomenon is the droplet break up due to the higher shear
stress in the rotor stator device compared to the rotating membrane (ROME)apparatus. The higher shear stress between the rotor and stator cause on one
hand small sizes of the oil droplets, but also a more destructive break up, which
results in the loss of the inner droplets. During the break up of the oil droplets
3_ 70C
M 60cfa¬
ll 5"OJ
ETO 40"O
C 3011
E ?n
m+j
j 10fVl
l/l
0
D
99

4 Results
(a) rotor stator (b) rotating membrane (ROME)
Figure 4.42: Microscopic images of multiple emulsions produced either in a rotor
stator device or the rotating membrane (ROME).
the inner droplet phase is released into the outer aqueous phase. Systematicallystudies showed the influence of the geometry of the used rotor. The more teethed
the geometry, the higher the loss of the filling degree of the oil droplets. This
again can be explained by the appearance of increased shear stresses in the gap
between the rotor and stator, when the geometry is getting more complex. With
an increase of the number of teeth the flow profile in the gap is getting more
turbulent and results in a droplet break up.
100

5 Conclusions
A novel ROME apparatus was developed, built and used for emulsion production.The shear stress, which caused the droplet detachment from the membrane pores
was de-coupled from the cross-flow velocity vœnt of the continuous phase. In¬
stead the detaching force was applied by the rotational speed n of the membrane.
For this reason it is possible to produce emulsions with different disperse phase
fractions <p, without influencing the intensity of the detaching force. Since the
surfaces of the membrane and the outer cylinder are kept as smooth as possibleand additional geometries in the shear gap are avoided, the shear stress at the
membrane surface as well as in the annular gap is kept as small as possible. These
measures provide an apparatus for shear sensitive and as a consequence also tem¬
perature sensitive ingredients. The maximum temperature rise was 22 °C for a
W/O emulsion with a disperse phase fraction <p — 0.1.
Pre-cxpcrimcnts in a Searle geometry were carried out to obtain insight into
the flow profiles in the annular gap, when an increased rotational speed n of the
ROME is applied. Beside the knowledge of the flow profiles under different process
conditions also the viscosities ??emu of O/W, W/O and W/O/W emulsions, which
were used in the ROMK apparatus, were investigated in a Searle geometry with a
shear-rate controlled method. In general the different types of emulsions behaved
like Newtonian fluids. When the shear rates reach a critical value the laminar
Couette flow switches to a laminar Taylor vortex flow, which results in a strong
increase of the viscosity. This apparent increase of the viscosity can be traced
back to the increase of the torque M of the inner cylinder to abide the set shear
rate 7 as soon as the vortex flow is shaped this instability. The wall shear stress
rw depends linearly on the torque M. If at the same time the shear rate 7 is
unchanged, the viscosity 77 is presented as increased, even though a real increase
of the viscosity r) is not existent. In fact the viscosity 77 is assumed to keep the
same value as in the laminar Couette flow.
The disperse phase fraction Lp is reducing the critical Taylor number Tarrit,i.The higher the disperse phase fraction (p, the higher the resulting critical Taylornumber Tacr;t,i, but it still remains under the value of the pure liquid.
Different types of membranes were tested for O/W, W/O/W and W/O emulsions.
The effect of a filtration membrane and an uncoated CPDN membrane on O/W and
W/O/W emulsions was very much the same. Except of an increase in the dimen-
sionless droplet size D, when the uncoated CPDN membrane is used, which was
traced back to the controlled pore distance. When the droplet size (/drop is smaller
101

5 Conclusions
than the pore distance, droplet coalescence between two droplets at neighbouring
pores can be avoided and results in smaller droplet sizes. In addition to the two
types of membranes mentioned above a carbon-like coated CPDN membrane was
tested also for O/W emulsions. The coating layer caused smaller pore sizes dpore
(reduction from 5 pm to 3 pm) and a higher hydrophobicity when compared to
the uncoated membrane. Since the droplets in a W/O emulsion are formed with
an aqueous phase, the higher hydrophobicity of the membrane surface provides a
smaller contact angle between the droplet and the membrane surface. As a result
the dimensionless droplet sizes D, achieved with the coated CPDN membrane were
smaller than the droplet sizes achieved with the uncoated CPDN membrane and
the filtration membrane over the whole range of the applied rotational speeds n.
Again a strong increase of the droplet size efarop can be observed, when the droplet
sizes are smaller than the pore sizes dpore. In contrast to the results achieved with
the O/W and W/O/W emulsions the CPDN membranes, either coated or uncoated
pointed out as beneficial for the droplet size drop.
A general study of the flow profile in the annular gap of the ROME apparatus
gave the following results. An increase of the rotational speed n is decreasing the
droplet size ddrop. Depending also on geometrical parameters, like gap widths s,
radius of the ROME r-x and radius of the outer cylinder r0 and on parameters of
the fluid, like viscosity n and density p the flow profile varies between laminar
Couette flow, laminar Taylor vortex flow and turbulent wavy vortex flow, which
was already partly observed in the Searle geometry.
While O/W emulsions as well as W/O/W emulsions were produced within laminar
Taylor vortex flow and turbulent wavy vortex flow, W/O emulsions were producedin laminar Couette flow and laminar Taylor vortex flow. The transition from
vortex-free laminar Couette flow to the laminar Taylor vortex flow is described
with the critical Taylor number Taciit:1. The value of the critical Taylor number
ï'«CTit,i is known as about 43.1. A shift of this critical value can be caused by the
disperse phase fraction if of the emulsion. The occurrence of the Taylor vortices
result in a strong decrease of the droplet size ddrop of the W/O emulsions. The
next transition from the laminar Taylor vortex flow to the turbulent flow wavy
vortex flow can be described with the critical Taylor number Tacrit,2> which has
the value of about 400. While the effect of the Taylor vortices in the laminar flow
on the droplet size ddrop is significant, the influence of the wavy Taylor vortices in
the turbulent flow profile is less.
The influence of the gap width .s on the droplet diameter ddroP of the types O/W,
W/O and W/O/W emulsions was studied produced in the ROME device using three
different gap widths s 0.5, 1 and 2 mm. For O/W and W/O/W emulsions wider gap
widths s results in smaller droplet diameters ddropi while the smallest droplet size
which could be achieved was about 5 times higher than the pore diameter dpore.In contrast W/O emulsions were produced in the transition range between laminar
Couette flow and laminar Taylor vortex flow. A strong increase in the droplet size
102

ddrop was observed when Taylor vortices occurs and result in droplet sizes ddrop,which are in the same size as the pore diameter dpoTC.The influence of the disperse phase fraction ip on the droplet size ddrop was
studied for the three types of emulsions O/W and W/O as well as for the inner
and outer disperse fraction (pi and ip2 for W/O/W emulsions. The novelty of the
presented results is the fact that the disperse volume fraction ipi can assume
values up to ip\ — 0.4 for a double emulsion with very simple ingredients. It was
figured out that in contrast to other emulsification devices, especially not rotating
flow membrane set-ups, no significant influence of the disperse phases <p could
be detected. Only an increase in the inner disperse phase fraction <pi of W/O/W
emulsions leads to an increase of the oil droplet size.
Within the new developed ROME apparatus capacities up to 1501-h-1 emul¬
sion can be produced. This advantage over conventional cross-flow emulsification
devices opens the market for industrial applications.
103

104

Bibliography
Bahl, S. K.: Stability of viscous flow between two concentric rotating porous cylin¬ders. Journal Def. Science, 20(89):?, 1970.
Baier, G., M. D. Graham, and E. D. Lightfoot: Mass transport in a novel two-fluid
taylor vortex extractor. Aiche. J., 46(12):2395-2407, 2000.
Bals, A.: Grundlagen der Blasenbildtmg an Einzelporen und Lochplatten. Chem-
Ing-Tech., 74:337-344, 2002.
Batchelor, G. K.: Effect of brownian-motion on bulk stress in a suspension of
spherical-particles. J. Fluid. Mech., 83(NOV):97-117, 1977.
Becker, K. M. and J. Kaye: Measurements of diabatic flow in an annulus with an
inner rotating cylinder. J. Heat. Transf., 84:97-103, 1962.
Behrend, O. and K. Ax: Influence of continuous phase viscosity on emulsification
by ultrasound. Ultrason. Sonochem., 7(2):77-85, 2000.
Bibette, J., F. Leal-Calderon, V. Schmitt, and P. Poulin: Emulsion Science, Basic
Principles: An overview. Springer Verlag, 2002.
Breitschuh, B.: Continuous Dry Fractionation of Milk-Fat - Application of HighShear Fields in Crystallization and Solid-Liquid Separation. PhD thesis, ETH
Zurich, 1998.
Charcosset, C., 1. Limayem, and H. Fessi: Review the membrane emulsification
process-a review. J. Chcm. Tcchnol. Biot., 79:209-218, 2004.
Chung, K. C. and K. N. Astill: Hydrodynamic instability of viscous flow between
rotating coaxial cylinders with fully developed axial flow. J. Fluid. Mech., 81:
641-655, 1977.
Cramer, C: Continuous Drop FormMion at a Capillary Tip and Drop DeformMionin a Flow Channel. PhD thesis, ETH Zurich, 2004.
Cramer, C, P. Fischer, and E. J. Windhab: Drop formation in a co-flowing am¬
bient fluid. Chem. Eng. Sei., 59(15):3045-3268, 2004.
105

Bibliography
Dalgleish, D. G.: Food emulsions: Their structures and properties. In Priberg,S. E., K. Larsson, and J. Sjöblom (editors), Food Emulsions, pp. 1-44. Marcel
Dekker, Inc., 4th edition, 2004.
Einstein, A.: The theory of the brownian motion. Ann. Phys-Leipzig., 19(2) :371-
381, 1906.
Erni, P.: Viscoelasticity at liquid interfaces and its effect on the macroscopic de¬
formation response of emulsions. PhD thesis, ETH Zurich, 2006.
Erni, P., P. Fischer, and E. J. Windhab: Stress- and strain-controlled mea¬
surements of interfacial shear viscosity and viscoelasticity at liquid/liquid and
gas/liquid interfaces. Review of Sientific Instruments, 74(ll):4916-4924, 2003.
Gijsbertsen-Abrahamse, A.: Membrane Emulsification: Process Principles. PhD
thesis, University of Wageningen, 2003.
Gravas, N. and B.W. Martin: Instability of viscous axial flow in annuli having a
rotating inner cylinder. J. Fluid. Mech., 86:385-394, 1978.
Grmcla, M., M. M. Bousmina, and J. F. Palierne: On the rheology of immiscible
blends. Rheological Acta, 40:560-569, 2001.
Gunde, R., A. Kumar, S. Lehnert-Batar, R. Mäder, and E.J. Windhab: Measure¬
ment of the surface and interfacial tension from maximum volume of a pendant
drop. J. Colloid. Interf. Sei., 244:113-122, 2001.
Hollcy, W. and H. Weisser: Dispergiermaschinen und ihre Anwendungin der Emul-
giertechnik - Teil 1. Zeitschrift der Lebensmittel Technologie und Verfahrens¬
technik (ZFL), 33(3): 139-153, 1982a.
Holley, W. and H. Weisser: Dispergiermaschinen und ihre Anwendungin der Emul-
giertechnik Teil 2. Zeitschrift der Lebensmittel Technologie und Verfahrens¬
technik (ZFL), 33(4):237-251, 1982b.
Husny, J. and J. J. Cooper-White: The effect of elasticity on drop creation in
t-shaped microchannels. Journal of Non-Newtonian Fluid Mechanics, 137(1-3):121-136, 2006.
Husny, J., H. Y. Jin, E. C. Harvey, and J. J. Cooper-White: The creation of
drops in t-shaped microfluidic devices with the 'modified' laser-liga technique: I.
fabrication. Smart Materials and Structures, 15(l):117-123, 2006.
Hwang, J.-Y. and K.-S. Yang: Numerical study of taylor-couette flow with an axial
flow. Computers and Fluids, 33:97-118, 2004.
106

Bibliography
Joscelyne, S. M. and G. Trâgardh: Membrane emulsification - a literature review.
J. Membrane. Sei., 169:107-117, 2000.
Karbstein, H.: Untersuchungen zum Herstellen und Stabilisieren von Ol-in-Wasser
Emulsionen. PhD thesis, University of Karlsruhe (TH), 1994.
Kaufmann, S. F. M.: Experimentelle und numerische Untersuchungen von Trop-
fendispergiervorgängen in komplexen laminaren Strömungsfeldern. PhD thesis,ETH Zurich, 2002.
Klinksiek, B. and B. Koglin: Verfahren zur Herstellung von Salben und Cremes. In
GVC (editor), Technik der mehrphasigen Strömungen nicht-mischbarer fluider
Phasen-Schäume, Emulsionen.Preprints. Vortrags-und Diskussionstagung, 2./3.Juni 1992.
Lauterborn, W. and C. D. Ohl: Cavitation bubble dynamics. Ultrason. Sonochem.,
4:65-75, 1997.
Menetrier-Deremble, L. and P. Tabeling: Droplet breakup in microfluidic junctions
of arbitrary angles. Phys. Rev. E., 74(3):035303, September 2006.
Miller, R. and V. Fainerman: The drop volume technique. In Möbius, D. and
R. Miller (editors), Drops and Bubbles in Interfacial Research, volume 6 of
Studies in interface science. Elsevier, 1998.
Min, K. and R. M. Lueptow: Circular couette flow with pressure-driven axial flowand porous inner cylinder. Exp. Fluids., 17:190 197, 1994.
Mine, Y., M. Shimuzi, and T. Nakashima: Preparation and stabilization of simpleand multiple emulsions using a microporous glass membrane. Colloids Surfaces
B: Biointerfaces, 6:261-270, 1996.
Mooney, M.: The viscosity of a concentrated suspension of spherical particles. J.
Coll. Sei. Imp. U. Tok., 6(2):162-170, 1951.
Nakashima, T. and M. Shimizu: in Japanese. Ceramic Japanese, 21:408-, 1986.
Nakashima, T., M. Shimizu, and M. Kukizaki: Membrane emulsification by micro-
porous glass. In Proc. 2nd International Conference on Inorganic Membranes,
p. 513, 1991.
Nisisako, T., T. Torii, and T. Higuchi: Droplet formation in a microchannel net¬
work. Lab on a Chip, 2(l):24-26, 2002.
Nisisako, T., T. Torii, and T. Higuchi: Novel microreactors for functional polymerbeads. Chemical Engineering Journal, 101(l-3):23-29, 2004.
107

Bibliography
Nisisako, T., S. Okushima, and T. Torii: Controlled formulation of monodispersedouble emulsions in a multiple-phase microfluidic system. Soft Matter, 1(27):23 27, 2005.
Nisisako, T., T. Torii, T. Takahashi, and Y. Takizawa: Synthesis of monodispersebicolored janus particles with electrical anisotropy using a microfluidic co-flow
system,. Advanced Materials, 18(9):1152-1156, 2006.
Ouchiyama, N. and T. Tanaka: Porosity estimation for random, packings of spher¬ical particles. Ind. Eng. Chem. Fiindam., 23:490-493, 1984.
Pal, R.: Multiple o/w/o emulsion rheology. Langmuir., 12:2220-2225, 1996.
Pal, R.: A novel method to correlate emulsion viscosity data. Colloids and Surfaces,
A: Physicochemical and Engineering Apsects, 137:275 286, 1998.
Peng, S. J. and R. A. Williams: Controlled production of emulsions using a cross-
flow membrane. Part. Part. Syst. Char., 15(1):21—25, February 1998.
Rubin, G.: Widerstands- und Auftriebsbeiwerte von ruhenden, kugelförmigen Par¬
tikeln in stationären, wandnahen laminaren Grenzschichten. PhD thesis, Uni¬
versity of Karlsruhe (TH), 1977.
Schröder, V.: Herstellen von Öl-in- Wasser Emulsionen mit mikroporösen Mem¬
branen. PhD thesis, University of Karlsruhe (TH), 1999.
Schubert, H. and H. Armbruster: Prinzipien der Herstellung und Stabilität von
Emulsionen. Chemie-Ingenieur Technik, 61(9):701-711, 1989.
Stang, M.: Zerkleinern und Stabilisieren von Tropfen beim mechanischen Emulgie-
ren. PhD thesis, University of Karlsruhe (TH), Fortschrittsbericht VDI Reihe
3 Nr. 527, VDI Verlag, 1998.
Suzuki, K.: Preparation of high concentration o/w and w/o emulsions by the mem¬
brane phase inversion emulsification using ptfe membranes. Food Science Tech¬
nologies results, 5:234-238, 1999.
Suzuki, K., I. Shuto, and Y. Hagura: Application of membrane emulsification
method for preparing food emulsions and emulsion characteristics. Proceedingsof the Developments in Food Engineering, 167, 1994.
Suzuki, K., I. Fujiki, and Y. Hagura: Preparation of corn oil/water and water/cornoil emulsions using PTFE membranes. Food Science Technologies International,
4(164), 1998.
108

Bibliography
Swift, D. L. and S. K. Friedlander: Coagulation of hydrosols by brownian motion
and laminar shear flow. J. Coll. Sei. Imp. U. Tok., 19(7):621 647, September1964.
Tadros, Th. F.: Fundamental principles of emulsion rheology and their application.Colloids and Surfaces, Physiochemical and Engineering Apsects, 91:39-55, 1994.
Taylor, G. I.: Stability of a viscous liquid contained between two rotating cylinders.Philos. Trans. R. Society Lond. A, 223:289 343, 1923.
Tesch, S. and H. Schubert: Investigations on the emulsification in a high-pressure
homogenizer with an orifice valve: Experimental set-up for visualization of
droplet disruption. In PARTEC, 2001.
Tobler, M.: ADLC-Schichtsystem gegen Reibung und Verschleiss. Oberflächen, 2:
20-24, 2001.
Boekel, M. A. J. S. van and P. Walstra: Effect of couette flow on stability ofoil-in-water emulsions. Colloid and Surfaces, 3:99-107, 1981.
Graaf, S. van der, M.L.J. Steegmans, R.G.M. van der Sman, C.G.P.H. Schroën,
and R.M. Boom: Droplet formation in a t-shaped microchannel junction: A
model system, for membrane emulsification. Colloids and Surfaces A: Physico-chemical Engineering, 266:106-116, 2005.
Vladisavljevic, G. T. and R. A. Williams: Manufacture of large uniform droplets
using rotating membrane emulsification. J. Colloid. Interf. Sei., 299:396-402,
2006.
Vladisavljevic, G. T. and R. A. Williams: Recent developments in maufacturingemulsions and particulate products using membranes. Adv. Colloid. Interfac,113:1 20, 2005.
Vladisavljevic, G. T., M. Shimuzi, and T. Nakashima: Preparation of monodisperse
multiple emulsions at high production rates by multi-stage premix membrane
emulsification. J. Membrane. Sei., 244(1-2):97-106, 2004.
Wang, Z. and S. Wang: Effect of continuous phase viscosity on membrane emtdsi-
fication. Chinese. J. Chem. Eng., 8(2):108 112, 2000.
Wereley, S. T. and R. M. Lneptow: Azimuthal velocity in supercritical circular
couette-flow. Exp. Fluids., 18(1-2): 1-9, December 1994.
Wereley, S. T. and R. M. Lueptow: Velocity fi,eld for taylor-couette flow with an
axial flow. Phys. Fluids., ll(12):3637-3649, December 1999.
109

Bibliography
Wilk, M.: Mikrobielle Denitrifikation in einem Membran-Bioreaktor mit hoher
Zelldichte. PhD thesis, University of Karslruhe (TH), 1996.
Williams, R. A., S. J. Peng, D. A. Wheeler, N. C. Morley, D. Taylor, M. Whalley,and D. W. Houldsworth: Controlled production of emulsions using a crossflowmembrane part II: Industrial scale manufacture. Chem. Eng. Res. Des., 76(A8):902-910, November 1998.
Xu, J. H., S. W. Li, J. Tan, Y. J. Wang, and G. S. Luo: Preparation of highly
monodisperse droplet in a t-junction microfluidic device. Aiche. J., 52(9):30053010, September 2006.
Yu, W., M. Bousima, M. Grmela, J.-F. Palierne, and C. Zhou: Quantitative rela¬
tionship between rheology and morphology in emulsions. J. Rheol., 46(6):1381-1399, 2002.
110

Curriculum Vitae
Verena Eisner
Personal Data
date of birth 1st May 1978
place of birth Aschaffenburgcitizen of Germany
Work Experience and Internships
since 09/2007 Researcher: Agrotechnology k Food Science Group, Wa¬
geningen UR, NL
09/2002 - 03/2007 Assistant: Swiss Federal Institute of Technology (ETH)Zurich, CH, Laboratory of Food Process Engineering
(Prof. Dr.-Ing. E. J. Windhab)05/2001 - 08/2001 Graduate Assistant: University of Karlsruhe (th), Insti¬
tute of Measurement and Control Technology
08/1997 09/1997 Internship: Petri AG, Aschaffenburg, DE
Education
09/2002 03/2007 Doctoral-thesis: Swiss Federal Institute of Technol¬
ogy (ETH) Zurich, CH, Department of Agricultural and
Food Science; Titel: Emulsion Processing with a rotatingmembrane (ROME)
111

Bibliography
10/199705/2002
05/2002
11/2001 05/2002
10/2000 - 03/2001
Degree: Diplom-Ingenieurin Univ.
Studies: Chemical and Process Engineering, Universityof Karlsruhe (TH), DE
Diploma thesis: Experimentelle Untersuchungen und
Charakterisierung der Produktbildung der einzelligen Mi-
kroalge Porphyridium, purpureum in einem Photobiore¬
aktor bei unterschiedlichen LichtqualitätcnSemester thesis: Untersuchung der Eignung eines CsNaY
Zeolithen als heterogener Katalysator bei der einstufigen
MIBK-Synthese unter hydrierenden Bedingungen in der
Gasphase
06/1997 Degree: Allgemeine Hochschulreife, Mädchengymnasiumder Englischen Fräulein/Aschaffenburg, DE
112