(en route) business plan
TRANSCRIPT

NATS (En Route) Plc
10 Year Business Plan 2011-2020
Final Issue: March 2010

NERL 10 Year Plan: Page 1
IMPORTANT NOTICE:
This document is being provided in satisfaction of the obligations of NATS (En Route) PLC (the "Company") under its Licence from the Civil Aviation Authority (the "CAA").
This document includes certain forward-looking statements which solely represent the current views of the management of the Company with respect to future events. Such statements are subject to risks and uncertainties because they relate to events, and depend on circumstances, that may occur in the future and many factors could cause the actual results to be materially different.
NERL 10 Year Plan: Page 2
Contents
Executive Summary .......................................................................................................................................................... 3
1 Introduction .............................................................................................................................................................. 5
2 Requirements ........................................................................................................................................................... 7
3 Vision ........................................................................................................................................................................... 9
4 Strategic Objectives and Targets ................................................................................................................... 10
5 Safety Plan .............................................................................................................................................................. 12
6 Service Plans .......................................................................................................................................................... 14 6.1 UK Air Traffic Service ......................................................................................................................................... 14 6.2 Shanwick Oceanic ............................................................................................................................................... 16 6.3 Other Services ...................................................................................................................................................... 16
7 Environmental Plan .............................................................................................................................................. 19
8 Partnering in Europe ............................................................................................................................................ 21
9 Investment Plan .................................................................................................................................................... 24
10 Efficiency and Manpower .................................................................................................................................. 28
11 Indicative Price Profiles ....................................................................................................................................... 31 11.1 Indicative Price Profile for UK En-Route Services (Eurocontrol) ..................................................... 31 11.2 Indicative Price Profile for Oceanic Services ............................................................................................ 31
Appendix A: Plan Input Assumptions ....................................................................................................................... 32 A1. Industry Uncertainties Excluded from the Plan ..................................................................................... 32 A2. Regulatory & Accounting Assumptions .................................................................................................... 32 A3. Traffic Forecast and Assumptions ............................................................................................................... 33 A4. Economic Assumptions .................................................................................................................................... 33 A5. Investment and Operating Costs ..................................................................................................................35
Appendix B: Plan Outputs ............................................................................................................................................. 37 B1. Building Blocks ..................................................................................................................................................... 37 B2. Real Unit Operating Expenditure (RUOE) ................................................................................................. 38 B3. Indicative Prices ................................................................................................................................................. 39 B4. Additional Financial Information ................................................................................................................... 41
Glossary ............................................................................................................................................................................. 46
NERL 10 Year Plan: Page 3
Executive Summary
This document sets out NERL’s Business Plan for the next 10 years for our regulated En Route and Oceanic businesses (2011 – 2020, i.e. CP3 and CP4) in accordance with Condition 10 of our Licence. It is a “summary plan” since our detailed plans to the end of CP3 are set out in our “Plan for CP3” developed in consultation with our customers during 2009, the final version being published in March 2010. The ten year view is completed in this document by providing a high level plan for CP4 which reflects our best view of expected developments, but which will evolve over time.
We published a Draft 10 Year Plan in February 2010 for consulting customers. This final version of our 10 Year Plan therefore incorporates changes arising from customer consultation as well as reflecting the latest changes in traffic forecasts and other exogenous factors which have affect the Plan.
The focus of our 10 Year Plan is on economic value to customers from greater fuel efficiency and good service quality with minimal ATC delays. This recognises that fuel efficiency and delay benefits to airlines far outweigh any price reduction from greater operating cost efficiencies beyond this Plan (which would place these benefits at risk).
Europe is central to our plans for CP3 and CP4, the Plan being in service of the significant evolution in NERL’s operations expected over the next 10 years in line with the Single European Sky (SES) initiative. We will play a leading role in the regulatory, operational and technological developments of the SES project; we will become integrated into Europe through Functional Airspace Blocks (FABs), the SES Performance Scheme and the SES Air Traffic Management Research (SESAR) programme; and we will work in greater collaboration with Europe’s ATM industry, air navigation service providers (ANSPs) and airspace users. SESAR will increase investment in CP4 whilst, at the same time, the as yet undefined SES Performance Scheme will drive efficiency and reductions in operating costs, all this creating competing pressures for NERL.
This 10 Year Plan therefore reflects our present understanding of how these various elements are expected to develop, with increasing linkages between all components:
• Safety: a strong safety programme with a particular emphasis on reducing risk in the London Terminal Control (LTC) operation
• Environment: an environmental plan to reduce ATM CO2 emissions per flight is in place and fully embedded in local business plans, and for NATS to operate a carbon neutral estate from 2011
• Service Quality: a focus on service consistency with very low delays – particularly avoiding delays which have greatest impact on customers’ operations – supported by investment in airspace development and automation/tools to improve delays, flight efficiency and operational productivity
• Long-Term Investment Plan (LTIP): development and deployment of an advanced flight data processing system (iTEC) in CP3, as the platform for deployment in CP4 of a new common workstation (to achieve system consolidation) and the advanced ATC functions/tools needed to support future concepts including SESAR
• Operating Efficiencies: a reduction in non-controller headcount throughout the period whilst protecting front-line operations to deliver customers’ safety, flight efficiency and service quality expectations
• Commitment in Europe: participation in SESAR as the vehicle for developing common ATC concepts, tools and technical standards in CP3 and for deploying them in CP4, with our LTIP increasingly aligned to SESAR.
The alignment of the NERL investment plan with the requirements of SESAR and SES targets and with EC mandates will be managed through the close attention of the Executive and the engagement of customers. Methodically testing the implementation plans across Europe and participating in the deployment of the iTEC platform with DFS and AENA (German and Spanish ANSPs) will provide a high degree of confidence that NERL plans will not be overshadowed.
NERL 10 Year Plan: Page 4
The indicative UK En-Route (Eurocontrol) average price is £52.60 in CP3 and £41.31 in CP4 (both per CSU and in 2008 prices). This equates to an average real increase in prices of 1.1% pa over CP3, but an average real reduction of 4.8% pa over CP4 due to a major reduction in cash pension contributions and against a background of growing traffic volumes. Applying the current economic regulatory formulae to NERL’s final business plan, the net revenue requirement recovered through the unit rate after year one of CP3 is assumed to change annually by RPI-3% for the duration of the CP3 control period.
For Oceanic Services, the indicative average price (at 2008/09 prices) is £55.10 per flight in CP3 (2.6% pa average real increase) and £41.74 per flight in CP4 (average real reduction of 5.9% pa.). Applying the current economic regulatory formulae to NERL’s final business plan, the Oceanic net revenue requirement recovered through the Oceanic charge after year one of CP3 is assumed to change annually by RPI-5% for the duration of the CP3 control period.
These average prices are based on a 9% pre-tax real cost-of-capital assumption (5.9% on a post-tax basis). Using the CAA’s initial estimate for cost-of-capital (7% pre-tax real), average prices would change as follows:
• UK En-Route (Eurocontrol) prices would show an average real reduction over CP3 of 0.2%pa, and, for CP4, would show an average real reduction of 4.9% pa.
• Oceanic prices would show an average real increase over CP3 of 1.6% pa, and, for CP4, would show an average real reduction of 5.7% pa.
Basis of this Plan
While this 10 Year Plan is based around two five-year control periods, the SES Performance Scheme’s “reference periods” do not match the start or end dates of CP3 / CP4. The CAA has indicated that it is considering a 4-year CP3 to resolve this mismatch, subject to consultation. However, within this document we show a 10 Year Plan and where we refer to CP3 and CP4 these are stated on the current five year basis.
During CP3, DfT and CAA will also be required to demonstrate to the EC how plans within the UK, including NERL, will satisfy the targets set under SES. Therefore, there may necessarily be a need to revise the plan for the CP4 period to reflect the effects of SES.
Furthermore, this Plan is based on the existing economic regulatory structure, including traffic and cost risk sharing. However, new rules are being developed under SES which might affect the current regulatory structure and impact the risk allocation. Should this be the case, this Plan would require modification.
NERL 10 Year Plan: Page 5
1 Introduction
NATS (En Route) Plc – NERL – is a subsidiary of NATS, the world’s only part-privatised Air Navigation Service Provider. We provide en route air traffic control (ATC) services to aircraft flying to, from and over the UK and over the eastern North Atlantic, in some of the world’s most complex airspace.
We operate under a Licence issued by the UK Government and subject to economic regulation on prices/revenues by the UK Civil Aviation Authority (CAA).
Basis of this 10 Year Plan
This document is prepared in accordance with Condition 10 of the Licence which requires us to provide – 12 months before the start of the next Control Period (Plan Renewal Date) – a Business Plan for the next 10 years, i.e. 2011 – 2020.
However, details of the Single European Sky (SES) performance scheme are still being discussed by the EC, but the scheme’s first reference period is expected to last for 3 years, starting on 1 January 2012 and ending on 31 December 2014. This would not match the end date of the 5-year CP3 period (31 December 2015). The CAA has indicated that it is considering a 4-year CP3 to resolve this mismatch, subject to consultation.
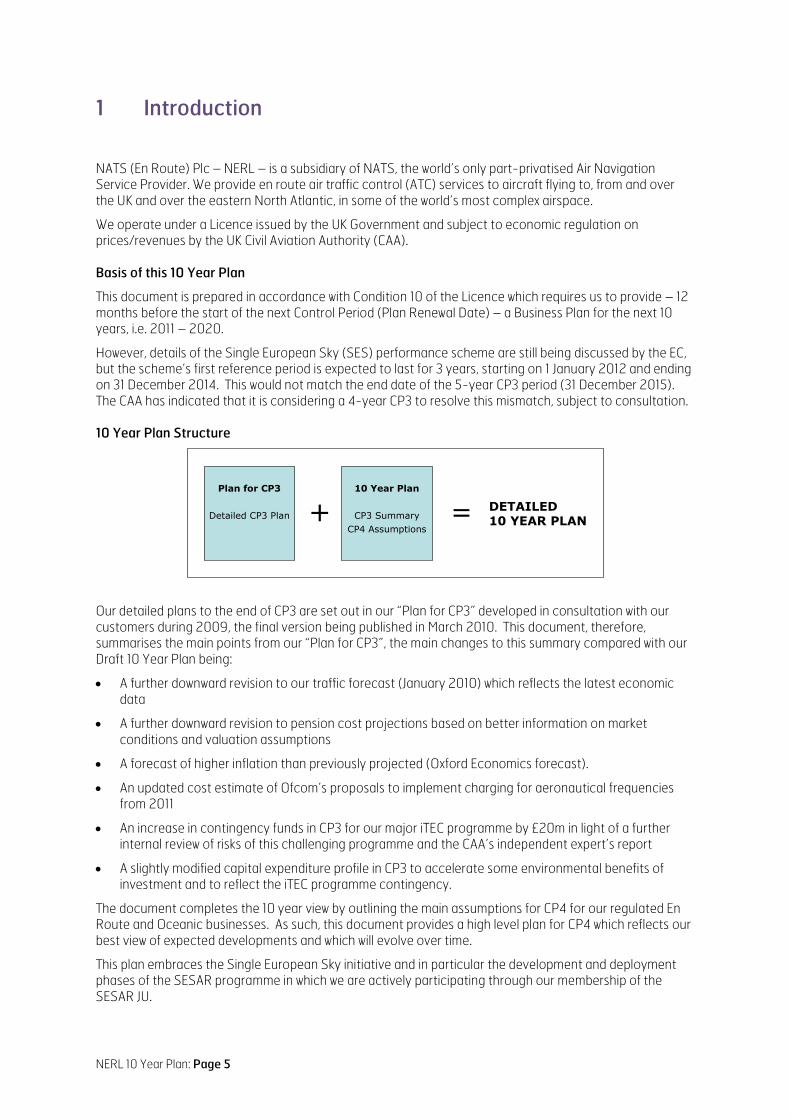
10 Year Plan Structure
10 Year Plan
CP3 SummaryCP4 Assumptions
Plan for CP3
Detailed CP3 Plan + = DETAILED10 YEAR PLAN
Our detailed plans to the end of CP3 are set out in our “Plan for CP3” developed in consultation with our customers during 2009, the final version being published in March 2010. This document, therefore, summarises the main points from our “Plan for CP3”, the main changes to this summary compared with our Draft 10 Year Plan being:
• A further downward revision to our traffic forecast (January 2010) which reflects the latest economic data
• A further downward revision to pension cost projections based on better information on market conditions and valuation assumptions
• A forecast of higher inflation than previously projected (Oxford Economics forecast).
• An updated cost estimate of Ofcom’s proposals to implement charging for aeronautical frequencies from 2011
• An increase in contingency funds in CP3 for our major iTEC programme by £20m in light of a further internal review of risks of this challenging programme and the CAA’s independent expert’s report
• A slightly modified capital expenditure profile in CP3 to accelerate some environmental benefits of investment and to reflect the iTEC programme contingency.
The document completes the 10 year view by outlining the main assumptions for CP4 for our regulated En Route and Oceanic businesses. As such, this document provides a high level plan for CP4 which reflects our best view of expected developments and which will evolve over time.
This plan embraces the Single European Sky initiative and in particular the development and deployment phases of the SESAR programme in which we are actively participating through our membership of the SESAR JU.
NERL 10 Year Plan: Page 6
Specifically, this 10 Year Business Plan includes the following:
• Requirements: an assessment of the business environment and forecast traffic demand (volumes of flights) for the period
• Vision: how our business will evolve over the next 10 years
• Strategic Objectives and Targets: our proposed service standards for CP3 and CP4
• Operational Plans: for safety, service and environment
• Partnering: our planned involvement in the Single European Sky project
• Capital Investment Plan: proposed investment needed to implement our plans
• Efficiency: our plans regarding manpower, operating expenditure and improvements in efficiency over the period
• Prices: the implications of our plans on the future course of charges
• Financials: the main financial assumptions underpinning this Plan.

NERL 10 Year Plan: Page 7
2 Requirements
Business Environment
The global scale of the present recession makes this the most turbulent economic environment since the aftermath of World War II. While major world economies are beginning to emerge from recession, the squeeze on air travel is likely to remain significant and prolonged.
Additionally, there will be increasing emphasis on limiting aviation’s impact on the environment, in particular its emissions of greenhouse gases (GHG). Airlines are included in the EU Emissions Trading Scheme (ETS) from 2012 which is expected to be superseded by a global scheme, and the Government has set a target for UK aviation emissions to reduce to 2005 levels by 2050.
Economic indicators assume a growth trend for air travel through CP3 and CP4, but constrained by industry’s environmental responsibilities – e.g. using fewer more fuel efficient aircraft to accommodate future travel demand. Future growth in UK airport capacity is expected to include Stansted’s 2nd runway in 2017 and Heathrow’s 3rd runway in 2020.
Evolution of Europe’s ATM Industry will follow the Single European Sky project including:
• An EU wide performance framework with overall EU targets for capacity/delay, safety, cost efficiency and the environment to be delivered through national (or FAB) performance plans. EU targets for the 1st reference period (2012-14) will be set in 2010 with national plans agreed in 2011
• Airspace and network management by Functional Airspace Blocks (FABs)
• The SESAR Joint Undertaking delivering the R&D phase of the SES Master Plan to 2016, with phased implementation of new concepts through 2013-20.
Traffic Forecast
The economic recession has led to significant reductions in the volumes of traffic handled by NERL, with UK flights in 2009 falling back to 2004 levels (from c2.5 million flights in 2007/08 to a low of 2.2 million in 2009/10). Our latest January 2010 base case forecast shows a recovery to growth in 2010 with 2.6 million flights per annum by the end of CP3 (2.5 million at the end of 2014) and 3.0 million flights at the end of CP4.
Similarly, for Oceanic flights through NERL’s Shanwick ACC, the January 2010 base case forecast shows a drop from 422,000 flights in 2007/08 to a low of 385,000 in 2009/10. Growth restores traffic to 436,000 flights per annum by the end of CP3 and 484,000 flights at the end of CP4, albeit at a slower rate than UK flights due to higher load factors assumed for transatlantic flights.
The new forecast is based on an updated assumption set (see Appendix A) including economic forecasts (GDP), passenger numbers, mix of aircraft sizes, load factors, emissions trading, increases in Air Passenger Duty, and realistic assumptions of airport development and airport capacity limits. In particular, reducing aviation’s environmental impact and emissions trading are likely to cause downward pressure on future traffic forecasts.
Customer Requirements
The long-term customer requirement is to achieve the SESAR Concept of a “Business Trajectory” where airspace users, ANSPs and airport operators define together, through a collaborative process, the optimal flight path from gate to gate. Airlines expect freedom of operation to be able to fly safely on an optimum route with minimal ATC intervention.
Achieving SESAR’s target concept relies on a number of functions and technologies being developed and deployed over the next 10 years, including:
• Trajectory-based operations which will improve dramatically the predictability and precision of operations, enabling greener trajectories
• Increased automation support to controllers enabling them to concentrate on high added value activities

NERL 10 Year Plan: Page 8
• A system wide information (SWIM) environment which will enable all participants to have full access to the right information at the right time.
Against this, we have consulted our customers extensively in 2009 on our Plan for CP3, their main requirements and priorities for the next 5 years being:
• Maintaining high standards of safety, including targeting incident hotspots especially in terminal airspace
• Ensuring good service quality, with negligible ATC delays
• Improved flight profiles that reduce fuel burn and hence CO2 emissions
• Lowest possible efficient levels of operating costs and investment, consistent with traffic forecasts and meeting requirements for safety, service and environment.
NERL 10 Year Plan: Page 9
3 Vision
NERL is a progressive business, unique in the ATM industry in operating in the private sector, creating the profit to invest in our own future and delivering both customer and shareholder value.
Our Vision is to lead the way operationally, commercially, and politically – to shape the future of our industry by setting new standards in safety, environment, service and value for our customers.
Europe is central to our plans. We will play a leading role in the regulatory, operational and technological developments of the SES project. We will become integrated into Europe through FABs, SESAR and the SES Performance Scheme; and we will work in greater collaboration with Europe’s ATM industry and ANSPs.
We will also play a leading role in the collective industry approach (via SES, Eurocontrol, CANSO, etc.) towards achieving the ultimate goal of seamless air navigation service provision, where ANSPs provide services that are technically interoperable, procedurally harmonised, universally safe, and affordable. As the world’s only part-privatised ANSP and the first to establish a functional airspace block (FAB) jointly with Ireland, we are uniquely placed to help drive the ANSP community towards achieving an operational environment in which everyone is performance oriented, and in which customers do not notice the transition between national boundaries and/or FABs.
Against this, our Vision is for an ATC operation by 2020 that is very different from today’s in line with the SESAR concept. There will be a significant evolution in NERL’s operations over the next 10 years, in line with the SES initiative, such that by 2020:
• The Pilot: generally flies optimum routes and profiles, makes good use of aircraft capability, typically receives few short term clearances, and rarely suffers en route delay in UK airspace with no airborne holding
• The Air Traffic Controller/Manager: is supported by tools within a fully electronic environment which are trusted and valued, is planning ahead and monitoring conformance with reduced tactical intervention, and holds tool-based validations allowing greater flexibility in how staff are deployed on a day-to-day basis to meet traffic demand
• Airspace and Procedures: the ATC environment is more strategic with planning on a gate-to-gate basis, the operational concept is standard across all FAB units to ensure efficient use of airspace, and air routes are more highly systemised and closely spaced in order to minimise constraints to efficient aircraft operation
• Systems and Technology: are common between our two Centres, provide a wide range of support to controllers to improve productivity, support interoperability with airborne systems and adjacent centres, enable access to accurate and up-to-date information via SWIM, provide full contingency capabilities, and are resilient to failure
• Our Customers: experience a service with greater safety and minimal delay, observe tangible reductions in fuel burn and emissions, trust NERL to deliver projects on time and to budget, and recognise the value and quality of NERL’s services.
This 10-Year Plan, therefore, is in service of this vision of our operations in 2020.

NERL 10 Year Plan: Page 10
4 Strategic Objectives and Targets
A Balanced Business Model
We use a simple model (alongside) to reflect a balance between our business priorities, objectives and licence obligations. In essence this is to meet customer requirements efficiently, with adequate returns to shareholders, all at manageable risk.
It also reflects NERL’s business as a part of the UK’s national infrastructure which needs to ensure that the company concentrates as much on delivering long-term capability as it does on the short-term – the two must remain in balance for NERL to be able to meet its licence obligations as well as its customers’ needs.
Ensuring Balance
The focus of our 10 Year Plan is on economic value to customers from fuel efficiency and service quality. This reflects the direct impact on airlines’ operating costs of ATC delays and inefficient flight profiles being highly geared compared to price reduction from significant operating cost savings and lower charges.
For example, avoiding a 10 second increase in average delay with today’s traffic would save airlines around £14m pa in direct delay costs (using Eurocontrol’s estimate of €39/min at 2006 price levels for delays on the ground at the gate). Moreover, a 1% reduction in emissions across our network at today’s fuel prices (and £/$ exchange rates) and with today’s fleet would represent a saving of around £33m pa. In contrast, greater operating cost efficiencies beyond this Plan would place such benefits at risk.
The benefits to customers will come from the operational evolution of NERL’s services through the 10 year period. The plan is for series of operational, technical and airspace changes that enable safety, capacity, environment and cost efficiency benefits. In CP3 there is a strong focus on developing SESAR followed by deploying SESAR in CP4, with the benefits of SESAR emerging during CP4.
To be in balance, the business model must ensure that risks remain manageable. This is to ensure that we can maintain the necessary financial robustness for an investment grade rating to sustain long term investment programmes in service of customer requirements.
As with any business, we need to generate a return to shareholders that is adequate and compensates them appropriately for their investment risk.
Plan Outputs – Strategic Objectives and Targets for CP3 & CP4
With the objective of maintaining this balance, NERL’s strategic targets for CP3 and CP4 are set out in summary form in the table overleaf.
There is a need, however, to integrate the emerging SES requirements and NERL’s Licence requirements, particularly in relation to the SES Performance Scheme, details of which are being developed but should be decided in 2010. Since some key details are still under discussion, some changes to the Plan and/or targets may be necessary to ensure coherence with the new scheme. Therefore, we will work with DfT and CAA to ensure the correct alignment between SES and Licence requirements.
NERL 10 Year Plan: Page 11
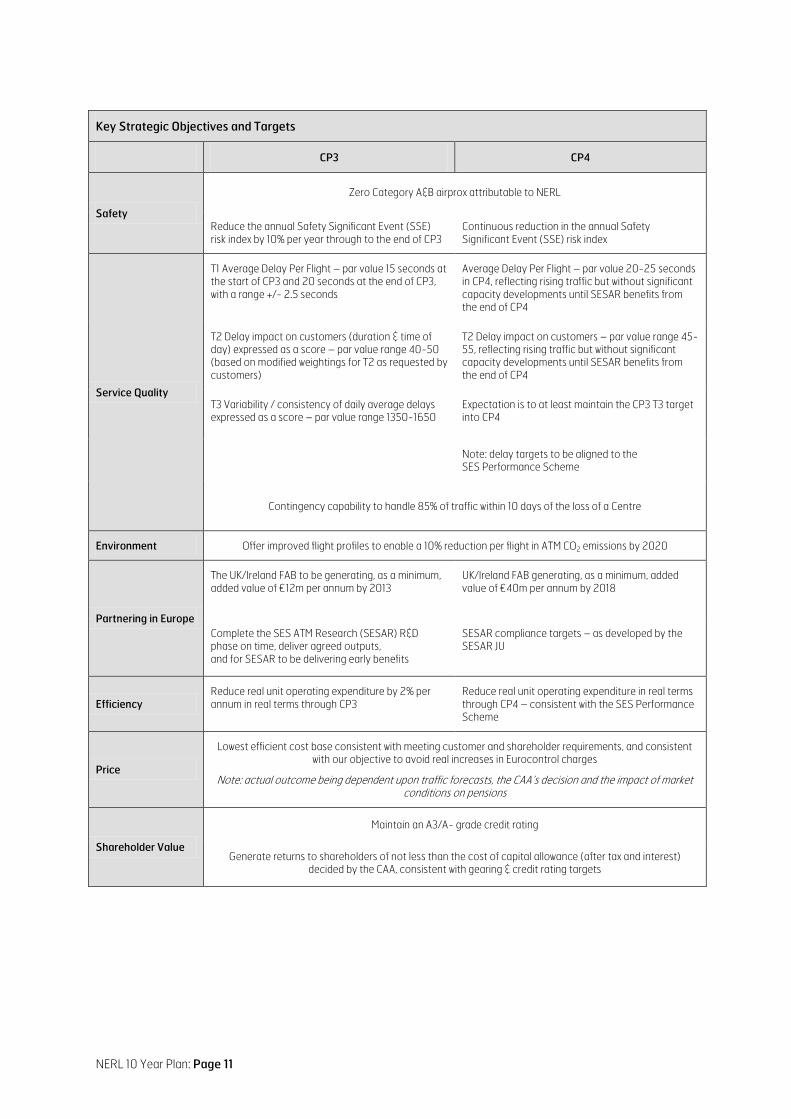
Key Strategic Objectives and Targets
CP3 CP4
Safety
Zero Category A&B airprox attributable to NERL
Reduce the annual Safety Significant Event (SSE) risk index by 10% per year through to the end of CP3
Continuous reduction in the annual Safety Significant Event (SSE) risk index
Service Quality
T1 Average Delay Per Flight – par value 15 seconds at the start of CP3 and 20 seconds at the end of CP3, with a range +/- 2.5 seconds
Average Delay Per Flight – par value 20-25 seconds in CP4, reflecting rising traffic but without significant capacity developments until SESAR benefits from the end of CP4
T2 Delay impact on customers (duration & time of day) expressed as a score – par value range 40-50 (based on modified weightings for T2 as requested by customers)
T2 Delay impact on customers – par value range 45-55, reflecting rising traffic but without significant capacity developments until SESAR benefits from the end of CP4
T3 Variability / consistency of daily average delays expressed as a score – par value range 1350-1650
Expectation is to at least maintain the CP3 T3 target into CP4
Note: delay targets to be aligned to the SES Performance Scheme
Contingency capability to handle 85% of traffic within 10 days of the loss of a Centre
Environment Offer improved flight profiles to enable a 10% reduction per flight in ATM CO2 emissions by 2020
Partnering in Europe
The UK/Ireland FAB to be generating, as a minimum, added value of €12m per annum by 2013
UK/Ireland FAB generating, as a minimum, added value of €40m per annum by 2018
Complete the SES ATM Research (SESAR) R&D phase on time, deliver agreed outputs, and for SESAR to be delivering early benefits
SESAR compliance targets – as developed by the SESAR JU
Efficiency Reduce real unit operating expenditure by 2% per annum in real terms through CP3
Reduce real unit operating expenditure in real terms through CP4 – consistent with the SES Performance Scheme
Price
Lowest efficient cost base consistent with meeting customer and shareholder requirements, and consistent with our objective to avoid real increases in Eurocontrol charges
Note: actual outcome being dependent upon traffic forecasts, the CAA’s decision and the impact of market conditions on pensions
Shareholder Value
Maintain an A3/A- grade credit rating
Generate returns to shareholders of not less than the cost of capital allowance (after tax and interest) decided by the CAA, consistent with gearing & credit rating targets
NERL 10 Year Plan: Page 12
5 Safety Plan
Safety is the DNA of our operations and NERL is committed to continually improving safety performance as our service develops. Our safety strategy is designed to deliver a significant reduction in the likelihood of a collision involving aircraft receiving a NERL service. Our high level strategic safety objectives are:
To Continue Our Year-on-Year Safety Performance Improvement: including…
• Reducing risk in the London TMA to a level comparable to other NERL operations
• Reducing the risk of human performance error in our operation
• Optimising human input / interaction
• Implementing innovations in the technical elements of our system to improve safety
• Improving airspace and procedure design that will result in inherently safer operations in the future.
To Shape the Future of ATM Safety: including…
• Improving measurement and prediction of ATM risk
• Evolving our safety management system to meet the changing needs of our business
• Participating in development of a European ATM safety regulatory framework, the SESAR programme and the UK-Ireland FAB – to efficiently deliver safety benefits.
Our strategic objective is to deliver an ATM system operated by highly competent people (controllers, assistants, pilots and engineers) with appropriate skills and behaviours, applying safe procedures, within airspace designed to meet the demands of airspace users and supported by effective technical systems. Working with others (airlines, pilots, ANSPs, regulators etc.) to deliver safety improvement is a central theme for all our safety improvement activities.
CP3 Plan
Meeting our safety targets will be very challenging. Since more than 70% of the risk in NERL is recorded by London Terminal Control (LTC), a major focus of our improvement actions will be on this part of our operation.
Delivery of the required safety improvement falls into three main themes:
• Human Performance – currently accounting for approximately 98% of all NATS safety related incidents, we will implement a programme of behavioural change in order to reduce year on year the risk of a collision which could be attributed in full or part to human performance
• Technical Systems – reducing or mitigating the likelihood of human errors and the severity of the outcomes through deployment of technical systems (e.g. technical systems aimed at addressing particular hazards such as aircraft non-conformance to ATC clearances), to be delivered by our ongoing capital investment programme
• Airspace & Procedure Design – improving the way we design and manage our controlled airspace in order to provide a long-term improvement in safety, with priority in the London TMA.
NERL 10 Year Plan: Page 13
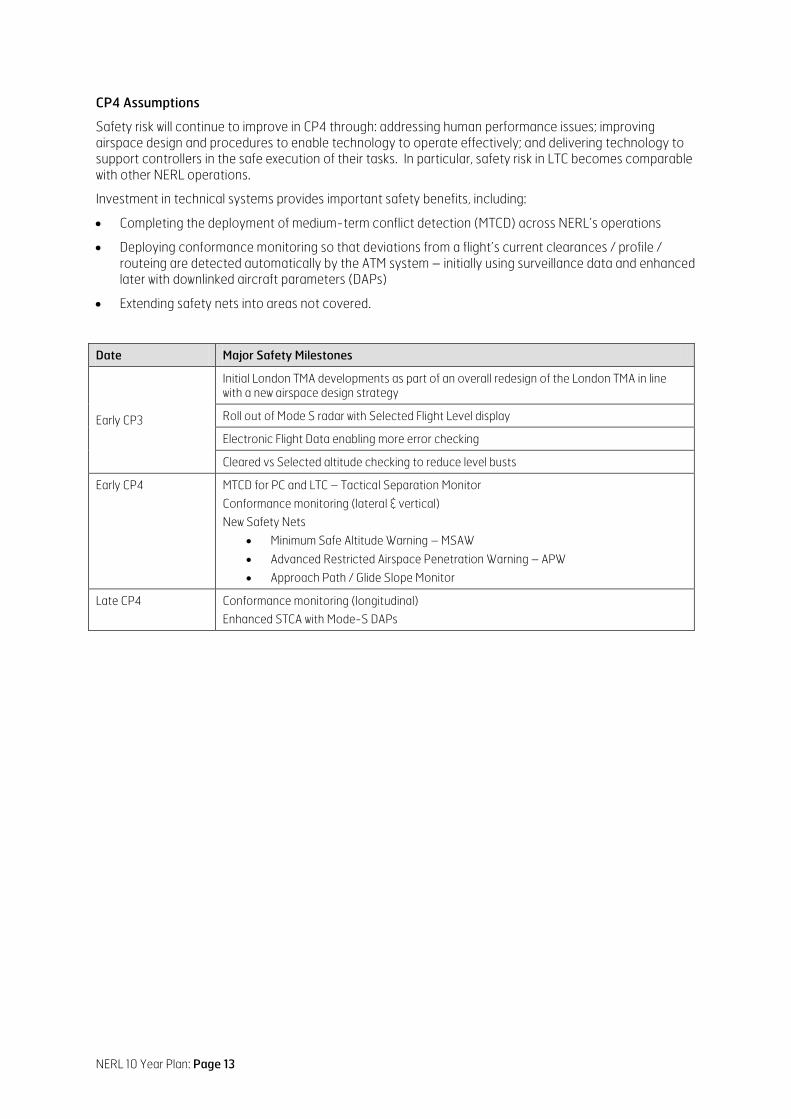
CP4 Assumptions
Safety risk will continue to improve in CP4 through: addressing human performance issues; improving airspace design and procedures to enable technology to operate effectively; and delivering technology to support controllers in the safe execution of their tasks. In particular, safety risk in LTC becomes comparable with other NERL operations.
Investment in technical systems provides important safety benefits, including:
• Completing the deployment of medium-term conflict detection (MTCD) across NERL’s operations
• Deploying conformance monitoring so that deviations from a flight’s current clearances / profile / routeing are detected automatically by the ATM system – initially using surveillance data and enhanced later with downlinked aircraft parameters (DAPs)
• Extending safety nets into areas not covered. Date Major Safety Milestones
Early CP3
Initial London TMA developments as part of an overall redesign of the London TMA in line with a new airspace design strategy
Roll out of Mode S radar with Selected Flight Level display
Electronic Flight Data enabling more error checking
Cleared vs Selected altitude checking to reduce level busts
Early CP4 MTCD for PC and LTC – Tactical Separation Monitor
Conformance monitoring (lateral & vertical)
New Safety Nets
• Minimum Safe Altitude Warning – MSAW
• Advanced Restricted Airspace Penetration Warning – APW
• Approach Path / Glide Slope Monitor
Late CP4 Conformance monitoring (longitudinal)
Enhanced STCA with Mode-S DAPs

NERL 10 Year Plan: Page 14
6 Service Plans
We are committed to delivering exemplary service performance and, through consultation with our customers, identifying and implementing new standards in service quality.
NERL’s aims are to: increase ATM system capacity to meet forecast demand; provide a service that meets licence obligations; provide more efficient and environmentally beneficial routes and profiles balanced with capacity needs – all in a manner that improves safety where practicable.
To achieve this, our operational service will go through a period of significant evolution over the next 10 years in concepts, airspace structures and tools. The NERL Roadmap defines the evolution of NERL’s ATM services, and the systems that support them, in order to meet performance targets and service developments.
We are fully committed to finding solutions across Europe and the intention is that all R&D and new projects will be fully aligned with SESAR where appropriate. Hence, our plans have an increasing focus on the SESAR operational concept for 2020 and the joint European development effort to deliver it.
6.1 UK Air Traffic Service
NERL provides air traffic services in controlled airspace within the London and Scottish Flight Information Regions, together with navigation and various ancillary services and services outside controlled airspace where needed to support commercial operations to regional airfields. It is part of the joint and integrated civil/military system of ATS provision that operates in UK airspace.
From January 2010, following the completion of NERL’s strategy to halve the number of its ATC Centres, services will be provided from two Centres at Swanwick and Prestwick. Approach control services for Heathrow, Gatwick, Stansted, Luton and London City airports are provided from Swanwick. This is to ensure that these airports’ runways and surrounding airspace are managed as an integral part of very busy and complex terminal airspace.
CP3 Plan
Staffing: We will ensure that we have adequate staffing levels to operate the service safely and with good resilience such that the risk of staffing delays in CP3 is minimised, consistent with efficiency objectives.
Airspace Development: We will continue to develop the airspace and sector structure to create additional capacity and improve fuel efficiency. Strategic developments include a major redesign of the London TMA to improve safety and environmental performance. We also plan for greater application of airspace systemisation, exploiting the improved navigation performance of modern aircraft (PRNAV) to allow more routes to be accommodated in the same airspace with minimum controller intervention. However, following customer consultation we have deferred some previously planned en route airspace changes, with some risk of a capacity lag should traffic recover in CP3 faster than the January 2010 base case traffic forecast.
Tools and Automation: We will continue to implement new systems and tools which, as well as improving capacity, are seen as one of the key means of enhancing safety, of allowing more direct routeings and profiles to deliver environmental benefits, and of reducing operating costs. Key developments in CP3 include completion of all-electronic (paperless) operations at all Centres (reducing support staff and increasing capacity) and introduction of the iTEC advanced flight data processing system as the platform for future safety, flight efficiency and capacity tools. Both are essential enablers for SESAR.
Traffic Management: We will continue to develop our network management techniques to ensure that available capacity is fully exploited at a national and FAB level, and such that we can optimise the level of operational performance irrespective of the orientation of the North Atlantic tracks.
CP4 Assumptions
Developing SESAR in CP3 is followed by deploying SESAR in CP4, with benefits of SESAR emerging during CP4.
NERL 10 Year Plan: Page 15
The later elements of the NERL Roadmap to be delivered in CP4 are aligned to SESAR operational implementation steps, designed to enable NERL to achieve SESAR compliance targets as they are developed by the SESAR JU.
The main technical elements of the NERL Roadmap planned to be delivered in CP4 are:
• Enhanced planning and conformance – to increase safety and sector productivity
• Introduction of 3D & 4D trajectory operations – moving from short-term tactical instructions to 3D/4D clearances for suitably equipped aircraft
• Centre systems and interoperability – a new common workstation (NCW) including common tools and ATC Methods of Operation at all units, to reduce operating costs and increase flexibility.
Additionally, the new concepts require tools and airspace to be developed together. Recognising that the return on investment of smaller and smaller sectors decreases over time, airspace design will be integrated with ground and airborne technology (e.g. larger sectors with advanced tools). En route airspace will become less structured, with terminal airspace becoming more highly systemised. Furthermore, with the iTEC advanced FDP, flexible sectorisation will be introduced where sector volumes can be adjusted dynamically in response to changes of traffic demand. With NCW, dynamic sectorisation can be introduced where responsibility for control of sectors can be switched between ACCs.
The combination of tools, automation and flexible / dynamic sectorisation will support increases in operational productivity such that the number of ATCOs can reduce in CP4 against projected traffic increases, with further reductions in support staff (ATSAs).
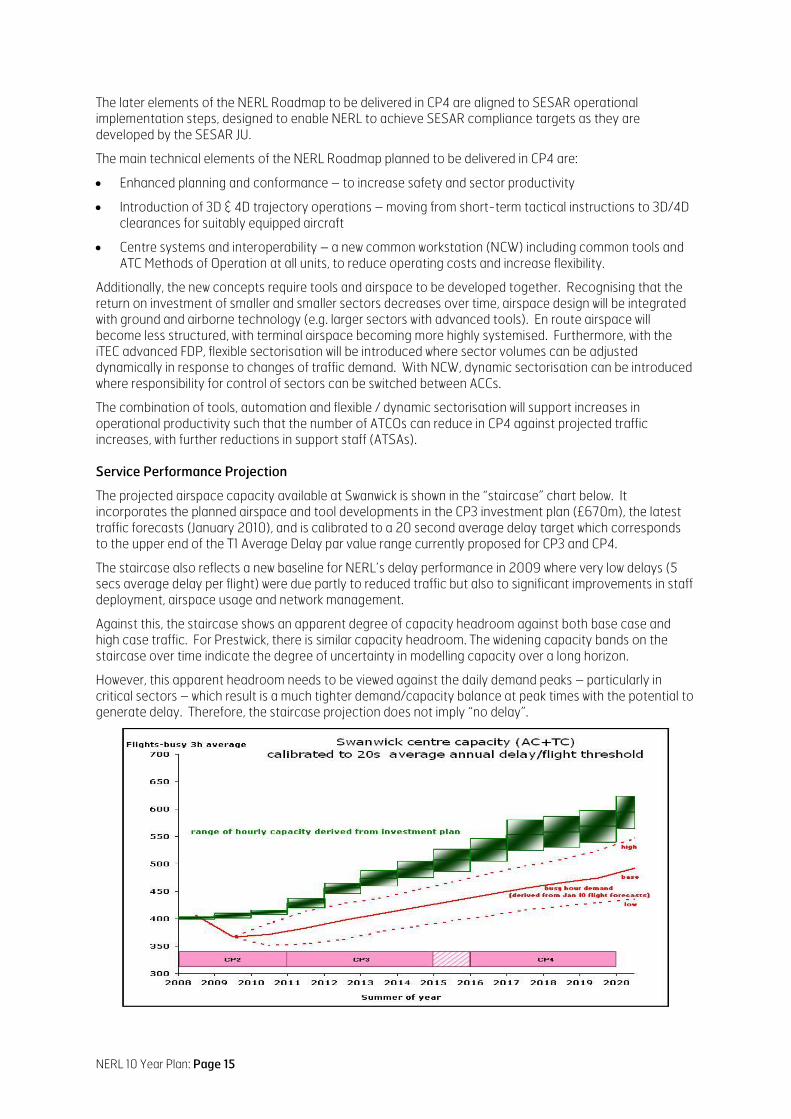
Service Performance Projection
The projected airspace capacity available at Swanwick is shown in the “staircase” chart below. It incorporates the planned airspace and tool developments in the CP3 investment plan (£670m), the latest traffic forecasts (January 2010), and is calibrated to a 20 second average delay target which corresponds to the upper end of the T1 Average Delay par value range currently proposed for CP3 and CP4.
The staircase also reflects a new baseline for NERL’s delay performance in 2009 where very low delays (5 secs average delay per flight) were due partly to reduced traffic but also to significant improvements in staff deployment, airspace usage and network management.
Against this, the staircase shows an apparent degree of capacity headroom against both base case and high case traffic. For Prestwick, there is similar capacity headroom. The widening capacity bands on the staircase over time indicate the degree of uncertainty in modelling capacity over a long horizon.
However, this apparent headroom needs to be viewed against the daily demand peaks – particularly in critical sectors – which result is a much tighter demand/capacity balance at peak times with the potential to generate delay. Therefore, the staircase projection does not imply “no delay”.

NERL 10 Year Plan: Page 16
6.2 Shanwick Oceanic
NERL is one of five main ATS providers in the ICAO North Atlantic Region and has responsibility for control in the Shanwick Oceanic Control Area in partnership with the Irish Aviation Authority who provide the communications service for the area. Control in the Shanwick Area has been jointly delegated to the UK and Irish Governments by the International Civil Aviation Organisation (ICAO) whose North Atlantic Systems Planning Group (NAT SPG) co-ordinates operational performance and developments across the Region. NERL’s Shanwick Oceanic ACC is in the Prestwick Centre.
CP3 Plan
Our main focus is on improving the efficiency of flight operations in alignment with ICAO plans for the North Atlantic Region, through increased capacity on optimum routeings (through further separation reductions) and improved flexibility for flights. This will be enabled by advanced FDP systems and tools, and through a greater proportion of aircraft equipped with datalink communication / position reporting and higher navigational performance standards.
The next step is implementation in 2010 of reduced time-based longitudinal separation (down to 5 mins) between suitably equipped aircraft, with an initial focus on facilitating climbing and descending traffic. The application of reduced lateral separation – to 0.5 degree route separation – will follow in early CP3.
CP4 Assumptions
The Shanwick Oceanic automated air traffic system (SAATS) remains in service throughout CP4 following a hardware refresh in CP3, with regular (annual) system upgrades in CP4 in line with Oceanic developments.
With reduced lateral separation and ADS-C / CPDLC roll-out completed in 2015 to further optimise the track structure and improve route efficiency, NAT SPG development activity in CP4 is focused on developing airborne separation assurance (ASAS) procedures – linked to SESAR – to increase the efficiency of oceanic operations and enable greater flight flexibility, with initial trials expected in CP4. Additionally, enhanced resilience and standardisation between adjacent Oceanic Centres will be implemented during CP4, increasing contingency capability.
Service Performance Projection
In terms of service quality, c. 97% of westbound flights currently receive an Oceanic clearance that is either the same as requested, or differs in only one dimension (height, speed or track). We expect to maintain and further enhance this level of performance, whilst at the same time offering progressively greater tactical flexibility as the take-up of datalink services grows.
6.3 Other Services
MOD Service
NERL provides the technical services to the MoD that allow their controllers, operating from NERL Centres, to provide an en route ATC service to military aircraft. This arrangement is governed by a long term commercial contract between MoD and NERL, which also benefits NERL’s civil customers by making best use of the assets needed by both parties. For the purposes of this plan, it is assumed that this contract is rolled on.
We will maintain the strategically important “Joint & Integrated” approach to ATC service provision, sharing rather than segregating airspace. We recognise its value in increased operational safety, increased flexibility of airspace design and usage to support better environmental and service performance, and as a show-case model within Europe and the world.
NERL 10 Year Plan: Page 17
North Sea Helicopters
NATS provides air traffic services for helicopters supporting the offshore oil industry in the North Sea. This specialist en route service is provided by NATS Services Limited (NSL – on behalf of NERL) from Aberdeen.
Through regular consultation with the UK offshore operators, we will continue to develop and provide an increasingly sophisticated and safe service in order to meet customer demands in a very hostile North Sea environment for helicopter operations, but recognising the oil industry’s economic peaks and troughs which drive demand for the service.
Additional Services
The additional services introduced during CP2 will be continued into CP3 and CP4, subject to their success continuing to be demonstrated:
• Extended Farnborough-London lower area radar service (LARS) to address the safety risk caused by infringements of London TMA airspace
• Sudden loss and mitigation (SLAM) to provide contingency for ongoing service in the event of a catastrophic loss of service from one of NERL’s Centres
• The use of SLAM to provide some additional ATC services outside controlled airspace (ATSOCAS)
• Aviation charting and data service – becoming one of NERL’s specified services within the price control, rather part of the CAA’s functions / charges.
We will continue to identify other value-adding services for possible introduction in consultation with customers and the CAA.
Contingency
The contingency plan in the event of a major centre failure is to use facilities at alternate NERL locations. The number of workstations currently available limits the level of service the facilities can support to c. 50% of peak pre-incident demand.
The plan is for an 85% contingency capability within 10 days of a catastrophic incident, albeit that some of these flights would re-route to avoid the affected airspace.
Unregulated Business
The existing regulatory framework provides limited opportunity for long-term growth beyond generating efficiencies in regulated services. Therefore, we are keen to explore with the CAA innovative ways of developing the regulatory framework to provide appropriate incentives to grow the business with risk and returns shared appropriately between shareholders and customers.
NERL 10 Year Plan: Page 18
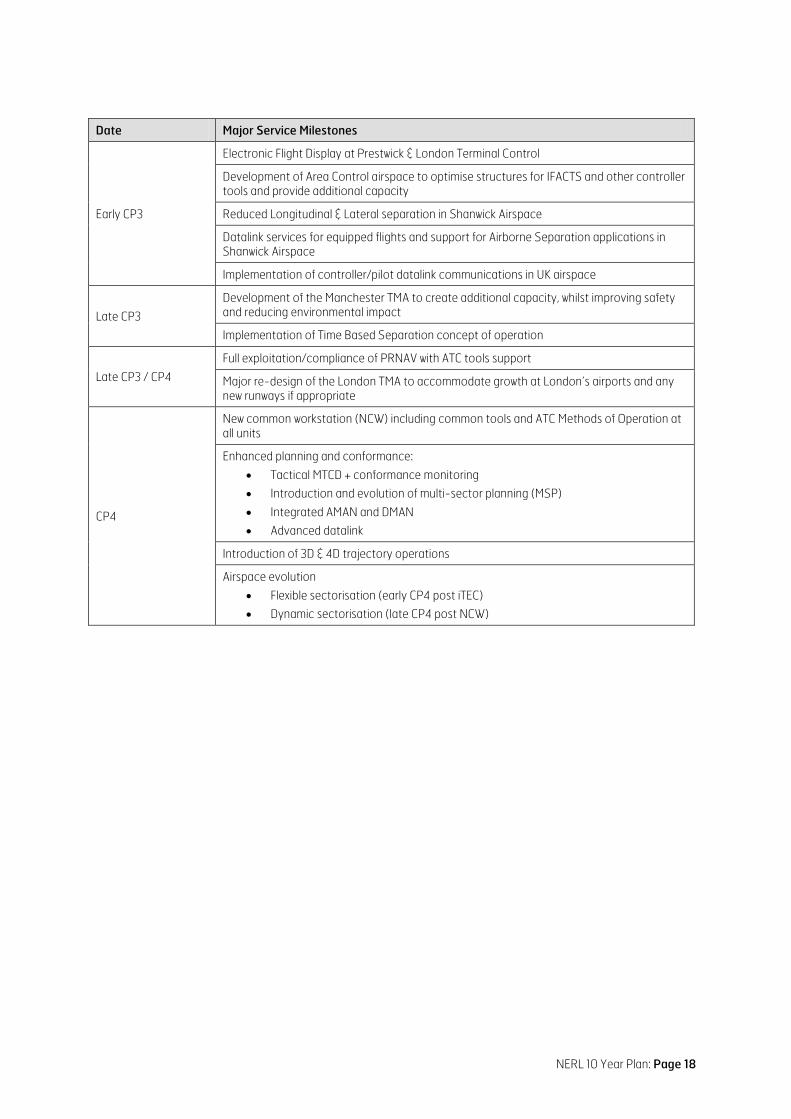
Date Major Service Milestones
Early CP3
Electronic Flight Display at Prestwick & London Terminal Control
Development of Area Control airspace to optimise structures for IFACTS and other controller tools and provide additional capacity
Reduced Longitudinal & Lateral separation in Shanwick Airspace
Datalink services for equipped flights and support for Airborne Separation applications in Shanwick Airspace
Implementation of controller/pilot datalink communications in UK airspace
Late CP3
Development of the Manchester TMA to create additional capacity, whilst improving safety and reducing environmental impact
Implementation of Time Based Separation concept of operation
Late CP3 / CP4
Full exploitation/compliance of PRNAV with ATC tools support
Major re-design of the London TMA to accommodate growth at London’s airports and any new runways if appropriate
CP4
New common workstation (NCW) including common tools and ATC Methods of Operation at all units
Enhanced planning and conformance:
• Tactical MTCD + conformance monitoring
• Introduction and evolution of multi-sector planning (MSP)
• Integrated AMAN and DMAN
• Advanced datalink
Introduction of 3D & 4D trajectory operations
Airspace evolution
• Flexible sectorisation (early CP4 post iTEC)
• Dynamic sectorisation (late CP4 post NCW)
NERL 10 Year Plan: Page 19
7 Environmental Plan
We are playing a full and active part in the aviation industry’s drive towards long term sustainability and control of environmental impacts.
In 2008 we became the first ANSP to calculate the baseline CO2 performance of our airspace system and we set a target to reduce ATM related emissions by 10% per flight on average by 2020. By the beginning of CP3, we will have a defined ATM CO2 Action Plan with milestones and targets for CP3 and CP4, including a timeline of environmental targets for projects. This timeline identifies the gap between the CO2 and fuel burn benefits identified in our plans and that required to reach our target. A programme is in place to identify further efficiency benefits through CP3 and CP4 to achieve our target.
CP3 Plan
The plan to achieve our targets focuses on the following 5 areas:
• People & Operations: better information and awareness amongst our staff – typical operational outcomes might include less level capping, wider use of speed control and more co-ordination of delays on-stand to minimise ground and air holding
• Airspace Design & Route Network: such as further developments to Flexible Use of Airspace, better climb and descent profiles, more efficient procedures to reduce aircraft holding
• Technology/ATC Tools: including arrival and departure managers and precision navigation techniques to allow aircraft to fly closer to their optimum profile and speed
• Partnership: collaboration with industry partners and regulators to find new and quicker ways of implementing environmental solutions
• Innovation: extending our pioneering environmental baseline work into ground breaking operational analysis and research to ensure technology choices help us to track towards our environmental targets.
CP4 Assumptions
These themes continue into CP4, the main lines of action expected to deliver CO2 reductions being:
• People & Operations: continued reinforcement of environment as part of NATS’ and the aviation industry’s operational culture, together with realising the fuel efficiency benefits derived from new technology (such as iFACTS and iTEC) and from flexible sectorisation
• Airspace Design & Management: major redesign of TMA airspace (London, Manchester and Scottish), and the introduction of multi sector planning and advanced planner tools
• Technology: enhancement of arrival and departure management tools, together with further deployment of precision routeing and separation technologies allowing more aircraft to fly more direct or fuel efficient routes
• Partnership: continued activity with airlines, airports and the CAA as well as neighbouring ANSPs to identify and deliver new improvements in environmental performance. These may include, for example, solutions related to runway capacity declarations, weather resilience and smoother flight and speed profiles across ANSP boundaries etc.
• Innovation: continued tracking of the environmental efficiency of our ATM system, and research and innovation to identify opportunities and solutions for further improvement. This may include, for example, a potential review of route charges to incentivise focus on environmental efficiency as well as cost efficiency (pending the effectiveness of EU or international emissions trading schemes).

NERL 10 Year Plan: Page 20
Performance Projection
We are committed to developing appropriate ATM CO2 performance metrics for CP3, but recognising that this is an area where the science is fairly new and relatively immature. We are presently working hard to establish a CO2 / fuel efficiency metric from the start of CP3 to meet airlines’ request. We are proposing a metric to the CAA and customers in April 2010 for consultation that could potentially be financially incentivised from the beginning of CP3.
Beyond that, we have agreed with customers a roadmap approach for the introduction of robust metrics consistent with SES performance scheme. The roadmap comprises a series of steps with associated timescales designed to help us overcome the gaps in industry understanding of ATM fuel efficiency / CO2 metrics.
Date Major Environmental and Fuel Efficiency Milestones
CP3
Customer supported trials programme to evaluate environment performance metric(s)
Financially incentivised metric implemented
Fuel efficiency benefits derived from new technology – iFACTS and iTEC
Late CP3 / CP4 Full exploitation/compliance of PRNAV with ATC tools support
CP4
Major airspace redesigns implemented - LTC, MTMA and STMA
Fuel efficiency benefits derived from new technology – integrated AMAN and DMAN, multi sector planning and advanced planner tools
Precision routeing and separation technologies allowing more aircraft to fly more direct or fuel efficient routes
NERL 10 Year Plan: Page 21
8 Partnering in Europe
Single European Sky (SES)
As a firm supporter of SES, we believe that the performance improvements demanded by our customers will only be possible through the SES initiative and partnership with others. SES is based around four pillars, namely:
• A performance framework – which includes:
o Driving the performance of the air traffic control system through a EU wide performance scheme with overall EU targets for capacity/delay, safety, cost efficiency and the environment – to be delivered through national (or FAB) performance plans. EU targets for the 1st reference period (2012-14) will be set in 2010 with national plans agreed in 2011
o Facilitating the integration of service provision – integrating and rationalising airspace and ATS service delivery and development through Functional Airspace Blocks (FABs), to be established by 2012 at the latest
o Strengthening the network management function – addressing overall network design and traffic / flow management
• A single safety regulatory framework – extending the European Aviation Safety Agency’s (EASA) responsibilities to cover ATM (and airports), to bring greater consistency and coherence to aviation safety
• Opening the door to new technologies – via the SES ATM Research (SESAR) European collaborative R&D programme which has defined a “master plan” for future ATM network concepts, technologies and methods of operation. A SESAR Joint Undertaking (JU) will deliver the R&D phase through 2009-16, leading to SESAR’s operational and technical standards which will be binding on ANSPs. Implementation will follow in a phased manner through 2013-20
• Managing capacity on the ground – ensuring that airport capacity remains aligned with ATM capacity to preserve the overall efficiency of the network.
SES Performance Scheme
Performance plans at national (or FAB) level will be drawn up by National Supervisory Authorities (CAA in the UK) with binding targets, consistent with Europe-wide targets, supported by incentive schemes. Key details of the SES performance scheme are still being developed and discussed, though should be decided in 2010. In particular, regard will have to be given to the targets set for SESAR and their alignment with SES performance targets and mandates. Thus, this 10-year Plan has been prepared before the SES scheme has been finalised and thus some changes may be necessary to ensure coherence with the new SES Scheme.
Furthermore, the scheme’s reference periods do not match the start or end dates of CP3 / CP4 and changes to the control periods are being considered by the CAA (explained earlier in Section 1 Introduction).
Functional Airspace Blocks (FABs)
The UK-Ireland FAB was the first to be set up in July 2008. It operates through a FAB Management Board with NATS, IAA, Airline and UK & Irish Military participation. The FAB is being evolved on a “design and build” basis under a UK-IR FAB Plan 2009-13, which includes near term objectives to co-ordinate and integrate plans, and to implement optimised airspace arrangements and operational interfaces.
As the FAB matures, we expect efficiency and operational benefits through common developments in direct routeings across much larger areas and greater efficiencies at the interfaces, and through unbundling of support services and shared resources.
NERL 10 Year Plan: Page 22
The UK-IR FAB Plan 2009-13 targets the generation of added value of at least €12m per annum by 2013 and €40m per annum by 2018. It is possible that for the second reference period of the SES performance scheme (2015-2019), performance targets and plans will be set at FAB level. Emerging UK-IR FAB opportunities (and potential economic benefit to customers) include:
• Flight efficiency (large) – the biggest cost benefit opportunity
• Operational consolidation / common support (minimal) – due to relative size of IAA ATC compared to NERL
• Night service delivery at FAB level (low) – but a future opportunity under SESAR with common systems and a FAB-wide architecture
• Cost efficiency (low) – where partnering within the FAB enables a move towards greater cost effectiveness throughout the FAB.
We expect to work closely with other adjacent FAB groups to explore opportunities.
SESAR
We are participating in the SESAR JU in the current development phase because, due to the complexity and density of UK airspace and its proximity to other FIRs, we need to be at the forefront of developing new concepts, and because a collaborative approach is likely to lead to lower product acquisition costs in the long-term. We also recognise that future ATM solutions need to be pan-European in order to meet performance targets. The SESAR JU is planned to complete in 2016.
Our SESAR JU participation is R&D investment that we would otherwise have to make in different ways (e.g. on our own) to develop future capability. We perceive our SESAR participation as “good value R&D” since it is collaborative, industry backed and 50% EC funded. The final legal basis of our participation did not grant us ownership rights in the SESAR JU entity nor in the IPR which is anticipated to be generated from this R&D investment. As founding members of the SESAR JU we do however have some contractual rights to influence how the IPR is treated once it has been delivered. At present there is an assumption that the partnership approach, combined with the 50% funding basis of SESAR, will lead to the output IPR being shared among ECAC states on a free or nominal cost basis. This will form the platform on which SESAR implementation can take place and realise benefits from SES itself. However, should a material revenue stream be created from the IPR, we would look to share those benefits with customers.
The output of the SESAR JU’s development phase is a set of three Implementation Phases (IP1, IP2 and IP3) where ANSPs (and the airline industry) will be required to align their concepts and systems to SESAR.
Our plans assume that the SESAR implementation timetable is maintained, although we recognise that progress may be affected by financial constraints, such as industrialisation costs for products from the SESAR development phase, and ANSP / government investment constraints.
In common with other ANSPs, we will achieve SESAR alignment as part of our on-going investment in asset replacement and development of future capability. As such, there are no “SESAR capital projects”. However, our capital investment plan has a significant SESAR compliance dimension – both in terms of supporting delivery of SESAR concepts and aligning to the implementation timescales for the CP3 / CP4 period. Essentially, our capital investment plan is developing SESAR in CP3 followed by deploying SESAR in CP4 with the benefits of SESAR emerging during CP4 (the full benefits of SESAR being realised in CP5).
NERL 10 Year Plan: Page 23
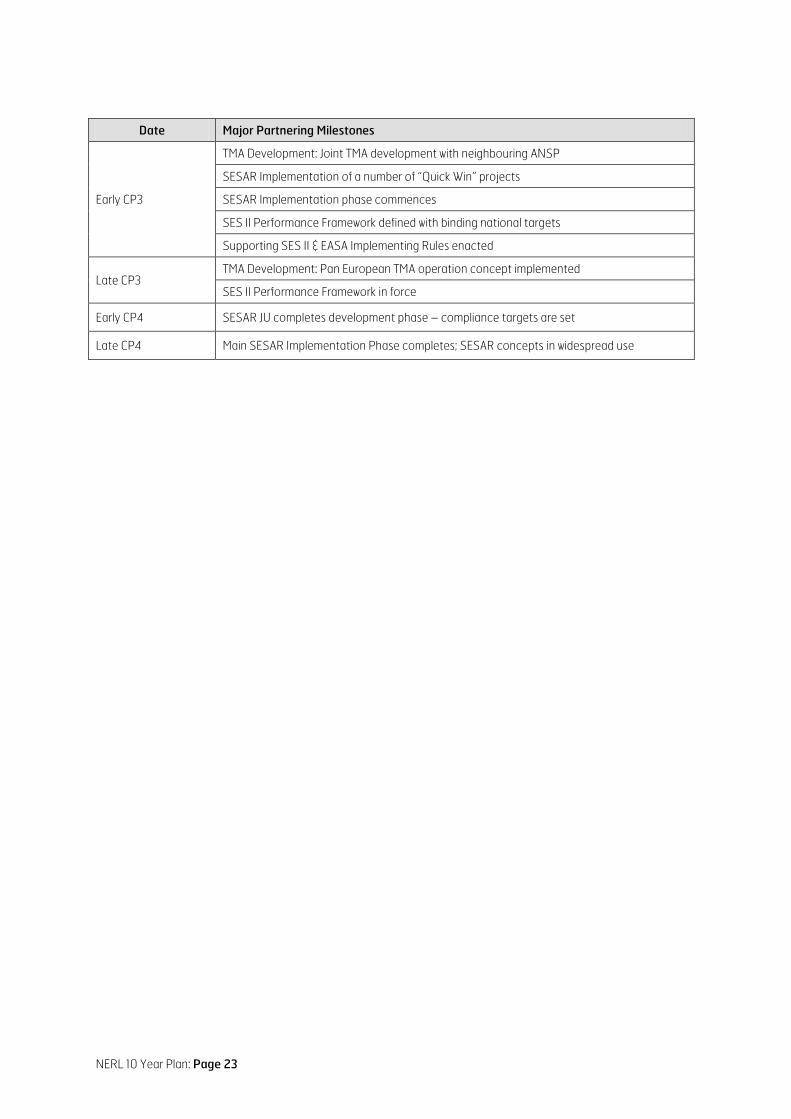
Date Major Partnering Milestones
Early CP3
TMA Development: Joint TMA development with neighbouring ANSP
SESAR Implementation of a number of “Quick Win” projects
SESAR Implementation phase commences
SES II Performance Framework defined with binding national targets
Supporting SES II & EASA Implementing Rules enacted
Late CP3 TMA Development: Pan European TMA operation concept implemented
SES II Performance Framework in force
Early CP4 SESAR JU completes development phase – compliance targets are set
Late CP4 Main SESAR Implementation Phase completes; SESAR concepts in widespread use

NERL 10 Year Plan: Page 24
9 Investment Plan
We provide a critical element of the UK and European transport infrastructure where we must take investment decisions for the longer term. Central to this is our Operational and Technology Roadmap (NERL Roadmap) which defines the significant evolution over the next 10 years in concepts, airspace structures and tools, the main phases being:
• Initial Electronic Tools: electronic (paperless) operations and automation tools to increase productivity of controllers
• Enhanced Planning & Conformance: replacing our current flight data processing (FDP) system (NAS) with an advanced FDP (iTEC) onto which advanced functions can then be added including multi-sector planning and conformance monitoring
• Commonality of systems and procedures: introduction of a new common workstation to complete consolidation of systems between the two Centres, enabling much greater staffing flexibility and major operational efficiencies
• SESAR Trajectory Operations: delivery of the SESAR 2020 concept to consolidate common systems and processes within Europe.
Based on the NERL Roadmap, our investment strategy for CP3 and CP4 is to:
a) replace end-of-life assets – especially the NAS FDP as well as completing major replacement programmes for radar and voice communications
b) optimise use of airspace for safety, flight efficiency and capacity benefits
c) deploy advanced ATC functions/tools (on the iTEC FDP platform) to enhance service quality and cost efficiency, and as a key enabler for SESAR in CP4
d) continue consolidation of facilities and systems to reduce operating costs.
Long-Term Investment Plan (LTIP)
Our LTIP currently comprises some 200 individual projects which have been grouped into 14 major programmes areas, as summarised below:
1. Initial Datalink Services: to supplement controller/pilot voice communication – as part of the Eurocontrol Link 2000+ programme and SESAR implementation.
2. En Route Airspace Developments: ongoing investment to develop the airspace and sector structures to create additional capacity and improve flight efficiency, and further development of the UK/Ireland Functional Airspace Block
3. TMA Airspace Developments: major restructuring of TMA airspace to improve flight efficiency and accommodate airport growth
4. iTEC FDP: the continued development and deployment of iTEC, our new FDP system which will replace NAS via a phased transition to mitigate operational risk. iTEC will be compliant with the System Wide Information Management (SWIM) network that is the information infrastructure “backbone” of the SESAR concept
5. New Common Workstation: with iTEC in place, we can then develop and deploy a new common workstation (NCW) across NERL operations, initially at Prestwick and then progressively at Swanwick, leading to lower development / operating costs and greater operational staffing flexibility
6. Advanced Tools: we will commence our investment in the new tools required for SESAR trajectory operations, including multi-sector planning and conformance monitoring, continuing this activity through CP4
7. Centre System Upgrades: continued investment in developing / upgrading core Centre systems (NAS, NODE, NERC and their replacements iTEC & NCW) to incorporate new functionality in line with airspace developments and tool deployments

NERL 10 Year Plan: Page 25
8. Oceanic/SAATS Development: our Oceanic (SAATS) system will also be developed and upgraded (jointly with NAVCANADA1
9. RSS: the radar site services programme will complete the major replacement of our radar infrastructure in order to overcome processing capacity limitations, deploy Mode S SSR and reduce ownership costs
) in line with developments in North Atlantic airspace, predominantly to increase flight efficiency over the North Atlantic Region
10. VCCS: a similar complete replacement of our voice communications (VCCS) infrastructure
11. DaVINCI Replacement: upgrade of the digital data network “ring-main” to accommodate higher data flows in the SESAR concept
12. Other CNS Infrastructure: including transition towards a satellite-based navigation infrastructure and the use of Automatic Dependent Surveillance (ADS) and Multi-lateration to augment radar
13. MoD: all these system upgrades and developments will carry through to MoD services under the terms of our commercial contract to achieve full Technical Compliance by 2015. There will also be MoD specific projects, notably to consolidate their current operation into the London Area Control operations room
14. Other: a number of smaller scale projects to: sustain existing assets (systems and software) until replacement; replace or upgrade other elements of our infrastructure (eg radio sites, radar data processing, simulators); deploy new safety nets; enhance traffic management capabilities; and including contingency held in reserve for implementing our ATM CO2 Action Plan once fully defined.
CP3 Plan
Our Draft 10 Year Plan included a base investment plan for CP3 of £650m outturn (£590m current prices), a significant reduction compared with our initial 2008 estimate of £750m outturn investment required in CP3 and the £682m outturn investment plan discussed during customer consultation.
This revised base investment plan is a cost-optimised plan that maintains our focus on safety improvement hot spots and service quality, but reduces capital cost by deferring some programmes and projects to reflect lower traffic and the latest understanding of the required alignment with the SESAR programme.
Since the Draft 10 Year Plan, we have brought forward some elements of the CO2 Action Plan (c. £4m) from 2015 to the 2013-2014 period to deliver environmental benefits to the customer earlier in CP3.
Additionally, NERL’s Technical Review Committee and the CAA’s independent experts (Logica CMG) have both concluded that we have not provisioned sufficient contingency in CP3 for the challenging iTEC programme. Therefore, after further careful consideration and review, we have incorporated an additional £20m contingency in CP3, increasing outturn investment to £670m.
This raised risk profile is mitigated to an extent by the significant improvements in NERL’s programme delivery capability, in particular in the way that we now manage and control risks in our programmes and projects via our portfolio approach.
It should be noted that – while the scope of the proposed plan is well defined – the planned cost of this investment can still vary due to exogenous factors. For example, the capitalised labour element is affected by assumptions on inflation and pension costs which could result in the same scope being delivered at a different outturn cost.
1 NAVCANADA – Canadian ANSP

NERL 10 Year Plan: Page 26
CP4 Assumptions
Investment in CP4 will fall into three broad categories:
1. Sustaining and replacing our asset base – a base level of essential investment where we could reasonably expect to spend up to 10% of our £1.2bn asset base per year (eg. workstation replacement with NCW, Centre systems upgrades, etc), although NERL’s estate / facilities are not expected to need significant investment during CP4
2. Developments currently planned – those already defined in the NERL Operational Roadmap where there are currently some broad estimates of potential costs and benefits. These developments include for example enhanced planning and conformance tools, airspace developments associated with the new tools, use of datalink, etc.
3. Developments still to be planned – these relate mainly to delivering a fully-interoperable, SESAR-compliant, set of common systems, processes and infrastructure upon which to implement SESAR trajectory operations. Here, the NERL Roadmap cannot be defined in detail until the current SESAR R&D phase nears fruition during CP3. Only very rough order of magnitude estimates can be made at this stage based on SESAR work to date.
Added to this, investment deferred in CP3 at customers’ request also needs to be accommodated in order to achieve SESAR alignment timescales.
Moreover, SESAR will increase investment in CP4 whilst, at the same time, the as yet undefined SES Performance Scheme will drive efficiency and reductions in operating costs. All this creates competing pressures on NERL.
However, an expected outcome of SESAR is a greater degree of ANSP investment taking place at FAB / collaborative level (eg. per the current iTEC model). However, there is still much uncertainty regarding the extent to which this will impact our investment plan.
Against this, overall total investment in CP4 is assumed to be in the range £650m-£750m current prices (£825m-£950m outturn) with the expenditure profile likely to be higher later in CP4 in line with SESAR implementation.
This range of investment is considered realistic given the size of our asset base and the SESAR related investment necessary in CP4, the upper end reflecting a high degree of uncertainty at this stage of SESAR.
Benefits of Investment
All investment is undertaken to provide benefits solely to customers, either directly by maintaining and improving the service delivered, by reducing delays, providing more fuel-efficient profiles or reducing operational risk, or indirectly by reflecting operating efficiencies in user charges.
The benefits of our investment in CP3 are fully defined in our “Plan for CP3”, whereas the benefits of investment in CP4 are less well defined (for the reasons explained above). However, we expect our investment in CP3 and CP4 to deliver benefits such that by the end of CP4:
• Our safety risk index will have reduced significantly, with all our operations having an equivalent level of safety (no hotspots)
• There is a substantial contribution to our target for reducing CO2 emissions, primarily through airspace and technology changes that enable a reduction in fuel burn but also by changes to the energy efficiency of our estate
• The combination of airspace and technology changes enable our largest operation (London Area Control) to be capable of handling c. 30% more flights, and our densest and most complex operation (London Terminal Control) around c. 15% more flights. The Prestwick Centre will also be able to handle around 30% more flights
• We will have delivered operating cost savings that ensure we reduce unit operating expenditure in real terms through CP4 – consistent with the SES Performance Scheme.
NERL 10 Year Plan: Page 27
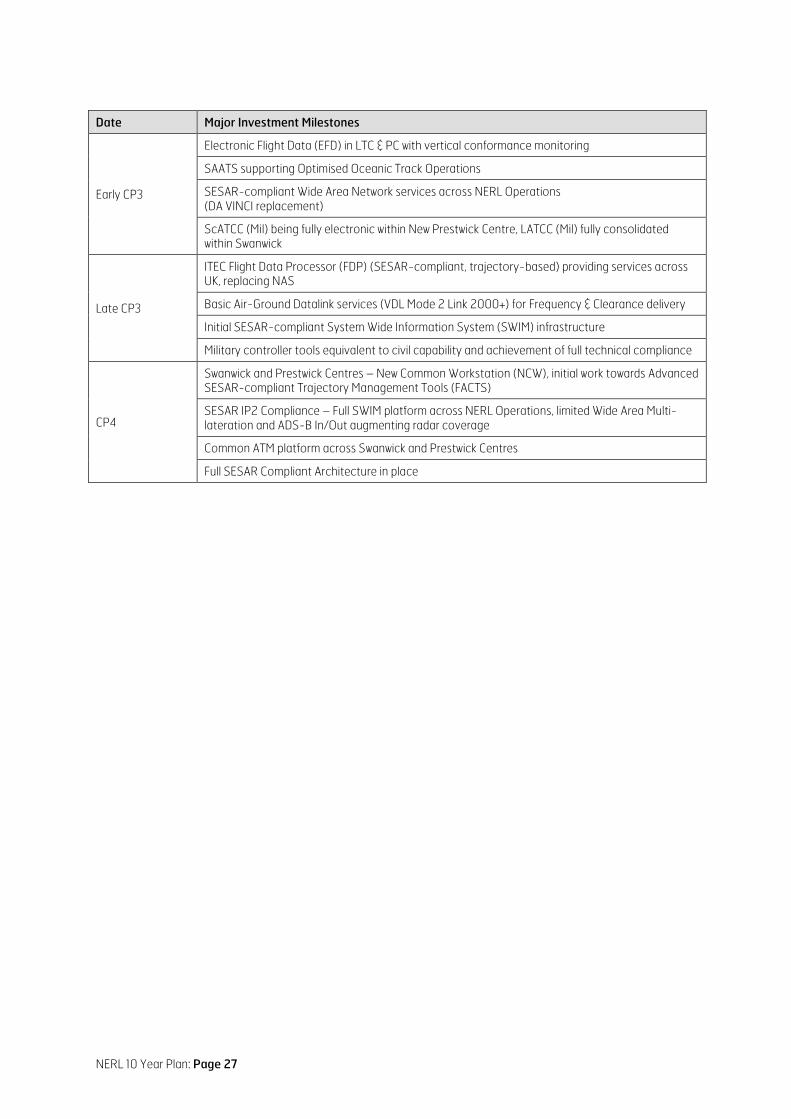
Date Major Investment Milestones
Early CP3
Electronic Flight Data (EFD) in LTC & PC with vertical conformance monitoring
SAATS supporting Optimised Oceanic Track Operations
SESAR-compliant Wide Area Network services across NERL Operations (DA VINCI replacement)
ScATCC (Mil) being fully electronic within New Prestwick Centre, LATCC (Mil) fully consolidated within Swanwick
Late CP3
ITEC Flight Data Processor (FDP) (SESAR-compliant, trajectory-based) providing services across UK, replacing NAS
Basic Air-Ground Datalink services (VDL Mode 2 Link 2000+) for Frequency & Clearance delivery
Initial SESAR-compliant System Wide Information System (SWIM) infrastructure
Military controller tools equivalent to civil capability and achievement of full technical compliance
CP4
Swanwick and Prestwick Centres – New Common Workstation (NCW), initial work towards Advanced SESAR-compliant Trajectory Management Tools (FACTS)
SESAR IP2 Compliance – Full SWIM platform across NERL Operations, limited Wide Area Multi-lateration and ADS-B In/Out augmenting radar coverage
Common ATM platform across Swanwick and Prestwick Centres
Full SESAR Compliant Architecture in place

NERL 10 Year Plan: Page 28
10 Efficiency and Manpower
Customers expect NERL to have the lowest possible efficient cost base consistent with meeting their requirements for safety, service and fuel efficiency.
We have achieved substantial efficiency improvements in CP1 and CP2 to date through: centre closures (two out of four); consolidation of property estate; restructuring of business areas; improved productivity of front line operations; improved quality and output of ATCO training; modernised terms and conditions; pension reforms; more stringent pay deals and a cost optimisation programme. Currently, we are handling 2004 levels of traffic with an operating cost base around 10% lower than in 2004/5, reflecting efficiencies to date.
We have also been proactive in responding to the economic recession by implementing a major cost saving programme which assumes a £45m (c. 15%) real reduction in the previously planned operating cost base by the end of CP2, including a 22% reduction in non-controller staff (c. 550 fewer people). This major cost saving programme amounts to a cumulative operating cost saving of £225m in CP3. Added to this, pension reforms introduced in 2009 will avoid costs currently estimated at around £200m in CP3, and a further £600m over the following 10 years, although these figures will vary depending on market conditions.
But the extent to which we can make further efficiencies is constrained by the nature of NERL’s cost base. Over the short to medium term, around two thirds of NERL’s costs relate broadly to its infrastructure and are fixed. The remainder of our costs are generally volume related. However, a reduction in traffic volume would not translate into a corresponding reduction in these costs. This is because the operation is sized to deal with daily traffic peaks which are still high, to meet safety regulations applying to ATCO working time, and to ensure our 24/7 operation has an appropriate level of resilience.
CP3 Plan
Our CP3 efficiency target is for a further £100m reduction in real unit operating expenditure (RUOE), which equates to a 2% pa reduction in RUOE.
This target assumes a further headcount reduction of c. 160 FTEs in CP3, i.e. another 5% cut in total headcount, resulting from:
• Further ATCO productivity and working practices improvements as NERL’s operation with iFACTS and EFD matures
• Further reductions in operational support staff (ATSAs)
• Further engineering rationalisation as new systems are introduced and future projects become more collaborative with industry, and through the reduction in the size of NERL’s investment plan compared with CP2
• Continuing back-office efficiencies as NERL’s headcount reduces.
These assumed savings are not yet secured, and therefore this is a “stretch” target where NERL is accepting risk that it can reduce headcount to this extent.
Customers considered, however, that this target is insufficient in the context of the actions airlines are taking. They require NERL to increase its efforts in reducing operating costs to enable lower charges, but without impairing service quality.
Our position is that the company’s efficiency must be assessed taking into account the progress made in the whole CP1-CP3 period, and not just CP3 in isolation. Substantial efficiency improvements have been made in CP1 and CP2 to date, and our £45m cost saving programme for the remainder of CP2 is a positive response to market conditions.
NERL 10 Year Plan: Page 29
In contrast, the efficiency target over CP3 recognises the need to service recovering traffic volumes over that period. Additionally, the level of operating costs set out in our Plan is efficient, a position supported by the studies of the efficiency consultants appointed by the CAA during 2009. Furthermore, with non-controller staff numbers already projected to decrease significantly by c. 28% by the end of CP3 with diminishing returns, any further reduction beyond our current Plan would come principally from reducing the number of front-line operational controllers. This would be at the expense of service quality and risk to customers which we believe would be unacceptable.
Taking all this into account, we believe that our CP3 efficiency target strikes an appropriate balance between:
a) the imperative to continue delivering good quality service to customers
b) the cost to customers of flight inefficiency and ATC delays which far outweighs price reductions through greater efficiency by NERL
c) given current forecasting uncertainty, there is the risk of traffic recovery exceeding the base case forecast set against relatively long lead times in reinstating capacity.
We have therefore proposed not to adjust our CP3 efficiency target.
Overall cost reduction in CP3
All told, the savings in our Plan avoid costs of over £0.5bn in CP3 at current prices:
• Our major cost saving programme to the end of CP2 amounting to a cumulative operating cost saving of £225m in CP3
• The further cumulative operating cost reduction of £100m as per our CP3 target
• Pension reforms introduced in 2009 which will avoid costs currently estimated at around £200m in CP3, although this figure will vary depending on market conditions.
Had we not taken this action, prices in CP3 would be some 18% higher.
CP4 Assumptions
The main areas of efficiency in CP4 are:
• ATCO productivity (tools / automation) – which will enable NERL to handle c. 14% more flights over the period against a modest decrease in ATCO numbers
• Technology progressively reducing the ATSA task such that no ATSAs are required in our operations rooms by 2020. Our residual operational support staff will acquire a greater range of skills in relation to training, simulation and development, although we do not expect voice recognition technology (DVI) in simulators to be sufficiently developed to replace operational support staff in the CP4 timeframe. Overall, operational support staff reduce by c. 10%
• The engineering support requirement reducing as new common / collaborative systems are delivered and as assets are replaced with low/zero maintenance equipments, but tempered by the task of delivering a demanding CP4 LTIP – with overall numbers reducing by c. 5%
• A continual reduction in management and support as the company’s size shrinks, and through business technology efficiencies – with numbers reducing by c. 9%
Around 1/3rd of non-staff costs are fixed (mostly property related) and are assumed to remain constant during CP4. The remaining 2/3rd are assumed to reduce during CP4, including further efficiencies in asset management, albeit with some uncertainty over future energy prices.
The overall CP4 efficiency target is expected to be of similar proportion to CP3, such that we will reduce RUOE in real terms through CP4 consistent with the SES Performance Scheme.

NERL 10 Year Plan: Page 30
CP3 / CP4 Manpower Projection
The planned profile of NERL’s manpower through CP3-CP4 is shown below.
This should be viewed in the context of a projected 50% increase in traffic handled over the CP1-CP4 period but with 30% fewer total staff.
Start CP1
2001/2 End CP2 2010/11
End CP3 2015/16
End CP4 2020/21
Controllers * 1,430 1,380 1,370 1350
Operational Support Staff 930 550 500 450
Engineers ** 1,180 860 780 750
Support & Mgt 900 600 580 530
Total 4,440 3,390 3,230 3,080
* including Trainees ** including Contractor Support
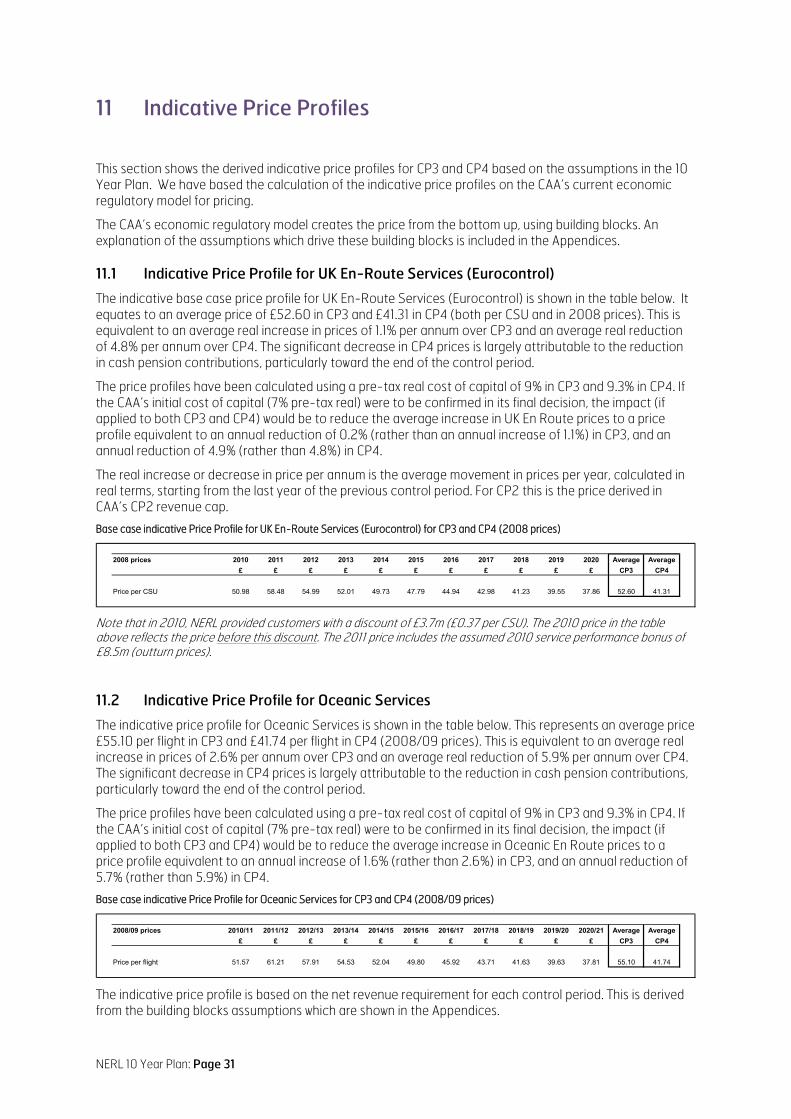
NERL 10 Year Plan: Page 31
11 Indicative Price Profiles
This section shows the derived indicative price profiles for CP3 and CP4 based on the assumptions in the 10 Year Plan. We have based the calculation of the indicative price profiles on the CAA’s current economic regulatory model for pricing.
The CAA’s economic regulatory model creates the price from the bottom up, using building blocks. An explanation of the assumptions which drive these building blocks is included in the Appendices.
11.1 Indicative Price Profile for UK En-Route Services (Eurocontrol)
The indicative base case price profile for UK En-Route Services (Eurocontrol) is shown in the table below. It equates to an average price of £52.60 in CP3 and £41.31 in CP4 (both per CSU and in 2008 prices). This is equivalent to an average real increase in prices of 1.1% per annum over CP3 and an average real reduction of 4.8% per annum over CP4. The significant decrease in CP4 prices is largely attributable to the reduction in cash pension contributions, particularly toward the end of the control period.
The price profiles have been calculated using a pre-tax real cost of capital of 9% in CP3 and 9.3% in CP4. If the CAA’s initial cost of capital (7% pre-tax real) were to be confirmed in its final decision, the impact (if applied to both CP3 and CP4) would be to reduce the average increase in UK En Route prices to a price profile equivalent to an annual reduction of 0.2% (rather than an annual increase of 1.1%) in CP3, and an annual reduction of 4.9% (rather than 4.8%) in CP4.
The real increase or decrease in price per annum is the average movement in prices per year, calculated in real terms, starting from the last year of the previous control period. For CP2 this is the price derived in CAA’s CP2 revenue cap.
Base case indicative Price Profile for UK En-Route Services (Eurocontrol) for CP3 and CP4 (2008 prices)
2008 prices 2010 2011 2012 2013 2014 2015 2016 2017 2018 2019 2020 Average Average£ £ £ £ £ £ £ £ £ £ £ CP3 CP4
Price per CSU 50.98 58.48 54.99 52.01 49.73 47.79 44.94 42.98 41.23 39.55 37.86 52.60 41.31
Note that in 2010, NERL provided customers with a discount of £3.7m (£0.37 per CSU). The 2010 price in the table above reflects the price before this discount
. The 2011 price includes the assumed 2010 service performance bonus of £8.5m (outturn prices).
11.2 Indicative Price Profile for Oceanic Services
The indicative price profile for Oceanic Services is shown in the table below. This represents an average price £55.10 per flight in CP3 and £41.74 per flight in CP4 (2008/09 prices). This is equivalent to an average real increase in prices of 2.6% per annum over CP3 and an average real reduction of 5.9% per annum over CP4. The significant decrease in CP4 prices is largely attributable to the reduction in cash pension contributions, particularly toward the end of the control period.
The price profiles have been calculated using a pre-tax real cost of capital of 9% in CP3 and 9.3% in CP4. If the CAA’s initial cost of capital (7% pre-tax real) were to be confirmed in its final decision, the impact (if applied to both CP3 and CP4) would be to reduce the average increase in Oceanic En Route prices to a price profile equivalent to an annual increase of 1.6% (rather than 2.6%) in CP3, and an annual reduction of 5.7% (rather than 5.9%) in CP4.
Base case indicative Price Profile for Oceanic Services for CP3 and CP4 (2008/09 prices)
2008/09 prices 2010/11 2011/12 2012/13 2013/14 2014/15 2015/16 2016/17 2017/18 2018/19 2019/20 2020/21 Average Average£ £ £ £ £ £ £ £ £ £ £ CP3 CP4
Price per flight 51.57 61.21 57.91 54.53 52.04 49.80 45.92 43.71 41.63 39.63 37.81 55.10 41.74
The indicative price profile is based on the net revenue requirement for each control period. This is derived from the building blocks assumptions which are shown in the Appendices.
NERL 10 Year Plan: Page 32
Appendix A: Plan Input Assumptions A1. Industry Uncertainties Excluded from the Plan
Key industry uncertainties that have not been included in the 10 Year Plan are as follows:
• The potential increased cost of spectrum licences in relation to radar and navigational aids (note: the cost for the use of frequency spectrum has been included in the plan);
• Future government legislation (i.e. passenger duty, VAT);
• Industry structure – opportunities for collaborations may emerge but no specific cost provisions have been included in the plan;
• Environment (effect of emissions trading) – cost, demand and service impact;
• FABs – any costs associated with potential further development of the UK/Ireland FAB or with links to FABEC;
• SES II – potential developments from SES II not included but resource included to influence the outcome;
• London City/Luton Approach – although the CAA has indicated that it is likely that these functions will be included within the London Approach revenue;
• Potential changes to DfT policy covering London Approach charges. A2. Regulatory & Accounting Assumptions
A2.1 Price Control Formula Assumptions
The indicative price profiles are based on the building blocks shown in Appendix B.
The regulatory model used to forecast price profiles for CP3 and CP4 are broadly similar to those used for CP2 and set out in the CAA’s policy statements. The main exceptions to this are as follows:
• Regulatory depreciation for new expenditure from the start of CP3 is calculated using a period of 15 years rather than 12 years;
• Full allowance for the cash cost of pensions are assumed in CP3 and CP4;
• The assumptions made by NERL relating to the regulatory depreciation of the regulatory asset base (RAB), the rolling incentive mechanism (RIM) and the treatment of the regulatory depreciation difference are set out in the revised business plan for CP3;
• The removal of the G term, as highlighted in CAA’s February consultation document;
• The regulatory cost of capital for CP3 is set on a pre-tax real basis at 9.0%, or 5.9% on a post–tax real basis, and 9.3% or 5.9% respectively for CP4. The pre-tax real regulatory cost of capital needs to increase in CP4 due to the requirement to fund tax payments as a return on an average RAB which is significantly lower than CP3.
• The service performance in CP3 and CP4 meet the regulatory expectations resulting in zero penalty or bonus.
• Both CP3 and CP4 are assumed to be 5 years in duration, but recognising that further discussion is to take place with the CAA regarding alignment of control periods with the SES Performance Scheme.
A2.2 Accounting Standards
The accounting standards used are consistent with those adopted for the financial year ended 31st March 2009.
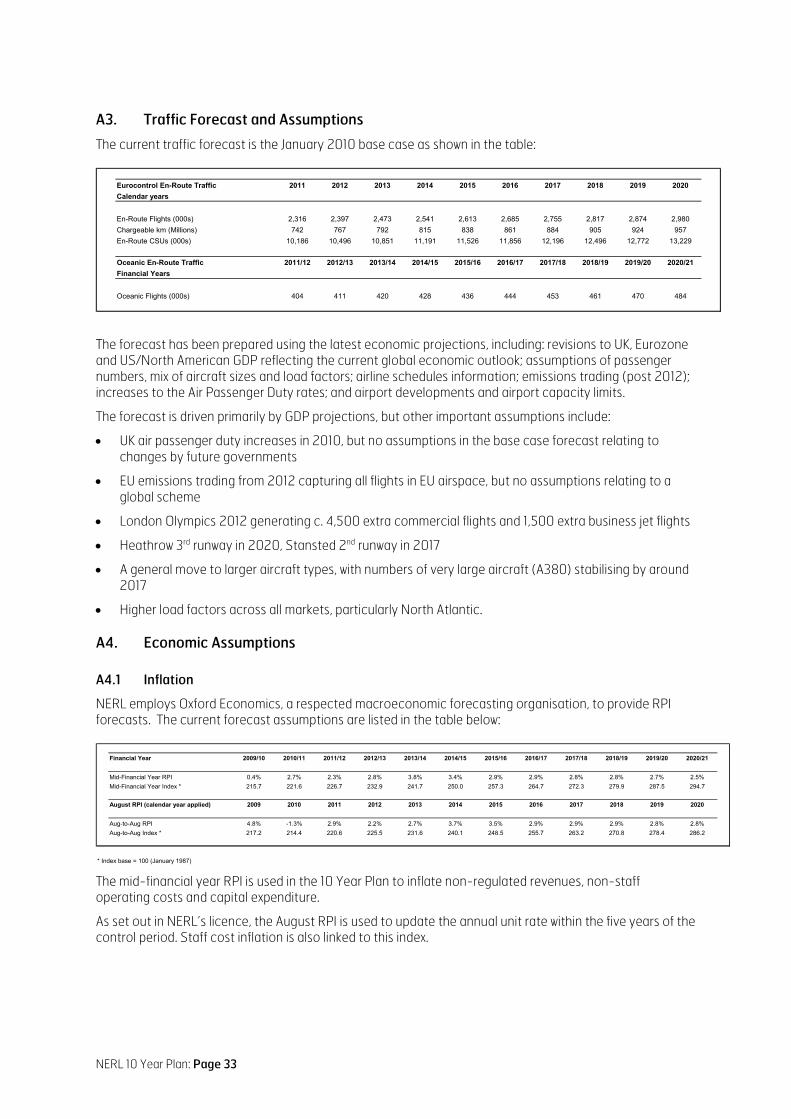
NERL 10 Year Plan: Page 33
A3. Traffic Forecast and Assumptions
The current traffic forecast is the January 2010 base case as shown in the table:
Eurocontrol En-Route Traffic 2011 2012 2013 2014 2015 2016 2017 2018 2019 2020Calendar years
En-Route Flights (000s) 2,316 2,397 2,473 2,541 2,613 2,685 2,755 2,817 2,874 2,980Chargeable km (Millions) 742 767 792 815 838 861 884 905 924 957En-Route CSUs (000s) 10,186 10,496 10,851 11,191 11,526 11,856 12,196 12,496 12,772 13,229
Oceanic En-Route Traffic 2011/12 2012/13 2013/14 2014/15 2015/16 2016/17 2017/18 2018/19 2019/20 2020/21Financial Years
Oceanic Flights (000s) 404 411 420 428 436 444 453 461 470 484
The forecast has been prepared using the latest economic projections, including: revisions to UK, Eurozone and US/North American GDP reflecting the current global economic outlook; assumptions of passenger numbers, mix of aircraft sizes and load factors; airline schedules information; emissions trading (post 2012); increases to the Air Passenger Duty rates; and airport developments and airport capacity limits.
The forecast is driven primarily by GDP projections, but other important assumptions include:
• UK air passenger duty increases in 2010, but no assumptions in the base case forecast relating to changes by future governments
• EU emissions trading from 2012 capturing all flights in EU airspace, but no assumptions relating to a global scheme
• London Olympics 2012 generating c. 4,500 extra commercial flights and 1,500 extra business jet flights
• Heathrow 3rd runway in 2020, Stansted 2nd runway in 2017
• A general move to larger aircraft types, with numbers of very large aircraft (A380) stabilising by around 2017
• Higher load factors across all markets, particularly North Atlantic. A4. Economic Assumptions A4.1 Inflation
NERL employs Oxford Economics, a respected macroeconomic forecasting organisation, to provide RPI forecasts. The current forecast assumptions are listed in the table below:
Financial Year 2009/10 2010/11 2011/12 2012/13 2013/14 2014/15 2015/16 2016/17 2017/18 2018/19 2019/20 2020/21
Mid-Financial Year RPI 0.4% 2.7% 2.3% 2.8% 3.8% 3.4% 2.9% 2.9% 2.8% 2.8% 2.7% 2.5%Mid-Financial Year Index * 215.7 221.6 226.7 232.9 241.7 250.0 257.3 264.7 272.3 279.9 287.5 294.7
August RPI (calendar year applied) 2009 2010 2011 2012 2013 2014 2015 2016 2017 2018 2019 2020
Aug-to-Aug RPI 4.8% -1.3% 2.9% 2.2% 2.7% 3.7% 3.5% 2.9% 2.9% 2.9% 2.8% 2.8%Aug-to-Aug Index * 217.2 214.4 220.6 225.5 231.6 240.1 248.5 255.7 263.2 270.8 278.4 286.2
* Index base = 100 (January 1987)
The mid-financial year RPI is used in the 10 Year Plan to inflate non-regulated revenues, non-staff operating costs and capital expenditure.
As set out in NERL’s licence, the August RPI is used to update the annual unit rate within the five years of the control period. Staff cost inflation is also linked to this index.
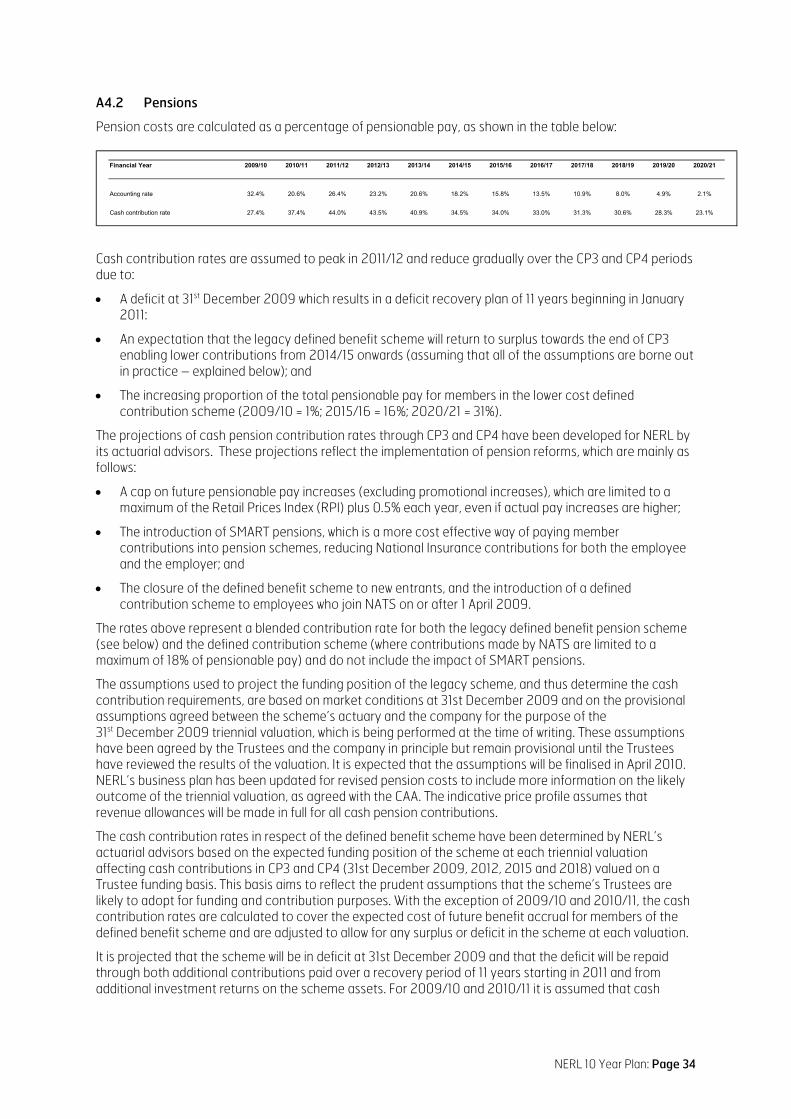
NERL 10 Year Plan: Page 34
A4.2 Pensions
Pension costs are calculated as a percentage of pensionable pay, as shown in the table below:
Financial Year 2009/10 2010/11 2011/12 2012/13 2013/14 2014/15 2015/16 2016/17 2017/18 2018/19 2019/20 2020/21
Accounting rate 32.4% 20.6% 26.4% 23.2% 20.6% 18.2% 15.8% 13.5% 10.9% 8.0% 4.9% 2.1%
Cash contribution rate 27.4% 37.4% 44.0% 43.5% 40.9% 34.5% 34.0% 33.0% 31.3% 30.6% 28.3% 23.1%
Cash contribution rates are assumed to peak in 2011/12 and reduce gradually over the CP3 and CP4 periods due to:
• A deficit at 31st December 2009 which results in a deficit recovery plan of 11 years beginning in January 2011:
• An expectation that the legacy defined benefit scheme will return to surplus towards the end of CP3 enabling lower contributions from 2014/15 onwards (assuming that all of the assumptions are borne out in practice – explained below); and
• The increasing proportion of the total pensionable pay for members in the lower cost defined contribution scheme (2009/10 = 1%; 2015/16 = 16%; 2020/21 = 31%).
The projections of cash pension contribution rates through CP3 and CP4 have been developed for NERL by its actuarial advisors. These projections reflect the implementation of pension reforms, which are mainly as follows:
• A cap on future pensionable pay increases (excluding promotional increases), which are limited to a maximum of the Retail Prices Index (RPI) plus 0.5% each year, even if actual pay increases are higher;
• The introduction of SMART pensions, which is a more cost effective way of paying member contributions into pension schemes, reducing National Insurance contributions for both the employee and the employer; and
• The closure of the defined benefit scheme to new entrants, and the introduction of a defined contribution scheme to employees who join NATS on or after 1 April 2009.
The rates above represent a blended contribution rate for both the legacy defined benefit pension scheme (see below) and the defined contribution scheme (where contributions made by NATS are limited to a maximum of 18% of pensionable pay) and do not include the impact of SMART pensions.
The assumptions used to project the funding position of the legacy scheme, and thus determine the cash contribution requirements, are based on market conditions at 31st December 2009 and on the provisional assumptions agreed between the scheme’s actuary and the company for the purpose of the 31st December 2009 triennial valuation, which is being performed at the time of writing. These assumptions have been agreed by the Trustees and the company in principle but remain provisional until the Trustees have reviewed the results of the valuation. It is expected that the assumptions will be finalised in April 2010. NERL’s business plan has been updated for revised pension costs to include more information on the likely outcome of the triennial valuation, as agreed with the CAA. The indicative price profile assumes that revenue allowances will be made in full for all cash pension contributions.
The cash contribution rates in respect of the defined benefit scheme have been determined by NERL’s actuarial advisors based on the expected funding position of the scheme at each triennial valuation affecting cash contributions in CP3 and CP4 (31st December 2009, 2012, 2015 and 2018) valued on a Trustee funding basis. This basis aims to reflect the prudent assumptions that the scheme’s Trustees are likely to adopt for funding and contribution purposes. With the exception of 2009/10 and 2010/11, the cash contribution rates are calculated to cover the expected cost of future benefit accrual for members of the defined benefit scheme and are adjusted to allow for any surplus or deficit in the scheme at each valuation.
It is projected that the scheme will be in deficit at 31st December 2009 and that the deficit will be repaid through both additional contributions paid over a recovery period of 11 years starting in 2011 and from additional investment returns on the scheme assets. For 2009/10 and 2010/11 it is assumed that cash
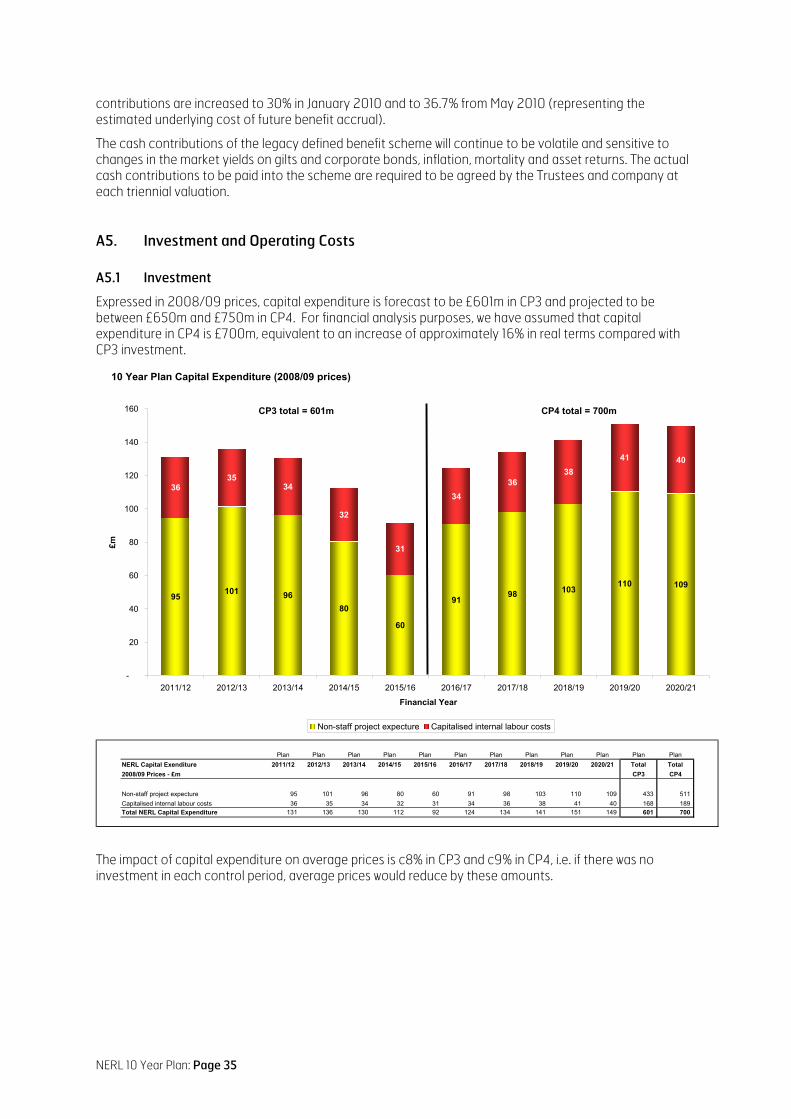
NERL 10 Year Plan: Page 35
contributions are increased to 30% in January 2010 and to 36.7% from May 2010 (representing the estimated underlying cost of future benefit accrual).
The cash contributions of the legacy defined benefit scheme will continue to be volatile and sensitive to changes in the market yields on gilts and corporate bonds, inflation, mortality and asset returns. The actual cash contributions to be paid into the scheme are required to be agreed by the Trustees and company at each triennial valuation. A5. Investment and Operating Costs A5.1 Investment
Expressed in 2008/09 prices, capital expenditure is forecast to be £601m in CP3 and projected to be between £650m and £750m in CP4. For financial analysis purposes, we have assumed that capital expenditure in CP4 is £700m, equivalent to an increase of approximately 16% in real terms compared with CP3 investment.
10 Year Plan Capital Expenditure (2008/09 prices)
95101 96
80
60
9198 103
110 109
3635
34
32
31
34
3638
41 40
-
20
40
60
80
100
120
140
160
2011/12 2012/13 2013/14 2014/15 2015/16 2016/17 2017/18 2018/19 2019/20 2020/21
Financial Year
£m
Non-staff project expecture Capitalised internal labour costs
CP3 total = 601m CP4 total = 700m
Plan Plan Plan Plan Plan Plan Plan Plan Plan Plan Plan Plan
NERL Capital Exenditure 2011/12 2012/13 2013/14 2014/15 2015/16 2016/17 2017/18 2018/19 2019/20 2020/21 Total Total
2008/09 Prices - £m CP3 CP4
Non-staff project expecture 95 101 96 80 60 91 98 103 110 109 433 511
Capitalised internal labour costs 36 35 34 32 31 34 36 38 41 40 168 189 Total NERL Capital Expenditure 131 136 130 112 92 124 134 141 151 149 601 700
The impact of capital expenditure on average prices is c8% in CP3 and c9% in CP4, i.e. if there was no investment in each control period, average prices would reduce by these amounts.
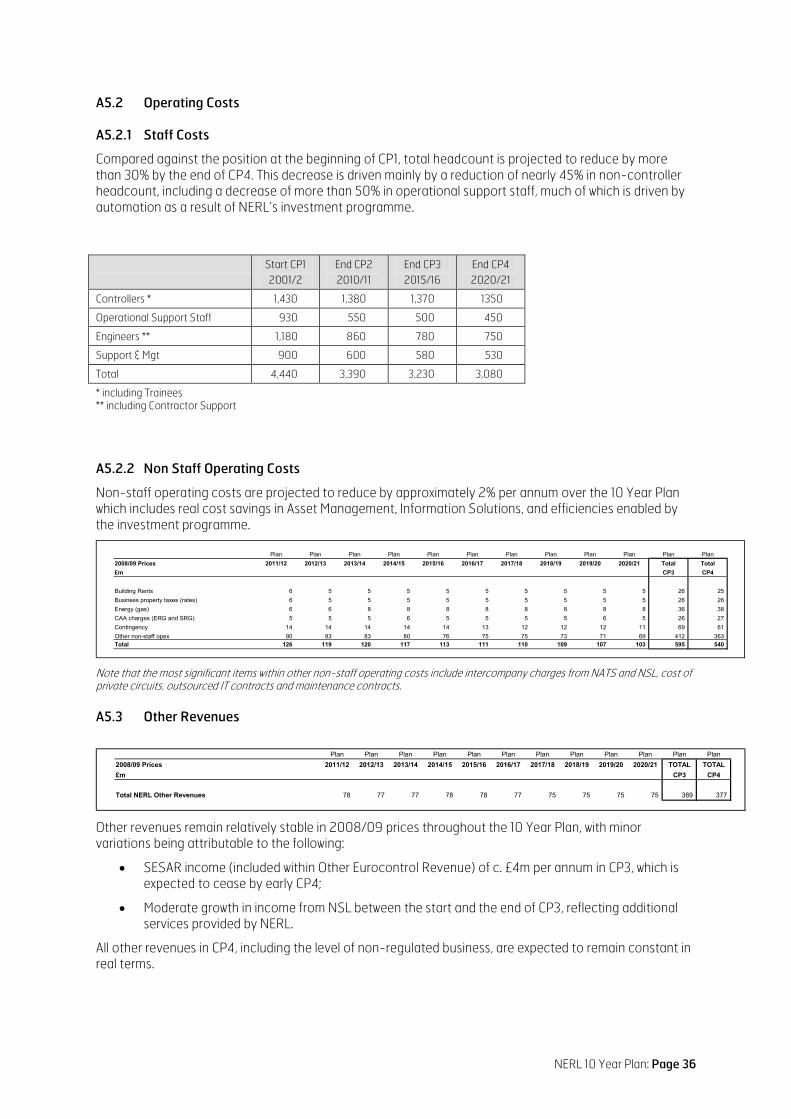
NERL 10 Year Plan: Page 36
A5.2 Operating Costs A5.2.1 Staff Costs
Compared against the position at the beginning of CP1, total headcount is projected to reduce by more than 30% by the end of CP4. This decrease is driven mainly by a reduction of nearly 45% in non-controller headcount, including a decrease of more than 50% in operational support staff, much of which is driven by automation as a result of NERL’s investment programme.
Start CP1
2001/2 End CP2 2010/11
End CP3 2015/16
End CP4 2020/21
Controllers * 1,430 1,380 1,370 1350
Operational Support Staff 930 550 500 450
Engineers ** 1,180 860 780 750
Support & Mgt 900 600 580 530
Total 4,440 3,390 3,230 3,080
* including Trainees ** including Contractor Support
A5.2.2 Non Staff Operating Costs
Non-staff operating costs are projected to reduce by approximately 2% per annum over the 10 Year Plan which includes real cost savings in Asset Management, Information Solutions, and efficiencies enabled by the investment programme.
Plan Plan Plan Plan Plan Plan Plan Plan Plan Plan Plan Plan2008/09 Prices 2011/12 2012/13 2013/14 2014/15 2015/16 2016/17 2017/18 2018/19 2019/20 2020/21 Total Total£m CP3 CP4
Building Rents 6 5 5 5 5 5 5 5 5 5 26 25 Business property taxes (rates) 6 5 5 5 5 5 5 5 5 5 26 26 Energy (gas) 6 6 8 8 8 8 8 8 8 8 36 38 CAA charges (ERG and SRG) 5 5 5 6 5 5 5 5 6 5 26 27 Contingency 14 14 14 14 14 13 12 12 12 11 69 61 Other non-staff opex 90 83 83 80 76 75 75 73 71 69 412 363 Total 126 119 120 117 113 111 110 109 107 103 595 540
Note that the most significant items within other non-staff operating costs include intercompany charges from NATS and NSL, cost of private circuits, outsourced IT contracts and maintenance contracts. A5.3 Other Revenues
Plan Plan Plan Plan Plan Plan Plan Plan Plan Plan Plan Plan2008/09 Prices 2011/12 2012/13 2013/14 2014/15 2015/16 2016/17 2017/18 2018/19 2019/20 2020/21 TOTAL TOTAL£m CP3 CP4
Total NERL Other Revenues 78 77 77 78 78 77 75 75 75 75 389 377
Other revenues remain relatively stable in 2008/09 prices throughout the 10 Year Plan, with minor variations being attributable to the following:
• SESAR income (included within Other Eurocontrol Revenue) of c. £4m per annum in CP3, which is expected to cease by early CP4;
• Moderate growth in income from NSL between the start and the end of CP3, reflecting additional services provided by NERL.
All other revenues in CP4, including the level of non-regulated business, are expected to remain constant in real terms.
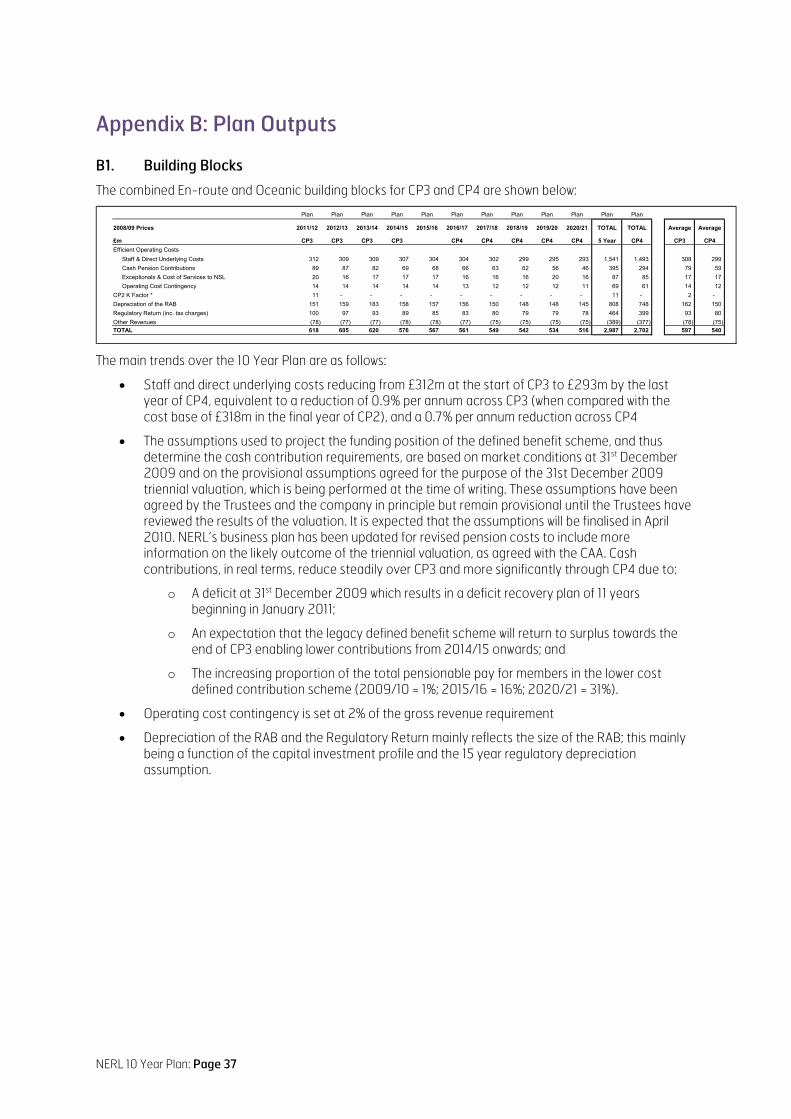
NERL 10 Year Plan: Page 37
Appendix B: Plan Outputs B1. Building Blocks
The combined En-route and Oceanic building blocks for CP3 and CP4 are shown below:
Plan Plan Plan Plan Plan Plan Plan Plan Plan Plan Plan Plan
2008/09 Prices 2011/12 2012/13 2013/14 2014/15 2015/16 2016/17 2017/18 2018/19 2019/20 2020/21 TOTAL TOTAL Average Average
£m CP3 CP3 CP3 CP3 CP4 CP4 CP4 CP4 CP4 5 Year CP4 CP3 CP4Efficient Operating Costs
Staff & Direct Underlying Costs 312 309 309 307 304 304 302 299 295 293 1,541 1,493 308 299 Cash Pension Contributions 89 87 82 69 68 66 63 62 56 46 395 294 79 59 Exceptionals & Cost of Services to NSL 20 16 17 17 17 16 16 16 20 16 87 85 17 17 Operating Cost Contingency 14 14 14 14 14 13 12 12 12 11 69 61 14 12
CP2 K Factor * 11 - - - - - - - - - 11 - 2 - Depreciation of the RAB 151 159 183 158 157 156 150 148 148 145 808 748 162 150 Regulatory Return (inc. tax charges) 100 97 93 89 85 83 80 79 79 78 464 399 93 80 Other Revenues (78) (77) (77) (78) (78) (77) (75) (75) (75) (75) (389) (377) (78) (75)TOTAL 618 605 620 576 567 561 549 542 534 516 2,987 2,702 597 540
The main trends over the 10 Year Plan are as follows:
• Staff and direct underlying costs reducing from £312m at the start of CP3 to £293m by the last year of CP4, equivalent to a reduction of 0.9% per annum across CP3 (when compared with the cost base of £318m in the final year of CP2), and a 0.7% per annum reduction across CP4
• The assumptions used to project the funding position of the defined benefit scheme, and thus determine the cash contribution requirements, are based on market conditions at 31st December 2009 and on the provisional assumptions agreed for the purpose of the 31st December 2009 triennial valuation, which is being performed at the time of writing. These assumptions have been agreed by the Trustees and the company in principle but remain provisional until the Trustees have reviewed the results of the valuation. It is expected that the assumptions will be finalised in April 2010. NERL’s business plan has been updated for revised pension costs to include more information on the likely outcome of the triennial valuation, as agreed with the CAA. Cash contributions, in real terms, reduce steadily over CP3 and more significantly through CP4 due to:
o A deficit at 31st December 2009 which results in a deficit recovery plan of 11 years beginning in January 2011;
o An expectation that the legacy defined benefit scheme will return to surplus towards the end of CP3 enabling lower contributions from 2014/15 onwards; and
o The increasing proportion of the total pensionable pay for members in the lower cost defined contribution scheme (2009/10 = 1%; 2015/16 = 16%; 2020/21 = 31%).
• Operating cost contingency is set at 2% of the gross revenue requirement
• Depreciation of the RAB and the Regulatory Return mainly reflects the size of the RAB; this mainly being a function of the capital investment profile and the 15 year regulatory depreciation assumption.

NERL 10 Year Plan: Page 38
B2. Real Unit Operating Expenditure (RUOE)
The level of cost efficiency, measured in terms of real unit operating expenditure (RUOE) is 2.0% for CP3 and 1.8% for CP4. In both control periods, the main drivers of the efficiency are the reductions in non-controller headcount, combined with the assumption that NERL will be able to handle additional traffic volumes with slightly decreasing, number of controllers.
Plan Plan Plan Plan Plan Plan Plan Plan Plan Plan2008/09 Prices 2011/12 2012/13 2013/14 2014/15 2015/16 2016/17 2017/18 2018/19 2019/20 2020/21£m
RUOE Efficiency calculationsStaff & Direct Underlying Costs 312 309 309 307 304 304 302 299 295 293 Less: Deemed Traffic Growth Allowance (3) (7) (10) (13) (17) (19) (22) (24) (26) (30)Underlying Costs for RUOE Calculation 308 302 299 294 287 284 280 275 268 263
Annual CP3 / CP4 Efficiency (Staff & Direct Underlying Costs) -0.9% -0.7%
Annual CP3 / CP4 Efficiency (RUOE basis) -2.0% -1.8%
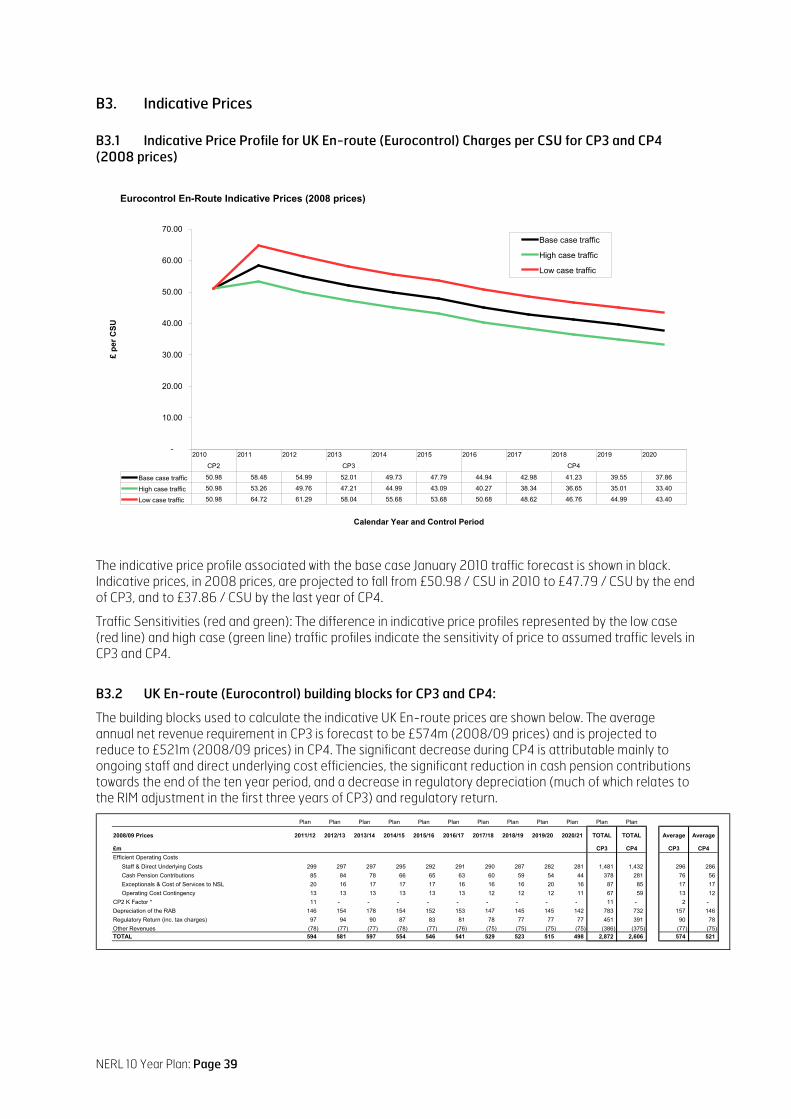
NERL 10 Year Plan: Page 39
B3. Indicative Prices B3.1 Indicative Price Profile for UK En-route (Eurocontrol) Charges per CSU for CP3 and CP4 (2008 prices)
Eurocontrol En-Route Indicative Prices (2008 prices)
-
10.00
20.00
30.00
40.00
50.00
60.00
70.00
Calendar Year and Control Period
£ pe
r CSU
Base case traffic
High case traffic
Low case traffic
Base case traffic 50.98 58.48 54.99 52.01 49.73 47.79 44.94 42.98 41.23 39.55 37.86
High case traffic 50.98 53.26 49.76 47.21 44.99 43.09 40.27 38.34 36.65 35.01 33.40
Low case traffic 50.98 64.72 61.29 58.04 55.68 53.68 50.68 48.62 46.76 44.99 43.40
2010 2011 2012 2013 2014 2015 2016 2017 2018 2019 2020
CP2 CP3 CP4
The indicative price profile associated with the base case January 2010 traffic forecast is shown in black. Indicative prices, in 2008 prices, are projected to fall from £50.98 / CSU in 2010 to £47.79 / CSU by the end of CP3, and to £37.86 / CSU by the last year of CP4.
Traffic Sensitivities (red and green): The difference in indicative price profiles represented by the low case (red line) and high case (green line) traffic profiles indicate the sensitivity of price to assumed traffic levels in CP3 and CP4.
B3.2 UK En-route (Eurocontrol) building blocks for CP3 and CP4:
The building blocks used to calculate the indicative UK En-route prices are shown below. The average annual net revenue requirement in CP3 is forecast to be £574m (2008/09 prices) and is projected to reduce to £521m (2008/09 prices) in CP4. The significant decrease during CP4 is attributable mainly to ongoing staff and direct underlying cost efficiencies, the significant reduction in cash pension contributions towards the end of the ten year period, and a decrease in regulatory depreciation (much of which relates to the RIM adjustment in the first three years of CP3) and regulatory return.
Plan Plan Plan Plan Plan Plan Plan Plan Plan Plan Plan Plan
2008/09 Prices 2011/12 2012/13 2013/14 2014/15 2015/16 2016/17 2017/18 2018/19 2019/20 2020/21 TOTAL TOTAL Average Average
£m CP3 CP4 CP3 CP4Efficient Operating Costs
Staff & Direct Underlying Costs 299 297 297 295 292 291 290 287 282 281 1,481 1,432 296 286 Cash Pension Contributions 85 84 78 66 65 63 60 59 54 44 378 281 76 56 Exceptionals & Cost of Services to NSL 20 16 17 17 17 16 16 16 20 16 87 85 17 17 Operating Cost Contingency 13 13 13 13 13 13 12 12 12 11 67 59 13 12
CP2 K Factor * 11 - - - - - - - - - 11 - 2 - Depreciation of the RAB 146 154 178 154 152 153 147 145 145 142 783 732 157 146 Regulatory Return (inc. tax charges) 97 94 90 87 83 81 78 77 77 77 451 391 90 78 Other Revenues (78) (77) (77) (78) (77) (76) (75) (75) (75) (75) (386) (375) (77) (75)TOTAL 594 581 597 554 546 541 529 523 515 498 2,872 2,606 574 521
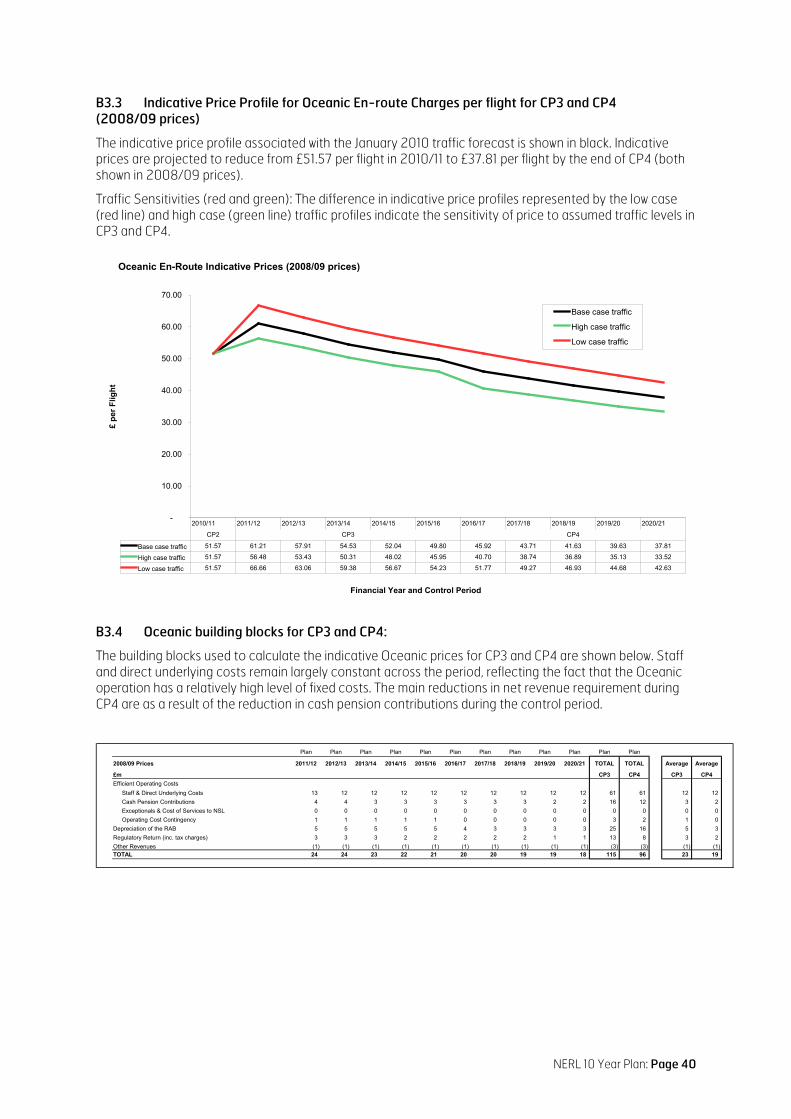
NERL 10 Year Plan: Page 40
B3.3 Indicative Price Profile for Oceanic En-route Charges per flight for CP3 and CP4 (2008/09 prices)
The indicative price profile associated with the January 2010 traffic forecast is shown in black. Indicative prices are projected to reduce from £51.57 per flight in 2010/11 to £37.81 per flight by the end of CP4 (both shown in 2008/09 prices).
Traffic Sensitivities (red and green): The difference in indicative price profiles represented by the low case (red line) and high case (green line) traffic profiles indicate the sensitivity of price to assumed traffic levels in CP3 and CP4.
Oceanic En-Route Indicative Prices (2008/09 prices)
-
10.00
20.00
30.00
40.00
50.00
60.00
70.00
Financial Year and Control Period
£ pe
r Flig
ht
Base case traffic
High case traffic
Low case traffic
Base case traffic 51.57 61.21 57.91 54.53 52.04 49.80 45.92 43.71 41.63 39.63 37.81
High case traffic 51.57 56.48 53.43 50.31 48.02 45.95 40.70 38.74 36.89 35.13 33.52
Low case traffic 51.57 66.66 63.06 59.38 56.67 54.23 51.77 49.27 46.93 44.68 42.63
2010/11 2011/12 2012/13 2013/14 2014/15 2015/16 2016/17 2017/18 2018/19 2019/20 2020/21
CP2 CP3 CP4
B3.4 Oceanic building blocks for CP3 and CP4:
The building blocks used to calculate the indicative Oceanic prices for CP3 and CP4 are shown below. Staff and direct underlying costs remain largely constant across the period, reflecting the fact that the Oceanic operation has a relatively high level of fixed costs. The main reductions in net revenue requirement during CP4 are as a result of the reduction in cash pension contributions during the control period.
Plan Plan Plan Plan Plan Plan Plan Plan Plan Plan Plan Plan
2008/09 Prices 2011/12 2012/13 2013/14 2014/15 2015/16 2016/17 2017/18 2018/19 2019/20 2020/21 TOTAL TOTAL Average Average
£m CP3 CP4 CP3 CP4Efficient Operating Costs
Staff & Direct Underlying Costs 13 12 12 12 12 12 12 12 12 12 61 61 12 12 Cash Pension Contributions 4 4 3 3 3 3 3 3 2 2 16 12 3 2 Exceptionals & Cost of Services to NSL 0 0 0 0 0 0 0 0 0 0 0 0 0 0 Operating Cost Contingency 1 1 1 1 1 0 0 0 0 0 3 2 1 0
Depreciation of the RAB 5 5 5 5 5 4 3 3 3 3 25 16 5 3 Regulatory Return (inc. tax charges) 3 3 3 2 2 2 2 2 1 1 13 8 3 2 Other Revenues (1) (1) (1) (1) (1) (1) (1) (1) (1) (1) (3) (3) (1) (1)TOTAL 24 24 23 22 21 20 20 19 19 18 115 96 23 19

NERL 10 Year Plan: Page 41
B4. Additional Financial Information
During 2009, NERL consulted on its draft Baseline Business Plan for CP3 (2011 – 2015) through the Customer Consultation process. This 5 year plan was revised in November 2009, following Customer Consultation.
NERL’s licence requires the company to issue financial information supporting its 10 year business plan. For the purpose of this section, the financial information is presented on the assumption that both CP3 and CP4 are 5-year control periods even though, as highlighted in the Executive Summary, the SES performance scheme’s “reference periods” do not match the start or end dates of CP3/CP4.
The regulatory income statement and analysis of movements on the regulatory asset base (RAB) below are consistent with the current approach adopted by the economic regulator for price setting purposes. The financial effects of the outcome of the CP3 price control, as assumed by NERL for business planning purposes, are reflected in the income statements, balance sheets and cash flow statements which follow. Note: at the time of writing the defined benefit scheme is being valued by the scheme actuary. Accordingly, the financial statements include estimates. These estimates may differ following the final valuation and contribution schedule.
The new information contained in the CP4 element of the 10 year business plan reflects high level assumptions about key inputs such as future traffic, inflation and market conditions, and therefore contain a degree of uncertainty which increases over time. Regulatory Income Statement
The regulatory income statements for UKATS, Oceanic and a combined view are set out below and are stated in outturn prices. This is in contrast to the Building Block tables in Appendix B which are stated in 2008/09 mid-year prices. The regulatory return is stated before tax and financing costs and is derived from the regulatory building blocks which reflect the assumptions in NERL’s revised business plan for CP3 (November 2009). The regulatory return is consistent with the assumed pre-tax cost of capital of 9% (5.9% post-tax) in CP3 and 9.3% (5.9% post-tax) in CP4, re-specified for calendar year figures, as well as being re-profiled to take account of forecast traffic volumes. The projections have been updated for the impact of the exogenous factors which NERL is reflecting in its final plan for CP3, published in March 2010.
UKATS Regulatory Income Statement
Outturn Prices (mid-year) 2011/12 2012/13 2013/14 2014/15 2015/16 2016/17 2017/18 2018/19 2019/20 2020/21 Total Total£m CP3 CP4
UK En Route revenue 707 716 728 746 758 758 767 776 784 797 3,655 3,883 Efficient Operating Costs
Staff & Direct Underlying Costs (316) (322) (334) (344) (350) (359) (367) (374) (378) (386) (1,666) (1,864)Cash Pension Contributions (90) (91) (88) (77) (78) (78) (76) (77) (72) (61) (424) (365)Exceptionals & Cost of Services to NSL (21) (18) (19) (20) (20) (20) (21) (21) (27) (23) (97) (111)Operating Cost Contingency (14) (14) (15) (16) (16) (16) (15) (15) (16) (15) (75) (77)
Depreciation of the RAB (154) (167) (200) (179) (182) (188) (186) (189) (194) (195) (882) (953)Regulatory return 113 104 72 111 111 97 101 99 98 118 511 512
Oceanic Regulatory Income Statement
Outturn Prices (mid-year) 2011/12 2012/13 2013/14 2014/15 2015/16 2016/17 2017/18 2018/19 2019/20 2020/21 Total Total£m CP3 CP4
Oceanic revenue 27 26 26 27 27 26 26 26 26 26 133 129 Efficient Operating Costs
Staff & Direct Underlying Costs (13) (13) (13) (14) (14) (15) (15) (16) (16) (17) (68) (79)Cash Pension Contributions (4) (4) (4) (3) (3) (3) (3) (3) (3) (3) (18) (16)Exceptionals & Cost of Services to NSL (0) (0) (0) (0) (0) (0) (0) (0) (0) (0) (0) (0)Operating Cost Contingency (1) (1) (1) (1) (1) (1) (1) (1) (1) (1) (3) (3)
Depreciation of the RAB (5) (6) (6) (6) (6) (5) (4) (4) (4) (4) (28) (21)Regulatory return 4 3 3 3 3 2 2 2 1 2 15 10
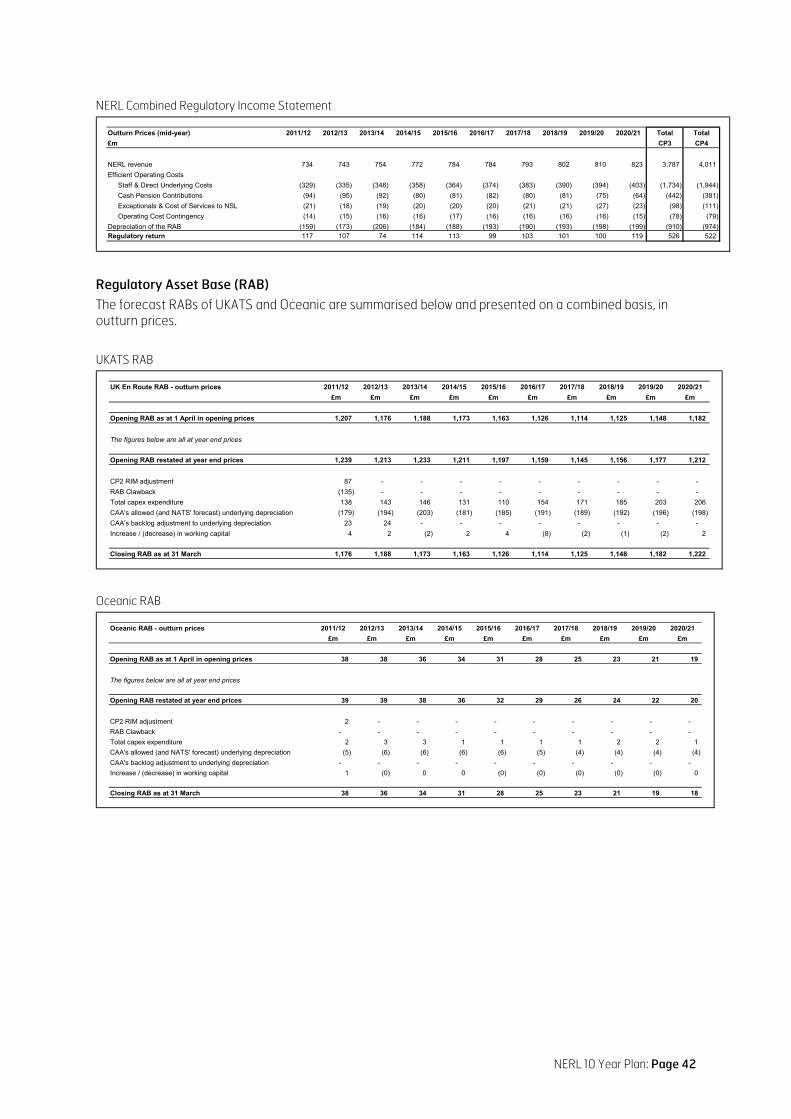
NERL 10 Year Plan: Page 42
NERL Combined Regulatory Income Statement
Outturn Prices (mid-year) 2011/12 2012/13 2013/14 2014/15 2015/16 2016/17 2017/18 2018/19 2019/20 2020/21 Total Total£m CP3 CP4
NERL revenue 734 743 754 772 784 784 793 802 810 823 3,787 4,011 Efficient Operating Costs
Staff & Direct Underlying Costs (329) (335) (348) (358) (364) (374) (383) (390) (394) (403) (1,734) (1,944)Cash Pension Contributions (94) (95) (92) (80) (81) (82) (80) (81) (75) (64) (442) (381)Exceptionals & Cost of Services to NSL (21) (18) (19) (20) (20) (20) (21) (21) (27) (23) (98) (111)Operating Cost Contingency (14) (15) (16) (16) (17) (16) (16) (16) (16) (15) (78) (79)
Depreciation of the RAB (159) (173) (206) (184) (188) (193) (190) (193) (198) (199) (910) (974)Regulatory return 117 107 74 114 113 99 103 101 100 119 526 522
Regulatory Asset Base (RAB) The forecast RABs of UKATS and Oceanic are summarised below and presented on a combined basis, in outturn prices.
UKATS RAB
UK En Route RAB - outturn prices 2011/12 2012/13 2013/14 2014/15 2015/16 2016/17 2017/18 2018/19 2019/20 2020/21£m £m £m £m £m £m £m £m £m £m
Opening RAB as at 1 April in opening prices 1,207 1,176 1,188 1,173 1,163 1,126 1,114 1,125 1,148 1,182
The figures below are all at year end prices
Opening RAB restated at year end prices 1,239 1,213 1,233 1,211 1,197 1,159 1,145 1,156 1,177 1,212
CP2 RIM adjustment 87 - - - - - - - - - RAB Clawback (135) - - - - - - - - - Total capex expenditure 138 143 146 131 110 154 171 185 203 206 CAA's allowed (and NATS' forecast) underlying depreciation (179) (194) (203) (181) (185) (191) (189) (192) (196) (198)CAA's backlog adjustment to underlying depreciation 23 24 - - - - - - - - Increase / (decrease) in working capital 4 2 (2) 2 4 (8) (2) (1) (2) 2
Closing RAB as at 31 March 1,176 1,188 1,173 1,163 1,126 1,114 1,125 1,148 1,182 1,222
Oceanic RAB
Oceanic RAB - outturn prices 2011/12 2012/13 2013/14 2014/15 2015/16 2016/17 2017/18 2018/19 2019/20 2020/21£m £m £m £m £m £m £m £m £m £m
Opening RAB as at 1 April in opening prices 38 38 36 34 31 28 25 23 21 19
The figures below are all at year end prices
Opening RAB restated at year end prices 39 39 38 36 32 29 26 24 22 20
CP2 RIM adjustment 2 - - - - - - - - - RAB Clawback - - - - - - - - - - Total capex expenditure 2 3 3 1 1 1 1 2 2 1 CAA's allowed (and NATS' forecast) underlying depreciation (5) (6) (6) (6) (6) (5) (4) (4) (4) (4)CAA's backlog adjustment to underlying depreciation - - - - - - - - - - Increase / (decrease) in working capital 1 (0) 0 0 (0) (0) (0) (0) (0) 0
Closing RAB as at 31 March 38 36 34 31 28 25 23 21 19 18

NERL 10 Year Plan: Page 43
NERL Combined RAB
NERL RAB - outturn prices 2011/12 2012/13 2013/14 2014/15 2015/16 2016/17 2017/18 2018/19 2019/20 2020/21£m £m £m £m £m £m £m £m £m £m
Opening RAB as at 1 April in opening prices 1,245 1,214 1,224 1,208 1,194 1,154 1,139 1,148 1,170 1,202
The figures below are all at year end prices
Opening RAB restated at year end prices 1,277 1,252 1,270 1,246 1,229 1,188 1,171 1,180 1,199 1,232
CP2 RIM adjustment 88 - - - - - - - - - RAB Clawback (135) - - - - - - - - - Total capital expenditure 140 146 149 133 111 155 172 186 205 207 CAA's allowed (and NATS' forecast) underlying depreciation (184) (200) (209) (187) (190) (196) (193) (196) (200) (202)CAA's backlog adjustment to underlying depreciation 23 24 - - - - - - - - Increase / (decrease) in working capital 4 2 (2) 2 4 (8) (2) (1) (2) 2
Closing RAB as at 31 March 1,214 1,224 1,208 1,194 1,154 1,139 1,148 1,170 1,202 1,239
MEMO - Disposal Proceeds (year end outturn prices)Capital expenditure above is shown net of the following disposal proceeds:Disposal Proceeds - 4 - - - - - - - -
Summary Income Statement, Balance Sheet and Cash Flow Statement
The financial effects of the outcome of the CP3 price control, as assumed by NERL for business planning purposes, are reflected in the summary income statement, balance sheet and cash flow statement presented below. These financial statements have been prepared in accordance with international accounting standards (IAS) that applied at March 2009, enabling consistency of presentation across control periods and comparability with CP2, and reflect known changes in taxation.
Summarised below is NERL’s projected income statement for the 10-year period ending 31 March 2021. The 2010/11 financial year (the last year of CP2) is shown for information purposes.
NERL Income Statement - Outturn 2010/11 2011/12 2012/13 2013/14 2014/15 2015/16 2016/17 2017/18 2018/19 2019/20 2020/21 Total CP3 Total CP4£m £m £m £m £m £m £m £m £m £m £m £m £m
Revenue 642 734 743 754 772 784 784 793 802 810 823 3,787 4,011
Operating costs (415) (421) (415) (428) (436) (439) (444) (447) (449) (450) (446) (2,139) (2,235)
EBITDA 227 313 328 326 336 345 340 346 353 360 377 1,648 1,776
Depreciation (85) (90) (94) (99) (117) (119) (134) (139) (143) (151) (158) (519) (726)Goodwill impairment - - - (53) (32) (40) (28) (20) (16) (14) (9) (125) (87)
EBIT 141 223 234 174 188 186 178 186 194 195 209 1,005 963
Interest and financing costs (39) (43) (47) (50) (50) (49) (48) (46) (46) (46) (46) (240) (232)
Profit Before Tax 102 180 188 124 137 137 131 140 148 149 163 765 731
Taxation (27) (51) (52) (50) (48) (50) (45) (46) (47) (46) (49) (252) (233)
Profit After Tax 75 129 136 73 89 87 85 95 101 103 114 513 498
Earnings before interest and tax (EBIT) above is significantly different to the regulatory return shown in the regulatory income statement tables. The reason is that the regulatory income statement is a predominantly cash-based economic regulatory view whilst EBIT is presented on an accounting basis, in accordance with IAS that applied at March 2009. The principal differences are in the treatment of:
• pension costs: the regulatory return remunerates NERL for the cash cost of pensions projected to be £823m outturn over the 10-year plan period, as explained in A4.2. EBIT is stated after an accrued pension charge calculated under accounting standards projected to be £330m outturn over the 10-year plan period at the accrual rates shown in A4.2.
• regulatory depreciation: the regulatory return is stated after allowing for the regulatory depreciation of the RAB. This provides an allowance to NERL for past capital expenditure and for other regulatory price control factors such as: the effect of pension cash pass-through in CP2 and the CP2 rolling incentive mechanism, net of the RAB clawback. Capital expenditure and pension pass-through incurred before CP3 are depreciated over 12 years and beyond CP3 are assumed to be depreciated over 15 years. The CP2 rolling incentive mechanism is assumed to be depreciated over 3 years and the RAB clawback is assumed to be depreciated over 10 years. Regulatory
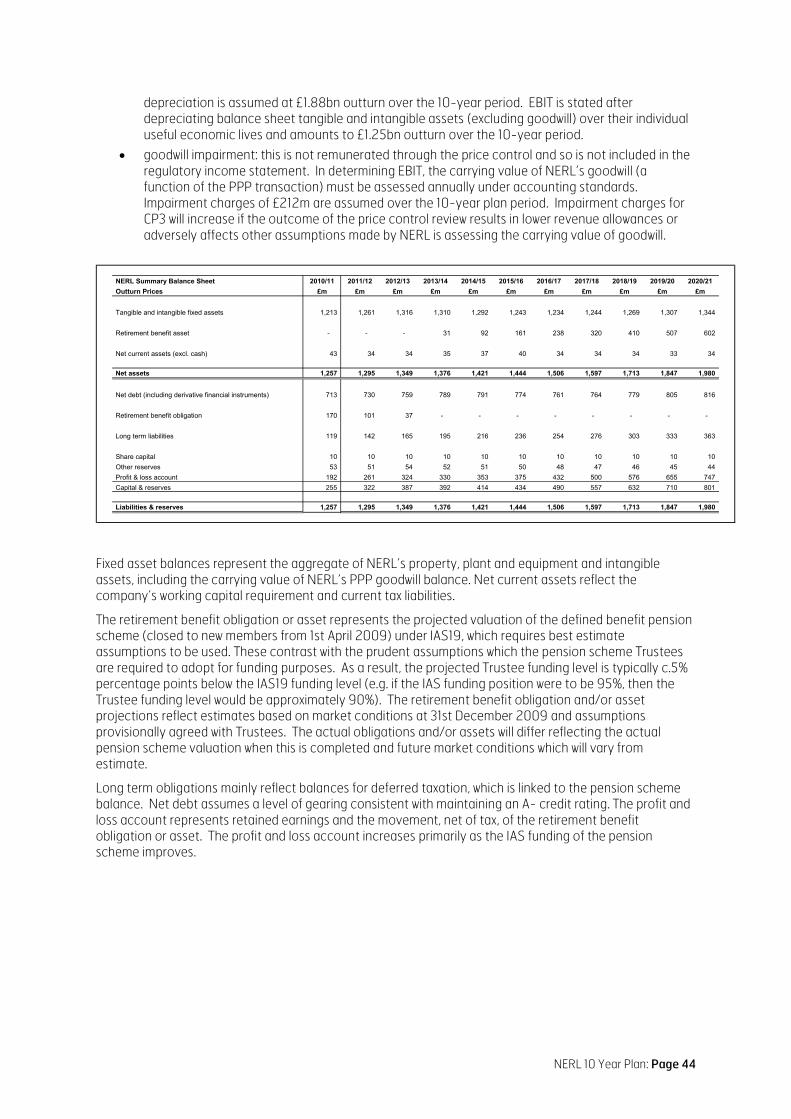
NERL 10 Year Plan: Page 44
depreciation is assumed at £1.88bn outturn over the 10-year period. EBIT is stated after depreciating balance sheet tangible and intangible assets (excluding goodwill) over their individual useful economic lives and amounts to £1.25bn outturn over the 10-year period.
• goodwill impairment: this is not remunerated through the price control and so is not included in the regulatory income statement. In determining EBIT, the carrying value of NERL’s goodwill (a function of the PPP transaction) must be assessed annually under accounting standards. Impairment charges of £212m are assumed over the 10-year plan period. Impairment charges for CP3 will increase if the outcome of the price control review results in lower revenue allowances or adversely affects other assumptions made by NERL is assessing the carrying value of goodwill.
NERL Summary Balance Sheet 2010/11 2011/12 2012/13 2013/14 2014/15 2015/16 2016/17 2017/18 2018/19 2019/20 2020/21Outturn Prices £m £m £m £m £m £m £m £m £m £m £m
Tangible and intangible fixed assets 1,213 1,261 1,316 1,310 1,292 1,243 1,234 1,244 1,269 1,307 1,344
Retirement benefit asset - - - 31 92 161 238 320 410 507 602
Net current assets (excl. cash) 43 34 34 35 37 40 34 34 34 33 34
Net assets 1,257 1,295 1,349 1,376 1,421 1,444 1,506 1,597 1,713 1,847 1,980
Net debt (including derivative financial instruments) 713 730 759 789 791 774 761 764 779 805 816
Retirement benefit obligation 170 101 37 - - - - - - - -
Long term liabilities 119 142 165 195 216 236 254 276 303 333 363
Share capital 10 10 10 10 10 10 10 10 10 10 10 Other reserves 53 51 54 52 51 50 48 47 46 45 44 Profit & loss account 192 261 324 330 353 375 432 500 576 655 747 Capital & reserves 255 322 387 392 414 434 490 557 632 710 801
Liabilities & reserves 1,257 1,295 1,349 1,376 1,421 1,444 1,506 1,597 1,713 1,847 1,980
Fixed asset balances represent the aggregate of NERL’s property, plant and equipment and intangible assets, including the carrying value of NERL’s PPP goodwill balance. Net current assets reflect the company’s working capital requirement and current tax liabilities.
The retirement benefit obligation or asset represents the projected valuation of the defined benefit pension scheme (closed to new members from 1st April 2009) under IAS19, which requires best estimate assumptions to be used. These contrast with the prudent assumptions which the pension scheme Trustees are required to adopt for funding purposes. As a result, the projected Trustee funding level is typically c.5% percentage points below the IAS19 funding level (e.g. if the IAS funding position were to be 95%, then the Trustee funding level would be approximately 90%). The retirement benefit obligation and/or asset projections reflect estimates based on market conditions at 31st December 2009 and assumptions provisionally agreed with Trustees. The actual obligations and/or assets will differ reflecting the actual pension scheme valuation when this is completed and future market conditions which will vary from estimate.
Long term obligations mainly reflect balances for deferred taxation, which is linked to the pension scheme balance. Net debt assumes a level of gearing consistent with maintaining an A- credit rating. The profit and loss account represents retained earnings and the movement, net of tax, of the retirement benefit obligation or asset. The profit and loss account increases primarily as the IAS funding of the pension scheme improves.
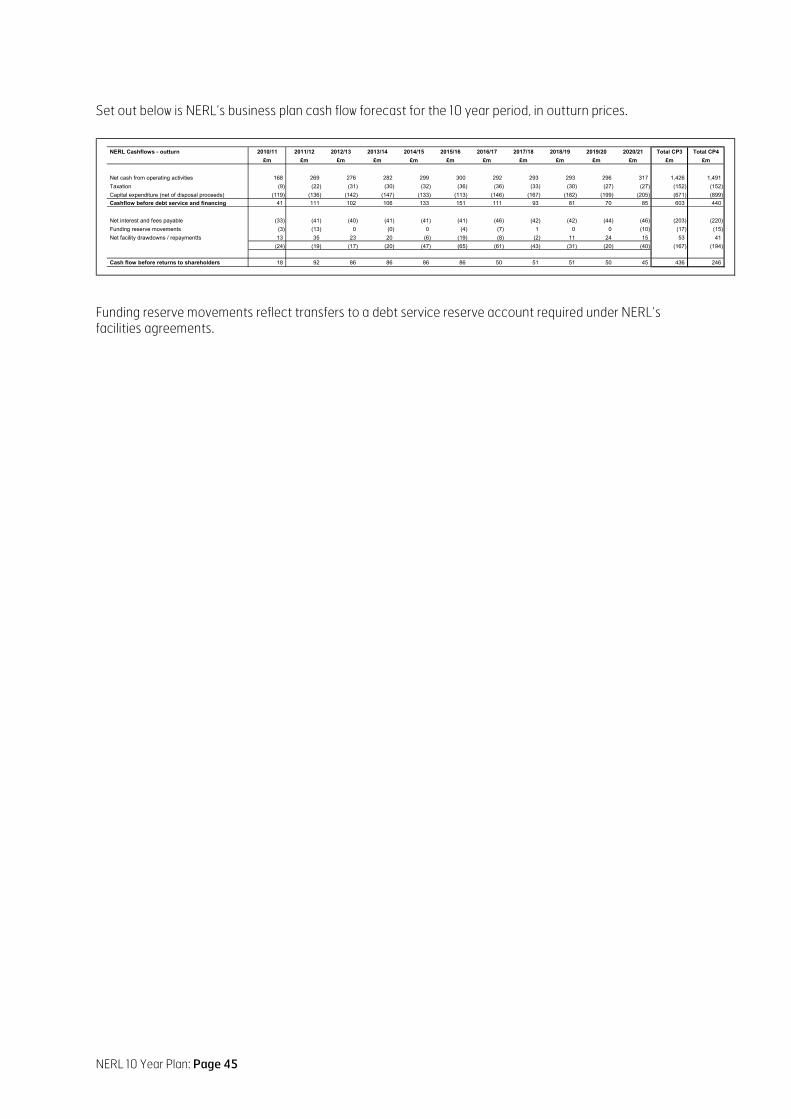
NERL 10 Year Plan: Page 45
Set out below is NERL’s business plan cash flow forecast for the 10 year period, in outturn prices.
NERL Cashflows - outturn 2010/11 2011/12 2012/13 2013/14 2014/15 2015/16 2016/17 2017/18 2018/19 2019/20 2020/21 Total CP3 Total CP4£m £m £m £m £m £m £m £m £m £m £m £m £m
Net cash from operating activities 168 269 276 282 299 300 292 293 293 296 317 1,426 1,491 Taxation (9) (22) (31) (30) (32) (36) (36) (33) (30) (27) (27) (152) (152)Capital expenditure (net of disposal proceeds) (119) (136) (142) (147) (133) (113) (146) (167) (182) (199) (205) (671) (899)Cashflow before debt service and financing 41 111 102 106 133 151 111 93 81 70 85 603 440
Net interest and fees payable (33) (41) (40) (41) (41) (41) (46) (42) (42) (44) (46) (203) (220)Funding reserve movements (3) (13) 0 (0) 0 (4) (7) 1 0 0 (10) (17) (15)Net facility drawdowns / repaymentts 13 35 23 20 (6) (19) (8) (2) 11 24 15 53 41
(24) (19) (17) (20) (47) (65) (61) (43) (31) (20) (40) (167) (194)
Cash flow before returns to shareholders 18 92 86 86 86 86 50 51 51 50 45 436 246
Funding reserve movements reflect transfers to a debt service reserve account required under NERL’s facilities agreements.

NERL 10 Year Plan: Page 46
Glossary ACC Area Control Centre
ADS Automatic Dependent Surveillance (-B Broadcast, -C Contract)
AMAN Arrival Manager
ANSP Air Navigation Service Provider
APW Airspace Penetration Warning
ASAS Airborne Separation Assurance System
ATC Air Traffic Control
ATM Air Traffic Management
ATS Air Traffic Service
ATSOCAS ATS Outside Controlled Airspace
CAA Civil Aviation Authority (UK)
CP1 / CP2 / CP3 / CP4 (Regulatory) Control Periods 1-4
CPDLC Controller Pilot Data Link Communication
CSU Chargeable Service Unit
DAP Downlinked Aircraft Parameter
DAVINCI Data and Voice Integrated NATS Communications Infrastructure
DfT UK Department for Transport
DMAN Departure Manager
DVI Digital Voice Input (technology)
EASA European Aviation Safety Agency
ECAC European Civil Aviation Conference
EFD Electronic Flight Data
ETS EU Emissions Trading Scheme
FAB Functional Airspace Block
FABEC FAB Europe Central
FDP Flight Data Processing
FUA Flexile Use of Airspace
IAA Irish Aviation Authority
ICAO International Civil Aviation Organisation
IFACTS Interim Future Area Control Tools Support (programme)
ITEC Interoperability Through European Collaboration (FDP Programme)
LAC London Area Control (Centre), Swanwick
LTC London Terminal Control (Centre), Swanwick
LARS Low-level Area Radar Service
LTIP Long Term Investment Plan
LTMA London Terminal Manoeuvring Area
MOD UK Ministry of Defence
MSAW Minimum Safe Altitude Warning
MSP Multi Sector Planning
MTCD Medium Term Conflict Detection
MTMA Manchester TMA
NERL 10 Year Plan: Page 47
NAS National Airspace System (flight data processing)
NATSPG North Atlantic Systems Planning Group
NCW New Common Workstation
NERC New En-Route Centre (system)
NODE NATS Operational Display Equipment
NSL NATS Services Limited
PC Prestwick Centre
PRNAV Precision Area Navigation
RUOE Real Underlying Operating Expenditure
SAATS Shanwick (Oceanic) Automated Air Traffic System
SES Single European Sky
SESAR JU or SJU Single European Sky ATM Research Joint Undertaking
SLAM Sudden Loss and Mitigation (Centre contingency)
SSE Significant Safety Event
STCA Short Term Conflict Alert
STMA Scottish TMA
SWIM System Wide Information Management
TMA Terminal (Airspace) Area
VCCS Voice Communications Control System
VDL Very High Frequency Data Link

NERL 10 Year Plan: Page 48
INSIDE BACK COVER – INTENTIONALLY BLANK