enamel demineralization resistance and remineralization by
TRANSCRIPT

materials
Article
Enamel Demineralization Resistance and Remineralization byVarious Fluoride-Releasing Dental Restorative Materials
Min-Ji Kim 1,2, Myung-Jin Lee 3, Kwang-Mahn Kim 1 , Song-Yi Yang 1 , Ji-Young Seo 4 , Sung-Hwan Choi 4,*and Jae-Sung Kwon 1,2,*
�����������������
Citation: Kim, M.-J.; Lee, M.-J.; Kim,
K.-M.; Yang, S.-Y.; Seo, J.-Y.; Choi,
S.-H.; Kwon, J.-S. Enamel
Demineralization Resistance and
Remineralization by Various
Fluoride-Releasing Dental Restorative
Materials. Materials 2021, 14, 4554.
https://doi.org/10.3390/ma14164554
Academic Editor: Marco Salerno
Received: 29 June 2021
Accepted: 10 August 2021
Published: 13 August 2021
Publisher’s Note: MDPI stays neutral
with regard to jurisdictional claims in
published maps and institutional affil-
iations.
Copyright: © 2021 by the authors.
Licensee MDPI, Basel, Switzerland.
This article is an open access article
distributed under the terms and
conditions of the Creative Commons
Attribution (CC BY) license (https://
creativecommons.org/licenses/by/
4.0/).
1 Department and Research Institute of Dental Biomaterials and Bioengineering, Yonsei University College ofDentistry, Seoul 03722, Korea; [email protected] (M.-J.K.); [email protected] (K.-M.K.);[email protected] (S.-Y.Y.)
2 BK21 PLUS Project, Yonsei University College of Dentistry, Seoul 03772, Korea3 Division of Health Science, Department of Dental Hygiene, Baekseok University, Cheonan 31065, Korea;
[email protected] Department of Orthodontics, Institute of Craniofacial Deformity, Yonsei University College of Dentistry,
Seoul 03772, Korea; [email protected]* Correspondence: [email protected] (S.-H.C.); [email protected] (J.-S.K.); Tel.: +82-2-2228-3102 (S.-H.C.);
+82-2-2228-8308 (J.-S.K.)
Abstract: The aim of this study is to investigate the resistance of various fluoride-releasing restorativematerials against the demineralization and remineralization of enamel surfaces, including those thathave been recently introduced to the market. Three different fluoride-releasing restorative materialswere considered: glass ionomer (FI), resin-modified glass ionomer (RL), and an alkasite restorativematerial (CN). The acid neutralization ability was investigated using pH measurement, and theconcentrations of released fluoride and calcium ions were measured. Finally, the demineralizationresistance and remineralization effects of enamel were observed using a microhardness tester andSEM. CN showed an initial substantial increase in pH followed by a steady increase, with valueshigher than those of the other groups (p < 0.05). All three groups released fluoride ions, and the CNgroup released more calcium ions than the other groups (p < 0.05). In the acid resistance test, from themicrohardness and SEM images, the CN group showed effective resistance to demineralization. Inthe remineralization test, the microhardness results showed that the FI and CN groups recovered themicrohardness from the values of the demineralized enamel surface (p < 0.05). This was confirmedby the SEM images from remineralization tests; the CN group showed a recovered demineralizedsurface when immersed in artificial saliva for 7 days. In conclusion, alkasite restorative material canbe an effective material when used in cariogenic environments.
Keywords: fluoride-releasing restorative material; acid neutralizing property; fluoride release; cal-cium concentration; demineralization resistance; remineralization
1. Introduction
Chemically, enamel is hydroxyapatite (HA); over 90 wt % of its weight is composed ofminerals such as calcium and phosphate, which are critical determinants of the physico-chemical properties of enamel [1]. According to Miller’s chemico-parasitic theory, whenoral bacteria metabolize sugar from dietary carbohydrates, the drop in pH due to acid pro-duction induces demineralization, and a continuous process of demineralization ultimatelycauses dental caries [2]. Thus, demineralization is an important factor for the advancementin dental caries, but can be prevented by lowering the pH by releasing high levels of ionin an acid environment for the exchange of hydrogen ions, which, in turn, neutralizes theacid [3].
According to a previous study, pH ≥ 6.0 is a safe zone with a low risk of dental caries,pH 5.5–6.0 is the zone that is potentially cariogenic, and pH 4.0–5.5 is the zone with a high
Materials 2021, 14, 4554. https://doi.org/10.3390/ma14164554 https://www.mdpi.com/journal/materials

Materials 2021, 14, 4554 2 of 12
risk of dental caries incidence [4]. Therefore, an ideal restorative material with the ability toresist demineralization should rapidly neutralize the pH by ion release, so the surroundingenamel is not vulnerable to acid exposure after dental restoration treatment.
Remineralization is the restoration of the demineralized tooth through mineral re-deposition in enamel deficient in calcium and phosphate [5]. When saliva is supersaturatedwith minerals such as calcium in the oral environment, remineralization is accelerated,and fluoride promotes enamel remineralization by absorbing the demineralized surface ofenamel and the deposits of calcium ions in the tooth [6]. For remineralization against initialdental caries, the original HA structure is restored when pH is neutralized through salivaand the supply of calcium and phosphate [7]. However, in a highly acidic environment, thisnatural remineralization is insufficient for achieving enamel remineralization. Thus, vari-ous restorative materials providing an enamel-remineralization effect have recently beendeveloped, including adhesive-containing nanoparticles of amorphous calcium phosphate(NACP) [8]. Fluoride-releasing restorative materials exhibit resistance to enamel deminer-alization, providing an enamel demineralization effect when applied to the tooth [9,10].
Glass ionomer consists of acrylic acid alumino-fluoro-silicate glass and others, and itshardening is mediated via the acid–base reaction [11]. This material provides an enameldemineralization resistance effect based on fluoride release [12]. Although it can release andrecharge fluoride, the disadvantage is that the material dissolves cations and anions uponcontact with moisture prior to completely hardening [13]. As a solution to this problem,resin-modified glass ionomer was developed, which uses the methacrylate polymerizationreaction in addition to the acid-base reaction, thereby overcoming the moisture sensitivityproblem of glass ionomer [14]. Nevertheless, its mechanical strength is relatively lowerthan that of composite resin [15].
One of the newly developed restorative materials known as an “alkasite” is a dual-cured, resin-based material containing alkasite glass, which is alkaline glass containingCaF2, SiO2, CaO, and Na2O, forming OH− groups upon reaction with water and releasingCa2+ to result in acid neutralization and remineralization [3]. One of the examples ofthe alkasite material is Cention N (CN), which is available on the market, with limitedinformation in terms of acid neutralization and remineralization. This material also releasesfluoride and the manufacturer asserts that it can be used as an alternative to amalgam [16].In conclusion, CN has an alkaline glass filler embedded into a resin matrix and releasesfluoride; this feature simultaneously provides those of the two previously mentionedmaterials. However, to date, no study has evaluated the various fluoride-releasing restora-tive materials by simulating the clinical conditions of dental caries based on an enamelmodel. Therefore, the aim of this study was to compare the demineralization resistanceand remineralization effects of various fluoride-releasing restorative materials.
2. Materials and Methods2.1. Materials
Three types of fluoride-releasing restorative materials that are commercially availableon the market were considered in this study. The selected materials have different typesand compositions, which are listed in Table 1.

Materials 2021, 14, 4554 3 of 12
Table 1. Fluoride-releasing restorative materials investigated in this study.
Cord Product Manufacturer Type Composition
FI Fuji IX GC Co, Tokyo, Japan Glass-ionomer cement Alumino-fluoro-silicate glasspolyacrylic acid, distilled water
RLRivaLightCure
SDI Limited, Bayswater,Victoria, Australia
Resin-modifiedglass-ionomer cement
Fluoro-alumino-silicate glasspolyacrylic acid, tartaric acid, HEMA,
camphorquinone
CN Cention NIvoclar Vivadent,
Schaan,Liechtenstein
Alkasite restorativematerial
Calcium fluorosilicate glass, Ba-Al silicate glass,Ca-Ba-Al fluorosilicate glass, ytterbium
trifluoride, isofillerUDMA, DCP, aromatic aliphatic-UDMA
UDMA: urethane dimethacrylate, DCP: tricyclodecan-dimethanol dimethacrylate; Aromatic aliphatic-UDMA: tetramethyl-xylylen-diurethane dimethacrylate.
2.2. Scanning Electron Microscopy (SEM) Observation of Materials’ Surfaces
All the specimens were prepared using a stainless-steel mold with a 10 mm diameterand 2 mm thickness. The specimens were subsequently removed from the mold, and thesurface was polished with 800 grit abrasive paper using a water-cooled rotating polishingmachine (Ecomet 30, Buehler Ltd., Lake Bluff, IL, USA). The surface was analyzed with onespecimen from each group. The specimen surface was sputter-coated with platinum undera vacuum evaporator before analysis, and observed using scanning electron microscopy(SEM; S-300N, Hitachi Ltd., Nagoya, Japan) at 2000× magnification with an acceleratingvoltage of 15 kV.
2.3. Acid Neutralization Property
To fabricate the specimens, a stainless steel mold (25 mm × 2 mm × 2 mm), polyesterfilm, and microscope glass slide (76 mm × 26 mm × 1 mm) were used. All materials weremanufactured according to the manufacturers’ instructions. The stainless-steel mold placedon poly-ester film was placed in microscope glass slide. Then, the mold was filled with FImixture and covered with polyester film and microscope glass, and the mold was pressedbetween two opposing microscope glass slides. The RL capsules were homogenized usinga high-power mixer for 10 s. The stainless-steel mold on polyester film was placed inmicroscope glass slide. Then, the mold was filled with RL material. Each side of thespecimen was photocured using a light curing unit (EliparTM S10, 3M ESPE Co., Seefeld,Germany) for 20 s. The CN mixture was placed into the mold and covered with a polyesterfilm and microscope glass. Then, the irradiation procedure was repeated using the samemethod as for RL. The excess materials of all specimens were removed with 400, 800,and 1200 grit abrasive paper. To investigate acid neutralization, three specimens of eachfluoride-releasing restorative material were immersed in 2.14 mL of lactic acid solution(pH 4.0), yielding a specimen volume/acid solution ratio of 0.14 cm3/1 mL [12], at atemperature of 25 ± 1 ◦C. A digital pH meter (Orion 4 Star, Thermo Fisher Scientific Inc.,Singapore) was used for measurement. The pH was recorded every minute and the totalmeasurement time was 100 min.
2.4. Fluoride Ion Release
The specimens were fabricated using a stainless-steel mold with a 10 mm diameterand 1 mm thickness [13]. A total of 6 specimens of each material were produced. Theprepared disk specimens were polished with 400, 800, and 1200 grit abrasive paper. Eachspecimen was immersed in 5 mL distilled water and the solution was not changed duringthe test period. Seven days after the start of the immersion, 10 vol % of TISAB III bufferwas added to stabilize the fluoride solution. Fluoride ion release from the specimens wascalculated using a pH/ion meter (Orion 4 Star pH/ISE Benchtop, Agilent, Thermo FisherScientific Inc., Singapore).

Materials 2021, 14, 4554 4 of 12
2.5. Calcium Concentration
The specimens were fabricated using a stainless-steel mold with a 10 mm diameterand 2 mm thickness. Five disk-shaped specimens were prepared for the study durationperiod. The specimens were polished with 400, 800, and 1200 grit abrasive paper. Afterpolishing, each specimen was immersed in 7 mL distilled water and stored in a 37 ◦Cincubator. After 7, 15, and 30 days from the start of the immersion, the calcium releasefrom the specimens was calculated using inductively coupled plasma-mass spectrometry(ICP-MS) (Agilent 7900, Agilent, Santa Clara, CA, USA). Three calibration curves wereprepared from the standard stock solutions to determine the calcium ion concentration.
2.6. Demineralization Resistance Test
Extracted sound bovine teeth were used in this study. Separated crowns were embed-ded in acrylic resin using a Teflon mold. The embedded bovine teeth were polished with400, 800, and 1200 grit abrasive paper. After polishing, an artificial cavity was formed inthe center of the enamel. Then, the cavity was filled with each restorative material. Thedemineralization solution consisted of 2.2 mM CaCl2, 2.2 mM NH2PO4, and 50 mM aceticacid. Then, the demineralization solution was adjusted to pH 4.4 using 1 M KOH [14]. Themicrohardness of the enamel surface was measured in two steps: before demineralization(baseline) and after immersion in demineralization solution. The measurements wererecorded using a Vickers hardness tester (Model DMH 2, Matsuzawa Seiki Co., Tokyo,Japan) with a 100 g load for 10 s of dwell time. The enamel was also observed using SEM(JEOL-7800F, JEOL Ltd., Tokyo, Japan) with an accelerating voltage of 10 kV at 10,000×magnification.
2.7. Remineralization Test
The specimens were prepared using the same method as described for the deminer-alization resistance test. After the demineralization procedure, the cavity-formed toothwas filled with restorative materials. Then, the specimens were immersed in artificialsaliva (AS), which was fabricated in accordance with ANSI/ADA specification No. 41(recommended standard practices for biological evaluation of dental materials). The mi-crohardness of the enamel surface was determined as above. The enamel surface wasmeasured in three steps: sound enamel (baseline), after immersion in demineralizationsolution, and following immersion in artificial saliva. SEM (JEOL-7800F, JEOL Ltd., Tokyo,Japan) images were also obtained with accelerating voltages of 5, 10, and 15 kV at 10,000×magnification.
2.8. Statistical Analysis
The statistical analyses were carried out by one-way ANOVA followed by Tukey’spost hoc test. Additional analyses were performed for the results of the microhardness anddemineralization resistance test using an independent t-test. All statistical analyses wereperformed using the SPSS 23 software program (IBM Corp, Armonk, NY, USA) and thelevel of significance was fixed at 0.05.
3. Results3.1. Scanning Electron Microscopy (SEM) Images of the Materials’ Surfaces
SEM images of the materials’ surfaces are shown in Figure 1. The surface of the FIgroup presented many voids and cracks compared to the other groups. The RL surfacewas rougher than that of CN, containing small pores on the surface. The CN group showedan irregular surface, with the presence of visible particles, which were approximately20–30 µm in size.
Materials 2021, 14, 4554 5 of 12Materials 2021, 14, x 5 of 12
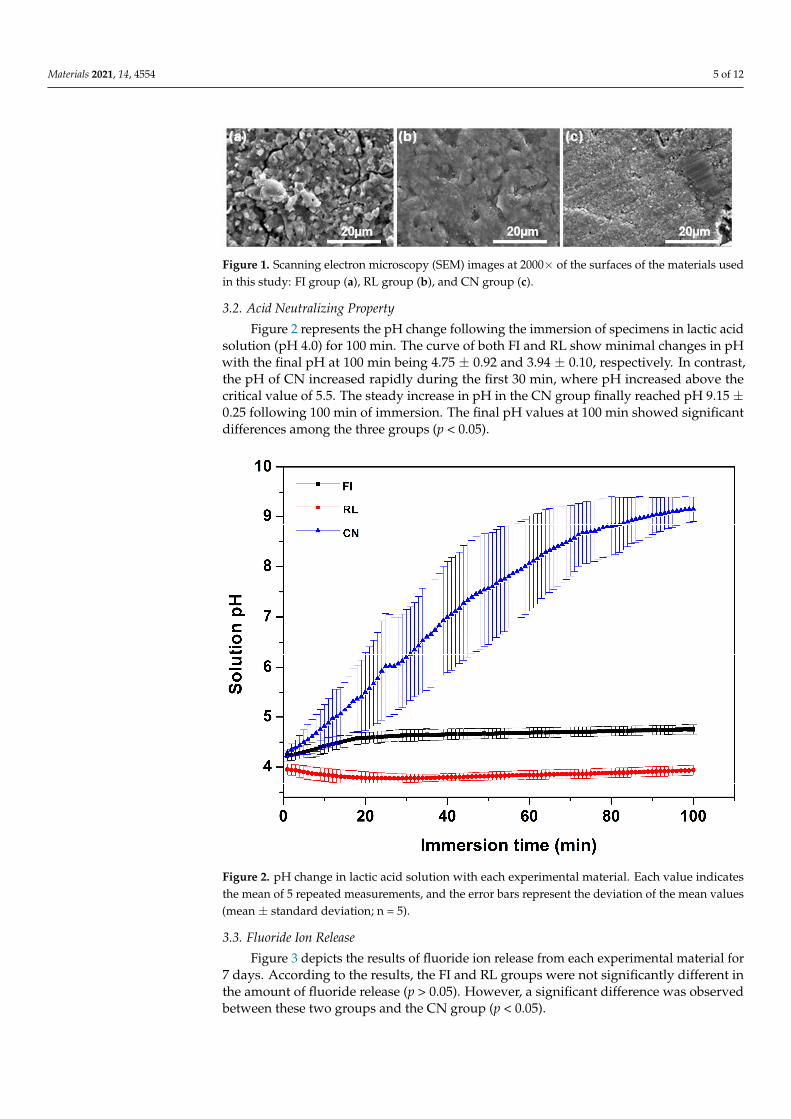
Figure 1. Scanning electron microscopy (SEM) images at 2000× of the surfaces of the materials used in this study: FI group (a), RL group (b), and CN group (c).
3.2. Acid Neutralizing Property Figure 2 represents the pH change following the immersion of specimens in lactic
acid solution (pH 4.0) for 100 min. The curve of both FI and RL show minimal changes in pH with the final pH at 100 min being 4.75 ± 0.92 and 3.94 ± 0.10, respectively. In contrast, the pH of CN increased rapidly during the first 30 min, where pH increased above the critical value of 5.5. The steady increase in pH in the CN group finally reached pH 9.15 ± 0.25 following 100 min of immersion. The final pH values at 100 min showed significant differences among the three groups (p < 0.05).
Figure 2. pH change in lactic acid solution with each experimental material. Each value indicates the mean of 5 repeated measurements, and the error bars represent the deviation of the mean values (mean ± standard deviation; n = 5).
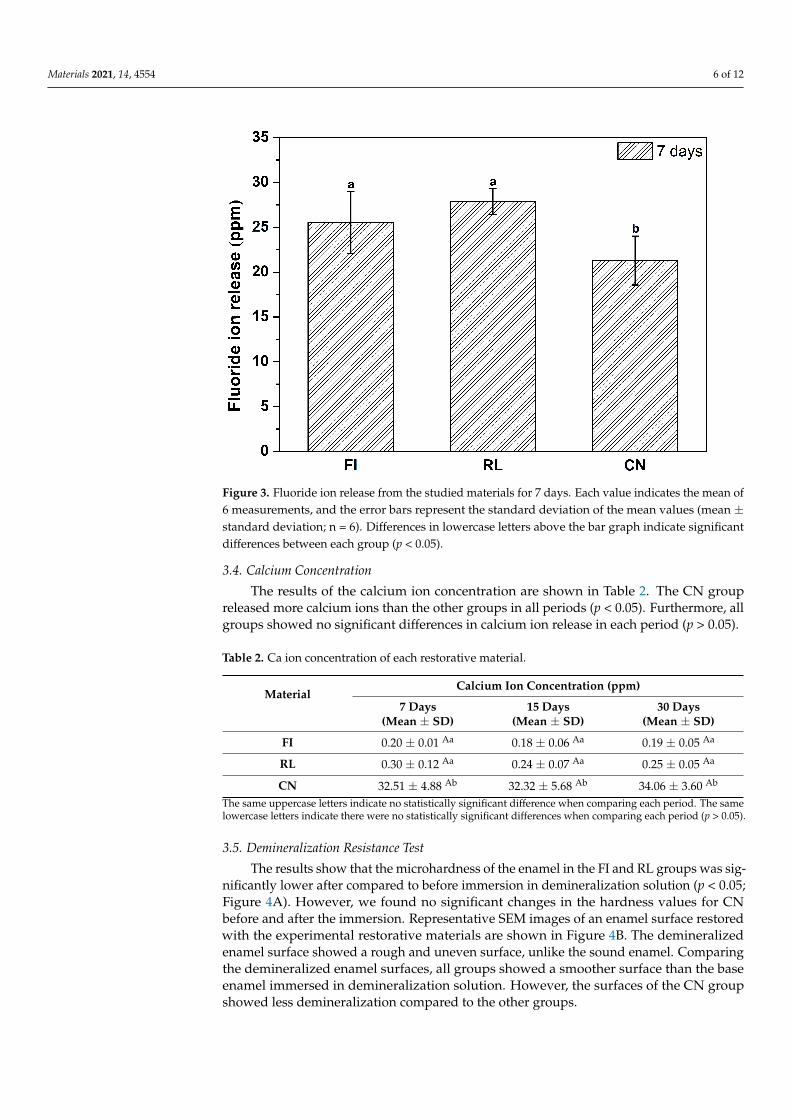
3.3. Fluoride Ion Release Figure 3 depicts the results of fluoride ion release from each experimental material
for 7 days. According to the results, the FI and RL groups were not significantly different in the amount of fluoride release (p > 0.05). However, a significant difference was observed between these two groups and the CN group (p < 0.05).
Figure 1. Scanning electron microscopy (SEM) images at 2000× of the surfaces of the materials usedin this study: FI group (a), RL group (b), and CN group (c).
3.2. Acid Neutralizing Property
Figure 2 represents the pH change following the immersion of specimens in lactic acidsolution (pH 4.0) for 100 min. The curve of both FI and RL show minimal changes in pHwith the final pH at 100 min being 4.75 ± 0.92 and 3.94 ± 0.10, respectively. In contrast,the pH of CN increased rapidly during the first 30 min, where pH increased above thecritical value of 5.5. The steady increase in pH in the CN group finally reached pH 9.15 ±0.25 following 100 min of immersion. The final pH values at 100 min showed significantdifferences among the three groups (p < 0.05).
Materials 2021, 14, x 5 of 12
Figure 1. Scanning electron microscopy (SEM) images at 2000× of the surfaces of the materials used in this study: FI group (a), RL group (b), and CN group (c).
3.2. Acid Neutralizing Property Figure 2 represents the pH change following the immersion of specimens in lactic
acid solution (pH 4.0) for 100 min. The curve of both FI and RL show minimal changes in pH with the final pH at 100 min being 4.75 ± 0.92 and 3.94 ± 0.10, respectively. In contrast, the pH of CN increased rapidly during the first 30 min, where pH increased above the critical value of 5.5. The steady increase in pH in the CN group finally reached pH 9.15 ± 0.25 following 100 min of immersion. The final pH values at 100 min showed significant differences among the three groups (p < 0.05).
Figure 2. pH change in lactic acid solution with each experimental material. Each value indicates the mean of 5 repeated measurements, and the error bars represent the deviation of the mean values (mean ± standard deviation; n = 5).
3.3. Fluoride Ion Release Figure 3 depicts the results of fluoride ion release from each experimental material
for 7 days. According to the results, the FI and RL groups were not significantly different in the amount of fluoride release (p > 0.05). However, a significant difference was observed between these two groups and the CN group (p < 0.05).
Figure 2. pH change in lactic acid solution with each experimental material. Each value indicatesthe mean of 5 repeated measurements, and the error bars represent the deviation of the mean values(mean ± standard deviation; n = 5).
3.3. Fluoride Ion Release
Figure 3 depicts the results of fluoride ion release from each experimental material for7 days. According to the results, the FI and RL groups were not significantly different inthe amount of fluoride release (p > 0.05). However, a significant difference was observedbetween these two groups and the CN group (p < 0.05).
Materials 2021, 14, 4554 6 of 12Materials 2021, 14, x 6 of 12
Figure 3. Fluoride ion release from the studied materials for 7 days. Each value indicates the mean of 6 measurements, and the error bars represent the standard deviation of the mean values (mean ± standard deviation; n = 6). Differences in lowercase letters above the bar graph indicate significant differences between each group (p < 0.05).
3.4. Calcium Concentration The results of the calcium ion concentration are shown in Table 2. The CN group
released more calcium ions than the other groups in all periods (p < 0.05). Furthermore, all groups showed no significant differences in calcium ion release in each period (p > 0.05).
Table 2. Ca ion concentration of each restorative material.
Material Calcium Ion Concentration (ppm)
7 Days (Mean ± SD)
15 Days (Mean ± SD)
30 Days (Mean ± SD)
FI 0.20 ± 0.01 Aa 0.18 ± 0.06 Aa 0.19 ± 0.05 Aa RL 0.30 ± 0.12 Aa 0.24 ± 0.07 Aa 0.25 ± 0.05 Aa CN 32.51 ± 4.88 Ab 32.32 ± 5.68 Ab 34.06 ± 3.60 Ab
The same uppercase letters indicate no statistically significant difference when comparing each period. The same lowercase letters indicate there were no statistically significant differences when comparing each period (p > 0.05).
3.5. Demineralization Resistance Test The results show that the microhardness of the enamel in the FI and RL groups was
significantly lower after compared to before immersion in demineralization solution (p < 0.05; Figure 4A). However, we found no significant changes in the hardness values for CN before and after the immersion. Representative SEM images of an enamel surface restored with the experimental restorative materials are shown in Figure 4B. The demineralized enamel surface showed a rough and uneven surface, unlike the sound enamel. Comparing the demineralized enamel surfaces, all groups showed a smoother surface than the base enamel immersed in demineralization solution. However, the surfaces of the CN group showed less demineralization compared to the other groups.
Figure 3. Fluoride ion release from the studied materials for 7 days. Each value indicates the mean of6 measurements, and the error bars represent the standard deviation of the mean values (mean ±standard deviation; n = 6). Differences in lowercase letters above the bar graph indicate significantdifferences between each group (p < 0.05).
3.4. Calcium Concentration
The results of the calcium ion concentration are shown in Table 2. The CN groupreleased more calcium ions than the other groups in all periods (p < 0.05). Furthermore, allgroups showed no significant differences in calcium ion release in each period (p > 0.05).
Table 2. Ca ion concentration of each restorative material.
MaterialCalcium Ion Concentration (ppm)
7 Days(Mean ± SD)
15 Days(Mean ± SD)
30 Days(Mean ± SD)
FI 0.20 ± 0.01 Aa 0.18 ± 0.06 Aa 0.19 ± 0.05 Aa
RL 0.30 ± 0.12 Aa 0.24 ± 0.07 Aa 0.25 ± 0.05 Aa
CN 32.51 ± 4.88 Ab 32.32 ± 5.68 Ab 34.06 ± 3.60 Ab
The same uppercase letters indicate no statistically significant difference when comparing each period. The samelowercase letters indicate there were no statistically significant differences when comparing each period (p > 0.05).
3.5. Demineralization Resistance Test
The results show that the microhardness of the enamel in the FI and RL groups was sig-nificantly lower after compared to before immersion in demineralization solution (p < 0.05;Figure 4A). However, we found no significant changes in the hardness values for CNbefore and after the immersion. Representative SEM images of an enamel surface restoredwith the experimental restorative materials are shown in Figure 4B. The demineralizedenamel surface showed a rough and uneven surface, unlike the sound enamel. Comparingthe demineralized enamel surfaces, all groups showed a smoother surface than the baseenamel immersed in demineralization solution. However, the surfaces of the CN groupshowed less demineralization compared to the other groups.

Materials 2021, 14, 4554 7 of 12Materials 2021, 14, x 7 of 12
Figure 4. Microhardness of the enamel surface filled with each restorative material (A). Each value indicates the mean of 10 measurements, and the error bars represent the standard deviation of the (mean ± standard deviation; n = 10). Horizontal bar: no significant difference before and after im-mersion in demineralization (p > 0.05). Representative images of enamel surface after demineraliza-tion process (B).
3.6. Remineralization Test The microhardness significantly decreased after demineralization treatment com-
pared to sound enamel in all the groups (p < 0.05; Figure 5A). The FI group did not show recovery of hardness compared to the sound enamel before demineralization, but at 30 days, it recovered with a minimal increase in the microhardness value (p < 0.05). The RL group did not recover to its previous level after demineralization treatment for all periods. However, after immersion in the artificial saliva, only the CN group showed microhard-ness values similar to those of sound enamel for all periods (p > 0.05). Representative SEM images of all groups are shown in Figure 5B. Compared to the demineralized enamel sur-face, FI and RL groups showed a smooth enamel surface after 7 days. However, the CN group showed a smoother surface than the other groups after 7 days, whereas at 15 and 30 days, the enamel appeared to be irregular on the surface.
Figure 4. Microhardness of the enamel surface filled with each restorative material (A). Each valueindicates the mean of 10 measurements, and the error bars represent the standard deviation ofthe (mean ± standard deviation; n = 10). Horizontal bar: no significant difference before andafter immersion in demineralization (p > 0.05). Representative images of enamel surface afterdemineralization process (B).
3.6. Remineralization Test
The microhardness significantly decreased after demineralization treatment comparedto sound enamel in all the groups (p < 0.05; Figure 5A). The FI group did not show recoveryof hardness compared to the sound enamel before demineralization, but at 30 days, itrecovered with a minimal increase in the microhardness value (p < 0.05). The RL group didnot recover to its previous level after demineralization treatment for all periods. However,after immersion in the artificial saliva, only the CN group showed microhardness valuessimilar to those of sound enamel for all periods (p > 0.05). Representative SEM imagesof all groups are shown in Figure 5B. Compared to the demineralized enamel surface, FIand RL groups showed a smooth enamel surface after 7 days. However, the CN groupshowed a smoother surface than the other groups after 7 days, whereas at 15 and 30 days,the enamel appeared to be irregular on the surface.

Materials 2021, 14, 4554 8 of 12Materials 2021, 14, x 8 of 12
Figure 5. Microhardness of enamel surface filled with each restorative material (A). Each value in-dicates the mean of 10 measurements, and the error bars represent the standard deviation of the (mean ± standard deviation; n = 10). Differences in lowercase alphabetical letters above the bar graph indicate differences comparing periods for the same groups (p < 0.05). Representative images of enamel surface after the remineralization process (B).
Figure 5. Microhardness of enamel surface filled with each restorative material (A). Each valueindicates the mean of 10 measurements, and the error bars represent the standard deviation of the(mean ± standard deviation; n = 10). Differences in lowercase alphabetical letters above the bargraph indicate differences comparing periods for the same groups (p < 0.05). Representative imagesof enamel surface after the remineralization process (B).

Materials 2021, 14, 4554 9 of 12
4. Discussion
This study was conducted to evaluate the properties of different fluoride-releasingrestorative materials, including a recently developed material known as ‘alkasite’ (CN).Additionally, their demineralization resistances and remineralization effects were com-pared. As far as we are concern, this is the first paper that considered such propertiesof alkasite material and other fluoride-releasing restorative material, particularly underclinically similar environments.
In the acid neutralization test, the change in pH was monitored after immersing eachfluoride-restorative material in lactic acid solution at pH 4.4. The CN group showed a levelhigher than the critical pH 5.5 within 30 min. According to a previous study, the drop inpH due to acid produced by pathogenic bacteria induces enamel demineralization, and at apH lower than the critical pH 5.5, enamel minerals dissolution was observed [17]. Based onthe Stephan curve, the pH, after rising, decreased to the high-risk cariogenic zone between5 and 20 min, and the initial pH was generally restored within 30–60 min [18]. It is thuscritical that the pH is increased within the shortest time to avoid pH 4.0, where the risk ofdental caries is high. As shown in Figure 2, the pH change observed at pH 4.0 was higherthan at the critical pH 5.5 for the CN group within 30 min, as the pH in the group increasedmore rapidly than in other groups within the first 10 min, which is when the pH fell to thelowest level following acid exposure. However, the other two groups showed no significantchange in pH. The CN group containing CaO and Na2O alkaline glass can create conditionsfor acid neutralization based on the alkali ions as OH− groups are released in aqueousenvironments. Na+ is one of the main ions enabling the exchange process with protons(H+) from the solution; the Na2O content determines the alkalizing ability of the filler [19].By containing an alkaline glass, the CN group has the capacity for rapid acid neutralization,which confirms the effect of demineralization resistance when the restorative material isapplied to the enamel. In addition, the fluoride-ion release forms fluoroapatite, whichhas a more effective demineralization resistance than hydroxyapatite [20]. Consequently,CN was found to have superior demineralization resistance than the other two groups bysimultaneously releasing various ions.
The microhardness of the enamel surface can be non-destructively measured, and isrelated to the mineral content of the enamel, while reflecting the mechanical propertiesof the tooth structure. The method has also been applied in studies that quantitativelyestimated the initial enamel demineralization. For a cariogenic case, it is suitable forexamining the demineralization after acid challenge [21–23]. As shown in Figure 4A, theFI and RL groups displayed significantly different decreases in microhardness followingdemineralization when compared to the sound enamel before demineralization. In contrast,the CN group showed no significant difference in the acid-challenged enamel compared tothe sound enamel. This finding is likely due to the demineralization resistance capacityof the CN group in an acidic environment, which arises from the acid neutralizationcapacity based on the release of OH− groups. In a previous study, during the processof demineralization at pH 4.0, restorative materials with acid neutralization capacitysimultaneously exhibited a demineralization resistance effect [24]. In addition, CN groupsrelease a higher level of calcium ions at pH 4.0 artificial saliva than at pH 7.3 Tris buffer [3].A previous study reported that when the pH decreases, enamel demineralization relieson the level of calcium saturation [25]. Consequently, the CN group was predicted to be arestorative material with a capacity for initial acid neutralization, as well as providing andemineralization resistance effect through calcium ion release.
SEM observation is a method widely used for the qualitative estimation of deminer-alization. SEM images also provide information about surface properties [26,27]. In aprevious study, microhardness determination and SEM image analysis were carried out toevaluate the demineralization resistance of fluoride-releasing materials with demineralizedenamel [28]. In this study, the SEM images were examined in addition to the enamel surfacemicrohardness, and the result showed that in terms of demineralized enamel surface, the

Materials 2021, 14, 4554 10 of 12
CN group had the smoothest surface due to the reduced influence of the demineralizationprocess compared to the other groups.
During the remineralization process, calcium and phosphate ions penetrate the dem-ineralized pores, thereby restoring the microhardness of enamel, which is referred to as are-hardening process. This process is also the result of mineral precipitation. Accordingto previous studies, composite resin containing amorphous calcium phosphate (ACP) isknown to exhibit a remineralization effect as it releases high levels of calcium and phos-phate ions [29]. CN releases various ions such as Ca2+, Na+, and F−, which increasethe pH and form apatite when immersed in artificial saliva [30]. As shown in Table 2,the CN group released calcium ions; when the hardness of demineralized enamel wascompared, significant differences were observed at days 7, 15, and 30, presumably due tothe remineralization effect based on calcium release. The FI group showed a significantlyincreased hardness of the enamel surface on day 30. The explanation for this can be foundin a previous study, where microhardness was reported to be restored upon immersingdemineralized enamel in artificial saliva, which was ultimately due to the influence of theartificial saliva [31]. These results are supposed to be affected by the formation of apatitethrough ion release.
When observing the remineralized enamel surface using SEM, the CN group showeda smoother enamel surface than the other groups, which was expected because it is amaterial that simultaneously releases fluoride and calcium ions. In a previous study,effective remineralization of subsurface enamel was found when materials containingcalcium as well as fluoride ions were applied to human enamel [32]. No significant changesin the FI and RL groups with each a period were observed. In contrast, the CN groupshowed irregular and thin pieces of enamel surface on days 15 and 30, which was expectedto be influenced by the material when observing the material surface. Consequently, theCN group is expected to have a remineralization effect for 7 days. To exactly verify thecaries progression, SEM images and microhardness of enamel surface have limitations inevaluating enamel subsurface lesions. However, this measurement is useful for evaluatinginitial structural changes according to acid exposure and applied materials.
This study confirmed for the first time that the tested alkasite restorative material(CN) showed superior fluoride releasing ability than other fluoride-releasing restorativematerials, resulting in quicker acid neutralization and remineralization. Still, the study waslimited to the test conditions considered in this study as well as one type of commerciallyavailable material, where further study, including animal and clinical studies, would beuseful to understand more about the demineralization resistance and remineralizationeffects of these fluoride-releasing restorative materials.
5. Conclusions
Within the limitations of an in vitro study, our findings demonstrated that alkasiterestorative material (CN) is a superior fluoride-releasing restorative material in stimulatingdemineralization and remineralization in an enamel model compared to the FI and RLgroups. Hence, alkasite restorative material can be an effective material when used incariogenic environments. However, to evaluate subsurface enamel lesions and to confirmthese findings, additional methods such as animal or clinical studies may be useful.
Author Contributions: Conceptualization, M.-J.K. and M.-J.L.; methodology, M.-J.K., M.-J.L., K.-M.K.and J.-Y.S.; formal analysis, M.-J.K. and J.-Y.S.; investigation, M.-J.K.; resources, J.-S.K.; data curation,M.-J.K.; writing—original draft preparation, M.-J.K.; writing—review and editing, K.-M.K., S.-Y.Y.,S.-H.C. and J.-S.K.; visualization, M.-J.K.; supervision, K.-M.K., S.-H.C. and J.-S.K.; project admin-istration, K.-M.K.; funding acquisition, S.-H.C. and J.-S.K. All authors have read and agreed to thepublished version of the manuscript.
Funding: This work was supported by the Korea Medical Device Development Fund grant fundedby the Korea government (the Ministry of Science and ICT, the Ministry of Trade, Industry andEnergy, the Ministry of Health & Welfare, the Ministry of Food and Drug Safety) (Project Number:KMDF_PR_20200901_0067-01).

Materials 2021, 14, 4554 11 of 12
Institutional Review Board Statement: Not applicable.
Informed Consent Statement: Not applicable.
Data Availability Statement: Not applicable.
Conflicts of Interest: The authors declare no conflict of interest.
References1. Koldehoff, J.; Schneider, G.A. Effect of deproteinization treatments on the structure and mechanical properties of dental enamel.
Materialia 2021, 16, 101088. [CrossRef]2. Yang, S.-Y.; Piao, Y.-Z.; Kim, S.-M.; Lee, Y.-K.; Kim, K.-N.; Kim, K.-M. Acid neutralizing, mechanical and physical properties of pit
and fissure sealants containing melt-derived 45s5 bioactive glass. Dent. Mater. 2013, 29, 1228–1235. [CrossRef]3. Tiskaya, M.; Al-Eesa, N.; Wong, F.; Hill, R. Characterization of the bioactivity of two commercial composites. Dent. Mater. 2019,
35, 1757–1768. [CrossRef] [PubMed]4. Al-Qarni, F.; Weir, M.; Melo, M.A.; Al-Dulaijan, Y.; Almulhim, K.S.; Xu, H.H. Novel calcium phosphate ion-rechargeable and
antibacterial adhesive to inhibit dental caries. Clin. Oral Investig. 2021, 1–11. [CrossRef]5. Simeonov, M.; Gussiyska, A.; Mironova, J.; Nikolova, D.; Apostolov, A.; Sezanova, K.; Dyulgerova, E.; Vassileva, E. Novel hybrid
chitosan/calcium phosphates microgels for remineralization of demineralized enamel—A model study. Eur. Polym. J. 2019, 119,14–21. [CrossRef]
6. Clift, F. Artificial methods for the remineralization of hydroxyapatite in enamel. Mater. Today Chem. 2021, 21, 100498. [CrossRef]7. Ramadoss, R.; Padmanaban, R.; Subramanian, B. Role of bioglass in enamel remineralization: Existing strategies and future
prospects—A narrative review. J. Biomed. Mater. Res. Part B Appl. Biomater. 2021, 1–22.8. Gao, Y.; Liang, K.; Weir, M.D.; Gao, J.; Imazato, S.; Tay, F.R.; Lynch, C.D.; Oates, T.W.; Li, J.; Xu, H.H. Enamel remineralization via
poly (amido amine) and adhesive resin containing calcium phosphate nanoparticles. J. Dent. 2020, 92, 103262. [CrossRef]9. Bueno, L.S.; Silva, R.M.; Magalhães, A.P.R.; Navarro, M.F.L.; Pascotto, R.C.; Buzalaf, M.A.; Nicholson, J.W.; Sidhu, S.K.; Borges,
A.F.S. Positive correlation between fluoride release and acid erosion of restorative glass-ionomer cements. Dent. Mater. 2019, 35,135–143. [CrossRef]
10. Kumari, P.D.; Khijmatgar, S.; Chowdhury, A.; Lynch, E.; Chowdhury, C.R. Factors influencing fluoride release in atraumaticrestorative treatment (art) materials: A review. J. Oral Biol. Craniofac. Res. 2019, 9, 315–320. [CrossRef]
11. Abbasi, R.; Nodehi, A.; Atai, M. Synthesis of poly (acrylic-co-itaconic acid) through precipitation photopolymerization forglass-ionomer cements: Characterization and properties of the cements. Dent. Mater. 2020, 36, e169–e183. [CrossRef] [PubMed]
12. Sidhu, S.K.; Nicholson, J.W. A review of glass-ionomer cements for clinical dentistry. J. Funct. Biomater. 2016, 7, 16. [CrossRef][PubMed]
13. Alatawi, R.A.; Elsayed, N.H.; Mohamed, W.S. Influence of hydroxyapatite nanoparticles on the properties of glass ionomercement. J. Mater. Res. Technol. 2019, 8, 344–349. [CrossRef]
14. Nicholson, J.W.; Czarnecka, B. The biocompatibility of resin-modified glass-ionomer cements for dentistry. Dent. Mater. 2008, 24,1702–1708. [CrossRef]
15. Irie, M.; Nagaoka, N.; Yamashiro, T.; Suzuki, K. Mechanical properties of a resin-modified glass ionomer cement for luting: Effectof adding spherical silica filler. Dent. Mater. J. 2010, 29, 253–261.
16. Naz, F.; Khan, A.S.; Kader, M.A.; Al Gelban, L.O.S.; Mousa, N.M.A.; Asiri, R.S.H.; Hakeem, A.S. Comparative evaluation ofmechanical and physical properties of a new bulk-fill alkasite with conventional restorative materials. Saudi Dent. J. 2020.[CrossRef]
17. Dawes, C. What is the critical ph and why does a tooth dissolve in acid? J. Can. Dent. Assoc. 2003, 69, 722–725.18. Rankine, C.; Moreno, E.; Vogel, G.; Margolis, H. Micro-analytical determination of ph, calcium, and phosphate in plaque fluid. J.
Dent. Res. 1985, 64, 1275–1280. [CrossRef]19. Par, M.; Gubler, A.; Attin, T.; Tarle, Z.; Tauböck, T.T. Anti-demineralizing protective effects on enamel identified in experimental
and commercial restorative materials with functional fillers. Sci. Rep. 2021, 11, 11806. [CrossRef] [PubMed]20. Ahn, J.-H.; Kim, J.-W.; Yoon, Y.-M.; Lee, N.-Y.; Lee, S.-H.; Jih, M.-K. Time-dependent anti-demineralization effect of silver diamine
fluoride. Children 2020, 7, 251. [CrossRef]21. Cuy, J.L.; Mann, A.B.; Livi, K.J.; Teaford, M.F.; Weihs, T.P. Nanoindentation mapping of the mechanical properties of human molar
tooth enamel. Arch. Oral Biol. 2002, 47, 281–291. [CrossRef]22. Barbour, M.E.; Parker, D.M.; Allen, G.C.; Jandt, K.D. Human enamel dissolution in citric acid as a function of ph in the range 2.30
≤ ph ≤ 6.30—A nanoindentation study. Eur. J. Oral Sci. 2003, 111, 258–262. [CrossRef]23. Maia, A.C.; Mangabeira, A.; Vieira, R.; de Almeida Neves, A.; Lopes, R.T.; Pires, T.M.; Viana, G.M.; Cabral, L.M.; Cavalcante,
L.M.; Portela, M.B. Experimental composites containing quaternary ammonium methacrylates reduce demineralization atenamel-restoration margins after cariogenic challenge. Dent. Mater. 2019, 35, e175–e183. [CrossRef] [PubMed]
24. Weir, M.; Chow, L.; Xu, H.H. Remineralization of demineralized enamel via calcium phosphate nanocomposite. J. Dent. Res. 2012,91, 979–984. [CrossRef] [PubMed]
25. Cury, J.; Francisco, S.; Simões, G.; Cury, A.D.B.; Tabchoury, C. Effect of a calcium carbonate-based dentifrice on enameldemineralization in situ. Caries Res. 2003, 37, 194–199. [CrossRef] [PubMed]

Materials 2021, 14, 4554 12 of 12
26. Yeh, S.-T.; Wang, H.-T.; Liao, H.-Y.; Su, S.-L.; Chang, C.-C.; Kao, H.-C.; Lee, B.-S. The roughness, microhardness, and surfaceanalysis of nanocomposites after application of topical fluoride gels. Dent. Mater. 2011, 27, 187–196. [CrossRef]
27. Di Hipólito, V.; de Goes, M.F.; Carrilho, M.; Chan, D.C.; Daronch, M.; Sinhoreti, M.A.C. Sem evaluation of contemporaryself-etching primers applied to ground and unground enamel. J. Adhes. Dent. 2005, 7, 203–211. [PubMed]
28. Kim, M.J.; Lee, S.H.; Lee, N.Y.; Lee, I.H. Evaluation of the effect of pva tape supplemented with 2.26% fluoride on enameldemineralization using microhardness assessment and scanning electron microscopy: In vitro study. Arch. Oral Biol. 2013, 58,160–166. [CrossRef]
29. Langhorst, S.; O’donnell, J.; Skrtic, D. In vitro remineralization of enamel by polymeric amorphous calcium phosphate composite:Quantitative microradiographic study. Dent. Mater. 2009, 25, 884–891. [CrossRef]
30. Khalid, H.; Aleesa, N.; Grosjean, M.; Hill, R.; Wong, F. Characterisation of a bioactive SiO2-CaO-CaF2-Na2O glass used incomposites. Dent. Mater. 2021, 37, 1–9. [CrossRef]
31. Ionta, F.Q.; Mendonça, F.L.; de Oliveira, G.C.; de Alencar, C.R.B.; Honório, H.M.; Magalhaes, A.C.; Rios, D. In vitro assessment ofartificial saliva formulations on initial enamel erosion remineralization. J. Dent. 2014, 42, 175–179. [CrossRef] [PubMed]
32. Shen, P.; Walker, G.D.; Yuan, Y.; Reynolds, C.; Stanton, D.P.; Fernando, J.R.; Reynolds, E.C. Importance of bioavailable calcium influoride dentifrices for enamel remineralization. J. Dent. 2018, 78, 59–64. [CrossRef] [PubMed]