energetic materials and atomic force microscopy… · 2 introduction research into the dynamic...
TRANSCRIPT

1
ENERGETIC MATERIALS AND ATOMIC FORCE MICROSCOPY: STRUCTURE AND KINETICS
B. L. Weeks, R. K. Weese and J. M. Zaug Lawrence Livermore National Laboratory
Livermore, CA 94551
Abstract Understanding the structure and composition of energetic materials at the sub micron level is imperative for the fundamental studies of hot-spot formation and structural composition of energetic materials. Using in situ high-temperature AFM we have observed the solid-solid phase transition of octahydro-1,3,5,7,-tetrazocine, HMX, in real time. Massive surface reconstruction occurs during the 1st-order transition. The temperature induced increase in void space and surface roughness observed in the delta phase polymorph of HMX serve to increase the growth rate and volume of shock initiated hot spots and possibly reaction sensitivity. HMX exists in four solid phase polymorphs, labeled α, β, χ, and δ. The phase conversion of the β phase to the δ phase involves a major disruption of the crystal lattice. The energy required to bring about this change is a measurable quantity. Multiple thermal analysis techniques carried out simultaneously are preferable because the results are directly comparable. Thermal methods are dynamic techniques, where heating or cooling is applied to a sample, unless isothermal conditions are employed. Thermogravimetric Analysis, TGA, can be used to quantify decomposition components in a substance while Differential Thermal Analysis, DTA, can be used to measure the heat flow or the specific heat capacity, with respect to time and temperature. TGA/DTA experiments were performed to help us take a different look at the chemical nature of HMX and aid us in understanding the void formation process.
2
Introduction
Research into the dynamic behavior of energetic materials is an important area in propulsion, chemistry, and physics. However, this effort is made complicated by the large range of structural phases observed in many crystalline solids. For example, octahydro-1,3,5,7,-tetrazocine (HMX) is one of the most common energetic materials and exists in α,β,γ, and δ polymorphic forms. The most stable room temperature form is the β phase where the eight-membered ring HMX molecules exist in a quasi-chair form giving the molecule a center of symmetry.1 The pure monoclinic β phase undergoes a solid-solid transition into hexagonal δ-HMX at 157°C and ambient pressure. In the δ phase, HMX displays a quasi-boat conformation where all of the NO2 groups reside on one side of the ring.2 The structure of the α and γ phases3 may play a role in thermal decomposition at high pressure and temperature however, they have no relevance with the experiment reported here.
The β to δ phase transition is thought to couple with the thermal decomposition of HMX and the transition temperature and rate strongly depend on the grain size distribution of the β phase.4 It is well known that δ HMX is more sensitive to initiation.5 A 6.7% volume expansion6 associated with the phase transition leads to strain development and microfracturing of the crystalline surface. This mechanical damage is not necessarily associated with slow thermal decomposition, but can lead to a material with very different physical properties compared to the original starting material. Therefore, the
mechanical properties and combustion/detonation characteristics of HMX can be affected by this transition. Moreover, the dramatic increase in void space also has implications concerning detonation sensitivity issues. Studies performed by Palmer and Field describe the mechanical properties of single crystal β-HMX in detail.7
A number of methods have been employed to examine the β/δ transition including calorimetry, FTIR,6 Raman spectroscopy,8 second harmonic generation (SHG),9 and x-ray diffraction (XRD).10 Recently, we measured simultaneous SHG intensities and collected angle resolved x-ray diffraction images of the phase transition in real time.11 The SHG intensities indicate a complete transition to the δ phase as the HMX changes from centro-symmetric to noncentro-symmetric, whilst the XRD data clearly shows that only 65% had truly converted. The implication is that SHG from larger grain HMX surfaces dominates the overall SHG volume effect since the surface area of these grains increases by many orders of magnitude. Indeed biophysical processes have been monitored in real-time using SHG where the primary source of the signal is from the cell membrane.12, 13 We have decided to use atomic force microscopy (AFM) to systematically learn about the phase dependent surface of HMX. Experimental AFM
The advent of the AFM provides a rather unique tool to obtain images of the microstructure of surfaces.14 On energetic materials AFM has been utilized to determine defects, plastic
3
flow and failures on RDX crystalline explosives.15,16,17 AFM has also been used to observe crystal growth in real time elucidating mechanisms and imperfections on crystal surfaces.18,19 On biological samples, AFM has been employed to observe solid-solid phase transitions in-situ at room temperature.20 One drawback of AFM is that the instrument is not only susceptible to thermal drift, but the fine positioning piezo transducers depolarize at temperatures in excess of 150oC. It was perceived that the surface effects of the β/δ phase transition on HMX single crystals could be imaged if a suitable high temperature system could be found.
Our AFM measurements were performed on a Digital Instruments MultiModeTM AFM equipped with a new high temperature heating assembly.21 The system incorporates forced water piezo cooling and is capable of sample temperatures up to 250oC. Images were collected in TappingModeTM and the cantilever was heated to the same temperature as the sample to minimize thermal gradients, drift, and prevent condensation. Pure β-HMX crystals were prepared by the method of Siele et al.22 octahydro-1,5-diacetyl-3,7-dinitro-1,3,5,7-tetrazocine (DADN) was treated with 100% HNO3 and P2O5 at 50°C for 50 min followed by quenching in ice water. Slow recrystallization from acetone yielded HMX as colorless microcrystals. The crystal was aligned such that the long axis was parallel to the fast scan direction of the AFM.
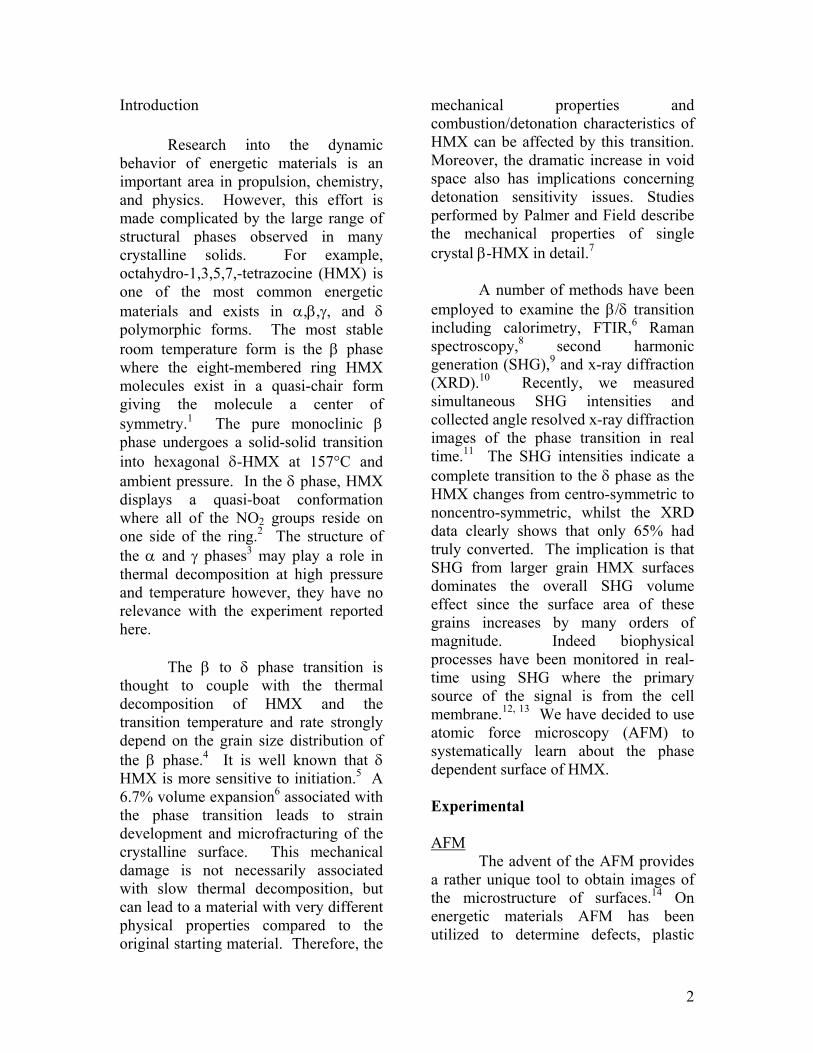
Images were first obtained at room temperature to determine both crystal and tip quality. Figure 1 shows a room temperature 5x5 µm image of a β-
HMX crystal. The crystal was approximately 250 µm in length and 45 µm in width. The sample was then heated to 145o C and equilibrated for 30 minutes. This temperature was chosen because it is well below the 1-bar solid-solid transition temperature. The thermal equilibration period is necessary to reduce thermal drift, which causes distortions or inhibits image quality. The sample was then heated above the transition temperature and a series of images were sequentially collected every 3 minutes.
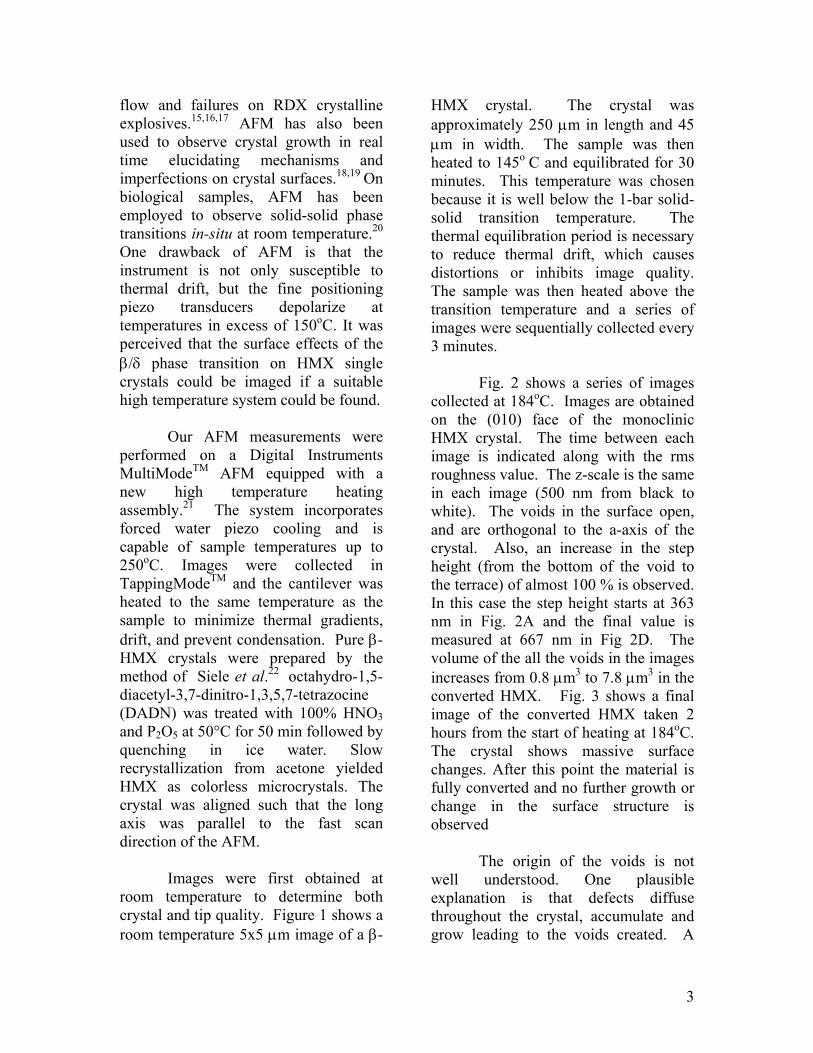
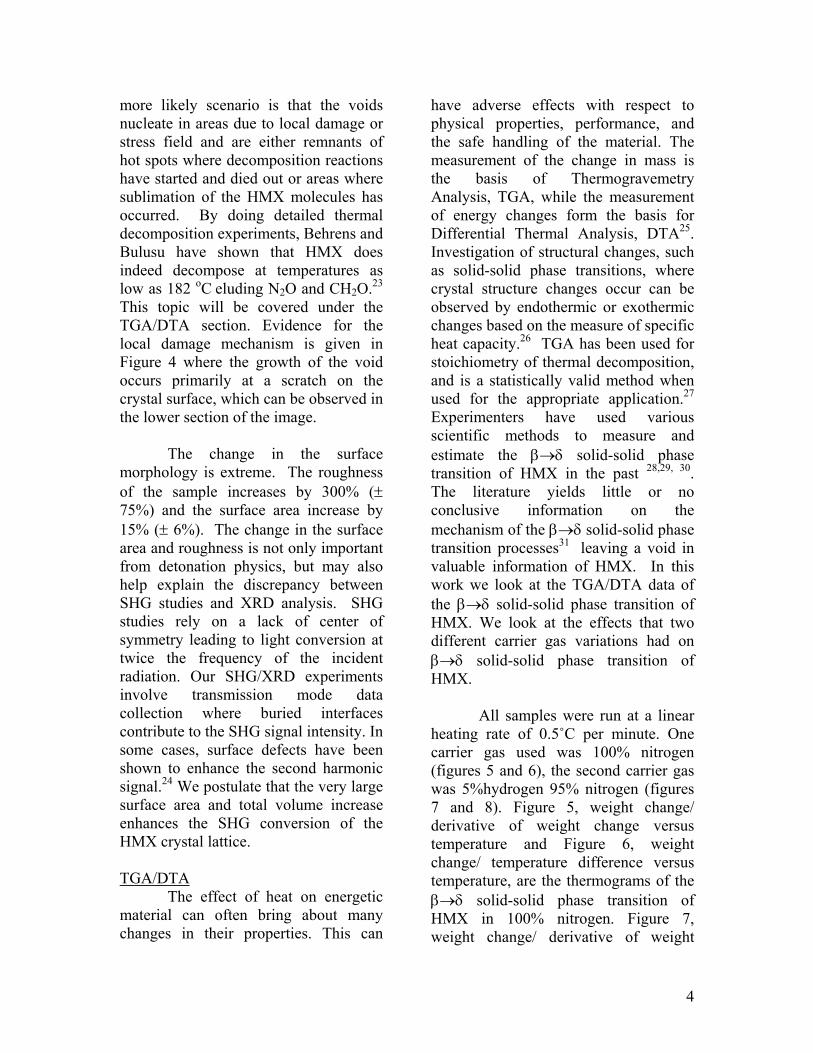
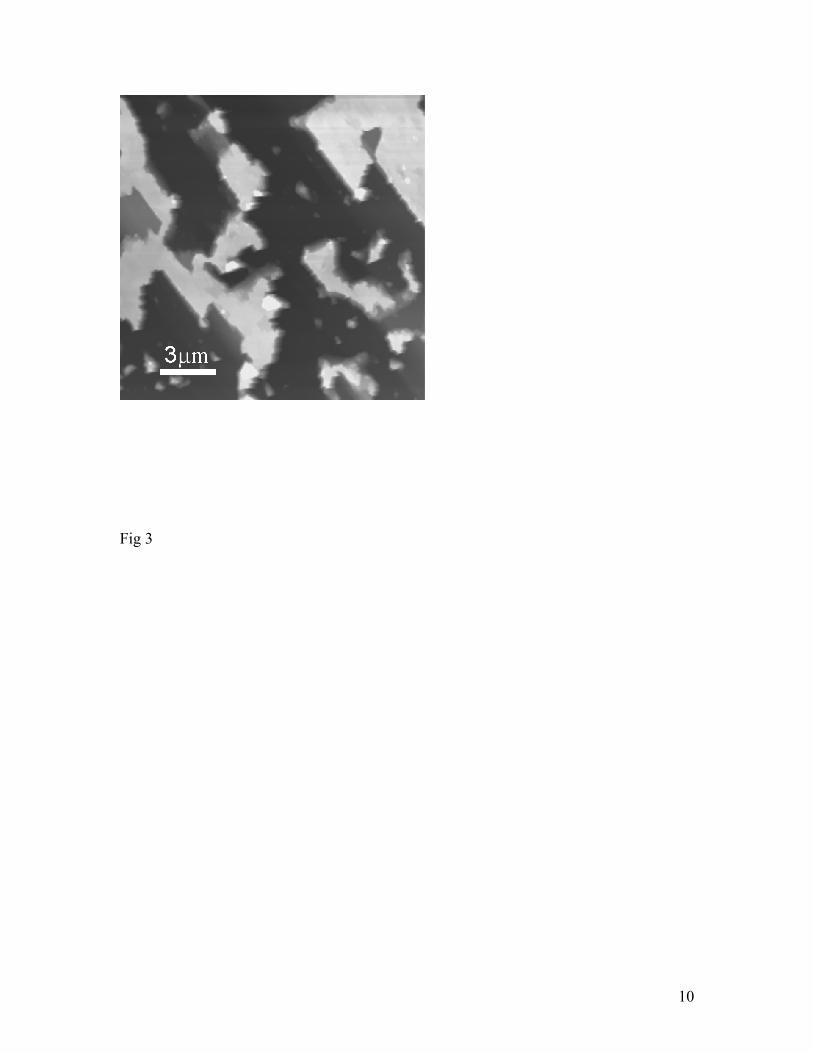
Fig. 2 shows a series of images collected at 184oC. Images are obtained on the (010) face of the monoclinic HMX crystal. The time between each image is indicated along with the rms roughness value. The z-scale is the same in each image (500 nm from black to white). The voids in the surface open, and are orthogonal to the a-axis of the crystal. Also, an increase in the step height (from the bottom of the void to the terrace) of almost 100 % is observed. In this case the step height starts at 363 nm in Fig. 2A and the final value is measured at 667 nm in Fig 2D. The volume of the all the voids in the images increases from 0.8 µm3 to 7.8 µm3 in the converted HMX. Fig. 3 shows a final image of the converted HMX taken 2 hours from the start of heating at 184oC. The crystal shows massive surface changes. After this point the material is fully converted and no further growth or change in the surface structure is observed
The origin of the voids is not well understood. One plausible explanation is that defects diffuse throughout the crystal, accumulate and grow leading to the voids created. A
4
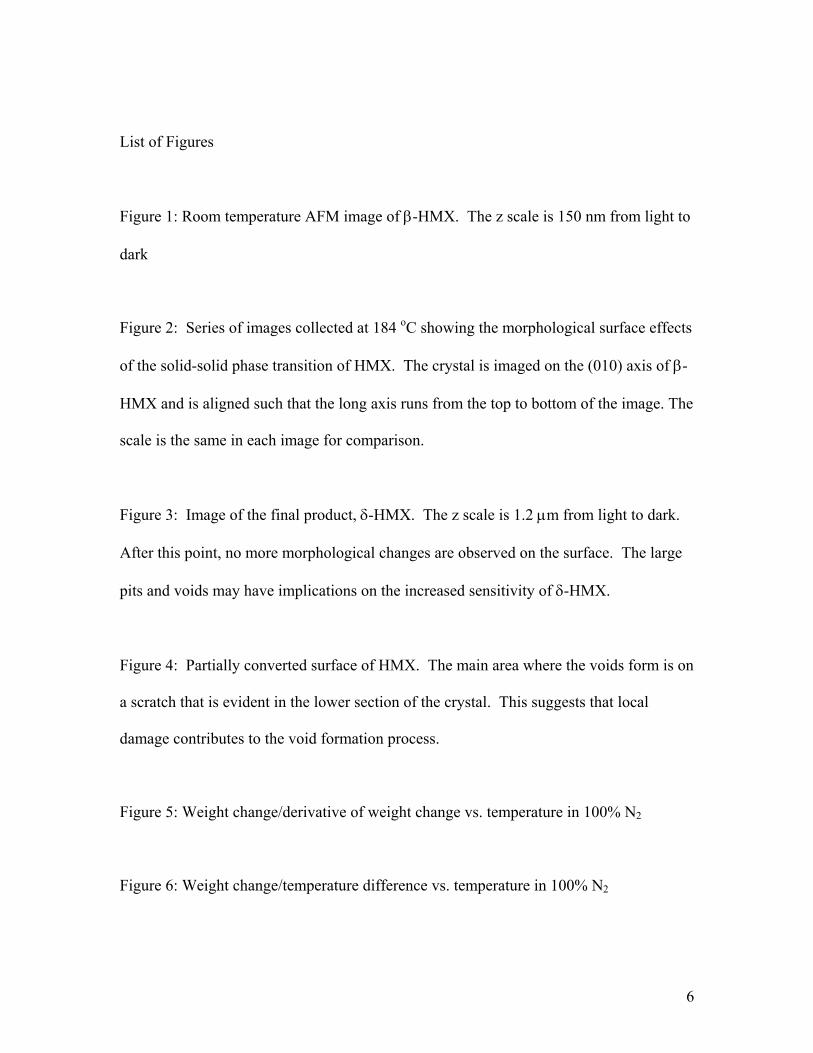
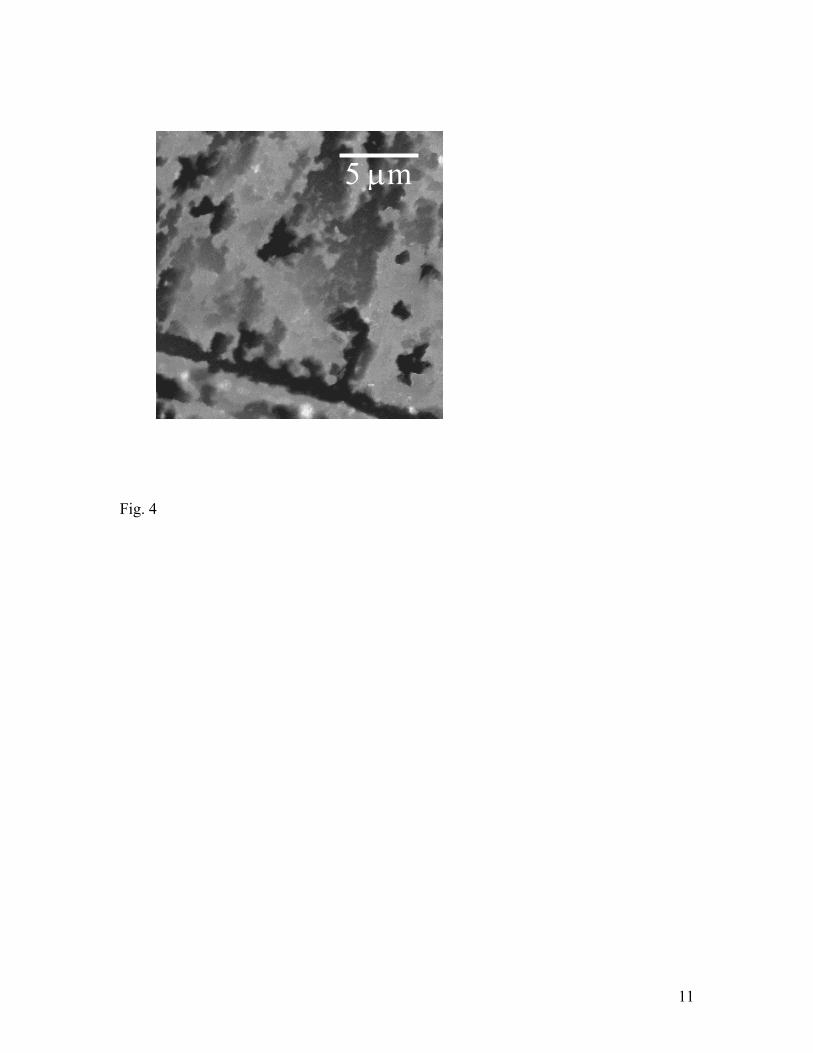
more likely scenario is that the voids nucleate in areas due to local damage or stress field and are either remnants of hot spots where decomposition reactions have started and died out or areas where sublimation of the HMX molecules has occurred. By doing detailed thermal decomposition experiments, Behrens and Bulusu have shown that HMX does indeed decompose at temperatures as low as 182 oC eluding N2O and CH2O.23 This topic will be covered under the TGA/DTA section. Evidence for the local damage mechanism is given in Figure 4 where the growth of the void occurs primarily at a scratch on the crystal surface, which can be observed in the lower section of the image.
The change in the surface morphology is extreme. The roughness of the sample increases by 300% (± 75%) and the surface area increase by 15% (± 6%). The change in the surface area and roughness is not only important from detonation physics, but may also help explain the discrepancy between SHG studies and XRD analysis. SHG studies rely on a lack of center of symmetry leading to light conversion at twice the frequency of the incident radiation. Our SHG/XRD experiments involve transmission mode data collection where buried interfaces contribute to the SHG signal intensity. In some cases, surface defects have been shown to enhance the second harmonic signal.24 We postulate that the very large surface area and total volume increase enhances the SHG conversion of the HMX crystal lattice. TGA/DTA
The effect of heat on energetic material can often bring about many changes in their properties. This can
have adverse effects with respect to physical properties, performance, and the safe handling of the material. The measurement of the change in mass is the basis of Thermogravemetry Analysis, TGA, while the measurement of energy changes form the basis for Differential Thermal Analysis, DTA25. Investigation of structural changes, such as solid-solid phase transitions, where crystal structure changes occur can be observed by endothermic or exothermic changes based on the measure of specific heat capacity.26 TGA has been used for stoichiometry of thermal decomposition, and is a statistically valid method when used for the appropriate application.27 Experimenters have used various scientific methods to measure and estimate the β→δ solid-solid phase transition of HMX in the past 28,29, 30. The literature yields little or no conclusive information on the mechanism of the β→δ solid-solid phase transition processes31 leaving a void in valuable information of HMX. In this work we look at the TGA/DTA data of the β→δ solid-solid phase transition of HMX. We look at the effects that two different carrier gas variations had on β→δ solid-solid phase transition of HMX.
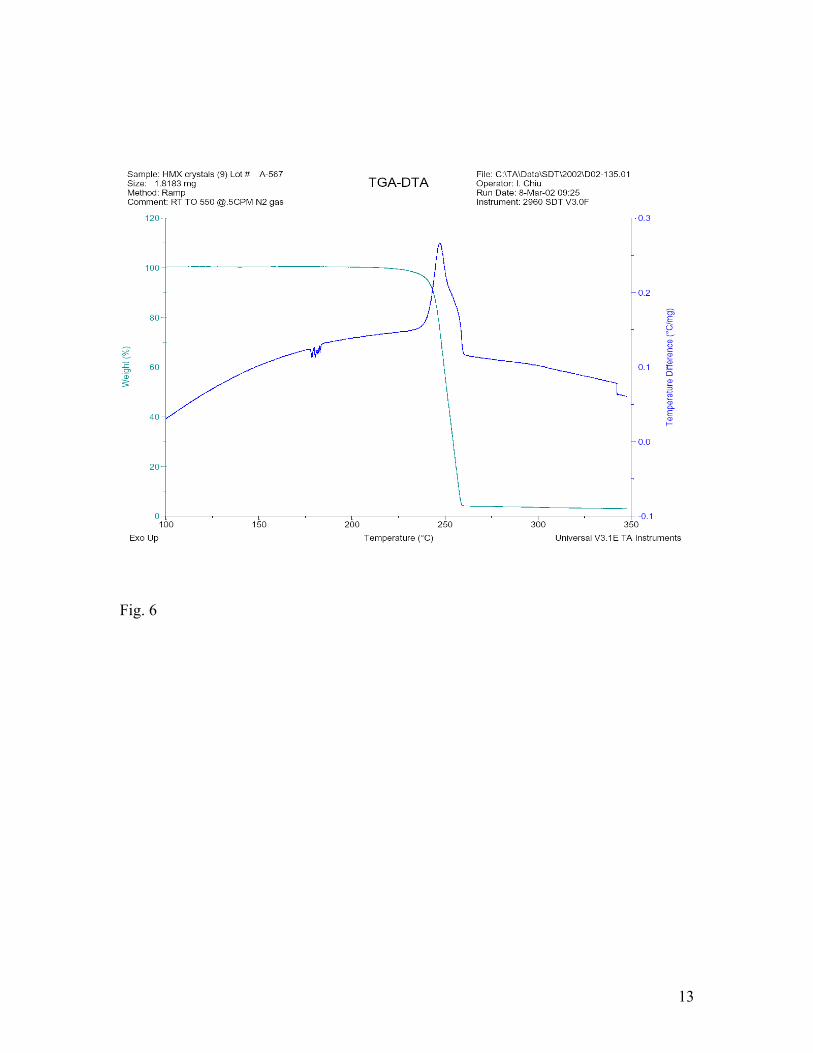
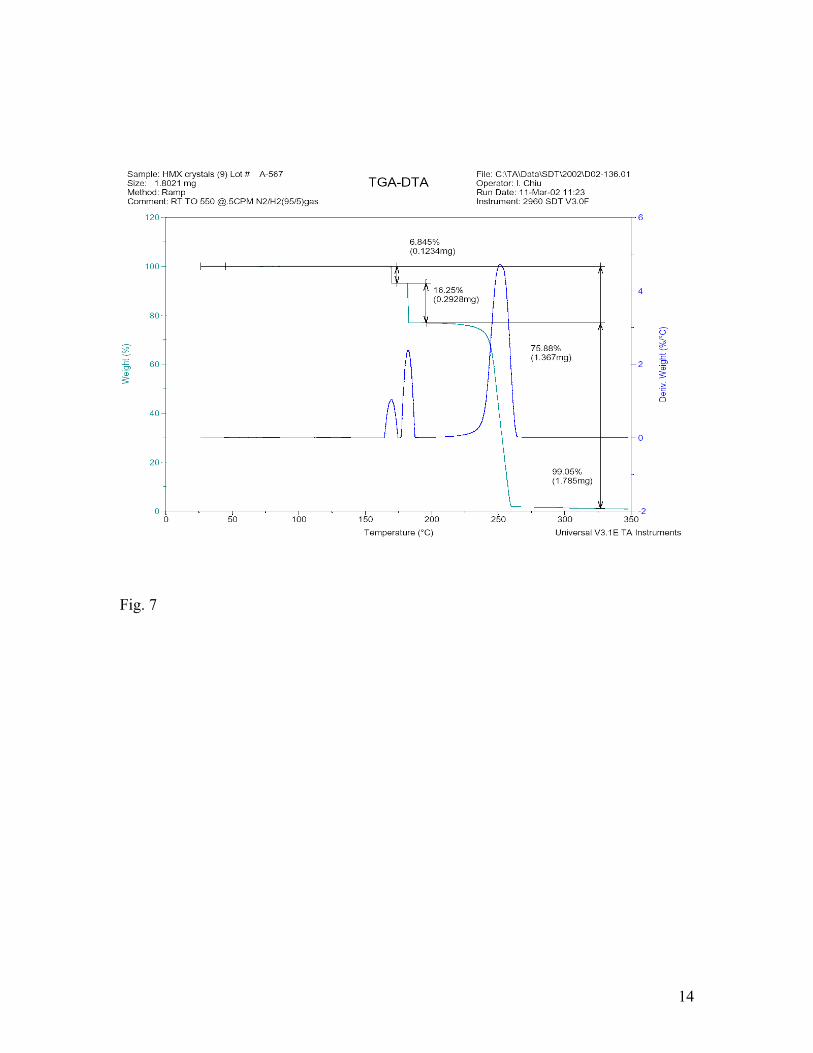
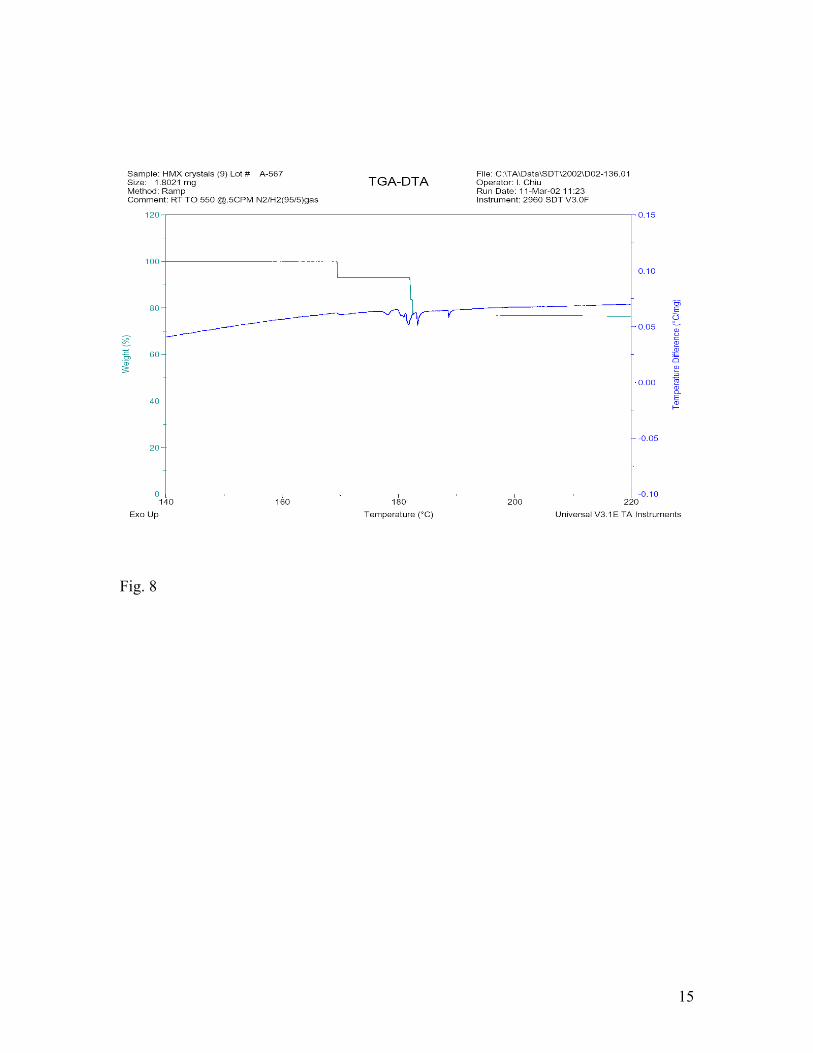
All samples were run at a linear heating rate of 0.5˚C per minute. One carrier gas used was 100% nitrogen (figures 5 and 6), the second carrier gas was 5%hydrogen 95% nitrogen (figures 7 and 8). Figure 5, weight change/ derivative of weight change versus temperature and Figure 6, weight change/ temperature difference versus temperature, are the thermograms of the β→δ solid-solid phase transition of HMX in 100% nitrogen. Figure 7, weight change/ derivative of weight

5
change versus temperature and Figure 8 , weight change/ temperature difference versus temperature, are the thermograms of the β→δ solid-solid phase transition of HMX in 5% hydrogen and 95% nitrogen.
Typically the β→δ soild-solid phase transition of HMX is observed between 150˚C and 200˚C.26 We do not observe a well-defined weight change in this region in figure 5 and 6. Figure 7 and 8, weight change versus temperature, are the thermograms of the β→δ solid-solid phase transition of HMX in 5% hydrogen 95% nitrogen, we do observe a weight change in the β→δ solid-solid phase transition of HMX between 150˚C and 200˚C.
The mass loss over the temperature range of 150˚C to 200˚C shown in figures 7 and 8 is approximately 23%. The observed differences in the thermograms (5 and 6 versus 7 and 8) may show that the hydrogen gas is able to diffuse through the HMX crystal lattice. This diffusion then may permit a reaction to take place between the -NO2 groups, or bonds that have become reactive and react with the available hydrogen. The products are then swept away by the carrier gas resulting in the observed weight change31.
Figure 8 (5%H2 95% N2) is an expanded view of the solid-solid phase transition area at approximately 150˚C to 200˚C. We clearly observe weight loss at the β→δ solid-solid phase transition temperature of HMX. This thermogram shows the simultaneously observed weight change and the heat flow (change in specific heat capacity31). Figure 6 is analogous to figure 8, however, no
obvious weight change is observed between 150˚C and 200˚C. Conclusion
Detonation theory suggests that ‘hot spots’ contribute to the decomposition process.31 Once formed these hot spots either fail to react chemically due to thermal diffusion or react exothermically thus creating an ignition site in the solid explosive. These ignition sites then grow in temperature, size, and pressure leading to a deflagration or detonation depending on the physical and chemical properties of the material. Our AFM images show that the bulk void volume of HMX dramatically increases during conversion to the δ−phase. These observations may help explain the increased sensitivity of HMX, which has been correlated directly with void space volume.
The mechanism of the β→δ solid-solid phase transition of HMX is complex and is not well understood. The notion that decomposition of ring substituents is taking place during the β→δ solid-solid phase transition still has not been proven. This is clearly a question that must be answered. Acknowledgements
This work performed under the auspices of the U.S. Department of Energy by the Lawrence Livermore National Laboratory under contract number W-7405-Eng-48. The authors thank Louisa Hope-Weeks (LLNL) for providing β-HMX single crystals used in this study.
6
List of Figures
Figure 1: Room temperature AFM image of β-HMX. The z scale is 150 nm from light to
dark
Figure 2: Series of images collected at 184 oC showing the morphological surface effects
of the solid-solid phase transition of HMX. The crystal is imaged on the (010) axis of β-
HMX and is aligned such that the long axis runs from the top to bottom of the image. The
scale is the same in each image for comparison.
Figure 3: Image of the final product, δ-HMX. The z scale is 1.2 µm from light to dark.
After this point, no more morphological changes are observed on the surface. The large
pits and voids may have implications on the increased sensitivity of δ-HMX.
Figure 4: Partially converted surface of HMX. The main area where the voids form is on
a scratch that is evident in the lower section of the crystal. This suggests that local
damage contributes to the void formation process.
Figure 5: Weight change/derivative of weight change vs. temperature in 100% N2
Figure 6: Weight change/temperature difference vs. temperature in 100% N2

7
Figure 7: Weight change/ derivative of weight change vs. temperature in 5% H2 95% N2
Figure 8: Weight change/ temperature difference vs. temperature in 5% H2 95% N2

8
Fig. 1

9
Fig. 2
10
Fig 3
11
Fig. 4
5 µm

12
Fig. 5
13
Fig. 6
14
Fig. 7
15
Fig. 8
16
1 H.H. Cady, A.C. Larson, and D.T. Cromer, Acta Crystallogr. 16 (1963) 617
2 R.E. Cobbledick and R.W.H. Small, Acta Crystallogr., Sect. B 30 (1974) 1918
3 P. Main, R.E. Cobbledick, and R.W.H. Small, Acta Crystallogr., Sect. C: Cryst. Struc.
Commun. 41 (1985)1351
4 A.G. Landers and T.B. Brill, J. Phys. Chem. 84, (1980) 3573
5 M. Herrmann, W. Engel, and N. Eisenreich, Propellants, Explos., Pyrotech. 17 (1992)
190
6 R.J. Karpowicz, L.S. Gelfand, and T.B. Brill, AIAA J. 21 (1983) 310
7 S.J.P. Palmer and J.E. Field, Proc. R. Soc. Lond. A 383 (1982) 399
8 C.S. Yoo and H. Cynn, J. Chem. Phys. 111 (1999) 10229
9 B.F. Henson, B.W. Asay, R.K. Sander, S.F. Son, J.M. Robinson, and P.M. Dickson,
Phys. Rev. Lett. 82 (1999) 1213
10 C.O. Leiber, Propellants, Explos., Pyrotech. 25 (2000) 288
11 J.M. Zaug, D.L. Farber, C.K. Saw, M. Hoffman, C.M. Ruddle, and C. Borro, to be
published.
12 Y. R. Shen, Nature 337 (1989) 519
13 P. J. Campagnola, Mei-de Wei, A. Lewis, and L. M. Loew, Biophys. J. 77 (1999) 3341
14 G. Binning, C. Quate, Ch. Gerber, Phys. Rev. Lett. 56 (1986) 930
15 C.S. Coffey and J. Sharma, Phys. Rev. B 60 (1999) 9365
16 C.S. Coffey and J. Sharma, J. Appl. Phys. 89 (2001) 4797
17 J. Sharma, R.W. Armstrong, W.L. Elban, C.S. Coffey, and H.W. Sandusky, Appl.
Phys. Lett. 78 (2001) 457
17
18 K.J. Davis, P.M. Dove, and J.J. De Yoreo, Science 290 (2000) 1134
19 M. Wiechmann, O. Enders, C. Zeilinger, and H.A. Kolb, Ultramicroscopy 86 (2001)
159
20 I. Reviakine, W. Bergsma-Schotter, A.N. Morozov, and A. Brisson, Langmuir 17
(2001) 1680
21 Digital Instruments, Veeco Metrology Group, Santa Barbara, CA 93117
22 V.I. Siele, M. Warman, J. Leccacorci, R.W. Hutchinson, R. Motto, E.E. Gilbert, T.M.
Benzinger, M.D. Coburn, R.K. Rohwer, and R.K. Davey, Propell. and Explosiv. 6 (1981)
67
23 R. Behrens and S. Bulusu, Mat. Res. Soc. Symp. Proc. 418 (1996) 119
24 C. Zhang, X. Xiao, N. Wang, K.K. Fung, M.M.T Loy, Z. Chen, and J. Zhou, Appl.
Phys. Lett. 72 (1998) 2072
25 Thermal Methods, Dodd, J.W., and Tonge, K. H., Crown Copyright, 1987
26 Weidemeier, H., Siemers, P., Wunderlich, B., Thermochimica Acta, 27 (1978) 223
27 Thermal analysis for the 21st century, Reading, M., Hourston, D. J., Song, M., Pollock,
H. M., Hammich, A., American Laboratory, January 1998
28 Skvara, F. and Sativa, V., J. Therm. Anal., 2 (1970) 325
29 Shaw, R., J. Phys. Chem., 81 (1977) 2572
30 Brill, T. B., and Reese, C. O., J. Phys. Chem., 84 (1980) 1376
31 Tarver, C., Childester, S. K., and Nichols III, A. L., J. Phys. Chem., 100
(1996) 5794