investigation of select energetic materials by
TRANSCRIPT
1
INVESTIGATION OF SELECT ENERGETIC MATERIALS BY DIFFERENTIAL
REFLECTION SPECTROMETRY
By
ANNA MARIE FULLER
A DISSERTATION PRESENTED TO THE GRADUATE SCHOOL
OF THE UNIVERSITY OF FLORIDA IN PARTIAL FULFILLMENT
OF THE REQUIREMENTS FOR THE DEGREE OF
DOCTOR OF PHILOSOPHY
UNIVERSITY OF FLORIDA
2007

2
© 2007 Anna Marie Fuller

3
To my family and friends; we all got through this together and I could not have done it without
you. I further dedicate this document to my biggest supporter Stephen Tedeschi who walked
with me throughout my research and often carried me.

4
ACKNOWLEDGMENTS
I gratefully acknowledge my advising professor Dr. Rolf E. Hummel. Through his
guidance, he has helped me grow into the best scientist I can be and has inspired me to never
stop learning. I also thank my supervisory committee Dr. Paul Holloway, Dr. Wolfgang
Sigmund, Dr. Anthony Brennan, and Dr. Alex Angerhofer for their intellectual conversations
throughout my research. Dr. Alex Angerhofer allowed me continual access to his UV-Visible
instruments as well as many meaningful conversations. I also acknowledge research group
members past and present especially Thierry Dubroca, Claus Schoellhorn, and Maxime Lemaitre
for their valuable contributions to my research. Bryce Devine, Dr. Hai-Ping Cheng, and her
student Sabri Alkis assisted in the DFT modeling for the reported research and their contribution
is acknowledged. I acknowledge Dr. Kevin Powers and the Particle Engineering Research
Center for allowing me use of their molecular modeling program. Dr. Jodie Johnson at the mass
spectrometry lab in chemistry performed the chemical analysis of samples in the research as well
as explained the results to me for which I am thankful. In addition, I thank my friends and
fellow students for their support. And finally I acknowledge the enormous love and support
given by my family. I would have never made it without them.
5
TABLE OF CONTENTS
page
ACKNOWLEDGMENTS ...............................................................................................................4
LIST OF TABLES ...........................................................................................................................8
LIST OF FIGURES .........................................................................................................................9
ABSTRACT ...................................................................................................................................17
CHAPTER
1 INTRODUCTION ..................................................................................................................19
1.1 Introduction to the Presented Research ............................................................................19
1.1.1 Current Detection Techniques ................................................................................19
1.1.2 Novel Detection Method: Differential Reflection Spectrometry ...........................20
1.2 Proposed Detection Techniques for Energetic Materials .................................................21
1.2.1 General Techniques ................................................................................................21
1.2.2 Optical Techniques .................................................................................................24
1.3 Concentration of the Presented Research .........................................................................28
1.4 Summary ...........................................................................................................................29
2 BACKGROUND INFORMATION FOR ENERGETIC MATERIALS ...............................31
2.1 Characteristics of Energetic Materials ..............................................................................32
2.2 Chemistry of Energetic Materials .....................................................................................33
2.2.1 TNT ........................................................................................................................36
2.2.2 RDX ........................................................................................................................39
2.2.3 HMX .......................................................................................................................41
2.2.4 Tetryl ......................................................................................................................43
2.2.5 PETN ......................................................................................................................45
2.2.6 Nitroglycerine .........................................................................................................46
2.3 Optical Properties of Energetic Materials .........................................................................47
2.3.1 Ultraviolet and Visible Range (180-750nm) ..........................................................47
2.3.2 Infrared Properties (0.750-1000 μm) ......................................................................50
2.3.2.1 Fourier Transform Infrared Spectroscopy ....................................................51
2.3.2.2 Raman Spectroscopy ....................................................................................52
2.4 Summary ...........................................................................................................................53
3 ELECTRONIC THEORY OF ENERGETIC MATERIALS .................................................54
3.1 Electronic Structure of Explosives ...................................................................................54
3.2 Photon Interactions ...........................................................................................................56
3.3 Summary ...........................................................................................................................58

6
4 EXPERIMENTAL PROCEDURE .........................................................................................59
4.1 Ultraviolet and Visible Techniques ..................................................................................59
4.1.1 Differential Reflection Spectroscopy (DRS) ..........................................................59
4.1.1.1 Instrument .....................................................................................................59
4.1.1.2 Theory and Interpretation .............................................................................61
4.1.1.3 Line Shape analysis ......................................................................................62
4.1.1.4 Sample Preparation and Operating Parameters ............................................64
4.1.2 Ultraviolet-Visible Spectrophotometery ................................................................66
4.1.2.1 Transmission UV-Visible spectrophotometry ..............................................66
4.1.2.2 Reflectance UV-Visible spectrophotometry ................................................67
4.1.2.3 Sample Preparation ......................................................................................67
4.1.3 Infrared Spectroscopy .............................................................................................68
4.2 Chemical and Crystalline Structure Analysis ...................................................................69
4.2.1 High Performance Liquid Chromatography and Mass Spectrometry
(HPLC/MS) ..................................................................................................................69
4.2.2 Differential Scanning Calorimetry (DSC) ..............................................................69
4.2.3 Optical Microscopy ................................................................................................70
4.2.4 Optical Profilometry ...............................................................................................70
4.2.5 Particle Size analysis ..............................................................................................71
4.3 Computational Chemistry .................................................................................................71
5 EXPERIMENTAL RESULTS ...............................................................................................74
5.1 Differential Reflectograms of Energetic Materials ...........................................................74
5.2 Characterization of TNT Purity, Crystal Structure, and Morphology ..............................75
5.3 Behavior of Energetic and Other Materials with a Ring Structure ...................................76
5.4 Mixtures of Several Energetic Materials ..........................................................................77
5.5 Effect of Rotating or Tilting the Sample ..........................................................................77
5.6 Dependence on the Number of Nitro Groups Present ......................................................78
5.7 Comparison of Differential Reflectograms with Results from Other Optical
Techniques ..........................................................................................................................78
5.8 Experiments Leading to Possible Answers for the Observed Transitions ........................81
5.8.1 Experimental Modifications of UV-Visible Transmission Measurements ............81
5.8.2 Exposure of TNT to UV Light ...............................................................................83
5.9 Line Shape Analysis of Differential Reflectograms .........................................................86
6 COMPUTATIONAL CHEMISTRY RESULTS .................................................................126
6.1 Single Isolated Molecule of TNT ...................................................................................126
6.2 One Isolated TNT Molecule from Monoclinic and Orthorhombic Crystals ..................127
6.3 Two Isolated TNT Molecules from the Monoclinic and Orthorhombic Crystals ..........128
6.4 Several (more than two) Molecules Involving Monoclinic and Orthorhombic
Crystals ..............................................................................................................................129
6.5 Entire Molecular Crystals of TNT: Monoclinic and Orthorhombic ...............................129
6.6 Changing the Intermolecular Distance between Pairs of TNT Molecules .....................130
6.7 Modifying the TNT Unit Cell to Yield Defects in the Crystal .......................................133

7
6.8 Other Energetic Materials ...............................................................................................135
6.8.1 RDX ......................................................................................................................135
6.8.2 HMX .....................................................................................................................136
6.8.3 Tetryl ....................................................................................................................137
6.8.4 PETN ....................................................................................................................138
6.8.5 Trinitrotoluene Derivatives: DNT and MNT .......................................................138
6.9 Non-High Explosive Materials (Components of the TNT Molecule) ............................140
7 FURTHER DISCUSSION ....................................................................................................182
7.1 Review of TNT Absorption ............................................................................................182
7.2 Origin of the Long Wavelength Feature .........................................................................183
7.2.1 Solid State Effect? ................................................................................................184
7.2.2 Charge Transfer Self-Complex .............................................................................185
7.2.3 Contribution of the NO2 Groups ...........................................................................186
7.3 Summary .........................................................................................................................189
8 SUMMARY AND CONCLUSIONS ...................................................................................190
9 FUTURE WORK ..................................................................................................................193
9.1 Optical Characterization .................................................................................................193
9.2 Photolysis of Energetic Materials ...................................................................................194
9.3 Computational Chemistry ...............................................................................................194
APPENDIX
A EXTENDED BACKGROUND OF MOLECULAR ORBITAL THEORY ........................196
A.1 Electrons ........................................................................................................................196
A.2 Atomic orbitals ..............................................................................................................196
A.3 Molecular orbitals ..........................................................................................................198
LIST OF REFERENCES .............................................................................................................201
BIOGRAPHICAL SKETCH .......................................................................................................208
8
LIST OF TABLES
Table page
1-1 Summary of current and proposed energetic material detection techniques and their
capabilities. ........................................................................................................................30
2-1 The density and nitrogen percentage of several common energetic materials
including those studied60
. ...................................................................................................34
2-2 The explosive velocities and powers of several common energetic materials63
. ...............36
2-3 Unit cell parameters of crystalline TNT at room temperature65
. .......................................38
2-4 Torsion angles of the NO2 groups in several different conformations of the TNT
molecule. ............................................................................................................................39
2-5 Unit cell parameters for the RDX molecular crystal at room temperature71
. ....................40
2-6 Unit cell parameters for the beta HMX molecular crystal at room temperature74
. ............43
2-7 Unit cell parameters for the Tetryl molecular crystal at room temperature75
. ...................44
2-8 Unit cell parameters of the PETN molecular crystal at room temperature76
. ....................45
2-9 Ultraviolet absorption maxima for TNT, RDX, HMX, and PETN as reported in the
literature. ............................................................................................................................50
5-1 Polarities of the solvent used in UV-Visible transmission spectrophotometry. ..............125
5-2 Electron transitions of various energetic materials determined by the graphical line
shape analysis of the differential reflectograms...............................................................125
9
LIST OF FIGURES
Figure page
2-1 Potential energy diagram demonstrating the activation energy (Ea) and reaction
energy (Er) of a molecule. ..................................................................................................33
2-2 Molecular compositional structures of several common energetic materials. ...................34
2-3 Characterization of the explosives investigated by chemical and explosive
properties5. .........................................................................................................................35
2-4 The molecular structure and molecular crystals of TNT present at room temperature. ....37
2-5 Trinitrotoluene molecules in conformation A and B from the monoclinic molecular
crystal superimposed on one another.. ...............................................................................39
2-7 The RDX molecular structure and crystal structure stable at room temperature. ............40
2-8 The molecular structure and molecular crystal structure of β- HMX that is the stable
crystal structure at room temperature.. ..............................................................................42
2-9 The molecular structure and crystal structure of Tetryl in the stable phase at room
temperature. . ....................................................................................................................44
2-10 The molecular structure and molecular crystal structure of PETN. . ................................46
3-1 Molecular orbital energy diagram of mononitrobenzene (MNB). .....................................55
4-1 Differential reflection spectrometer used in the research. ...............................................60
4-2 Curves representing the function of the photon energy (s) and an optical parameter
(θ) of a material on which the graphical line shape analysis was based97
. ........................63
5-1 Differential reflectogram of a typical solid sample of dehydrated TNT on carbon
tape. ....................................................................................................................................88
5-2 Differential reflectograms of common organic and inorganic materials on carbon
tape compared to TNT .......................................................................................................89
5-3 Differential reflectograms of vegetation from several plants compared to that of
TNT. ..................................................................................................................................90
5-4 Differential reflectograms of several common energetic materials on carbon tape. .........91
5-5 Differential reflectograms of TNT received from several sources including pure
standards and military compositions on carbon tape. ........................................................92
5-6 Differential reflectograms of several commercial explosive materials on carbon tape .....92
10
5-7 Differential reflectograms of TNT on carbon tape, recrystallized independently from
solution with different solvents. .........................................................................................93
5-8 Differential reflectograms of TNT on several different substrates ....................................94
5-9 Chemical analysis results of high pressure liquid chromatography mass spectra for
TNT from a standards company and a military explosive.. ...............................................95
5-10 Differential scanning calorimetry spectrum of TNT, recrystallized from an
acetonitrile solution. ...........................................................................................................96
5-11 Spectrum from x-ray spectrometry of solid TNT recrystallized from an acetonitrile
solution ...............................................................................................................................96
5-12 Optical micrographs of the measured energetic materials at 20X magnification. .............97
5-13 Optical profilometry using false color to indicate height from the base plane (pale
yellow in color) of a solid TNT sample recrystallized from an acetonitrile solution. .......98
5-14 Differential reflectograms of several materials with cyclic or ring molecular
structures on carbon tape. ..................................................................................................98
5-15 Molecular structures of the materials with cyclic molecular structures shown in
Figure 5-12. ........................................................................................................................99
5-16 Differential reflectograms of PETN mixed with TNT (A) and C-4 mixed with TNT
(B) on carbon tape. .............................................................................................................99
5-17 Differential reflectograms of a solid TNT sample, on carbon tape, at different
rotation angles with respect to the incident light beam....................................................100
5-18 Schematic representation of the tilting of a sample resulting reflection in the
direction of the dotted arrows. .........................................................................................100
5-19 Differential reflectograms of TNT, on carbon tape, at different tilt angles with
respect to the incident light. .............................................................................................101
5-20 Differential reflectograms of solid samples of 2, 4 DNT, 2, 6 DNT, and 1, 3 DNB on
carbon tape. ......................................................................................................................101
5-21 The wavelength of the inflection point of the 400 nm feature for TNT, 2, 4 DNT, 2, 6
DNT, and 1, 3 DNB .........................................................................................................102
5-22 Reflection spectrum of solid TNT on the reflection stage of a Perkin Elmer UV-
Visible spectrophotometer. ..............................................................................................102
5-23 Molar absorbtivity of TNT measured in transmission utilizing an acetonitrile solution
with at a concentration of 3.1 g/L taken with four different spectrophotometers. ...........103

11
5-24 Absorbance spectra of varying concentrations of TNT in acetonitrile solution
measured by a Varian UV-visible spectrophotometer. ....................................................104
5-25 Molar absorbtivity spectra of various energetic materials in solution of equal parts of
ethanol and acetonitrile at concentrations of 1 g/L. .........................................................105
5-26 Molar absorbtivity spectra with varying concentration of the sample in the solution
for (A) RDX, (B) HMX, (C) PETN, and (D) Tetryl. .......................................................106
5-27 Absorbance spectra of separate solutions of 2, 4 DNT, 2, 6 DNT, and 1, 3 DNB in
high 1 g/L (A) and low 0.1 g/L (B) concentrations with equal parts ethanol and
acetonitrile........................................................................................................................107
5-28 Absorbance spectra of separate solutions of 2 MNT, 3 MNT, 4 MNT, and
nitrobenzene with equal parts of ethanol and acetonitrile at a concentration of 1 g/L.. ..107
5-29 Wavelength of the inflection point for the 400 nm feature taken with an UV-Visible
transmission spectophotometer of solutions of TNT, 2, 4 DNT, 2, 6 DNT, 1, 3 DNB,
2 MNT, 3 MNT, 4 MNT, and nitrobenzene with their respective solvents at a
concentration of 1 g/L. .....................................................................................................108
5-30 Molar absorbtivity for varying concentrations of TNT in acetonitrile. ...........................109
5-31 Absorbance intensity versus the concentration of TNT in solution with acetonitrile at
several wavelengths. ........................................................................................................110
5-32 Molar absorbtivity of TNT in solution with several different solvents at the same
concentration. ...................................................................................................................112
5-33 Wavelength of the inflection point of the 420 nm feature for TNT in solution with
several solvents versus the solvent polarity. ....................................................................112
5-34 Differential reflectograms of solid TNT with increasing time of exposure to the
monochromated 200 nm (A) and 250 nm (B) light of a high pressure Xe lamp. ............113
5-35 Differential reflectometry of a solid TNT sample exposed to the sun at increasing
time intervals (A) short term and (B) long term.. ............................................................113
5-36 Spectrum of sunlight behind and in front of a lab window. .............................................114
5-37 Differential reflectograms of solid TNT with increasing time of exposure to the 325
nm line of a defocused HeCd laser. .................................................................................115
5-38 Ratio of the intensity of the normalized differential reflectometry at 380 nm to 450
nm of TNT versus the time of exposure to the 325 nm HeCd laser line. ........................116
5-39 Differential reflectograms of solid TNT that has been irradiated for 16 minutes with
the 325 nm HeCd laser line followed by annealing for various times at 45°C.. ..............117
12
5-40 Ratio of the normalized differential reflection intensity at 380 nm and 450 nm of
TNT that has been irradiated with the 325 nm line of the HeCd laser for 16 minutes ....117
5-41 Differential reflectograms of solid TNT that has not been exposed to a UV laser
versus annealing time at 45°C. ........................................................................................118
5-42 Differential reflectograms of solid TNT with increasing time of exposure to the 457
nm (A) and 488 nm (B) lines of an Ar ion laser. .............................................................118
5-43 Ratio of the normalized differential reflection at 380 and 450 nm of solid TNT
versus increasing time of exposure to the 488 nm line of an Ar ion laser. ......................119
5-44 Fourier transform infrared spectrometry of solid TNT on stainless steel with and
without 16 minutes of exposure to the 325 nm line of a HeCd laser. ..............................120
5-45 Chemical analysis results by high pressure liquid chromatography and mass
spectrometry. ....................................................................................................................120
5-46 Absorption transitions of TNT based on a graphical line shape analysis of the
respective differential reflectogram, that is, of Figure 5-1. .............................................121
5-47 Graphical line shape analysis of the respective differential reflectogram of RDX
(Figure 5-4) revealing the absorption transitions. ............................................................121
5-48 Absorption transitions of PETN based on graphical line shape analysis of the
respective differential reflectogram, that is, of Figure 5-4. .............................................122
5-49 Graphical line shape analysis of the respective differential reflectogram of HMX
(Figure 5-4) giving the absorption transitions. ................................................................122
5-50 Absorption transitions of Tetryl based on graphical line shape analysis of the
respective differential reflectogram, that is, of Figure 5-4. .............................................123
5-51 The absorption transitions of 2, 6 DNT found using graphical line shape analysis of
the respective differential reflectogram that is Figure 5-4. ..............................................123
5-52 Graphical line shape analysis of the respective differential reflectogram of 2, 4 DNT
(Figure 5-4) revealing the absorption transitions. ............................................................124
5-53 Absorption transitions of 1, 3 DNB based on graphical line shape analysis of the
respective differential reflectogram, that is, of Figure 5-4. .............................................124
6-1 Calculated molecular orbital transitions by ZINDO of one isolated TNT molecule. ......141
6-2 Calculated molecular orbital transitions by ZINDO of one TNT molecule based on
monoclinic molecular crystal geometry and optimized using the PM3 method. .............142
13
6-3 A modeled UV-Visible spectrum based on the calculated molecular orbital
transitions by ZINDO for one TNT molecule based on the monoclinic molecular
crystal geometry optimized with the PM3 method. .........................................................143
6-4 One isolated TNT molecule based on the monoclinic molecular crystal geometry and
geometry optimized using the PM3 method with molecular orbitals that participate in
absorption transitions highlighted. ...................................................................................144
6-5 Molecular orbital transitions calculated by ZINDO for one isolated TNT molecule
based on the orthorhombic molecular crystal geometry and optimized using the PM3
method..............................................................................................................................145
6-6 Calculated molecular orbital transitions by time dependent density functional theory
(TDDFT) for one isolated TNT molecule with the geometry optimized.........................146
6-7 The molecular orbital energies versus orbital occupancy for one isolated TNT
molecule calculated by ZINDO and density functional theory (DFT). ...........................147
6-8 Molecular orbital transitions calculated by ZINDO for one isolated TNT molecule
having the A conformation in the monoclinic molecular crystal. ....................................147
6-9 The molecular orbital transitions for one isolated TNT molecule in the A
conformation of the orthorhombic molecular crystal. .....................................................148
6-10 Modeled spectrum of one isolated TNT molecule with the A conformation of the
monoclinic molecular crystal based on the molecular orbital transitions calculated by
ZINDO.. ...........................................................................................................................149
6-11 Molecular orbitals that participate in the MO transitions calculated for one isolated
TNT molecule with the A conformation of the monoclinic molecular crystal ................150
6-12 Calculated molecular orbital transitions by ZINDO of one isolated TNT molecule
having the B conformation of the monoclinic molecular crystal. ....................................151
6-13 Molecular orbital transitions of one isolated TNT molecule in the B conformation of
the orthorhombic molecular crystal calculated by ZINDO. .............................................151
6-14 Calculated molecular orbital transitions of two TNT molecules in both A and B
conformations of the monoclinic molecular crystal as they would appear in the
crystal as a pair in the same plane. ...................................................................................152
6-15 Molecular orbital transitions of two TNT molecules based on the A and B
conformations of the monoclinic molecular crystal and geometry optimized using the
PM3 method calculated by ZINDO. ................................................................................153
6-16 Calculated molecular orbital transitions by ZINDO of two TNT molecules in the
same plan having the A and B conformations of the orthorhombic molecular crystal
as they would appear in the crystal structure. ..................................................................154

14
6-17 Molecular orbital transitions calculated by ZINDO of two TNT molecules based on
the A and B conformations of the orthorhombic molecular crystal and geometry
optimized using the PM3 method. ...................................................................................154
6-18 The molecular orbital transitions of two TNT molecules based on the A and B
conformations of the monoclinic crystal calculated by TDDFT. ....................................155
6-19 The energy of the molecular orbitals versus occupancy of one and two TNT
molecule systems calculated separately by ZINDO and DFT .........................................155
6-20 Summary of the calculated molecular orbital transitions by ZINDO for increasing
numbers of monoclinic conformation A TNT molecules in a system. ............................156
6-21 Wavelength of the longest wavelength (reddest) calculated molecular orbital
transition by ZINDO for increasing numbers of TNT molecules in the B
conformation of the monoclinic molecular crystal ..........................................................157
6-22 Summary of the molecular orbital calculations by ZINDO of increasing numbers of
TNT molecules in the A conformation of the orthorhombic crystal ...............................158
6-23 The longest wavelength (reddest) MO transition calculated by ZINDO with
increasing number of TNT molecules in conformation B of the orthorhombic crystal...159
6-24 Calculated molecular orbital transitions of a unit cell (8 molecules) of the monoclinic
molecular crystal of TNT by ZINDO. .............................................................................160
6-25 Representations of the unit cell of the monoclinic molecular crystal of TNT after
geometry optimization with the PM3 method. ................................................................160
6-26 Molecular orbital transitions calculated by ZINDO of 8 molecules based on the unit
cell of the monoclinic molecular crystal of TNT and geometry optimized using the
PM3 method. ....................................................................................................................161
6-27 Calculated molecular orbital transitions by ZINDO of a TNT unit cell (8 molecules)
of the orthorhombic molecular crystal. ............................................................................161
6-28 Molecular orbital transitions of 8 TNT molecules based on the unit cell of the
orthorhombic molecular crystal and geometry optimized using the PM3 method
calculated by ZINDO. ......................................................................................................162
6-29 Summary of the calculated molecular orbital transitions by ZINDO for two TNT
molecules in the A and B conformation of the monoclinic molecular crystal at
varying intermolecular distances. ....................................................................................163
6-30 Calculated molecular orbital transitions by ZINDO for pairs of TNT molecules in the
A and B conformations of the orthorhombic crystals as they would appear in the
crystal at varying intermolecular distances. .....................................................................164
15
6-31 The longest wavelength (reddest) calculated molecular orbital transition by ZINDO
versus the intermolecular distance of a pair of TNT molecules in the A conformation
(A) and B conformation (B) of the monoclinic crystal. ...................................................164
6-32 Summary of the calculated molecular orbital transitions by ZINDO for pairs of TNT
molecules in the A conformation (A) and B conformation (B) of the orthorhombic
molecular crystal at varying intermolecular distances. ....................................................165
6-33 Molecular orbital transitions for a pair of orthorhombic conformation A TNT
molecules stacked like pancakes at an intermolecular distance of 1.5 Å calculated by
ZINDO. ............................................................................................................................165
6-34 Calculated molecular orbital transitions by ZINDO of the monoclinic unit cell of
TNT with one TNT molecule replaced with a DNT molecule. .......................................166
6-35 Molecular orbital transitions calculated by ZINDO of the monoclinic unit cell of
TNT with a MNT molecule in the place of one TNT molecule. .....................................166
6-36 The calculated molecular orbital transitions by ZINDO of a modified monoclinic
molecular crystal unit cell of TNT where one TNT molecule is replaced with a
toluene molecule ..............................................................................................................167
6-37 Molecular orbital transitions calculated by ZINDO of a unit cell of the monoclinic
molecular crystal of TNT with a benzene molecule replacing one TNT molecule. ........167
6-38 Calculated molecular orbital transitions by ZINDO of a monoclinic molecular crystal
unit cell of TNT where one TNT molecule has been removed leaving a vacancy ..........168
6-39 The molecular orbital transitions for a unit cell of the monoclinic molecular crystal
of TNT where two TNT molecules have been removed leaving a plane vacancy
calculated by ZINDO .......................................................................................................168
6-40 Calculated molecular orbital transitions by ZINDO of the monoclinic molecular
crystal unit cell of TNT where four TNT molecules in the stacking sequence have
been removed and four TNT molecules with orthorhombic molecular crystal
conformations have been inserted creating a stacking fault ............................................169
6-41 Molecular orbital transition calculations by ZINDO of one RDX molecule from the
molecular crystal stable at room temperature ..................................................................170
6-42 The calculated molecular orbital transitions by ZINDO for two RDX molecules as
they would appear in the molecular crystal stable at room temperature ..........................171
6-43 Molecular orbital transitions of one unit cell (8 molecules) of the RDX crystal stable
at room temperature calculated by ZINDO .....................................................................171
6-44 The molecular orbital transitions of a HMX molecule from the molecular crystal that
is stable at room temperature calculated by ZINDO .......................................................172

16
6-45 Calculated molecular orbital transitions by ZINDO for two HMX molecules from the
molecular crystal ..............................................................................................................173
6-46 Molecular orbital transitions for four HMX molecules from the molecular crystal
calculated by ZINDO .......................................................................................................173
6-47 The calculated molecular orbital transitions by ZINDO of one Tetryl molecule from
the molecular crystal stable at room temperature. ...........................................................174
6-48 Molecular orbital transitions calculated by ZINDO for two Tetryl molecules as they
would appear in the molecular crystal. ............................................................................175
6-49 Calculated molecular orbitals transitions by ZINDO of an entire unit cell (eight
molecules) of Tetryl .........................................................................................................175
6-50 The molecular orbital transitions of one PETN molecule as calculated by ZINDO. ......176
6-51 The results of calculating the molecular orbital transitions by ZINDO for a pair of
PETN molecules as they appear in the molecular crystal ................................................177
6-52 Molecular orbital transitions of four PETN molecules as they would appear in the
molecular crystal calculated by ZINDO. .........................................................................177
6-53 The calculated MO transitions by ZINDO of one molecule of 2, 4 DNT (A), 2, 4
DNT with geometry optimization (B), 2, 6 DNT (C), and 2, 6 DNT with geometry
optimization (D). ..............................................................................................................178
6-54 Molecular orbital transitions calculated by ZINDO of one molecule of several low
power explosive materials: 2 MNT (A), 2 MNT with geometry optimization (B), 3
MNT (C), 3 MNT with geometry optimization (D), 4 MNT (E), and 4 MNT with
geometry optimization (F). ..............................................................................................179
6-55 The results of the calculated molecular orbital transition by ZINDO of one molecule
of toluene (A), toluene with geometry optimization (B), benzene (C), and benzene
with geometry optimization (D).......................................................................................180
6-56 Calculated molecular orbital transitions by ZINDO of derivatives of the TNT
molecules as they would appear in the molecule: the nitro group (A) and the
methylene group (B) and after geometry optimization of the nitro group (C) and the
methylene group (D). .......................................................................................................181
A-1 Simplified molecular orbital energy diagram for the combination of two 2p atomic
orbitals93
. ..........................................................................................................................200
17
Abstract of Dissertation Presented to the Graduate School
of the University of Florida in Partial Fulfillment of the
Requirements for the Degree of Doctor of Philosophy
INVESTIGATION OF SELECT ENERGETIC MATERIALS BY DIFFERENTIAL
REFLECTION SPECTROMETRY
By
Anna Marie Fuller
August 2007
Chair: Rolf E. Hummel
Major: Materials Science and Engineering
The presence of explosive or energetic materials is prevalent in today’s world. Terrorists
continue to target buildings and mass transit systems with explosive devices. The detection of
these energetic materials is necessary to insure national security and welfare. Detection
techniques such as X-ray scanners, Raman spectroscopy, Terahertz spectroscopy and ion
mobility spectrometry are in current use or development; however, none of these are appropriate
for all necessary applications. These techniques include. The present document provides an
overview of the current detection techniques and describes a new technique for detecting
energetic materials called differential reflection spectrometry (DRS).
DRS essentially measures the optical absorption of energetic materials. The use of DRS
has led to the discovery of previously unreported optical characteristics for some energetic
compounds that are unique to the individual material. These optical characteristics consist of
absorption shoulders between 270 and 420 nm, e.g. near 420 nm for 2, 4, 6 trinitrotoluene
(TNT). In the presented research, the origin of the differential reflection spectra obtained was
investigated using several techniques including UV-Visible spectrophotometry (transmission and
reflection) and computer molecular modeling. Experimental DRS spectra of TNT, hexahydro-
1,3,5 trinitro-1,3,5 triazine (RDX), octahydro 1,3,5,7-tetranitro- 1,3,5,6 tetrazocine (HMX),
18
pentaerythritol tetranitrate (PETN), and 2, 4, 6, n-tetranitro-n-methylaniline (Tetryl) were taken
and analyzed. From the experimental results and verification by molecular modeling, it was
found that the absorption features observed in the redder region of the UV range (270-420 nm)
are due to molecular orbital transitions in the nitro (NO2) groups of the measured explosives.
These transitions only occur in specific conditions, such as high concentration solutions and
solids, where the normally forbidden transitions are allowed.
The unique optical characteristics of the energetic materials presented in this dissertation
are observed only in the solid or relatively high concentrated states suggesting the interaction of
several molecules. Therefore these absorption features are proposed to be due to a charge
transfer self-complex. This phenomenon can be interpreted in the same manner as the
accumulation of atoms and be modeled using quantum mechanics.

19
CHAPTER 1
INTRODUCTION
1.1 Introduction to the Presented Research
The presence of explosive or energetic materials is prevalent in today’s world and has an
impact on our daily lives. Terrorists continue to target buildings and mass transit systems with
explosive devices. In war torn areas, live landmines injure more than 2000 civilians a month1.
Former weapon manufacturing sites typically contain toxic levels of explosive residue within the
soil and surrounding watershed. Detection of these energetic materials is necessary to insure the
security and health of our society.
1.1.1 Current Detection Techniques
There are several detection systems currently employed at airports, sea ports, and for
forensics. Ion mobility spectrometry is currently in use for passenger and carry-on luggage
screening by sampling with air puffers and swabbing. In addition, X-ray scanners check for
unusual (i.e. denser) items in carry-on luggage. A new passenger screening system based on
millimeter wave technology is being tested at a few airports2-4
. The technology detects the
temperature changes from a person (millimeter wave radiation) and boasts improved resolution
compared to current X-ray technology. Color test kits are often used as a field test or in forensic
investigations where certain reagents cause a color change in particular energetic materials
allowing them to be identified5. The sensitivity of these tests can be improved using the
photoluminescence of the colored product6,7
. Also in use are handheld Raman spectrometers that
can chemically identify several different types of chemicals8. Electronic noses have been
developed to imitate the response of a bomb sniffing dog and are being considered for
deployment in Iraq9.

20
All the previously mentioned techniques have advantages and disadvantages for
application to explosive materials detection. Moreover several current detectors require a
sampling technique such that the material of interest must be collected and often processed
before a measurement can occur. This sequence of steps increases measurement time and
reduces the applicability to standoff or contact-less sensing. For example, in order for ion
mobility spectrometry to be effective the energetic material must be removed from a surface and
placed inside the instrument. False positives are also quite common with the ion mobility
scanners especially for nitrate containing fertilizers often found on golf balls and shoes. X-ray
and millimeter wave systems do not detect the energetic material itself but rather an anomaly (an
item with a higher density or lower thermal response) on a person or in a package that also
contributes to false positives. These particular systems also tend to be quite large in size as well
as expensive. The Raman scanner, while compact and portable, needs to be within a few
centimeters of the questionable item in order to detect an energetic material. Other common
techniques are also time consuming and only a small sample of the passengers and luggage
entering an airport terminal is actually surveyed. Many other proposed instruments are not
portable and therefore cannot be readily adapted to several different applications including
standoff detection. All of the previous examples demonstrate the need for a simple, fast,
accurate, portable, and contact-less detection system.
1.1.2 Novel Detection Method: Differential Reflection Spectrometry
The differential reflection spectrometer (DRS), also called a differential reflectometer, was
developed at the University of Florida in 1970 and has the ability to fulfill the above stated
criteria10
. The DRS essentially measures the imaginary part of the dielectric constant of a
material known as the absorption. Characteristic DRS spectra for several common explosives
including 2, 4, 6 trinitrotoluene (TNT), hexahydro-1,3,5 trinitro- 1,3,5 triazine (RDX), octahydro

21
1,3,5,7-tetranitro- 1,3,5,6 tetrazocine (HMX), pentaerythritol (PETN), and 2,4,6, n-tetranitro-n-
methylaniline (Tetryl) have been found in the present research11-15
. The instrumentation is
relatively simple in construction utilizing a white light source, a modulation of the sample area, a
spectrometer, and a detector. Two individual reflectivities are collected from two spots in close
proximity (~2 mm) creating a differential reflection spectrum. Collecting or processing a sample
material is not required and the instrument does not have to be in contact with the suspicious
item; a beam of light can simply be directed at the target area. The differential nature of the
technique yields a high sensitivity which can detect and characterize a trace amount of explosive
(~10 μg/mm2) in a short period of time, on the order of 100 ms.
1.2 Proposed Detection Techniques for Energetic Materials
As science advances there are several new techniques that have been proposed for
detection of energetic materials. Many of these techniques may not be in wide use but they are
worth mentioning. The methods are divided as general chemistry based techniques and optical
techniques.
1.2.1 General Techniques
The development of explosive detection devices has stretched to nearly every part of
science. Many of the techniques that have been proposed are for application in specific
situations. These can be generally divided into several different analytical techniques: vapor and
trace detectors (chemistry derived techniques), bulk explosive detectors, and atmospheric
sensors.
Pure analytical chemistry techniques are used for trace detection in forensics research and
in chemical analysis in research. Liquid chromatography (LC) can be used to identify energetic
materials. Thinlayer, paper, and high-performance (also called high-pressure) represent different
types of LC; all techniques are based on the separation of the chemical compounds into organic

22
molecules and compounds. In LC, the chemical compounds are separated by a mobile solvent
phase that utilizes the mass of the individual molecules and compounds to differentially separate
them. The flow rate of each compound can be calculated using the distance a given spot traveled
from the original spot on the chromatography plate and is used for identification5. Gas
chromatography (GC) is based on the same principle but instead a sample in a vapor state is
injected into a chamber where a mobile carrier gas separates the compounds present in the
sample5. Analytical testing can be performed on the separated compounds by inserting them into
a photoluminescence chamber or mass spectrometry system for LC and GC.
Vapor and trace energetic materials detectors chemically identify the presence of energetic
materials by either coupling a gas chromatographer with an electron capture detector, an ion
mobility spectrometer, or a mass spectrometer. Ion mobility and mass spectrometry are based on
the unique mass of individual ions16
. In ion mobility spectroscopy, an ion is created in a reactor
and then injected by an electric field gate into a drift region. This drift region is composed of a
magnetic field that separates the ions by their mobility, a function of ion mass, that are then
detected by an ion sensitive plate. The time the ion takes to get from the gate to the detector
yields the mobility of the ion; so it can be identified. Nitrate containing energetic materials are
chiefly detected with this technique by the presence of NO2- and NO3- ions. Mass spectrometry
is based on the mass-to-charge ratio of a charged particle. The charged particles are accelerated
through a curved magnetic field mass analyzer, where the radius of the charged particle path is
characteristic for the mass to charge ratio. An ion collector or photographic plate measures the
position of a particle after the mass analyzer, yielding the mass to charge ratio and identifying
the ion where in general to heavier ions have a larger radius17
.
23
The detection of bulk energetic materials, for example in suitcases and cars, has been
proposed to be performed by neutron analysis, nuclear quadrupole resonance, and X-ray
detection. Neutron analysis includes thermal neutron (TNA), fast neutron (FNA), and pulsed
fast/thermal neutron (PFTNA) and is based on the neutron excitation of atoms in energetic
materials. TNA measures the characteristic gamma rays produced by the low-energy neutrons
interacting with the nitrogen in the explosive. In contrast, FNA uses high-energy neutrons in
order to create the gamma rays from the nitrogen. PFTNA uses the same technique but the
neutron generator is pulsed thereby increasing the number of nuclear reactions. Gamma rays
from these reactions are detected, as well as those created by fast and thermal neutrons, and
measured between the neutron generator pulses giving PFTNA a higher selectivity17,18
. Nuclear
quadrupole resonance (NQR) is based on the interaction of radio-frequency energy with
quadrupole energy levels of an atomic nucleus. In the case of energetic materials, the detector
would concentrate on the presence of nitrogen isotopes in the sample, e.g. 14
N for TNT19
.
X-ray detection systems employ the low angle x-ray scattering from a sample in order to
see density profiles inside an object such as a suitcase17
. This is the same concept that is applied
to medical X-ray machines. New X-ray technologies can detect the higher resolution
backscattered X-rays4. This allows lower doses of radiation for detection; though any amount of
ionizing radiation is harmful. However, one determent to this technique is the anatomical detail
produced during passenger screening. These techniques can only detect the presence of an
unexpected object, such as a bomb or firearm, but not the explosive chemical explicitly.
Detection of energetic materials in the atmosphere, as vapors or gases, can be conducted by
immunochemical tests, amperometric gas sensors, and voltammetry sensors. The
immunochemical test involves the reaction of a target compound (the explosive compound) with

24
a specific antibody9,20
. The amperometric gas sensor measures the electrical current in an
electrochemical sample cell positioned between two electrodes at a constant potential. The
presence of explosive decomposition products is indicated by an increase in the current at a
specified potential. The closely related voltammetry sensors measure the potentials (voltage)
corresponding to the peaks in the current that occur in an electrochemical cell when an explosive
is present. The potential intensity at a particular current peak yields the concentration of the
explosive17
.
1.2.2 Optical Techniques
Due to simplicity and potential portability, several optical techniques have also been
proposed for detection of energetic materials. Ultraviolet(UV)-visible range absorption spectra
are widely used for chemical analysis of organic materials in a laboratory21-23
. Techniques that
exploit the absorption of energetic materials in the UV and visible range have been proposed.
Infrared spectroscopy has also been used extensively in characterization of energetic materials by
measuring the resonance of vibrational modes related to individual molecules and specific
functional groups17,24,25
. Detection systems in the terahertz range (30μm-3mm or 0.1 THz-
10THz) for spectroscopy and imaging of energetic materials are also being aggressively
researched. Techniques not directly related to the optical properties of energetic materials use
the reaction of energetic materials with specific assays and subsequent fluorescence or the
detection of the compound’s constituents for detection.
Many energetic materials have absorption in the UV. The optical signals collected in this
range commonly are low in intensity and have high amounts of noise. Several instruments have
been developed incorporating methods to increase the signal strength and accuracy22,26,27
. Todd
et al. demonstrated the use of cavity-ringdown spectroscopy (CRDS) to detect trace explosive
vapors1,20
. CRDS employs a pulsed laser injected into an optical cavity containing the sample

25
gas. After a laser pulse, the radiation in the cavity decays and is measured. The direct
absorption spectrum of the sample gas can then be determined from the decay measurement and
then related to the absorption of known explosives.
The molecular structure of energetic materials often leads to optical quenching properties
and can be used indirectly for their detection7,28-32
. The energetic materials are placed on, or
streamed by, a material that is photoluminescent in the UV or visible range. The intensity of the
luminescence decreases due to quenching indicating the presence of an explosive compound.
This is an indirect optical technique where neither the absorption nor the emission of the
explosive compound is measured. The photoluminescent materials used vary from porous
silicon to selected polymers. One such study utilizes porous Silicon, which has a
photoluminescence with a maximum at approximately 640nm28
. When a piece of porous Si is
exposed to TNT vapor for a period of time, the initial photoluminescence is quenched. Cleaning
of the porous silicon does not restore the original intensity of the photoluminescence therefore
the quenching is attributed to bonding of the TNT to the porous silicon surface. The TNT
molecule donates electrons to the porous silicon which in return reduces the intensity of the
luminescence. The same quenching phenomenon can be observed when TNT is added to pyrene
in solution or a metalloe containing polymer31,32
. Luminescence quenching in these
circumstances was so large that the prior luminescent features were completely eliminated after
TNT was added.
The use of classical infrared range instruments for detection yields a relatively low
signal for solid samples (mentioned above). A method proposed by Stahl and Tilotta uses
Infrared spectroscopy with solid-phase microextraction (SPME) 25
. The explosive compounds

26
are extracted from water onto a silicone polycarbonate copolymer film. The resulting sample is
then examined by infrared spectroscopy to yield quantitative data with increased signal strength.
Raman spectroscopy has also been explored for energetic material detection, as
mentioned in Section 1.18,33-38
. Unfortunately, the Raman Stokes shift has a low intensity and
due to light scattering and can be difficult to resolve in ambient light. The sensitivity of a Raman
instrument can be improved by absorbing the target molecules onto a specially designed surface.
Surface enhanced Raman spectroscopy or (SERRS) is a relatively new technique, adapted for
several classes of energetic materials at varyious wavelengths in the UV, visible, and infrared
ranges39-43
. While SERRS increases the signal strength it also limits the capability for standoff
detection.
The terahertz range of the electromagnetic spectrum may not be strictly considered an
optical range. However, the instrumentation is quite similar to those used in the previously
mentioned techniques so it is described here. The use of terahertz frequency technology can
yield spectral information and imaging for energetic material detection44,45
. Using an electro-
optic or similar terahertz emitter and an appropriate antenna the characteristic spectrum of an
energetic material is obtained46
. For imaging, the THz waves are directed at the object or person
and an image similar to an x-ray image is received47
. The terahertz spectra have a higher
resolution than traditional x-rays spectra, especially for plastics, because materials have more
varied responses (absorption, transmission, or reflection) to terahertz waves. Terahertz radiation
is non-ionizing, so it is safe for biological systems, and can penetrate through several layers of
clothing, although doing so reveals the anatomical detail of the imaged person.
Fluorescence spectroscopy coupled with immunoassay reactions creates an optical sniffer
for the detection of energetic materials9. Energetic materials themselves have not been reported

27
to demonstrate strong fluorescence in the UV to infrared range of the spectrum. Therefore the
fluorescence of other materials must be employed to detect explosive materials. Bakken et al.
employ an array of immunoassay sensors to the distal ends of an optical fiber bundle20
. The
individual fibers in the optical bundle transmit both an incident light to the sensors and the
fluorescence response of the sensors, due to the optical excitation, to the detector. When the
array is in contact with an explosive compound the respective sensors fluoresce creating a pattern
unique to the individual explosive compound.
As demonstrated above, very few explosives have luminescence in the UV and visible
regions. Photofragmentation and laser induced fluorescence (PF-LIF), a new technique, has
been developed that utilizes the luminescence of the smaller molecular components of the
explosive molecules48-55
. Basically high energy photons hit the target molecule and cause bond
disassociation which results in fragmentation of the molecule. A second laser of relatively high
energy excites the electrons of one of the fragmented species to a higher energy level and
subsequent fluorescence occurs at a higher energy or smaller wavelength. For common
explosives like TNT, RDX, and PETN a 227 to 248 nm wavelength can be used for the first
photofragmentation54
. The fragments of interest are the NO2 groups that are in turn fragmented
to vibrationally excited NO fragments and O. The second fragmentation is caused by a photon
with a wavelength of 300 nm or less. A fluorescence wavelength of 193 nm or close to 227 nm
is indicative of the NO fragment. The concentration of NO and therefore of the sampled
explosive can be calculated from the intensity of the fluorescence54
. Due to the high power laser,
this technique damages the surface that is being sampled.
Laser induced breakdown spectrometry is very similar in nature to the PF-LIF
technique described above in that a high energy light source is used to break apart the target

28
molecule56,57
. However, in the case of LIBS, individual atoms are fragmented from the molecule
using a high-power pulsed light source such as a frequency doubled Nd:YAG laser. The
fragmented atoms are in a gas state and the unique light emission from them is detected using the
same wavelength of light as the fragmenting light. These elements have optical emission, in the
form of sharp peaks, at specific wavelengths that are collected with a spectrometer and sent to a
detector. The wavelength of light emission is unique for each element: C at 247 nm, H at 656
nm, N at 746, 821, and 869 nm, and O at 777 and 844 nm57
. The relative intensity of each
element emission peak to the others identifies the original target molecule.
1.3 Concentration of the Presented Research
The work contained in this research began as an investigation of a method to detect
energetic materials. In the process, previously unreported optical properties of some explosive
compounds were measured. Therefore the focus of the research was redirected to determining
the physical origin of the optical properties and why they are seemingly limited to the energetic
materials studied.
The presented optical properties were observed mainly in the solid or relatively high
concentrated solution states. This phenomenon is not uncommon in materials systems. For
example, in order for ferromagnetism to be observed in an alloy containing iron, there is a
defined concentration of iron atoms needed to obtain a positive exchange energy integral58
. A
laser requires the presence of several atoms, in solid state or gas, to cause an electron population
density in the conduction band large enough to stimulate additional electron excitation that in
turn causes lasing. As demonstrated with these examples, the transfiguration of phenomena from
a single atom to several atoms is frequent. In the reported research the optical characteristics of
interest were seen when there was an accumulation of several molecules. The question that

29
remains to be answered is can this phenomenon (the reported optical absorption) be interpreted
in the same manner as the accumulation of atoms and modeled using quantum mechanics?
1.4 Summary
The number of current and proposed energetic material detection techniques is great, but
today there is no one instrument that can detect every explosive material in all applications.
DRS has the potential for rapid standoff detection of small amounts of energetic materials using
their distinct and unique optical absorption. The diverse amount of detection methods is due to
the unique chemistry of this class of materials. Chapter 2 will explore the chemistry and optical
properties of energetic materials.
30
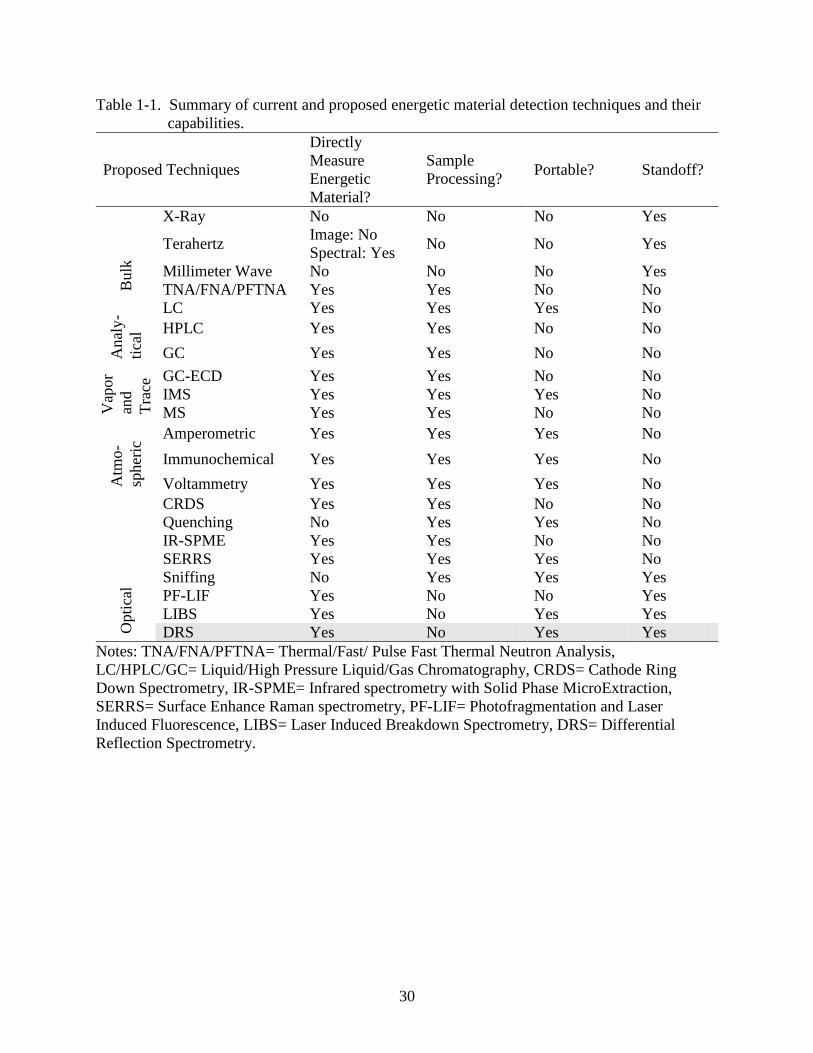
Table 1-1. Summary of current and proposed energetic material detection techniques and their
capabilities.
Proposed Techniques
Directly
Measure
Energetic
Material?
Sample
Processing? Portable? Standoff?
Bulk
X-Ray No No No Yes
Terahertz Image: No
Spectral: Yes No No Yes
Millimeter Wave No No No Yes
TNA/FNA/PFTNA Yes Yes No No
Anal
y-
tica
l
LC Yes Yes Yes No
HPLC Yes Yes No No
GC Yes Yes No No
Vap
or
and
Tra
ce GC-ECD Yes Yes No No
IMS Yes Yes Yes No
MS Yes Yes No No
Atm
o-
spher
ic Amperometric Yes Yes Yes No
Immunochemical Yes Yes Yes No
Voltammetry Yes Yes Yes No
Opti
cal
CRDS Yes Yes No No
Quenching No Yes Yes No
IR-SPME Yes Yes No No
SERRS Yes Yes Yes No
Sniffing No Yes Yes Yes
PF-LIF Yes No No Yes
LIBS Yes No Yes Yes
DRS Yes No Yes Yes
Notes: TNA/FNA/PFTNA= Thermal/Fast/ Pulse Fast Thermal Neutron Analysis,
LC/HPLC/GC= Liquid/High Pressure Liquid/Gas Chromatography, CRDS= Cathode Ring
Down Spectrometry, IR-SPME= Infrared spectrometry with Solid Phase MicroExtraction,
SERRS= Surface Enhance Raman spectrometry, PF-LIF= Photofragmentation and Laser
Induced Fluorescence, LIBS= Laser Induced Breakdown Spectrometry, DRS= Differential
Reflection Spectrometry.
31
CHAPTER 2
BACKGROUND INFORMATION FOR ENERGETIC MATERIALS
The study of energetic materials has fascinated people for many centuries. The first
recorded discovery of explosive material was in 220 BC by Chinese alchemists59
. They
accidentally made blackpowder (sulfur, charcoal, and a nitrate such as KNO3 saltpetre) that
exploded while they were separating gold from silver in a low temperature reaction.
Development of blackpowder continued for several centuries and was the military standard
explosive by the 13th
century, used in civil engineering in the 16th
century, and for mining
beginning in the 17th
. The majority of the common modern explosives such as TNT, RDX,
HMX, picric acid, nitroglycerin, and PETN were not developed until the 19th
century, a very
active period for explosives research. Several explosive materials were refined in process and
stabilization and eventually brought into commercial manufacturing. One of the most famous
was the invention of nitroglycerine. It was first discovered by Italian professor Asciano Sobrero,
but upon finding its explosive properties he ceased his studies. Swedish inventor Immanuel
Nobel took this knowledge, developed a manufacturing process, and opened a small plant in
1863 with his son Alfred. Manufacturing nitroglycerin proved to be a difficult task due to
periodic accidental initiations of the explosive. This resulted in the loss of two manufacturing
plants over three years including one that killed Alfred’s brother Emil. After the second
explosion, Alfred Nobel ceased manufacturing the nitroglycerine and instead concentrated on
stabilizing the explosive. This resulted in the invention of dynamite in 1875. Dynamite is not
made of TNT, a common misconception, rather its chemical composition is actually
nitroglycerine and kieselguhr (an absorber).

32
2.1 Characteristics of Energetic Materials
Explosives are part of a group of materials termed energetic materials16
. This class of
materials receives its name from the large amount of energy that is stored within the molecules
and originates from the molecules’ thermodynamic properties. Every molecule requires a
defined amount of energy in order to form, termed the heat of formation. For energetic
materials, the molecular formation reaction is endothermic, meaning it gains heat or energy from
the exterior environment. The larger the heat of formation, the greater amount of energy is
stored within the molecule. Explosion of a material is caused by the spontaneous release of
energy upon decomposition, called heat of decomposition16
. The heat of decomposition is
simply the energy from the exothermic reaction where the molecule decomposes to smaller
molecules. It is equal in absolute value, but opposite in sign, to the heat of formation if the
molecule decomposes to the same molecules from which it was originally formed. If the
molecule decomposes to different molecules, then the heat of decomposition may be larger or
smaller than the heat of formation.
The heat of reaction is also a description of the chemical reaction that occurs upon
decomposition, which is calculated by subtracting the heat of formation of the reactant from the
heat of formation of the products16
. In order for decomposition to occur, an energetic material
needs to absorb a relatively small amount of energy (in comparison to the heat of decomposition)
from its surroundings, called the activation energy. This is shown by a potential energy curve in
Figure 2-1. The decomposition can be rapid, depending on the material, once the activation
energy is absorbed. Energy is released and heats the products to high temperatures that, in the
case of gas products, causes a very large pressure increase. For example 2, 4, 6, trinitrotoluene
(TNT) has a chemical formula C7H5N3O6. The heat of reaction for an unconfined decomposition
is -144.32 kcal/mol. It produces 10.0 moles of H2, N2, and CO gas from one mole of solid TNT.
33
Pressure increases from 1 atmosphere to 67.95 atmospheres during the decomposition, which
causes an expansion from 137 mL to 224,000 mL of gas or an increase of 16,351%. The total
reaction expends 633 cal/g of heat into the surrounding environment. Using this thermodynamic
information one can see how dramatic an explosion of TNT can be.
Figure 2-1. Potential energy diagram demonstrating the activation energy (Ea) and reaction
energy (Er) of a molecule.
2.2 Chemistry of Energetic Materials
Energy produced in the formation of explosive compounds is stored in the bonds of the
molecule16
. By comparing the structures of several common explosives, one can see in Figure 2-
2 that they all have similar compositions. Of particular importance are multiple bonds (double or
triple bonds) and nitro (NO2) groups which have double bonds between the nitrogen and one of
the oxygen atoms. Due to these bonding characteristics, explosives usually have high densities
as shown in Table 2-1. These characteristics are not just a coincidence, but are due to the largely
endothermic reactions of the individual components (atoms or small molecules) upon formation
of a larger molecule. The orientations of dipoles related to functional groups and resulting bond
angles are also partial contributors to the high energy60
.
Reaction Bond Length
Po
tenti
al E
ner
gy
Transition
State
Products
Reactants
Ea
Er
Reaction Bond Length
Po
tenti
al E
ner
gy
Transition
State
Products
Reactants
Ea
Er
Reaction Coordinate
34
Figure 2-2. Molecular compositional structures of several common energetic materials.
Table 2-1. The density and nitrogen percentage of several common energetic materials including
those studied60
.
Compound Density (g/cm3) %N
TNT 1.654 18.5
RDX 1.82 37.84
HMX (alpha) 1.87 37.83
Tetryl 1.73 24.39
Nitroglycerine 1.591 18.5
PETN 1.76 17.72
Energetic materials can be easily separated into different groups by their physical
properties. In this study they will be simply classified as pure compounds and mixtures. Pure
compounds are further subdivided into primary explosives, high explosives, and non-explosive
ingredients. Types of explosives are grouped by the compounds’ rate of decomposition and
activation energy. A compound with a nearly spontaneous reaction or a highly unstable
compound will be called a primary explosive such as lead azide, Pb(N3)2. These compounds
usually initiate the decomposition of a high explosive. They are highly unstable, due to a small
1, 3, 5, 7-Teteranitro- 1, 3, 5, 7,-
tetraazacyclooctane (HMX)
35
activation energy, and do not release a large amount of energy compared to high explosives, but
the energy released is in the order of magnitude of a high explosive molecule’s activation energy.
An explosive with a larger activation energy is a high explosive like TNT. These compounds
react rapidly, but slower than primary explosives, and release a great amount of energy forming a
large volume of hot gasses. High explosive materials are then divided according to their
molecular composition into nitro compounds (molecules containing nitro groups), nitrate esters
(nitrogen containing derivatives of acids), nitramines (containing two to three alkyl (R) groups
bonded to nitrogen), and salts of inorganic acids as seen in Figure 2-361
. Non-explosive
compounds are those added to an explosive to stabilize or plasticize them making them easier to
form. Common non-explosive additives are diphenylamine (stabilizer) and polyisobutylene
(plasticizer)62
.
Figure 2-3. Characterization of the explosives investigated by chemical and explosive
properties5.
Explosives
Mixtures Pure
Components
Primary HighNon-
explosive
Nitro
Compounds
Nitrate
EstersNitramines
Salts of
Inorganic
Acids
TNT Nitroglycerin
PETNTetryl
RDX
HMX
Explosives
Mixtures Pure
Components
PrimaryPrimary HighHighNon-
explosive
Non-
explosive
Nitro
Compounds
Nitro
Compounds
Nitrate
Esters
Nitrate
EstersNitraminesNitramines
Salts of
Inorganic
Acids
Salts of
Inorganic
Acids
TNT Nitroglycerin
PETNTetryl
RDX
HMX
Ammonium
Nitrate

36
Other explosive materials exist that are not easily categorized as the common explosives
that are studied here. A fairly common homemade explosive is ammonium nitrate with fuel oil
(ANFO)63
. The ammonium nitrate (fertilizer) is a nitrogen containing compound that when
combined with fuel oil (diesel fuel for example), which donates oxygen to the compound, can be
rather explosive. Relatively new energetic materials are liquid explosives like those identified in
the attempt on the Heathrow Airport plot64
. These include triacetone triperoxide (TATP),
hexamethylene triperoxide diamine (HMTD), and triammoniotrinitrobenzene (TATB) and are
quite unstable, see Table 2-2.
Table 2-2. The explosive velocities and powers of several common energetic materials63
.
Explosive Detonation velocity
(m/s)
Specific energy
(kJ/kg)
Explosive power (%)
TNT 6900 870 116
RDX 8750 1394 169
HMX 9100 1387 169
Tetryl 7570 1200 132
PETN 8400 1220 167
TATB 7760 101
Nitroglycerine 7750 1139 170
HMTD 7350 897 100
TATP 4900 104
Picric Acid 7350 987
ANFO 3100/4000 982
2.2.1 TNT
As shown in Figure 2-4 TNT has an aromatic or cyclic molecular structure with one
methyl and three nitro groups spaced around the ring. The aromatic structure is based on a
benzene ring that contains electrons that are delocalized, that is, the molecular orbitals are all
interconnected by the π bonds and the electrons travel freely through all of the orbitals and are
not attached to a particular carbon atom. Methyl and nitro groups are considered substituents
because they replaced a hydrogen atom on the benzene ring and contribute characteristics to the
molecule consistent with their own molecular structure61
. The methyl group is an electron

37
donating group in that it supplies a partial electron to the benzene structure while the nitro groups
are electron withdrawing. The positions of these substituents can vary so that TNT occurs in six
different isomers such as 2, 3, 5-, 3, 4, 5-, and 2, 4, 5- but 2, 4, 6 is the symmetric isomer, the
most commonly used for explosives, and will be referred to as simply TNT62
.
Figure 2-4. The molecular structure and molecular crystals of TNT present at room temperature.
A) The TNT molecule conformation B as it appears in the molecular crystal. B) The
ac or the (101) plane view of the monoclinic crystal unit cell. C) The bc or (011)
plane view of the monoclinic molecular crystal. D) The ac plane view of the
orthorhombic crystal. E) The bc plane view of the orthorhombic molecular crystal.
The atoms in this and the next molecules are colored according to the atom type: gray
is carbon, white is hydrogen, blue is nitrogen, and red is oxygen.
A
B C D E
c
a
c

38
Table 2-3. Unit cell parameters of crystalline TNT at room temperature65
.
Monoclinic Orthorhombic
Space Group Pc21/c Pb21a
No. of Molecules 8 8
a 14.91 15.075
b 6.034 20.024
c 20.881 6.107
α 90 90
β 110.365 90
γ 90 90
TNT is crystalline at room temperature in the form of pale yellow needles59
. The
molecular crystal structure is either monoclinic or orthorhombic where orthorhombic is a meta-
stable crystal phase19,66-68
. The cell parameters and crystal structures are shown in Table 2-3 and
Figure 2-4 respectively. Both molecular crystal structures contain two conformations of the TNT
molecule, A and B. These molecules differ by the degree of torsion of the ortho NO2 groups
outside the plane of the benzene ring, as shown in Figure 2-5 and described in Table 2-4. The
molecules are found in the crystals in a stacking sequence of ABAB in the monoclinic structure
and ABBA in the orthorhombic. A molecular crystal differs from the more common metal
structures in that the molecules occupy lattice positions instead of individual atoms. Similar to
metal crystals, molecular crystals can contain defects such as vacancies, inclusions, and stacking
faults, for example twinning. TNT is usually found as a monoclinic crystal with twinning
defects where an orthorhombic stacking sequence is found within the monoclinic. The
intermolecular bonds in the crystal are non-covalent in nature and are commonly reported as
hydrogen bonding but are not traditional hydrogen bonds68-70
.
TNT is most commonly used as a general explosive. It can be mixed with RDX or
alumina creating different explosive properties. In addition, TNT also increases the explosive
power in improvised or homemade explosives made from ammonium nitrate fuel oil (ANFO)
and an ignition source63
.

39
Table 2-4. Torsion angles of the NO2 groups in several different conformations of the TNT
molecule.
Torsion angle of NO2 group (º)
Molecule Type 2 4 6
Optimized 29.00 0.74 23.57
Monoclinic A 23.00 10.96 20.30
Monoclinic B 17.80 15.90 25.96
Orthorhombic A 23.60 10.92 20.29
Orthorhombic B 25.69 15.56 18.29
Figure 2-5. Trinitrotoluene molecules in conformation A and B from the monoclinic molecular
crystal superimposed on one another. Note the difference in torsion angles of the
NO2 groups for each conformation so that four oxygen atoms appear instead of two.
2.2.2 RDX
RDX (1, 3, 5-Trinitro- 1, 3, 5- triazacyclohexane) also known as hexogen, cyclonite, or the
primary ingredient in C-4 is a heterocyclic nitroamine. As shown in Figure 2-6, the molecule is
composed of a ring of alternating carbon and nitrogen atoms with three substituent nitro groups.
Unlike the aromatic molecular structure of TNT, the carbons in the ring are saturated so that the
electrons are localized to each bonded atom pair61
. RDX is considered a tertiary derivative of the

40
ammonia molecule. This suggests that the chemistry of the molecule is dominated by the
nitrogen atom creating the amine and the electron pair located on that nitrogen atom.
Figure 2-7. The RDX molecular structure and crystal structure stable at room temperature. A)
RDX molecule as it appears in the molecular structure. B) The ab or (101) plane
view of the molecular crystal unit cell. C) The bc or (011) plane view of the unit cell.
D) An off-axis view of the unit cell to demonstrate the eight molecules present in the
unit cell.
Table 2-5. Unit cell parameters for the RDX molecular crystal at room temperature71
.
Space Group Pbca
No. of molecules 8
a 13.182
b 11.574
c 10.709
α 90
β 90
γ 90
A
B C D
41
RDX is a white crystalline solid at room temperature and has an orthorhombic crystal
structure71
. There are eight molecules in the unit cell of the Pbca space group with cell
parameters shown in Table 2-5. The RDX molecule has a chair formation (shaped with the
center of the molecular ring flat and the top and bottom of the ring extended in the upward and
downward direction so it appears like a chair) with the nitro groups extending out of the plane of
the chair as seen in Figure 2-6. RDX has been shown to have significant amounts of molecular
defects in the form of vacancies which cause dislocations and dislocation pile-ups in the
crystal72,73
.
RDX is most commonly known as a component in C-4, a plastic explosive. C-4 is
moldable and easily formed into improvised explosive devices. RDX is also often mixed with
TNT and desensitizers to make Composition B or without the desensitizers forming cyclotol5.
2.2.3 HMX
HMX (1, 3, 5, 7-tetranitro-1, 3, 5, 7-tetraazacyclooctane) was originally discovered as a
by-product of the manufacturing of RDX74
. As seen in Figure 2-7, the molecule is composed of
an eight sided ring of alternating nitrogen and carbon atoms. Each carbon has two hydrogen
molecules bonded outside the ring and each nitrogen atom is bonded to a nitro group. Similar to
RDX the cyclic structure is saturated so all electrons in the ring are localized61
. HMX is also
considered to be a tertiary derivative of ammonia.
There are four polymorphs or related crystal structures known for HMX74
. The beta form
is stable at room temperature with a monoclinic crystal structure having 2 molecules in the unit
cell. The space group is P21/c with the cell parameters given in Table 2-6. In the molecular
crystal, the HMX molecule is a puckered ring (alternating atoms either above or below the ring
plane) with the nitro groups placed in varying directions off of the ring. Research has shown that

42
relatively small intermolecular distances exist between molecules which make intermolecular
hydrogen bonds of the form C-H···O74
.
Figure 2-8. The molecular structure and molecular crystal structure of β- HMX that is the stable
crystal structure at room temperature. A) The individual β- HMX molecule in the
conformation seen in the crystal. B) The bc or (011) plane view of the molecular
crystal unit cell. C) The ab or (110) plane view of the molecular crystal unit cell.
HMX is a high molecular weight, very powerful, and relatively insensitive high explosive.
It is used almost exclusively in military applications including as a detonator in nuclear weapons
b
c a
A
B C

43
and in the moldable plastic form as solid rocket propellant. It is combined with TNT to make a
mixture called octol5.
Table 2-6. Unit cell parameters for the beta HMX molecular crystal at room temperature74
.
Space Group P21/c
No. of molecules 4
a 6.54
b 11.05
c 8.70
α 90
β 124.3
γ 90
2.2.4 Tetryl
Tetryl (2, 4, 6, N-tetranitro-N- methylaniline) is the most closely related explosive to TNT
of the studied explosives. It is composed of an aromatic carbon ring so that all the ring
molecular orbitals are delocalized. There are three nitro groups substituted on the benzene ring
and nitrogen atom bonded to another nitro group and a methyl group as seen in Figure 2-8. Even
though Tetryl has an aromatic structure it is still considered a nitramine due to the three bonds on
the first nitrogen.
Tetryl is seen as light yellow crystals at room temperature often appearing as needles63
. It
has a monoclinic crystal structure of space group P21/c like beta HMX75
. The other cell
parameters are outlined in Table 2-7. The Tetryl molecule, in the molecular crystal, is stacked
offset to the surrounding molecules as seen in Figure 2-8. The nitro groups are non-planar with
the benzene ring. This is suspected to be due to the formation of an intermolecular hydrogen
bond between the hydrogen bonded to a ring carbon and the oxygen atom of the nitroamine75
.

44
Figure 2-9. The molecular structure and crystal structure of Tetryl in the stable phase at room
temperature. A) The Tetryl molecule in the conformation seen in the crystal phase.
B) The ac or (101) plane view or the molecular crystal unit cell. C) The bc or (011)
plane view of the unit cell.
Table 2-7. Unit cell parameters for the Tetryl molecular crystal at room temperature75
.
Space Group P21/c
No. of Molecules 4
a 14.129
b 7.374
c 10.614
α 90
β 95.07
γ 90
A
B C
45
Tetryl is a fairly sensitive medium explosive velocity material as demonstrated in Table 2-
2. It is used primarily alone in detonators and explosive booster charges. At one time it was
combined with TNT to create tetrytol that was used in landmines5.
2.2.5 PETN
PETN (1, 3-dinitrato- 2, 2-bis(nitromethyl)propane) also known as pentaerythritol
tetranitrate is the most unstable of the studied explosives. As shown in Figure 2-9, PETN has a
unique molecular structure. There is one central carbon atom that forms four bonds to separate
methylene groups. Each methylene group is also bonded to an oxygen atom that is then bonded
to a nitro group. PETN is considered an ester of a tetrahydroxylic alcohol where the –OH group
of tetrahydroxylic alcohol was replaced by the nitro group. They are characterized by
participating in hydrogen bonding as acceptors but cannot hydrogen bond to each other because
they have little ability to act as hydrogen bond donors5,61
.
Table 2-8. Unit cell parameters of the PETN molecular crystal at room temperature76
.
Space Group P-421c
No. of Molecules 4
a 9.380
b 9.380
c 6.710
α 90
β 90
γ 90
A white or colorless crystal at room temperature, PETN is commonly used in detonation
cords63
. It has a tetragonal crystal structure with a P-421c space group including two molecules
per unit cell; see Table 2-8 for other cell parameters76,77
. The PETN molecule in the crystal
appears so that each nitro group makes the corner of a square. As shown in Figure 2-9 the carbon
atoms from the methyl groups are not in the same plane to each other. Research has shown that
PETN is prone to edge dislocations and general dislocation planes due to the inherent slip plane
in the crystal structure78
.

46
Figure 2-10. The molecular structure and molecular crystal structure of PETN. A) The PETN
molecule conformation as it appears in the crystal. B) The ab or (110) plane view of
the molecular crystal. C) The bc or (011) plane view of the molecular crystal.
2.2.6 Nitroglycerine
Nitroglycerine, also called glycerol trinitrate, is a nitrate ester similar to RDX and HMX62
.
It is made from the nitration of pure glycerine resulting in the molecule shown in Figure 2-2,
which is a branched linear chain of three carbons with H2ONO2 attached to the end carbons and
HONO2 to the center carbon. This is unlike the other nitrate esters studied which are cyclic.
Nitroglycerine is a yellow or cream colored oil at room temperature with a fairly high vapor
A
B C

47
pressure63
. Therefore there is little information on the crystal structure or intermolecular bonding
in the solid state, although a great amount of research has been performed concerning the
medicinal uses of nitroglycerine.
Nitroglycerin is the primary component of dynamite and the major component of
gelatinous industrial explosives. It is relatively stable but incredibly sensitive to shock. There
are actually three types of dynamite: Nobel’s, straight, and gelatin62
. The components of Nobel’s
dynamite have been described at the beginning of Chapter 2 while the straight and gelatin both
contain nitroglycerin, sodium nitrate, a carbon based combustible material such as wood, and
antacid (CaCO3). Gelatin dynamite contains nitrocellulose that is bonded to the nitroglycerine
making a gelatin.
2.3 Optical Properties of Energetic Materials
It is shown in Section 2.2 that energetic materials have interesting chemical compositions
and properties. This also yields intriguing optical properties for the materials studied. The
optical properties of energetic materials have been studied in nearly all areas of the
electromagnetic spectrum. These studies have been mostly used for the characterization and
research of explosive compounds and not necessarily for detection. A thorough investigation of
these prior studies contributes a large knowledge base for the research.
2.3.1 Ultraviolet and Visible Range (180-750nm)
The ultraviolet (UV) region of the electromagnetic spectrum is commonly defined from
180 nm to 400 nm and the visible region from 400 nm to 750 nm62
. These two regions are often
measured together due to the availability of detectors and light sources that can accommodate
both regions. The energy of electromagnetic radiation in this range is in the order of the band
gaps or difference in energy levels in materials. Therefore, several spectroscopy techniques in
this region are based on the absorption of the electromagnetic radiation by a material79
. This

48
absorption is caused by an energy transfer from the incident photon (electromagnetic radiation)
to an electron in the sample causing the electron to move to an unoccupied, higher energy state.
This phenomenon will be discussed in greater detail in Chapter 3. A spectrometer of this type
uses an UV-Visible light source such as a Xe, Hg, or a Deuterium lamp2. The light source may
also be coupled with a stronger visible spectrum emitter for example a tungsten halogen lamp
that emits predominantly the red part of the spectrum. In a commonly used spectrometer, the
UV-Visible light beam is split into two equal parts prior to the sample chamber. One light beam
is directed through the sample in while the other light beam does not and is used as a reference
beam. A detector on the other side of the spectrometer from the light source records the
transmittance of the light through the sample and compares that to the reference light beam. The
data is usually analyzed using the Beer-Lambert law (Equation 2-1) which states that the
absorbance, A, of a material is dependant on the concentration of the absorbing species in the
sample, c, and the path length through the sample, ℓ,
cA (2-1)
where ε is the molar extinction coefficient62
. Most spectra are displayed as the molar extinction
coefficient or transmittance versus the wavelength. The samples used are generally solutions of
the desired material in a solvent such as 95% ethanol (5% water), acetonitrile, or acetone. When
a solution is used the solvent is placed in front of the reference beam to subtract the absorption of
the solvent from that of the sample solution. This being said the solvent may have an effect on
the absorption of the sample due to interactions between the sample and solvent or its absorption
characteristics. An educated choice of solvents is necessary to reduce the interactions as much as
possible79
.

49
TNT, RDX, HMX, Tetryl, PETN and Nitroglycerine are defined as organic molecules and
have certain characteristics in the ultraviolet (UV) and possibly the visible region. These
characteristics are due to the bonding in the organic molecules79,80
. The absorption spectra of
materials usually contain broad peaks due to the vibrational and rotational states in the molecules
that superimpose on the electron transitions and broaden them.
Due the great amount of information available, UV-visible spectrophotometry has been
used for the chemical analysis of explosive materials. A study by Schroeder and colleagues
investigated the UV absorption of several different explosives21
. The samples were in solutions
of ethyl alcohol of various concentrations. Cyclic nitro-based explosives namely TNT, RDX,
HMX, and Tetryl demonstrated absorption maxima from 213 nm to 229 nm as shown in Table 2-
8. PETN and NG were also measured but they did not demonstrate significant absorption in the
UV region. The UV absorption of solutions with several solvents, performed by a separate
group on TNT had an absorption maximum at 225 nm or 233 nm (depending on the solvent)81
These results were comparable to the findings of Schroeder21
. Similar measurements performed
by Kamlet et al. and Conduit et al. confirmed absorption maxima for TNT at 227 nm and 232 nm
in solution with methanol, and ethanol and water respectively82,83
. TNT was measured by
Usachev and colleagues for UV absorption in the gaseous or vapor state22
. They used a thermal
tape to heat the sample solution creating a vapor and measured this in a UV-Vis absorption
spectrometer and a Cathode Ring Down Spectrometer. Both techniques measure a broad peak
with a maximum at 216 nm for the vapor TNT sample which is shifted to shorter wavelengths
(blue shift) from the absorption maximum observed in solution.
UV and visible absorption of solid state explosives is a difficult task and reported sparingly
in the literature. The UV absorption of HMX, RDX, and PETN has been measured in KCL
50
pressed pellets26
. Absorption maxima were found at 227 nm for HMX, 243 nm for RDX, and
192 nm for PETN. Crystals of HMX and RDX have been measured in reflectance yielding the
previously mentioned high energy peaks but also a feature at 355 nm84
.
In scanning the literature it is noted that essentially all spectrometric measurements of high
energetic materials seem to yield absorption peaks only in the 190- 230 nm (UV) range and not
in the visible spectrum even though UV-Visible instruments were used. This is an important
observation considering the results reported in Chapter 5. Specifically the present research
revealed optical structure in the blue end of the visible spectrum in addition to the UV peaks.
Table 2-9. Ultraviolet absorption maxima for TNT, RDX, HMX, and PETN as reported in the
literature. Solvents are given for those measured in solution. The data of the present
research are not included.
TNT (nm) RDX (nm) HMX (nm) PETN (nm)
Acetonitrile 193, 234
26,85,
195,23686
190, 227
85 192, 260, 290
26
Ethanol (95%) 22581
, 22721
202, 23685
, 21321
20185
, 228.521
Methanol 22782
204, 23485
Water 23381
KCl pellets 190, 24326
194, 23326
19326
Thin Films 209, 24887
224, 24787
Single Crystals 220, 25584
202, 24584
Gas/Vapor 216, 24422
2.3.2 Infrared Properties (0.750-1000 μm)
The infrared region is generally defined as the wavelength range from 750 nm to 1 mm58
.
Frequencies in the infrared region are of the same order of magnitude as molecular vibrational
frequencies62
. The molecular vibrational frequencies or modes are based on the atom and spring
molecular model58
. Atoms in a molecule are bonded, demonstrated by springs; these springs
have a defined vibrational frequency. When the infrared radiation frequency is equal to the
vibration frequency of the spring the frequency is absorbed whereas all other frequencies are
transmitted62
.
51
These vibrations can be associated with the entire molecule or specific functional groups
within the molecule62
. For example, TNT has a vibrational mode related to the entire molecule
and vibrational modes associated with the NO2 and CH3 functional groups. Most infrared
spectra are displayed using wave numbers. The wave number is in the units of inverse
centimeters and is defined where λ is the wavelength in microns (see Equation 2-2). The
)(
10)(1
41
mcm
(2-2)
vibrations associated with the entire molecule usually yield absorption bands at or below 1300
cm-1
(at or above 7.69 μm). These vibrations are characteristic of the molecule and provide a
fingerprint. Vibrations related to the functional groups have absorption bands in the region
greater than 1300 cm-1
or less than 7.69 μm. These are defined as group frequencies that identify
specific functional groups within the molecule. The presence of these bands aid in the
identification of unknown molecules and are recorded in several tables.
2.3.2.1 Fourier Transform Infrared Spectroscopy
As mentioned in Section 2.2, the energetic materials are composed of nitro compounds,
nitrate esters, and nitramines. There are IR bands assigned to the particular explosive groups as
follows: symmetric trinitro compounds (such as TNT) at 1081 cm-1
, nitramines (RDX and HMX)
at 1282 cm-1
, and nitrates in general (such as esters, PETN) at 1666, 1282, and 833 cm-1
. These
bands are assigned due to characteristic vibrations (symmetric and asymmetric stretching etc.)
for the entire molecule88
. The wavenumber of the band may shift slightly due to substitutions on
the molecule. Bands that are related to the functional groups, specifically the NO2 groups, in the
studied explosives have scissor frequencies at 734, 825, and 907 cm-1
and stretch frequencies at
1533 and 1545 cm-1
. Molecules with C-N bonds have stretching bands at 938, and 907 cm-1
, N-
52
N stretching at 1080 and 1045 cm-1
, and O-N-O bending at 930 cm-1
. These band frequencies
create fingerprints for the individual explosive molecules24,25,77,83,89
.
2.3.2.2 Raman Spectroscopy
Raman spectroscopy measures the Stokes shift in wavelength of a monochromatic incident
light by the inelastic collisions with electrons in a material. A Raman spectrum is characteristic
of the material and is fairly well defined for the solid phase for many explosive materials such as
TNT, HMX, and RDX35,90,91
. Researchers have used near infrared and red photon sources to
obtain Raman spectra. Fourier transform can be used to enhance the sensitivity and resolution of
Raman shifts92
. An FTIR, modified for Raman measurements is commonly used. TNT, RDX,
and HMX have strong bands in the same regions, 1360-1309 cm-1
, 884-824 cm-1
, and 157-148
cm-1
. The smallest wavenumber bands are resolved due to the Fourier transform and specialized
filters.
Measurements of TNT vapors and solutions were measured using surface enhanced
resonance Raman scattering (SERRS)39
. SERRS involves using an analyte, that contains a
component that fluoresces, absorbed onto a roughened metal surface. Since TNT does not
fluoresce in the specified region and does not readily absorb onto a metal surface the SERRS
process needed to be modified. An azo dye was used to modify the TNT creating a highly
colored TNT derivative with the ability for strong interactions with the metal surface. Raman
spectra were recorded from TNT in solution and in vapor form that had fingerprints nearly
identical to those taken of solid TNT. Raman was also used to characterize explosives in the
shocked form91
. This yielded spectra of detonated explosives and detonation products which
allows further understanding of the characteristics of the explosive products.

53
2.4 Summary
The chemistry and optical properties of energetic materials are unique. Most importantly,
it has been shown that explosive materials have significant absorption in the UV range of the
spectrum. The differential reflectometer has the ability to probe this property and provides the
absorption of the solid phase of energetic materials. Chapter 3 will explain the electronic
structure of the organic molecules studied and how this affects the presented research.

54
CHAPTER 3
ELECTRONIC THEORY OF ENERGETIC MATERIALS
The present research is concerned with the optical properties of energetic materials which
are generally organic materials. The electronic structure of these materials is related to inorganic
materials such as silicon, but unique due to the presence of molecules with covalently bonded
atoms of several different elements. This unique structure has many implications on the optical
properties of organic materials. Therefore the electronic structure that gives rise to these optical
properties should be addressed.
3.1 Electronic Structure of Explosives
A depiction of the molecular orbital energy diagram of mononitrobenzene (MNB) based on
the molecular bonding and created by the author, is seen in Figure 3-1. The molecular orbital
energy diagram for TNT is more complicated and diffucult to represent simply. It is clearly
quite complicated with interacting orbitals and many molecular orbitals that do not interact. The
molecular orbital transitions in this system can be between both the interacting and non-
interacting molecular orbitals and are potentially rather complicated. This energy diagram can
be compared to that of materials with only one atomic species, such as silicon, where the highest
energy state occupied is the upper part of the valence band and the lowest unoccupied energy
state is the lower end of the conduction band58
. These energy states are separated by an energy
gap like that between the n and π* orbitals in Figure 3-1. In organic molecules, the bonding and
non-bonding orbitals are considered similar to the valence band but instead are termed the
highest occupied molecular orbital (HOMO)79
. The lowest unoccupied molecular orbital
(LUMO) is analogous to the conduction band and is composed of the anti-bonding orbitals.
Electrons within the molecule can be localized on a particular atom if they are non-bonding,
shared between several atoms in bonding orbitals, or shared between a small number of atoms93
.

55
This is in contrast to an inorganic material where the electrons are either shared between the
nearest neighbor atoms, as in covalently bonded materials, or freely distributed throughout the
material, as in metals, and therefore provide more complicated electronic transitions.
Figure 3-1. Molecular orbital energy diagram of mononitrobenzene (MNB) demonstrating the
complexity of energy diagrams of large molecules (created by author).
The molecular orbital energy diagram shown in Figure 3-1 is based on the combination of
the atomic orbitals of several different atoms. This is performed through the linear combination
of atomic orbitals which is simply the addition and subtraction of the wave functions that
describe the two atoms. Quantum mechanics requires that the combination of two atomic
orbitals yields two molecular orbitals. This is the origin of the anti-bonding molecular orbitals
that act as the conduction band.
It is important to note that molecular orbitals are characterized by their symmetry. Similar
to crystalline materials, all molecules demonstrate elements of symmetry. The symmetry
operations included in the molecule are classified into point groups like the space groups for
Mononitrobenzene
(MNB) Benzene+Nitro group
π 1
π 2, 3
π *4, 5
π *6
π 2sp2
n 2sp2N
π *2sp2
σ* 2sp2
σ* 2sp2
n 2p O
σ 2sp2
σ 2sp2
σ
σ*
σ 2sp2
σ 2sp2
π 1
π *2sp2
π *4, 5
π *6
σ* 2sp2
σ* 2sp2
π 2, 3
56
crystalline materials. The influence of the symmetry operators on the molecule determines the
symmetry of its molecular orbitals. This symmetry is reflected in the wave equations that
describe the molecular orbitals. As will be shown in Section 3.2 this has a large effect on the
allowed molecular orbital transitions.
3.2 Photon Interactions
The complex molecular orbital energy diagram in Figure 3-1 demonstrates that the
possible electronic interactions are not straightforward for organic molecules. A discussion of
this begins with the interaction of photons with the material. If photons have a large enough
energy to promote an electron to a higher energy orbital, the photons are absorbed. This
absorption is not only determined by the energy of the incident photon but on several criteria
including molecular orbital symmetry among others79
.
The theoretical treatment of the absorption of photons begins with calculating the
probability of the absorption between two orbitals93
. This is given in Equation 3-1 where Bif
iffif DGch
eB
2
23
3
8 (3-1)
denotes the absorption probability from an initial (i) to a final (f) state, Gf is the statistical weight
of the final absorption state, and Dif the dipole strength. The statistical weight of the absorption
state is defined by the number of degenerate wave functions to which absorption can occur. An
absorption probability can be transformed from Equation 3-1 according to Mulliken to give a
measure of the intensity given in Equation 3-2. The oscillator strength (f)
iff DGh
mcf
3
8 2 (3-2)
is an indication of the intensity of the absorption intensity at the frequency of absorption (ν).
The dipole strength, Dif, can be further obtained by Equation 3-3
dMDI fi (3-3)
57
showing that it is proportional to the intensity ( I ). The total wave functions of the initial and
final states of the molecule are given by Ξi and Ξf, M is the dipole moment vector, and dτ is the
volume element product. The rotational and vibrational wave functions are assumed to not be a
factor, due to their long time scale compared to electron transitions, so that the total wave
functions are reduced as shown in Equation 3-4.
dMD fi (3-4)
This equation provides the basis of quantum mechanical approximations of molecular orbital
transitions and selection rules. A series of assumptions are used that need to be stated; first, Ψ is
reduced into a series of one electron orbitals (functions); second, only one electron is excited in
the transition; and third, the time independent wave functions ψj are the same in the ground and
excited states. The first and third assumptions are significant but they greatly reduce the problem
to a manageable size. Equation 3-5 shows Equation 3-4 reduced according to the stated
assumptions. When Equation 3-5
11 )1()1( dMD fi (3-5)
is zero, then the transition is forbidden and according to the theory should not occur. The
symmetry properties of the molecular orbital expressed in the wave function can
determine whether Equation 3-5 goes to zero. These are summarized in selection rules.
The first selection rule only concerns molecules with a center of symmetry. This rule
gives that a transition can only occur between an antisymmetric orbital and a symmetrical orbital
or vice versa and not between two antisymmetric or symmetric orbitals. The multiplicity of
states gives that transitions from singlet to triplet states are forbidden while singlet to singlet
transitions are allowed. This is due to the fact that transitions which require a change in spin are
not allowed. The last selection rule is the most intriguing as it involves the symmetry of the
molecular states. A transition is forbidden if Ψi Ψf does not convert, as the irreducible

58
representation, in the same way as at least one of the components of the dipole strength vector
(Mx, My, or Mz). For example, if Ψi Ψf is an even function and Mx is also even than the transition
is allowed however, if Mx is odd then it is not allowed. Or, the transition is allowed if a direct
product of the representation of Ψi M Ψf contains the totally symmetric representation. This
illustrates the importance of the molecular orbital shape and symmetry involved in a particular
transition. In addition, if the symmetry of an orbital is changed due to bonding with another
molecule or electrostatic interactions a forbidden transition can be allowed, although usually at a
low intensity. It is important to note that many electron transitions are considered forbidden if
they are expressed as one electron wave function products, however, the transition can be
allowed if a linear combination of these orbitals are made. This is due to the non-vanishing
probability of a many electron excitation.
Vibrational motion in a molecule is also a consideration in the electron transitions. These
motions can be described as symmetrical or antisymmetrical and are at a time scale significantly
longer than electronic transitions. Regardless, there are occurrences where vibrational
interaction causes a forbidden electronic transition to become allowed. The weakly allowed
nature of this transition is present when the electronic excitation is accompanied with a
vibrational motion in the particular direction of the orbital. This is analogous to silicon where
absorption of a phonon (lattice vibration) is required for an electron to be promoted to the
conduction band across the indirect band gap.
3.3 Summary
The molecular orbitals of a large molecule, such as the energetic materials investigated, are
complex. This leads to intricate molecular orbital transitions that may be difficult to interpret.
The research performed investigates these MO transitions and uses the presented theory to
explain the origin of the reported absorption.

59
CHAPTER 4
EXPERIMENTAL PROCEDURE
This chapter describes the methods and procedures used in the procurement of data.
4.1 Ultraviolet and Visible Techniques
The UV-Visible properties are measured using two different instruments. A Differential
Reflectometer was used to find the characteristic absorption of the energetic materials that had
not been previously reported. The DRS measurements were then complimented using a UV-
Visible spectrophotometer in transmission and reflection modes.
4.1.1 Differential Reflection Spectroscopy (DRS)
The unique optical properties of explosive materials give several options for research. Due
to previous research in the field of UV and visible optical properties of semiconductors and
metals, the researchers decided to utilize this region. Differential Reflection Spectrometry is the
main technique used for the presented research. The DRS was originally developed to
investigate the alteration of a metal’s electron structure due to alloying10,94-96
. Two metal
samples containing different amounts of alloying are placed side by side with virtually no space
between them. A beam of light is scanned between the two samples as a monochromator scans
through the appropriate wavelengths. The differential reflectogram (DR) produced displays the
normalized difference in reflectivity versus the wavelength. Features in this DR represent
energies where photons are absorbed by electrons within the material and can show how the
alloying effects these transitions. The DRS probes the first few atomic layers of a material and
reveals the electronic structure near the Fermi surface.
4.1.1.1 Instrument
The concept of the DRS is straightforward and in turn the basic instrument is relatively
simple in construction as seen in Figure 4-1. The experiments performed are in the UV and

60
visible range (200- 800 nm) but the instrument can also be used through the infrared range with
proper adjustments of the light source, grating, and detector. A high pressure xenon lamp is the
unpolarized UV to visible light source. This is placed in front of a scanning monochromator that
individualizes the wavelengths of the light and, while continually varying the wavelength, directs
the light beam onto a vibrating mirror. The vibrating mirror oscillates the beam to two spots
(close in distance to each other) on the sample, at near-normal incidence. This creates an area of
between 2 x 2 mm2 and 2 x 4 mm
2 determined by the degree of vibration of the mirror. A lock-
in amplifier is tuned to the frequency of the vibrating mirror. The reflected light from the two
sample spots are collected by a mirror and directed onto the face of a photomultiplier tube (PMT)
with a light diffuser on the front to prevent any effects due to the varying sensitivity across the
PMT face10,94-97
.
Figure 4-1. Differential reflection spectrometer used in the research. The different colors and
shapes in the samples within the inset indicate the inhomogeneous surfaces of the
sample allowing differential measurements.
The output signal with a direct current component which can be observed by an
oscilloscope is split into two channels. One channel contains a low pass filter that removes a
61
frequency specific square wave from the signal leaving the average in reflectivity, R (Equation 4-
1),
2
21 RRR
(4-1)
which is held constant by a servo (at 10 volts) that determines the high voltage applied to the
PMT. The frequency of this square wave is equal to the vibrational frequency of the mirror, in
this case 60 Hz. The second channel is connected to the lock-in amplifier that gives an output
proportional to the difference in reflectivity, ΔR, shown in Equation 4-2.
12 RRR (4-2)
A divider circuit forms the desired ratio of the two signals yielding RR / . The resulting
spectrum is termed a differential reflectogram (DR) and displays the normalized difference in
reflectivity versus the wavelength. The normalized difference in reflectivity, , RR / .
)(
)(2
21
12
RR
RR
R
R
(4-3)
is calculated electronically from the output of the PMT
The normalization of the signal has several benefits most importantly eliminating possible
fluctuations of the line voltage and spectral effects of the optics in the instrument including the
intensity changes of the light source. This signal is then sent to the computer by way of a data
acquisition card where it is recorded along with the corresponding wavelength94-96
.
4.1.1.2 Theory and Interpretation
Differential Reflectometry is based on the absorption of photons of a particular energy by
electrons in a material similar to UV-Visible spectrophotometry. As explained in Section 2.5.1,
the DRS measures the normalized difference in reflectivity. This difference in reflectivity yields,
by a line shape analysis (see section 4.1.1), the absorption ε2, that is, the imaginary part of the
complex dielectric constant, ̂

62
2
21ˆˆ ni (4-4)
where n̂ is the complex index of refraction.The real part, ε1,
22
1 kn (4-5)
of the complex dielectric constant (polarization) and the imaginary part, ε2,
nk22 (4-6)
are given where n is the (real) index of refraction and k is the damping constant. The above
parameters are material properties and dependent on the wavelength of light.
The difference in reflectivity could originate from several sources. For the reported work,
the sample (e.g. TNT) was usually in the form of crystals that were placed on an optically
absorbent carbon pad. The crystals are not evenly distributed on the carbon pad that is, the
amount or concentration of the TNT on two spots may not be the same resulting in a difference
in the reflection of photons. Alternately, the sample crystals are small and not aligned so that an
area may contain several different crystal faces in varying directions. Incident light will be
reflected off of these crystal faces where the index of refraction is different for each crystal face
98.
4.1.1.3 Line Shape analysis
The DR measured by the DRS, as mentioned in Section 4.1.1, gives the normalized
difference in reflectivity. The absorption of the sample can be found by means of a line shape
analysis of the DR. A technique of a line-shape analysis has been well documented and finds the
exact transition wavelengths for photon absorption94,97,99
. This analysis requires the optical
constants, n and k, for the sample materials over the wavelength range of the measured spectra.
For energetic materials, the optical constants are not well reported and when they are known it is
only for one wavelength, usually the sodium D-line. Therefore a line shape analysis of the
measured data based on the shape of the transition and not the calculated values was used in the
research.
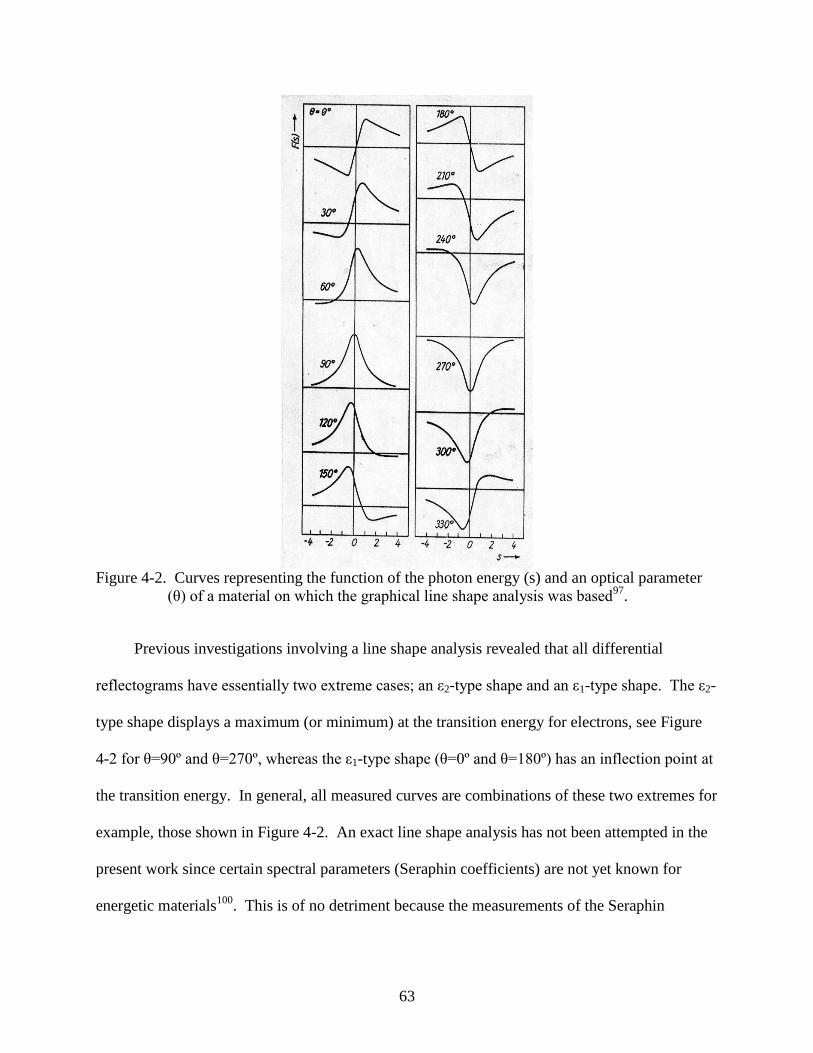
63
Figure 4-2. Curves representing the function of the photon energy (s) and an optical parameter
(θ) of a material on which the graphical line shape analysis was based97
.
Previous investigations involving a line shape analysis revealed that all differential
reflectograms have essentially two extreme cases; an ε2-type shape and an ε1-type shape. The ε2-
type shape displays a maximum (or minimum) at the transition energy for electrons, see Figure
4-2 for θ=90º and θ=270º, whereas the ε1-type shape (θ=0º and θ=180º) has an inflection point at
the transition energy. In general, all measured curves are combinations of these two extremes for
example, those shown in Figure 4-2. An exact line shape analysis has not been attempted in the
present work since certain spectral parameters (Seraphin coefficients) are not yet known for
energetic materials100
. This is of no detriment because the measurements of the Seraphin
64
coefficients of energetic materials are not the goal of this research. Instead, the general line
shape analysis of energetic materials is used for their identification.
4.1.1.4 Sample Preparation and Operating Parameters
Solid energetic materials were placed on a black carbon pad that is adhesive on both sides.
One side was attached to a glass slide for mechanical support and the solid sample placed on the
opposite exposed side. The carbon pad, manufactured for scanning electron microscopy, was
chosen due to its featureless optical absorptive properties in the UV and visible range, after a
survey of several different substrates. Samples of energetic materials were received from several
sources in different forms. The TNT received from Chem Service Inc. was in solid powder form
with 30% included water for shipping. A solution of TNT in acetonitrile was made and the
solution is deposited on a thoroughly cleaned glass slide or the entire bottle of solution is placed
in a low temperature vacuum oven. For the glass slide preparation, the solution was continually
deposited onto the slide at approximately 10 minute time intervals until a critical concentration
was reached and crystals of desired size were formed. While the samples for vacuum oven
preparation were placed in an oven set to a temperature lower than the boiling point of the
solvent and a vacuum of 25 mmHg was constantly pulled using a small mechanical vacuum
pump. In both cases, the solution was allowed to evaporate and dehydrate the TNT resulting in
small pale yellow dendritic crystals. The process can be repeated to insure better purification as
indicated in the literature, but a chemical analysis on the above prepared sample yielded a purity
of 97% making additional rounds essentially unnecessary101
.
Other energetic materials such as HMX, RDX, and PETN are received from Accustandard
in a solution with methanol, ethanol, acetonitrile, or a combination of these solvents. For
experiments requiring solid samples the deposition dehydration procedures outlined above are
used.

65
Additional samples were received on loan from the Alachua county Sheriffs’ office and the
Federal Bureau of Investigation (FBI). These samples include TNT, C-4 (RDX and plasticizer),
PETN, Detasheet, Atlas, and other common commercial energetic materials. These were
generally used as received in the DRS where small amounts of the samples were placed on black
carbon pads.
The prepared sample was placed at the sample holder of the differential reflectometer. The
monochromator was then set between 450 nm to 500 nm so the light beam is visible to the
human eye and the sample position was adjusted so that the beam is on the energetic material
sample crystals. An oscilloscope that was connected to the output of the photomultiplier tube
can be used to find an optimum spot on the sample. The optimum spot was defined as one that
produces a near square waveform on the oscilloscope showing that there is a large enough
difference in signal between the two oscillating light beams to yield a large response without
going into saturation. After the instrument was aligned, the monochromator was scrolled back to
200 nm. The measurement was taken by scanning the monochromator in the decreasing energy
direction (increasing wavelength) and the resulting data was displayed as the wavelength versus
the normalized difference in reflectivity. This sequence was repeated for each measurement
whether it is a different sample or simply a different spot on the same sample. Generally, three
sequential measurements were taken for each sample (same spot on the sample) to ensure
repeatability of the results.
One experiment performed on the DRS was to determine the effect of UV light exposure
on the DR of a TNT sample. For this experiment the instrument was used as one of the UV light
source to limit sample handling. The monochromator was set to a specified wavelength in the
UV range (250 nm-350 nm), a protective shutter was removed, and the sample was exposed to
66
the light for a specified amount of time (from 30 seconds to 15 minutes). After each UV light
exposure the above experimental procedure was followed.
The monochromator has different scanning speeds that can be used to increase the
resolution of the measurements. For normal measurements, 200 nm per minute is used due to the
relatively high resolution without significantly increasing the measurement time; 100 nm per
minute is a higher resolution while 500 nm per minute provides a low resolution speed used
primarily for scrolling back the monochromator. The sensitivity of the DRS can also be adjusted
by changing the voltage of the signal channel for the lock-in amplifier between 0.1 and 10 mV.
Most measurements are made using 5 or 10 mV which is the lowest sensitivity settings.
4.1.2 Ultraviolet-Visible Spectrophotometery
The UV-Visible spectrophotometer is most often used in the transmission mode where the
incident light passes through a sample in solution. Four different instruments were used
throughout the research: Perkin Elmer, Hitachi, and two separate Varian Cary spectrometers. A
He lamp is used in conjunction with a scanning monochromator to individualize the wavelengths
of light. The light then passes through a beam splitter which directs both beams through the
sample chamber. A sample is placed in one beam and the reference (the pure solvent of the
sample solution) in the other beam within the sample chamber. The transmitted light is
collected, digitalized, and calculated as the absorbance. Generally, the path length for the
measurement is 0.1 cm.
4.1.2.1 Transmission UV-Visible spectrophotometry
For transmission measurements, the instrument is turned on and properly warmed up
(approximately 20 minutes). A zero measurement is taken with no samples in the sample
chamber for calibration. The experimental parameters, such as the integration time speed and
wavelength range, are entered into the operating computer and a background measurement is

67
made, which will be subtracted from all subsequent measurements in the experiment. Then a
reference sample of the solvent is placed in the sample chamber, and a baseline measurement is
made. To measure an experimental sample, the sample solution is deposited in a quartz cuvette
and placed in the sample spot (first beam) of the sample chamber and a spectrum is taken. This
is repeated for each sample in the experiment with proper cleaning of the sample cuvette in
between and a new baseline measurement between chemically different samples (not
concentration variations). When the concentration of the solution is continuously varied for an
experiment, then the lowest concentration solution is measured at first and the highest
concentration last. This eliminates the potential for error because the next measurement made is
of the same solution at a significantly higher concentration.
4.1.2.2 Reflectance UV-Visible spectrophotometry
A reflectance stage can be installed into the UV-Visible spectrophotometer to measure
solid samples. The reflectance stage is comprised of a mirror to direct the incident light onto the
sample holder at a set angle and a second mirror to direct the reflected light towards the detector.
This angle can be varied from 45 to 90 degrees to the detector. The reference sample spot is left
empty or a density filter can be used to increase the sensitivity. The reflected light from the
sample collected by the detector is calculated in virtually the same manner as the transmission,
that is, where I0 is the incident light intensity is and IR is the intensity of the reflected light.
RI
IR 0 (4-5)
4.1.2.3 Sample Preparation
A solution of the sample material is required for UV-visible transmission
spectrophotometry. If the hydrated TNT is to be measured, the dehydrating process described in
Section 4.1.1 is used. Then the solid sample is carefully massed out and placed into a clean

68
sample bottle and the specified amount of the appropriate solvent is added by a micropipette.
The Accustandard samples are received as a solution therefore they are diluted as needed or used
as received.
A UV-visible reflectance spectrophotometry sample is virtually the same as a DRS sample
however, the black carbon pad is much larger to account for the lager spot size in the
spectrometer.
4.1.3 Infrared Spectroscopy
The infrared properties of the energetic materials were also briefly explored to compliment
the DRS results. Many instruments exist to investigate the infrared properties such as Raman
spectroscopy and Fourier transform infrared spectroscopy (FTIR). For the reported research an
FTIR investigated the fingerprint region of the spectrum and the bonds of the molecules. The
FTIR instrument used was a Thremo Magna with microreflectance attachment.
The FTIR included a microscope attachment that was used in reflection mode. A solid
sample of the energetic material was placed on a stainless steel plate and positioned under the
microscope objective lens. Stainless steel was the substrate for the samples because it is
optically reflective and inactive (no features) in the infrared region. The microscope was
focused so that a white light spot imitating the position of the infrared beam illuminated the area
of interest. Before the spectrum is taken, the visible light is turned off to prevent interference
with the response of the sample material. When a measurement is performed the incident beam
is directed through the objective lens and the infrared light reflected from the sample travels back
through the objective lens of the microscope to the detector and signal processing is performed.
The resulting data is presented as the wavenumber versus the percent of reflection.
69
4.2 Chemical and Crystalline Structure Analysis
To ensure the integrity of the reported results, great lengths were taken to determine the
purity and crystal structure of the studied energetic materials. A confirmation of the purity of the
energetic materials was performed by High Pressure Liquid Chromatography and Mass
Spectroscopy (HPLC/MS). The crystal structure of the samples was determined by differential
scanning calorimetry (DSC) where applicable. These crystals were also characterized by optical
microscopy and optical profilometry.
4.2.1 High Performance Liquid Chromatography and Mass Spectrometry (HPLC/MS)
The samples were analyzed by Dr. Jodie Johnson in the Spectroscopy Services of the
chemistry department. Solutions of TNT and acetonitrile were submitted for analysis where a
High Performance Liquid Chromatography (HPLC) coupled with Mass Spectrometry (MS) was
performed. HPLC is a technique based on chromatography, where a mobile phase is moved
through a sample to separate out the components. In HPLC the mobile phase was a solvent or
combination of solvents that are mixed and released into a chamber. The sample being analyzed
was injected into the system using a small syringe and the solvent was released from the chamber
through the sample into a column. The sample was then separated into its components and
displayed in a chromatograph where each is separated by the time it took to flow through the
chamber. Then the resulting compounds were analyzed using UV-Visible absorption by
recording the absorption spectra. After this analysis a definite determination of the sample
structure was obtained by removing the separated components from the HPLC column and
placing them (separately) in a mass spectrometer102
.
4.2.2 Differential Scanning Calorimetry (DSC)
The crystal structure of solid TNT samples was investigated using the differential scanning
calorimeter (DSC). The DCS is a technique that determines the thermal transitions in a material

70
such as the melting point or glass transition. A DSC is composed of two plates in a controlled
atmosphere where one plate holds the sample and the other is empty. Each plate was set on
individual heaters that are controlled by a computer. As the temperature of the heaters was
raised (scanned), the amount of heat required for the sample pan heater to maintain the same
temperature as the reference may change at certain temperatures. The resulting difference in
sample pan heater heat output was recorded as a function of the temperature. This was displayed
as a graph of the heat output versus temperature indicating peaks where thermal transitions in the
sample occurred.
4.2.3 Optical Microscopy
Sample crystals were analyzed, measured, and digitally photographed using an Olympus
digital optical microscope.
4.2.4 Optical Profilometry
The shape and morphology of the samples was further characterized by optical
profilometry. A Veeco Wyko profiler housed in MAIC was used for the measurements. Optical
profilometry produced a measurement of the topography and morphology of a sample using the
optical interference pattern produced from the interaction of the light source and the sample. The
instrument was constructed like an optical microscope with an objective lens where the incident
light, beam splitter, reference mirror, and detector are housed. A light source, usually a red to
near infrared laser, was split and one beam was directed at the sample and the second was
directed on the reference mirror that is perfectly flat. The difference in the phase and intensity of
the light reflected from the sample and the reference mirror created an interference pattern. A
piezoelectric ceramic was used to slowly move the reference mirror (in the z direction) and the
interference patterns at several positions were recorded. When the movement was complete the

71
computer analyzed the interference patterns and constructed a three dimensional false color
image of the sample topography.
4.2.5 Particle Size analysis
Particle size analysis was performed on solutions of the energetic materials in appropriate
solvents using a Nanotrac autosampler which implements dynamic light scattering. In a solution
of particles and solvent, the particles in the solution experience Brownian motion due to random
collisions with thermally excited solvent molecules. The resulting direction and velocity of the
particles are random but the velocity distribution over a period of time approaches a known
functional form representative of the particle size distribution.
A laser diode with a wavelength of 780 nm was directed through a probe that is inserted
directly into the solution. Some of the incident light was reflected off the sapphire lens that
separates the probe from the solution, and was used as a reference frequency signal. The
incident light of the specified frequency was scattered by the particles in the solution and
frequency shifted due to the Doppler effect. The frequency shift was in agreement with the
velocity of the particle which was recorded by a photodetector in the probe after being
recombined with the reference light. A Fast Fourier Transform (FFT) was performed on the
resulting interference spectrum that yielded the particle distribution. A thermocouple in the
probe records the solution temperature to account for thermal excitation in the velocity
calculations.
The Nanotrac was able to measure particles larger than 0.8 nm for fairly high solids
loading (concentrations) solutions and 3 nm for low solids loading solutions.
4.3 Computational Chemistry
The molecular orbital structure of the energetic materials where explored using
computation chemistry or molecular modeling using the computer software CAChe (computer

72
assisted chemistry) by Fujitsu. While these were not experimental results, they are included
within this section in order to explain the procedure for the computational methods. The
molecule of the energetic material is drawn in the computer interface using a molecule builder
tool atom by atom and then connecting the atoms with the proper bonds. Valence configuration
of the atoms and hybridization of the bonds were then defined by the computer. Other
parameters such as, inserting a double bond on one oxygen in the nitro group, were corrected by
the user. Then the geometry of the molecule was optimized using the semi-empirical PM3
(parameterized method 3) method. In addition, the optimized geometry was obtained from
literature and inserted into the program as fractional coordinates. The molecular orbitals and the
resulting transitions are then calculated using Zerner’s intermediate neglect of differential
overlap (ZINDO) method more specifically intermediate neglect of differential overlap for
spectroscopy (INDO/S) model103
. The resulting ultraviolet and visible transitions are displayed
in a graph of wavelength versus oscillator strength. These transitions are also displayed
graphically as the molecular orbital surfaces involved in specific transitions.
In investigation and support of the computed MO transitions, the molecular orbital
energies were calculated with two separate methods, ZINDO and DFT103
. The first method used
was the semiempirical parameterized method iteration 3 (PM3) for the optimization of the
molecular structure. Then INDO/1 (intermediate neglect of differential overlap one) was applied
for the calculation of the molecular orbital energies and electron occupations which is a model of
the ZINDO method. ZINDO is based on quantum mechanic equations where some of the two-
electron integrals that involve the overlap of different basis functions, are ignored. Some of the
values assumed in the calculation are based on experimental values, therefore ZINDO is a semi-
empirical method. The second method employed was a density functional theory (DFT) method

73
for geometry optimization and molecular orbital calculations. Meanwhile, the DFT is based on
the electron density functional rather than the quantum mechanical equation. DFT tends to over
delocalize the electrons and therefore over estimate the energies of the molecular orbitals. The
ZINDO methods have the trend of over localizing the electrons and underestimating the
molecular orbital energies. Using the two methods, their results will not be exactly the same but
if they are both treating the system consistently, they should be relatively close.
Several of the tested energetic material molecules and related molecules were modeled
using the computational chemistry. The computed molecular orbital transitions wavelengths
were then compared to the experimental data. The graphical computer interface was also used to
demonstrate the construction of the molecular crystals of the energetic materials.

74
CHAPTER 5
EXPERIMENTAL RESULTS
5.1 Differential Reflectograms of Energetic Materials
The differential reflectogram of a typical solid TNT sample is shown in Figure 5-1 (on
page 88). Several spectral features are present including a double peak near 250 nm, a small
peak at 300 nm, and most distinct, an absorption edge or shoulder between 390 and 400 nm.
This shoulder will be termed from now on as the 420 nm feature, has an onset at about 440 nm,
an inflection point at 420 nm and a maximum near 390 nm. Since the 420 nm feature is situated
at the long wavelength end of the UV spectrum, it will be also referred below as the long
wavelength shoulder or red transition. It is unique to TNT in comparison to other inert materials,
organic and inorganic, (including vegetation) that have been measured (Figure 5-2 and Figure 5-
3). Several other common explosive materials, RDX, HMX, PETN, Tetryl, and Nitroglycerin
have also been investigated. Their differential reflectograms are shown in Figure 5-4. Each
explosive has a unique absorption edge at a large wavelength (low energy) that is distinct from
the other explosives and inert materials. Specifically, the inflection point of these features are
located near 330 nm for RDX, 320 nm for HMX, 275 nm for PETN, 300 nm for Tetryl, and 310
nm for nitroglycerin. The inflection point is the minimum of the first derivative of the curve in
the region of interest and gives a specific wavelength for comparison to the other energetic
materials. Due to the wavelength of the shoulders for these materials the features will also be
termed the long wavelength shoulder.
The energetic materials were obtained from chemical standard companies, see Section 4.1.
For confirmation, additional samples were provided on loan by the Alachua County Sheriff
Office Bomb Squad and the Federal Bureau of Investigation (FBI). These samples were
commercial or military grade explosive materials that demonstrated the same features as before
75
and seen in Figures 5-5 and 5-6 for the materials obtained from the chemical standards
companies. Nitroglycerin was obtained in the form of a heart medication tablet and was
therefore mixed with inert materials. It is concluded that the observed features are independent
of the supplier of the particular energetic material.
The long wavelength features are independent of the solvent used for recrystallization (if it
is needed). This is shown particularly for TNT where the sample was recrystallized separately
from solutions of acetonitrile, acetone, and ethanol, see Figure 5-7. TNT has different
solubilities with each of the solvents that yield different masses of material from the same
volume of solution. Therefore the samples shown in Figure 5-7 have similar masses of TNT
rather than recrystallization from equivalent volumes of solution.
It may be argued that the 420 nm feature is occurring due to the substrate or to a substrate
sample interaction. To investigate this TNT was placed on several different substrates and the
differential reflectivity was measured as seen in Figure 5-8. All of the fabrics were black in
color except where indicated. It was found that the 420 nm feature is maintained regardless of
the substrate.
5.2 Characterization of TNT Purity, Crystal Structure, and Morphology
The purity of the tested material from Chem service Inc. and the Alachua county Sheriff’s
office bomb squad were evaluated using HPLC/MS. From the mass spectrometry results (Figure
5-9) it was found that the Chem service Inc. TNT was 93.8% TNT and 5.3% 2, 4 dinitrotoluene
(DNT). The Bomb squad TNT was found to have a higher purity than the chemical standard
(99.2% TNT and 0.2% 2, 4 DNT). Dinitrotoluene can be an impurity in TNT due to incomplete
nitration of the toluene molecule during formation.

76
Differential scanning calorimetry (DSC) was used to characterize and confirm the presence
of TNT. The DSC graph shown in Figure 5-10, displays a transformation, or change in weight,
near 82°C that is according to the literature, the melting point of TNT89
.
X-ray diffraction (XRD) spectrometry is routinely utilized to determine the crystal
structure of materials using the 2θ diffraction by particular lattice planes. Figure 5-11 displays
an XRD graph (intensity versus 2θ) for TNT recrystallized from acetonitrile. The planes of the
monoclinic and orthorhombic phases are labeled, of a TNT sample 68,101
. The graph shows that
the monoclinic and orthorhombic phases are both present while the majority of the sample is
monoclinic.
The samples of the energetic materials were also characterized using optical micrographs
and optical profilometry. These two techniques show a closer view of the dendritic and needle-
like structure of the TNT samples. The optical micrograph for TNT (Figure 5-12) displays sharp
thin needles of the TNT crystal. These needles are on average 20-100 μm wide and 300-500 μm
long. The smaller crystal deposits clearly show additional dendritic behavior that cannot be seen
by the naked eye. The varying morphologies of the other energetic materials are shown in
Figure 5-12. PETN is distinctly different than the other materials in that it recrystallizes in a
fairly smooth crystal. This unique morphology is also observed with the naked eye in the fine
powder. HMX and RDX display dendritic morphologies similar to TNT but on a smaller scale.
Tetryl is characterized by small distinct crystals within this sample. The optical profilometry of
TNT (Figure 5-13) displays how the individual needles grow on top of each other in stacks.
5.3 Behavior of Energetic and Other Materials with a Ring Structure
Figure 5-14 shows the spectra of several energetic and non energetic materials that have
ring or cyclic molecular structures, see Figure 5-15. The spectra infer that the presence of a ring
structure is not the only prerequisite to having the absorption features in the long wavelength

77
range. In fact, the only cyclic materials with a feature below 300 nm, in addition to a small
wavelength feature, are TNT, RDX, HMX, and Tetryl. Therefore additional molecular
compositions must be contributors to the observed features.
5.4 Mixtures of Several Energetic Materials
Many explosive devices, commercial and military, can contain mixtures of several
common energetic materials in order to tailor the explosive power needed in an application5.
Figure 5-16 shows differential reflectograms of dry binary mixtures of energetic materials. It is
observed that each energetic material retains their individual characteristic features. Specifically,
the shoulder of TNT and that of C-4 are individually identifiable in the same differential
reflectogram. The features are even amplified compared to the individual substances due to the
differential character of the DRS.
5.5 Effect of Rotating or Tilting the Sample
Due to the novel use of the DRS for powder samples, the question was raised if the
rotation or tilt of the sample would affect the measured spectrum. Thus, a TNT sample placed in
the DR was rotated around its center point and measured at each degree of rotation seen in
Figure 5-17. The shape of the spectrum varied slightly with the rotation angle but the presence
and wavelength of the characteristic 420 nm feature was not affected. Variation of the spectrum
shape is due to sampling several spots on the material where different crystal faces and
concentrations of TNT are present at each spot. In addition, a sample was tilted with respect to
the incident angle. This was achieved by placing a glass slide underneath one side of the sample
glass slide at varying distances from a fixed point causing the glass slide and subsequently the
sample to tilt (depicted in Figure 5-18). As seen in Figure 5-19, there is virtually no change in
the DR spectrum with tilt angle. The wavelength of the characteristic feature remained virtually
the same and only the intensity somewhat decreased. It is suggested that, as the angle was
78
increased a smaller amount of photons are collected by the detector causing the decrease in
intensity.
Since there was virtually no change in the measured differential reflectograms with
rotation or tilt angle, then the reflected photons detected and shown in the DR are due to the
tested material. This further assures that the characteristic features originate from their optical
properties.
5.6 Dependence on the Number of Nitro Groups Present
The DR of solid samples of 2, 6 DNT, 2, 4, DNT and 1, 3 DNB were measured and
compared to TNT. Mononitrotolulene was not measured because it is a liquid at room
temperature making DRS measurements, utilizing a vertical sample stage, quite difficult. The
measured spectra for the materials containing two nitro groups are displayed in Figure 5-20. An
absorption edge similar to that of TNT is observed for each sample around 420 nm. With
subtraction of the number of NO2 groups, the onset of the absorption is slightly blue shifted (to a
smaller wavelength) from that of TNT and subsequently the maximum and point of inflection are
also blue shifted. Specifically, the inflection point is at 397 nm for 2, 6 DNT, 402 nm for 2, 4
DNT, and 403 nm for 1, 3 DNB. A comparison of the inflection points for TNT and the dinitro-
samples is displayed in Figure 5-21.
From the measurements, it is concluded that the presence of the 420 nm feature does not
appear to have a dependence on the number of nitro groups in the molecule, however there may
be a relationship with the wavelength of this feature.
5.7 Comparison of Differential Reflectograms with Results from Other Optical Techniques
The reflection mode of a UV-visible spectrophotometer was used to compliment the DRS
findings. The resulting spectrum, shown in Figure 5-22, displays the characteristic 420 nm
feature of the TNT sample. Features in the bluer region (200-300 nm) are not observed with the
79
UV-Visible instrument in reflection mode. This may be due to the fairly low sensitivity of the
spectrometer in this range or the absorption of light by the carbon substrate. The effect is
eliminated in the DR measurements where many of the absorption features of the substrate are
removed from the spectrum due to the differential technique.
The transmission mode of the UV-visible spectrophotometer was used to measure
solutions of energetic materials. The solutions were chosen to be at a relatively high
concentration (on the order of g/L) when placed in the spectrometer. Figure 5-23 shows UV-
visible absorbance spectra of TNT in an acetonitrile solution at a concentration of 3.2 g/L using
four different spectrophotometers. The feature near 420 nm known from DRS measurements is
slightly blue shifted. Specifically, the minimum of the first derivative is at 395 nm as compared
to 420 nm. The Varian Cary 5e was used for the remainder of the UV-Visible absorbance
experiments.
Transmission measurements are conventionally performed at smaller concentrations than
used above. Therefore the concentration of the TNT solution was diluted in steps. Figure 5-24
displays resulting UV-visible absorbance spectra of the continual dilution of the solution. It is
observed that with decreasing TNT concentration, the 420 nm feature decreases in intensity until
it is no longer observed. This phenomenon will be further investigated in Section 5.8.1. It is
noted that particle size analysis of the highest concentration acetonitrile solution did not measure
any crystals of a size above the detection limit of the instrument (3 nm). Therefore, the TNT was
quite dissolved in the solvent.
The other energetic materials measured previously using DRS were also investigated using
the UV-Visible transmission spectrophotometer. Solutions of high concentrations (1 g/L) were
investigated (see Figure 5-25). They demonstrate long wavelength absorbance near the features
80
observed in the respective differential reflectograms. The shoulders or peaks in solution are blue
shifted compared to the DRS spectra similar to TNT. In addition, the concentrations of the
sample solutions were diluted to see if the long wavelength features (shoulders) were affected.
The spectra taken for the continual solution dilution of several energetic materials are shown in
Figure 5-26. All of the materials except PETN demonstrate a large dependence on the intensity
of the long wavelength feature with concentration. It is noted that the highest concentration
PETN solution is 50 ppm which is an order of magnitude below that of the other energetic
materials. This may affect the ability to see a measurable change in the long wavelength feature.
Solutions of 2, 4 DNT, 2, 6 DNT, and 1, 3 DNB, in a solvent of equal amounts of methanol
and acetonitrile, were also measured with the UV-visible transmission spectrophotometer as
shown in Figure 5-27. A feature around 420 nm is found blue shifted compared to the TNT
solution at the same concentration. The inflection point of these features are blue shifted by an
average of 25 nm compared to the DRS spectra. In addition, spectra of solutions of 2, 3, and 4
MNT, and nitrobenzene (NB) were taken in a methanol and acetonitrile solvent, see Figure 5-28.
A feature near 400 nm was again observed in these solutions where the 2 MNT shoulder was red
shifted, at 380 nm, than the 3 and 4 MNT, observed at 363 and 370 nm, respectively and NB, at
367 nm. These compounds are a liquid at room temperature with a very high vapor pressure and
due to this are not suitable to be measured with the DRS.
A graph comparing the inflection points of the 420 nm feature for TNT, DNT, DNB,
MNT, and NB is shown in Figure 5-29. It is noted that the inflection point for TNT is clearly at
longer wavelengths compared to the other nitrotoluene or nitrobenzene samples. In addition, the
position of the nitro groups on the benzene ring in reference to the methylene group also has an
81
effect. For example, 2, 6 DNT and 2 MNT have transitions closest to TNT. These molecules
have nitro groups located in the ortho- position adjacent to the methylene group.
In summary, the long wavelength shoulders found in the differential reflectograms of
TNT, RDX, HMX, PETN, and Tetryl are replicated in spectra taken with UV-Visible
transmission spectrophotometry of high concentration solutions. This needs to be emphasized
due to possible criticism that the observed features may be artifacts of DRS. In addition, these
results shine light on the reason why essentially no one else has found these UV and blue range
features. This is because very dilute solutions are routinely used in UV-Visible transmission
spectrophotometry where the long wavelength shoulders do not exist. As for use as a explosives
detection method, the UV-Visible transmission spectrophotometry is not applicable to standoff
detection and has a low sensitivity; in short DRS is clearly superior to UV-Visible
spectrophotometry.
5.8 Experiments Leading to Possible Answers for the Observed Transitions
The presence of the 420 nm feature in TNT has been established and shown to be from the
TNT and not an impurity or instrumental artifact. What remains to be explained is the physical
origin of this feature and the interaction with its environment.
5.8.1 Experimental Modifications of UV-Visible Transmission Measurements
As discussed above in Section 5.7 the large wavelength features observed in the DR have
also been seen in high concentration solutions of the energetic materials but blue shifted from the
differential reflectograms. The concentrations of the energetic material solutions were varied to
see the effect on the 420 nm transition. UV-visible transmission spectra of TNT in solution at
decreasing concentrations are shown in Figure 5-24 and 5-30. Figure 5-24 displays the raw
absorbance data of the solutions where the intensity of the 420 nm feature decreases gradually
with concentration to where it is no longer detected at 26 ppm. The molar absorbtivity has been

82
calculated using the Beer-Lambert law, Equation 2-3. The result is graphed in Figure 5-30. This
spectrum also demonstrates how the height of the 420 nm feature decreases with concentration
and shows clearly that the transition is no longer seen at smaller concentrations. Similar
behavior is observed in the other energetic materials and DNT, DNB, MNT, MNB, but not
PETN, see Figures 5-26. Fewer concentration variations were performed with these materials
but the trend is still observed.
Data analysis of the TNT solution concentration variation was performed by graphing the
absorption intensity at a specific wavelength defined by the inflection point for the highest
concentration solution, versus the solution concentration. Wavelengths near other spectral
features, namely 210, 300, and 385 nm were also graphed as intensity versus solution
concentration for comparison in Figure 5-31. The 385 nm graph has two regions of linearity, one
for the high concentrations to 850 ppm and one for the lower concentrations. A similar dual
linearity is seen for the 300 nm graph but the slope change is at a much lower concentration (213
ppm) in the 234 nm graph. It is important to emphasize that the absorbance for higher
concentrations in the 210 nm graph is above the sensitivity limit of the spectrometer. Therefore
no conclusions on the linear behavior can be made. According to the Beer-Lambert law the
intensity of an absorbance feature must vary linearly with the concentration of the measured
solution. A deviation from the linearity indicates that the absorbance feature is not due to a
single molecule but rather to a molecular complex with the solvent or other molecules.
In order to determine if a complex was formed with the solvent, TNT was put in solution
separately with several different solvents. The UV-visible transmission spectra for these
solutions with solvents of acetone, methanol, ethanol, isopropanol, water, and toluene are seen in
Figure 5-32. Figure 5-33 is a graph of the solvent polarity, given in Table 5-1, versus the
83
wavelength of the inflection point. There is no significant shift of the wavelength with the
polarity of the solvent and all points are within 5 nm of each other. The exceptions to this are
water (not shown in Figure 5-33) and ethanol. TNT has a low solubility in ethanol compared to
the other solvents and is sparingly soluble in water. In fact TNT crystals are observed floating
on the surface of the water indicating very little is dissolved in the water. It is noted that any
variation in the wavelength is not consistent with a particular change in polarity. Therefore it has
been shown that the 420 nm feature in TNT is not due to a molecular complex of the molecule
and the solvent. It is possible that the transition can be due to a molecular complex between two
of the same molecules.
5.8.2 Exposure of TNT to UV Light
Visual observation of aged TNT shows a brown color compared to the pale-yellow tint of
new prepared TNT. This will be investigated in more detail in the following experiments. It has
been shown in the literature that TNT may degrade with exposure to UV light104-106
. A TNT
sample was exposed to UV light in the DR instrument with the monochromator set at 200 and
also to 250 nm wavelength. As demonstrated in Figure 5-34, there was virtually no change in
the observed spectrum of the TNT sample with increasing exposure time to the UV light. The
power of the light source at these wavelengths was however, too small to be measured by the
power meter. In another experiment, TNT was exposed to sunlight behind a window for several
hours and up to 60 days. There was a decrease in the intensity of the 420 nm feature after
several hours as shown in Figure 5-35. A spectrum of the sunlight with and without involvement
of window glass, displayed in Figure 5-36, indicates that radiation by a wavelength longer than
250 nm may cause the decrease in the 420 nm feature. In regards to this, a TNT sample was
exposed to a defocused HeCd laser beam, which emits UV light at 325 nm, for varying amounts
of time, see Figure 5-37. The feature intensity at 420 nm decreases in size (height) with

84
increasing exposure time until at 4 minutes there is only a slight inflection and at 8 minutes there
is no distinguishable shoulder. Figure 5-38 compares the ratio of the normalized differential
reflectivity at 380 nm with that at 450 nm versus the HeCd laser exposure time. When the ratio
reaches a value of one, 380 nm and 450 nm are equal so there is no longer a feature in this range.
A significant drop in the ratio is seen between 15 and 30 seconds displaying an exponential
decrease with increasing time. The total decrease is about 21% in 1000 seconds.
There are several reactions that may be occurring in the sample. One of the first reactions
to consider, due to the crystal morphology of TNT, is optical traps. Optical traps occur when
photons are absorbed by the electrons in materials causing them to be raised to higher energy
levels and subsequently trapped in energy levels caused by defects in the crystal. These
electrons can not absorb any additional photons causing an absorption transition to no longer be
observed. These traps, like many defects present in crystals, can be annealed out and the
electrons can return to their ground state. To test this hypothesis, the irradiated TNT samples
were annealed at 40 to 75°C (the melting point of TNT is 82°C) in a low temperature oven for
varying amounts of time. The differential reflectograms of the annealed TNT samples are shown
in Figure 5-39. There is no observable increase of the 420 nm feature regardless of the time or
temperature of the annealing treatment. Figure 5-40 further demonstrates this by displaying the
380 to 450 nm normalized differential reflectivity ratio versus time for one temperature. A
control TNT sample that had not been irradiated was also annealed, Figure 5-41, with no
observable change in the 420 nm feature in the differential reflectogram. It is concluded that the
loss of the 420 nm feature due to exposure to UV light is essentially not due to optical traps.
Another reaction to consider is photolysis of the TNT molecule. It has been reported that
the photodissociation energy for the ring C-N bond is 3.2 eV or 488 nm104-106
. This results in the
85
severing of nitro groups from the ring structure. In order to examine this phenomenon, a TNT
sample was irradiated with the 457 and the 488 nm lines of an Ar ion laser. The 488 nm line is
the most powerful of the Ar laser with a laser power near that of the HeCd laser (21 mW)
whereas the 457 nm line is a secondary emission wavelength with a much lower power (0.57
μW). The 420 nm wavelength feature in the spectra of TNT irradiated with either the 457 or 488
nm laser line in Figure 5-42 does not change with increasing radiation time for either laser line.
This is more recognizable in Figure 5-43 where the ratio of 380 and 450 nm normalized
differential reflectivity is plotted versus the exposure time for the 488 nm laser line. The total
decrease is 6.95% from the first to second measurement which could be well within the error of
the measurement. From this data, the lower energy laser lines should be sufficient to cause
photodissociation of the C-N bond, but there is no significant change in the observed DRS
spectrum. Therefore it is proposed that the power of the 457 nm laser line is too low and the 488
nm line is on the borderline of the required energy therefore no photodissociation is occurring.
The reduction of TNT to DNT, MNT, or toluene should be observable in Fourier transform
infrared spectrometry of the irradiated sample. Changing of the functional group bonds and the
breaking of others should shift or decrease the intensity of the respective absorption bands.
Figure 5-44 displays the FTIR results of a control TNT sample and one that has been irradiated
by the 325 nm HeCd line for 16 minutes so that the 420 nm feature is no longer observed. The
FTIR bands of importance are the NO2 symmetric and asymmetric stretches88
at 1530 cm-1
and
1350 cm-1
. There is virtually no difference in the FTIR spectra of the two samples which
suggests that there is no appreciable change in bonding in the samples and therefore no
dissociation of the ring C-N bond. Due to the wavelength of the irradiation source (325 nm),
only the surface of the sample may be effected. The change in the surface layer is detected by

86
DR because it is a surface analytical technique that samples the first few atomic layers of a
material. Meanwhile in FTIR, the wavelengths are much longer so that the collected signal is
characteristic of the bulk material and dominates over the signal of the surface layer.
In order to confirm the products produced during the photolysis of the TNT samples by the
325 nm line of a HeCd laser, chemical analysis by HPLC/MS was performed. Samples of
control TNT (not irradiated), irradiated TNT with no 420 nm feature, and TNT irradiated in the
acetonitrile solution were characterized. The HPLC/MS results shown in Figure 5-45
demonstrate that for all samples no DNT or MNT was detected. The only molecules that were
present were TNT. This confirms that the process causing the disappearance of the 420 nm
feature is not due to photodissociation of the TNT molecule. However, the possible
photodissociation would occur predominately at the surface of the sample whereas HPLC/MS
analyzes the entire (bulk) of the substance. This is also visually observed. Only the outer layer
of exposed or aged TNT has a brown tint whereas the interior remains pale-yellow.
It is important to mention that it was shown in Section 5.6 that solid 2, 4 and 2, 6 DNT
have features in the 420 nm region although they are somewhat blue shifted from TNT. In other
words, creating a DNT molecule out of TNT may only slightly decrease the intensity of the
observed TNT feature. In summary, the cause for the brownish tine of aged and/or UV
irradiated TNT has not been completely clarified in this research. Other models and experiments
need to be designed for this.
5.9 Line Shape Analysis of Differential Reflectograms
A differential reflectogram does not immediately yield the absorption of a material. As
discussed in Section 4.1.2, only a line shape analysis of the DR reveals the wavelengths of the
electron transitions. Since spectral optical constants of TNT and other explosives are not readily
available, a simple graphical line shape analysis was instead performed which is based on Figure

87
4-2. This line shape analysis may not reveal the exact wavelength of a transition; instead, it may
vary only up to 10 nm. Figures 5-46 through 5-53 display the result of such a line shape analysis
that is , of ε2 (absorption) of TNT, RDX, HMX, Tetryl, PETN, 2,4 DNT, 2,6 DNT, and DNB.
These graphs can be used to make a more direct comparison with the model calculations
displayed in the next chapter. The wavelengths of the electron transitions, determined by this
line shape analysis, are shown for all of the investigated energetic materials in Table 5-2.

88
Figure 5-1. Differential reflectogram of a typical solid sample of dehydrated TNT on carbon
tape. The spectral features of interest are seen as a double peak near 250 nm, a small
peak at 300 nm, and a shoulder near 420 nm.

89
Figure 5-2. Differential reflectograms of common organic and inorganic materials on carbon tape
compared to TNT (A and B). There are no materials demonstrating the TNT spectral
feature near 400 nm. Many do display a feature near 250 nm. The individual curves
have been staggered for clarity.
A
B

90
Figure 5-3. Differential reflectograms of vegetation from several plants compared to that of
TNT. None of the vegetation curves display all of the features of TNT. Individual
curves have been staggered for clarity.
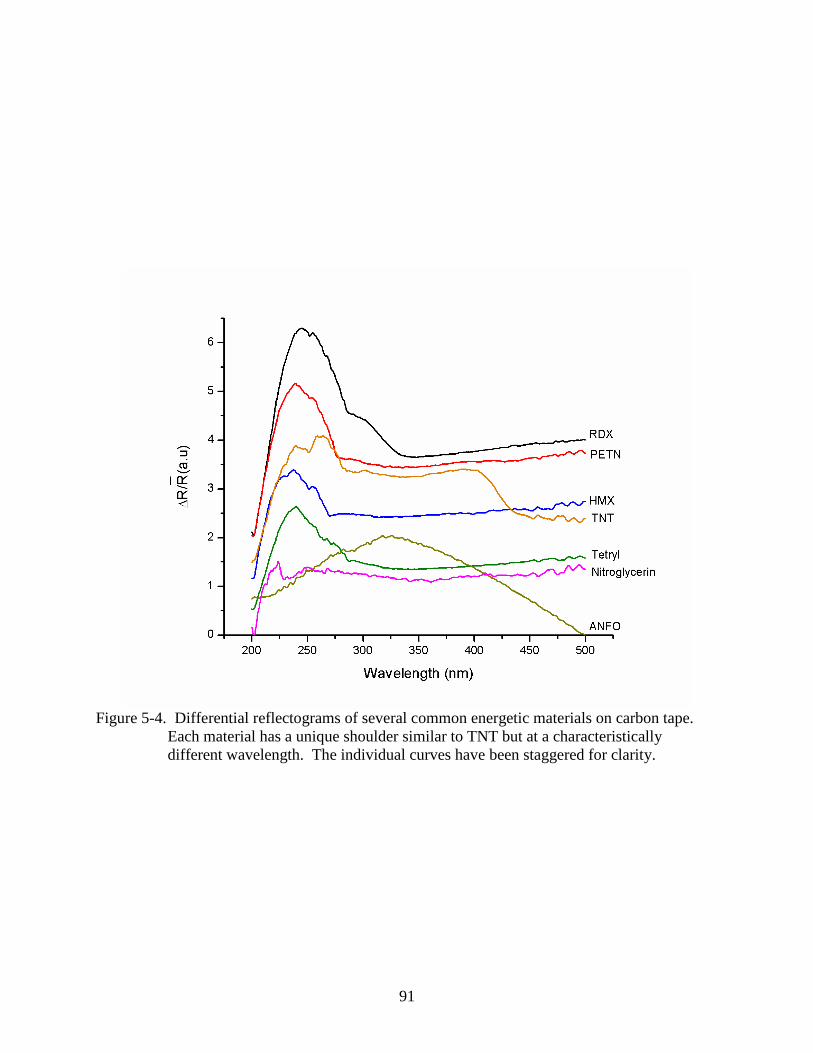
91
Figure 5-4. Differential reflectograms of several common energetic materials on carbon tape.
Each material has a unique shoulder similar to TNT but at a characteristically
different wavelength. The individual curves have been staggered for clarity.
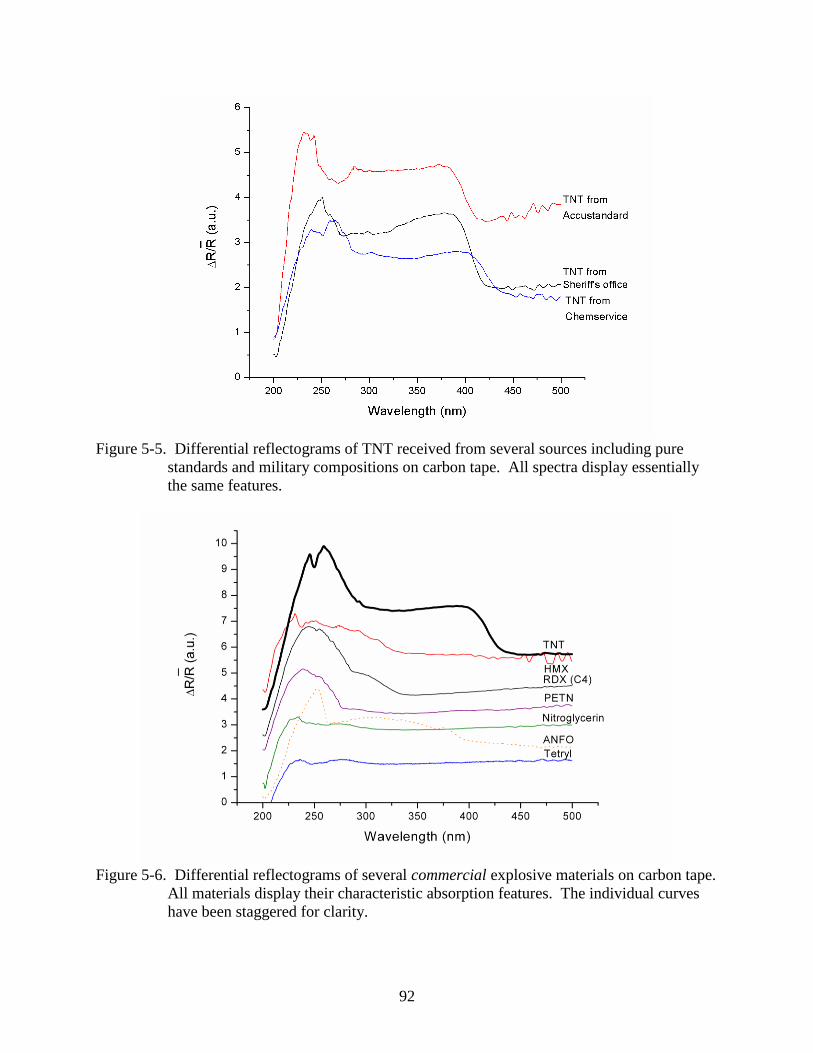
92
Figure 5-5. Differential reflectograms of TNT received from several sources including pure
standards and military compositions on carbon tape. All spectra display essentially
the same features.
Figure 5-6. Differential reflectograms of several commercial explosive materials on carbon tape.
All materials display their characteristic absorption features. The individual curves
have been staggered for clarity.

93
Figure 5-7. Differential reflectograms of TNT on carbon tape, recrystallized independently from
solution with different solvents. The 420 nm feature is displayed in all the
recrystallized materials.

94
Figure 5-8. Differential reflectograms of TNT on several different substrates. All are black in
color except where indicated. Individual spectra have been staggered for clarity.
Note that the 420 nm feature appears on all surfaces.
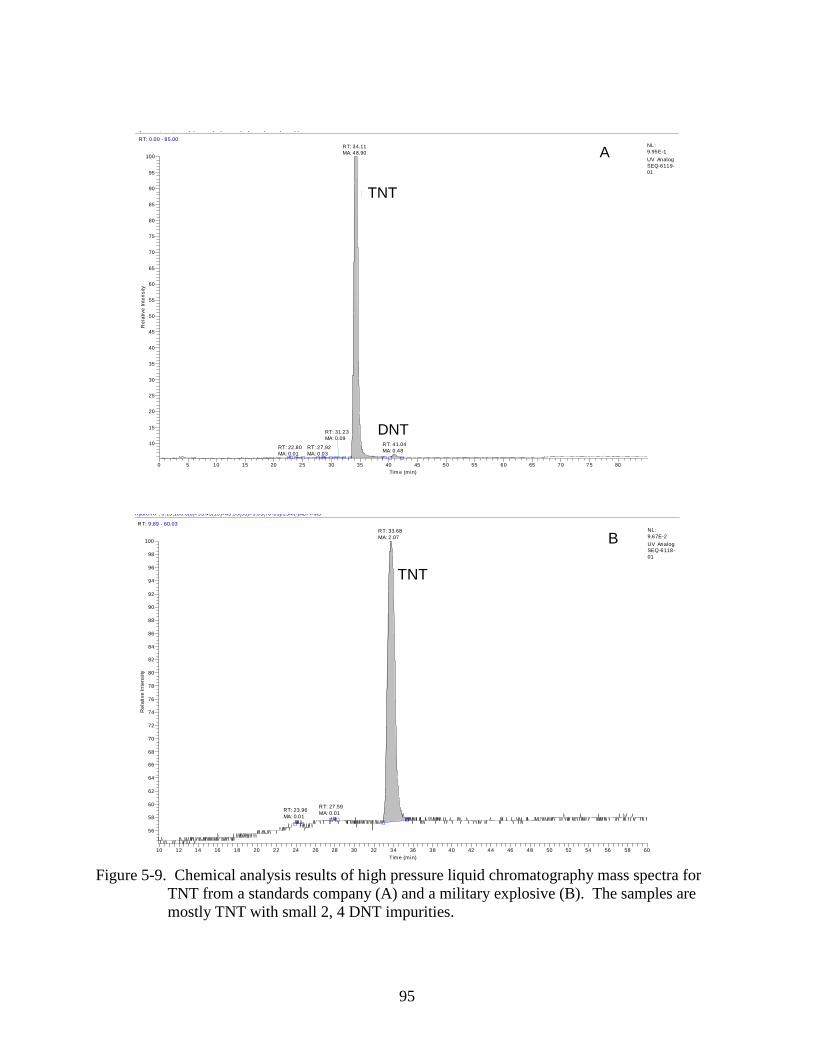
95
Figure 5-9. Chemical analysis results of high pressure liquid chromatography mass spectra for
TNT from a standards company (A) and a military explosive (B). The samples are
mostly TNT with small 2, 4 DNT impurities.
E:\0-Spec\0-Data\Seq-6119-01 04/11/06 08:40:56 AM Pure TNT, 1/10th dilution; 10 uL
Hydro-RP; 0.15;100:0(0)>55:45(15)>45:55(55)>5:95(70-85)/254/(-)ACPI-MS
RT: 0.00 - 85.00
0 5 10 15 20 25 30 35 40 45 50 55 60 65 70 75 80
Tim e (min)
10
15
20
25
30
35
40
45
50
55
60
65
70
75
80
85
90
95
100
Re
lative
In
ten
sity
TNT
DNT
RT: 34.11
MA: 48.90
RT: 41.04
MA: 0.48RT: 22.80
MA: 0.01
RT: 27.92
MA: 0.03
RT: 31.23
MA: 0.09
NL:
9.95E-1
UV Analog
SEQ-6119-
01
A
TNT
DNT
E:\0-Spec\0-Data\Seq-6118-01 04/10/06 02:30:26 PM Com mercial TNT, 1/100th Dilution; 10 uL
Hydro-RP; 0.15;100:0(0)>55:45(15)>45:55(55)>5:95(70-85)/254/(-)ACPI-MS
RT: 9.89 - 60.03
10 12 14 16 18 20 22 24 26 28 30 32 34 36 38 40 42 44 46 48 50 52 54 56 58 60
Time (min)
56
58
60
62
64
66
68
70
72
74
76
78
80
82
84
86
88
90
92
94
96
98
100
Re
lative
In
ten
sity
RT: 33.68
MA: 2.07
RT: 27.59
MA: 0.01RT: 23.96
MA: 0.01
NL:
9.67E-2
UV Analog
SEQ-6118-
01
TNT
B

96
Figure 5-10. Differential scanning calorimetry spectrum of TNT, recrystallized from an
acetonitrile solution.
Figure 5-11. Spectrum from x-ray spectrometry of solid TNT recrystallized from an acetonitrile
solution. Significant lattice planes have been labeled indicating that both the
monoclinic and orthorhombic phases are present.

97
Figure 5-12. Optical micrographs of the measured energetic materials at 20X magnification. A.
TNT. B. RDX. C. HMX. D. PETN. E. Tetryl.
AA
CC
BB
50 μm
50 μm50 μm
DD50 μm
EE50 μm

98
Figure 5-13. Optical profilometry using false color to indicate height from the base plane (pale
yellow in color) of a solid TNT sample recrystallized from an acetonitrile solution.
Figure 5-14. Differential reflectograms of several materials with cyclic or ring molecular
structures on carbon tape. Only the energetic materials display long wavelength
shoulders. The individual curves have been staggered for clarity.

99
Figure 5-15. Molecular structures of the materials with cyclic molecular structures shown in
Figure 5-12.
Figure 5-16. Differential reflectograms of PETN mixed with TNT (A) and C-4 mixed with TNT
(B) on carbon tape. The materials retain their individual absorption features in the
mixtures.
CH3 NO2
NO2
O2N
CH3 NO2
NO2
O2N
CH=CH3CH=CH3
Polystyrene
OO
Epoxy
N
NN
N
O
OHHO
S*
H3C
NH2
HOOC
N
NN
N
O
OHHO
S*
H3C
NH2
HOOC
S-adensoyl methionine
(S-AME)
Napthalene
(Mothball)
Tritnitrotoluene
(TNT)
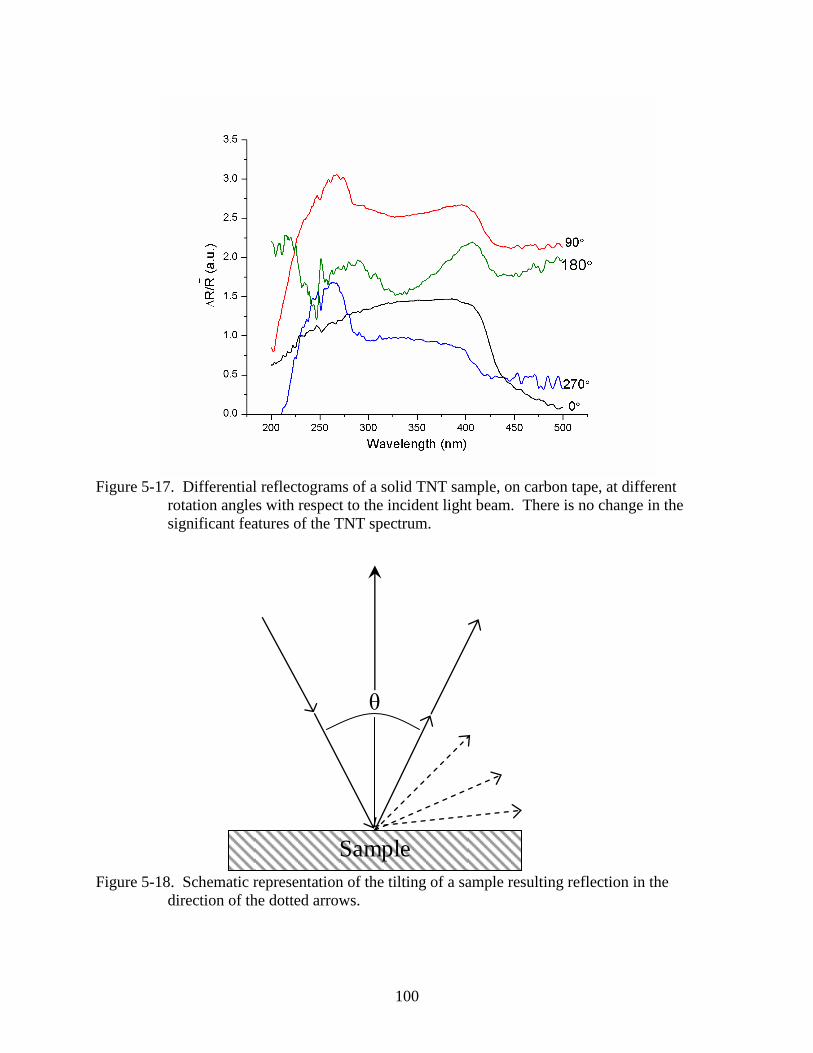
100
Figure 5-17. Differential reflectograms of a solid TNT sample, on carbon tape, at different
rotation angles with respect to the incident light beam. There is no change in the
significant features of the TNT spectrum.
Figure 5-18. Schematic representation of the tilting of a sample resulting reflection in the
direction of the dotted arrows.
θ
Sample
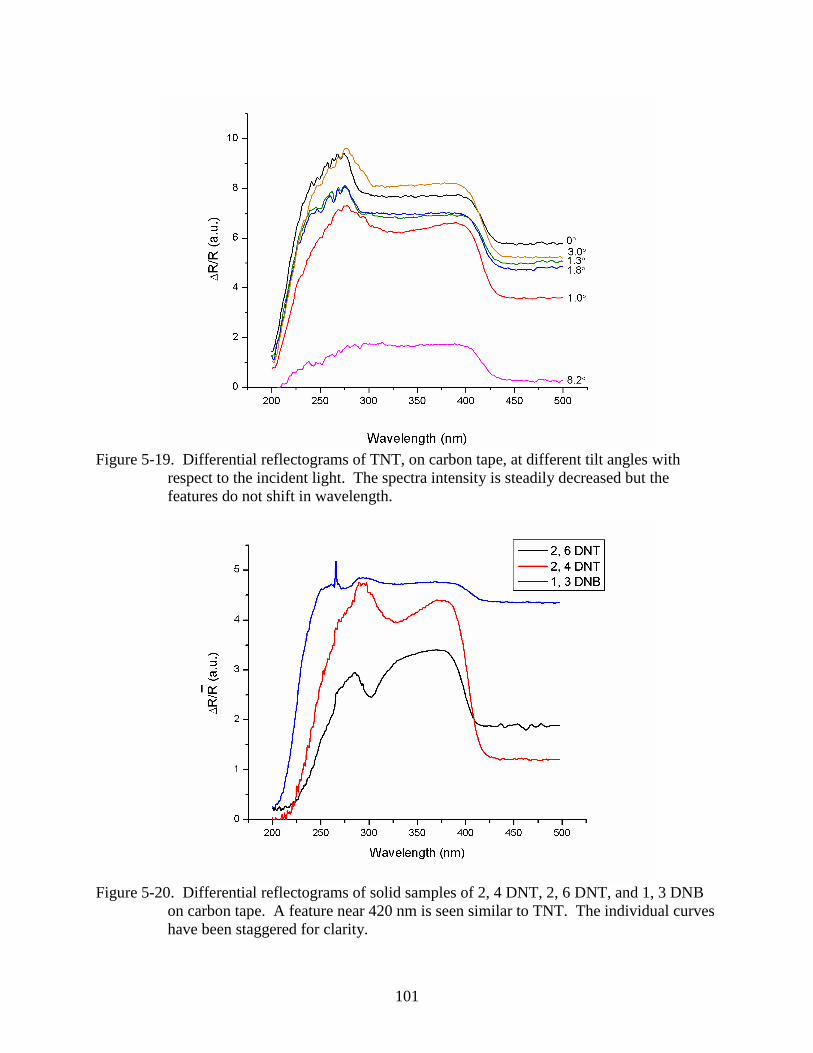
101
Figure 5-19. Differential reflectograms of TNT, on carbon tape, at different tilt angles with
respect to the incident light. The spectra intensity is steadily decreased but the
features do not shift in wavelength.
Figure 5-20. Differential reflectograms of solid samples of 2, 4 DNT, 2, 6 DNT, and 1, 3 DNB
on carbon tape. A feature near 420 nm is seen similar to TNT. The individual curves
have been staggered for clarity.

102
Figure 5-21. The wavelength of the inflection point of the 400 nm feature for TNT, 2, 4 DNT, 2,
6 DNT, and 1, 3 DNB. There is some difference in the wavelength of these samples.
Figure 5-22. Reflection spectrum of solid TNT on the reflection stage of a Perkin Elmer UV-
Visible spectrophotometer. The 420 nm shoulder is displayed in the spectrum. A
control measurement (no sample on stage) is added for comparison.
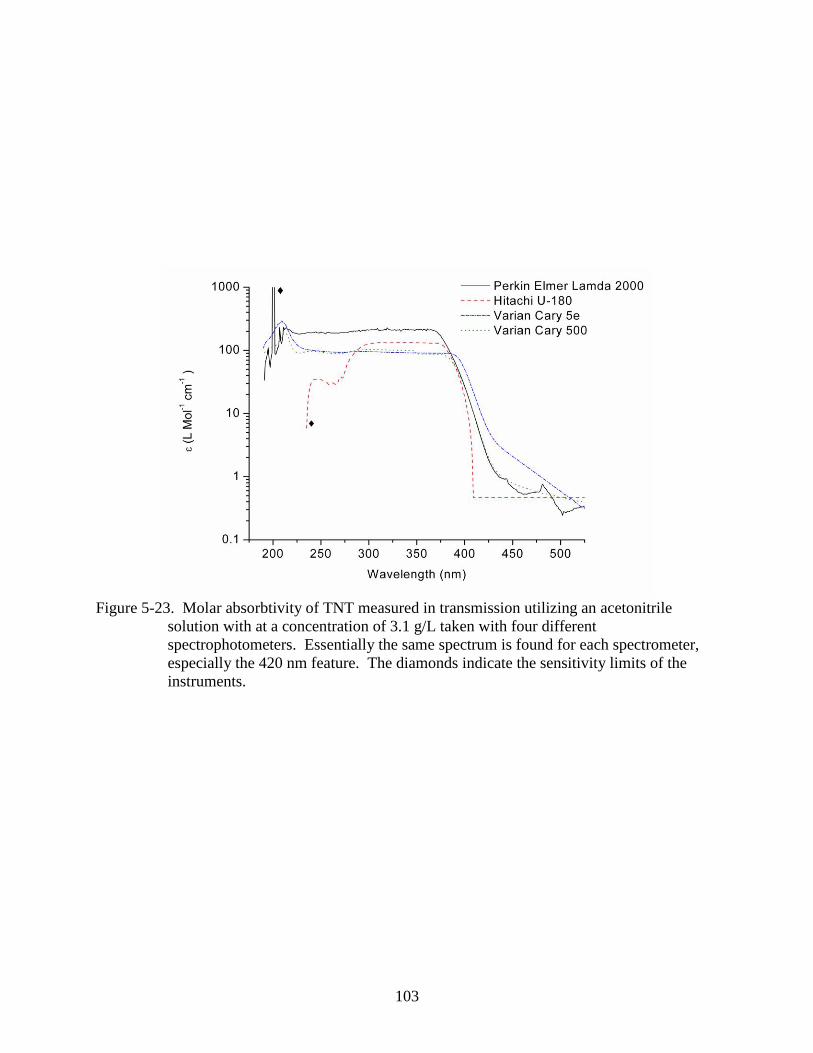
103
Figure 5-23. Molar absorbtivity of TNT measured in transmission utilizing an acetonitrile
solution with at a concentration of 3.1 g/L taken with four different
spectrophotometers. Essentially the same spectrum is found for each spectrometer,
especially the 420 nm feature. The diamonds indicate the sensitivity limits of the
instruments.

104
Figure 5-24. Absorbance spectra of varying concentrations of TNT in acetonitrile solution
measured by a Varian UV-visible spectrophotometer. As the concentration is
decreased the 420 nm shoulder appears to blue shift and decrease in intensity until it
is no longer observed. The shaded region indicates a spectral artifact caused by
competing absorbancies of the solvent and sample. This shaded area in this and the
following figures of UV-Visible transmission spectrometry should therefore be
ignored or at least treated with some caution.
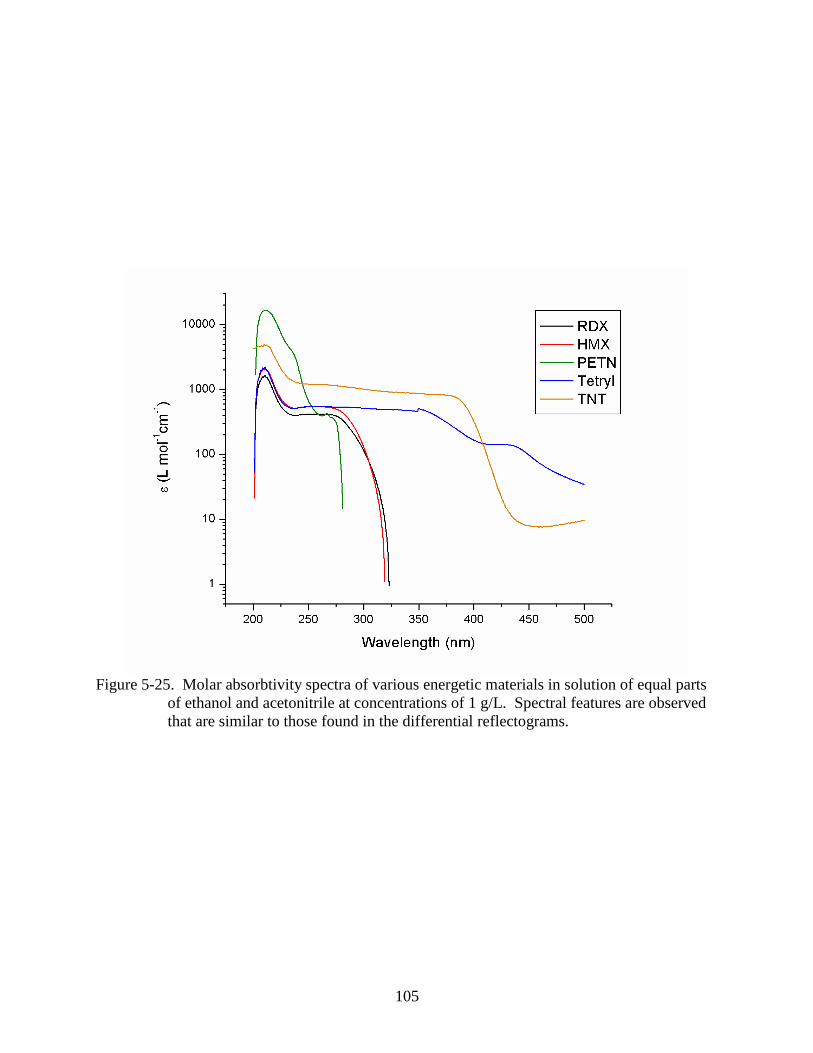
105
Figure 5-25. Molar absorbtivity spectra of various energetic materials in solution of equal parts
of ethanol and acetonitrile at concentrations of 1 g/L. Spectral features are observed
that are similar to those found in the differential reflectograms.
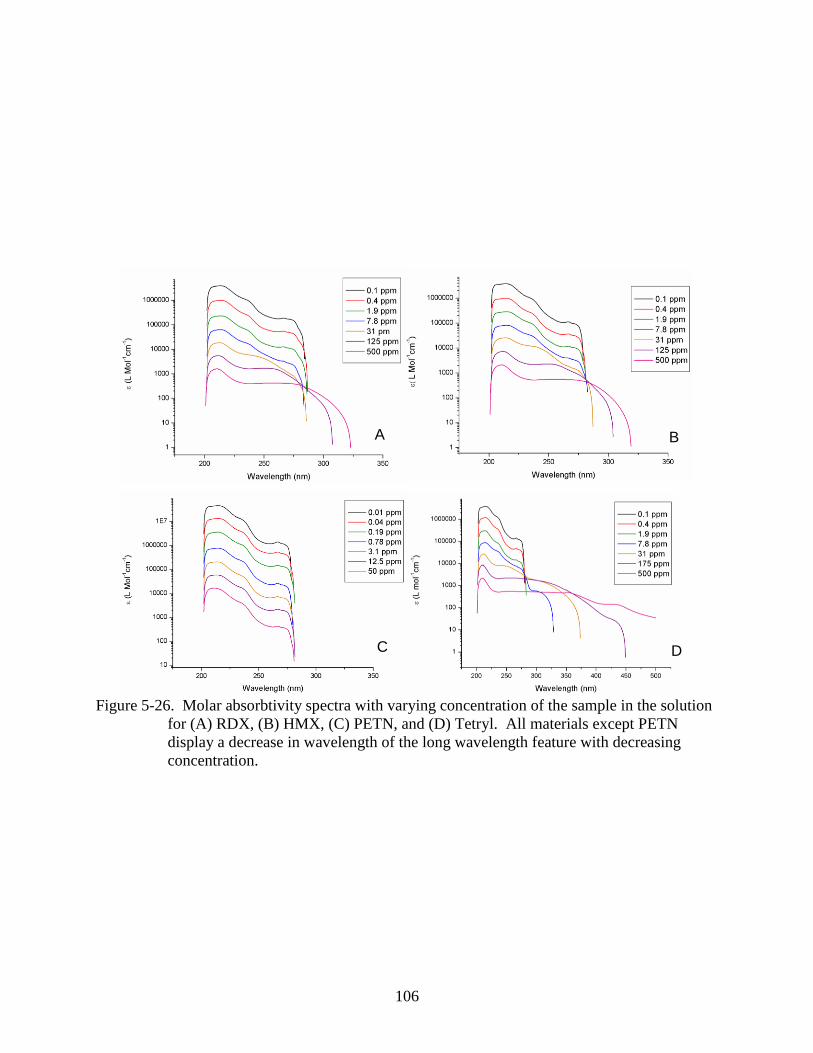
106
Figure 5-26. Molar absorbtivity spectra with varying concentration of the sample in the solution
for (A) RDX, (B) HMX, (C) PETN, and (D) Tetryl. All materials except PETN
display a decrease in wavelength of the long wavelength feature with decreasing
concentration.
A
C
B
D
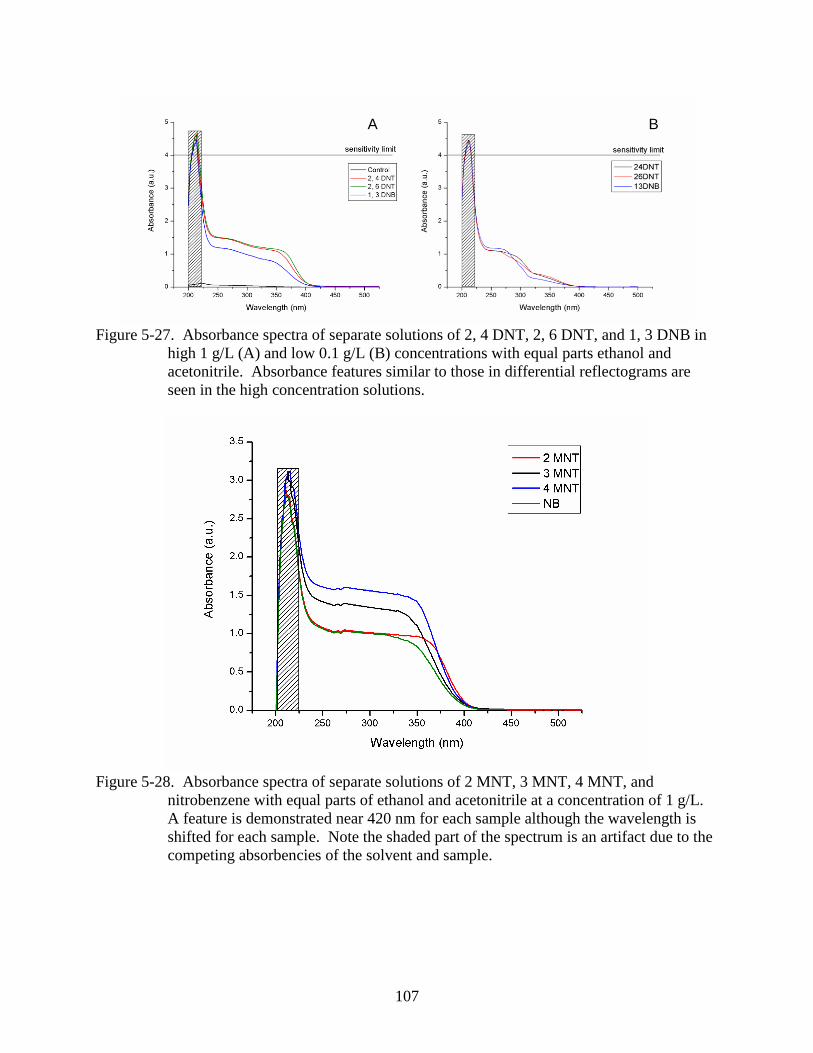
107
Figure 5-27. Absorbance spectra of separate solutions of 2, 4 DNT, 2, 6 DNT, and 1, 3 DNB in
high 1 g/L (A) and low 0.1 g/L (B) concentrations with equal parts ethanol and
acetonitrile. Absorbance features similar to those in differential reflectograms are
seen in the high concentration solutions.
Figure 5-28. Absorbance spectra of separate solutions of 2 MNT, 3 MNT, 4 MNT, and
nitrobenzene with equal parts of ethanol and acetonitrile at a concentration of 1 g/L.
A feature is demonstrated near 420 nm for each sample although the wavelength is
shifted for each sample. Note the shaded part of the spectrum is an artifact due to the
competing absorbencies of the solvent and sample.
A B

108
Figure 5-29. Wavelength of the inflection point for the 400 nm feature taken with an UV-Visible
transmission spectophotometer of solutions of TNT, 2, 4 DNT, 2, 6 DNT, 1, 3 DNB,
2 MNT, 3 MNT, 4 MNT, and nitrobenzene with their respective solvents at a
concentration of 1 g/L. There is an observed dependence of the wavelength on the
sample. The different color regions indicated the number of nitro groups present in
the molecule.(compared to Figures 5-25, 5-27, and 5-28)
3 NO2 2 NO2 1 NO2
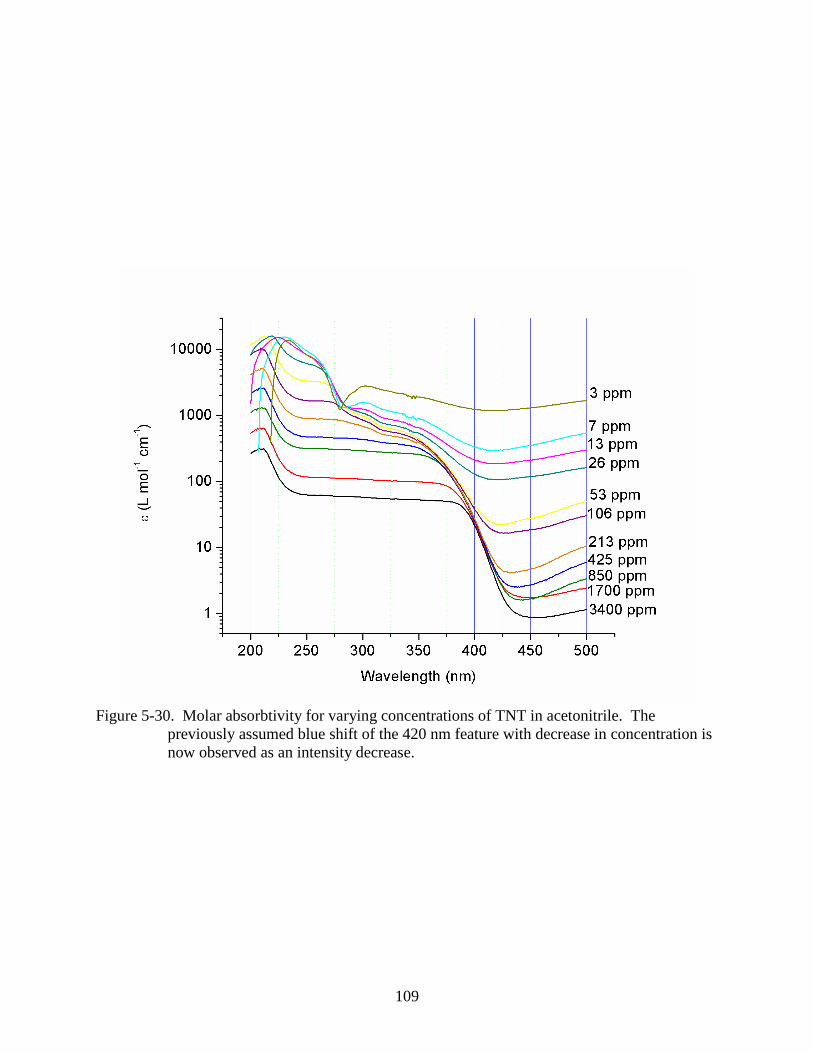
109
Figure 5-30. Molar absorbtivity for varying concentrations of TNT in acetonitrile. The
previously assumed blue shift of the 420 nm feature with decrease in concentration is
now observed as an intensity decrease.
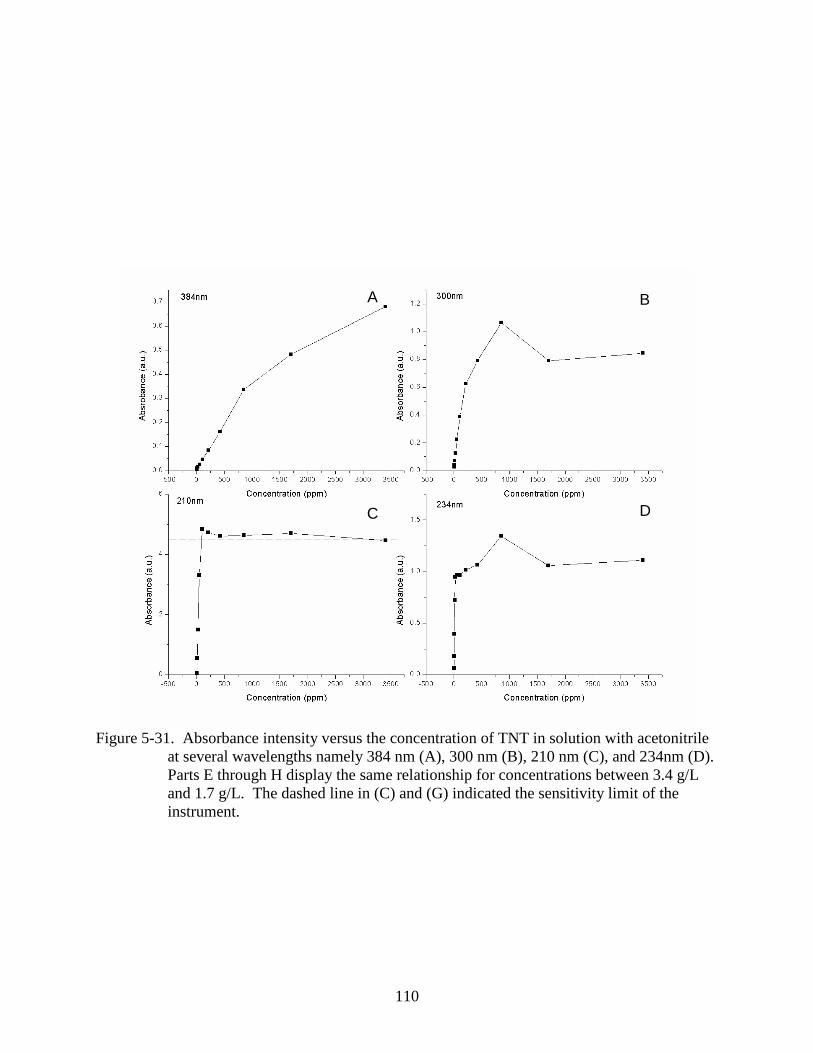
110
Figure 5-31. Absorbance intensity versus the concentration of TNT in solution with acetonitrile
at several wavelengths namely 384 nm (A), 300 nm (B), 210 nm (C), and 234nm (D).
Parts E through H display the same relationship for concentrations between 3.4 g/L
and 1.7 g/L. The dashed line in (C) and (G) indicated the sensitivity limit of the
instrument.
A
DC
B
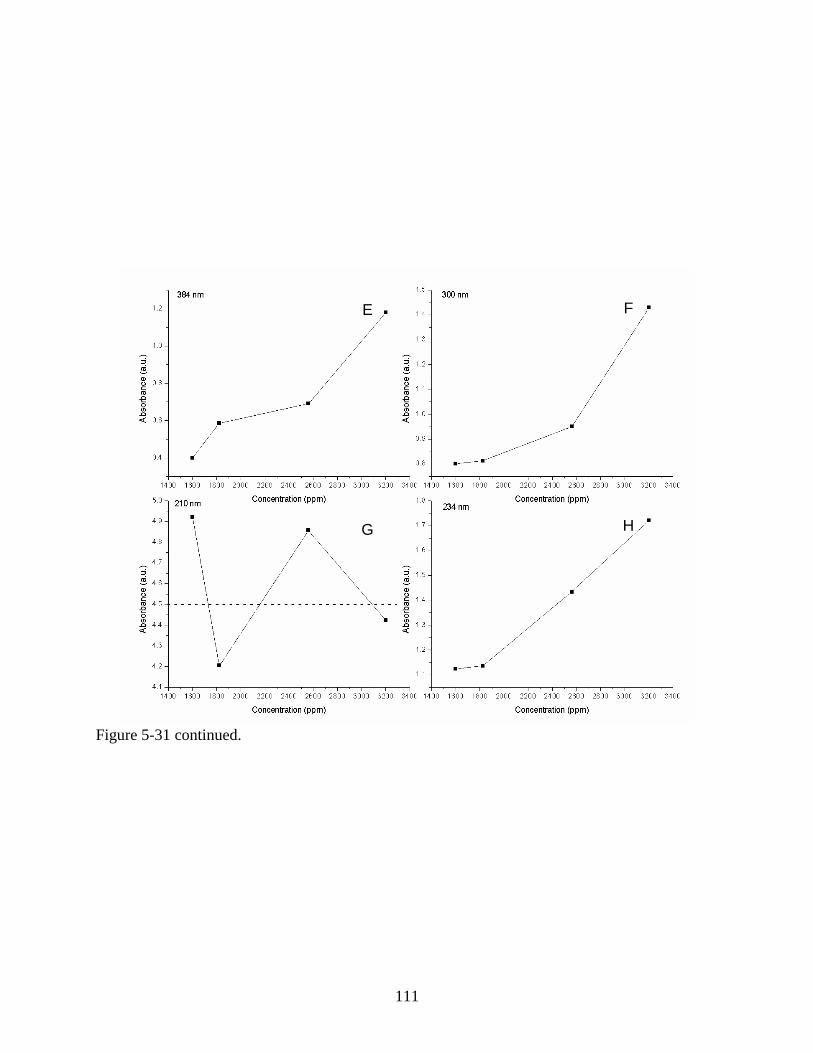
111
Figure 5-31 continued.
E
HG
F
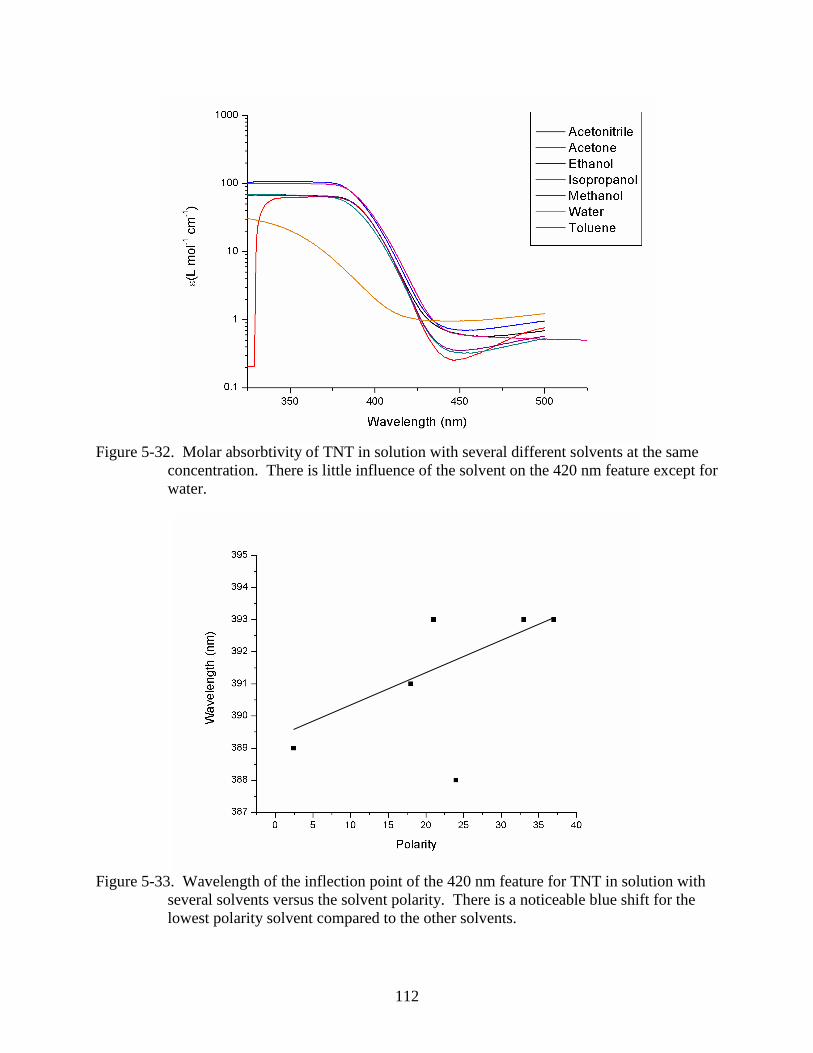
112
Figure 5-32. Molar absorbtivity of TNT in solution with several different solvents at the same
concentration. There is little influence of the solvent on the 420 nm feature except for
water.
Figure 5-33. Wavelength of the inflection point of the 420 nm feature for TNT in solution with
several solvents versus the solvent polarity. There is a noticeable blue shift for the
lowest polarity solvent compared to the other solvents.

113
Figure 5-34. Differential reflectograms of solid TNT with increasing time of exposure to the
monochromated 200 nm (A) and 250 nm (B) light of a high pressure Xe lamp. There
was virtually no change in the observed spectra with increased exposure.
Figure 5-35. Differential reflectometry of a solid TNT sample exposed to the sun at increasing
time intervals (A) short term and (B) long term. There is a noticeable decrease in
intensity of the 420 nm feature after a very short time.
A B
A B
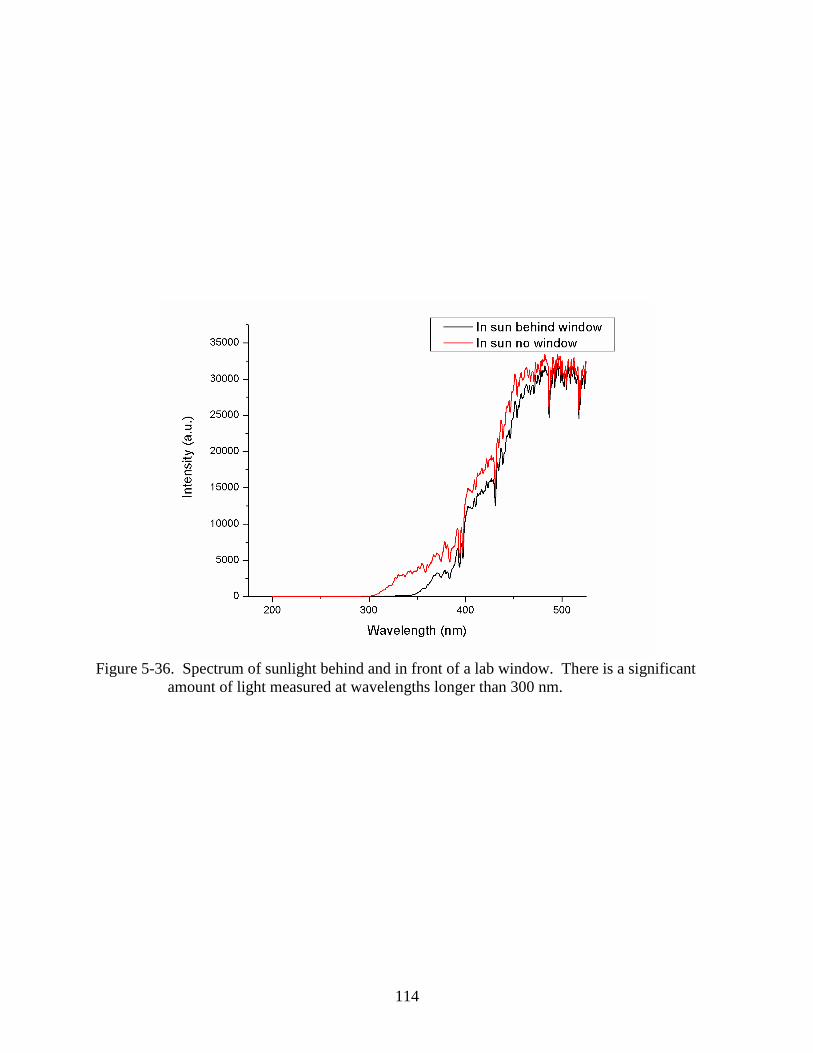
114
Figure 5-36. Spectrum of sunlight behind and in front of a lab window. There is a significant
amount of light measured at wavelengths longer than 300 nm.

115
Figure 5-37. Differential reflectograms of solid TNT with increasing time of exposure to the 325
nm line of a defocused HeCd laser. After several minutes the 420 nm feature is
significantly decreased in intensity.
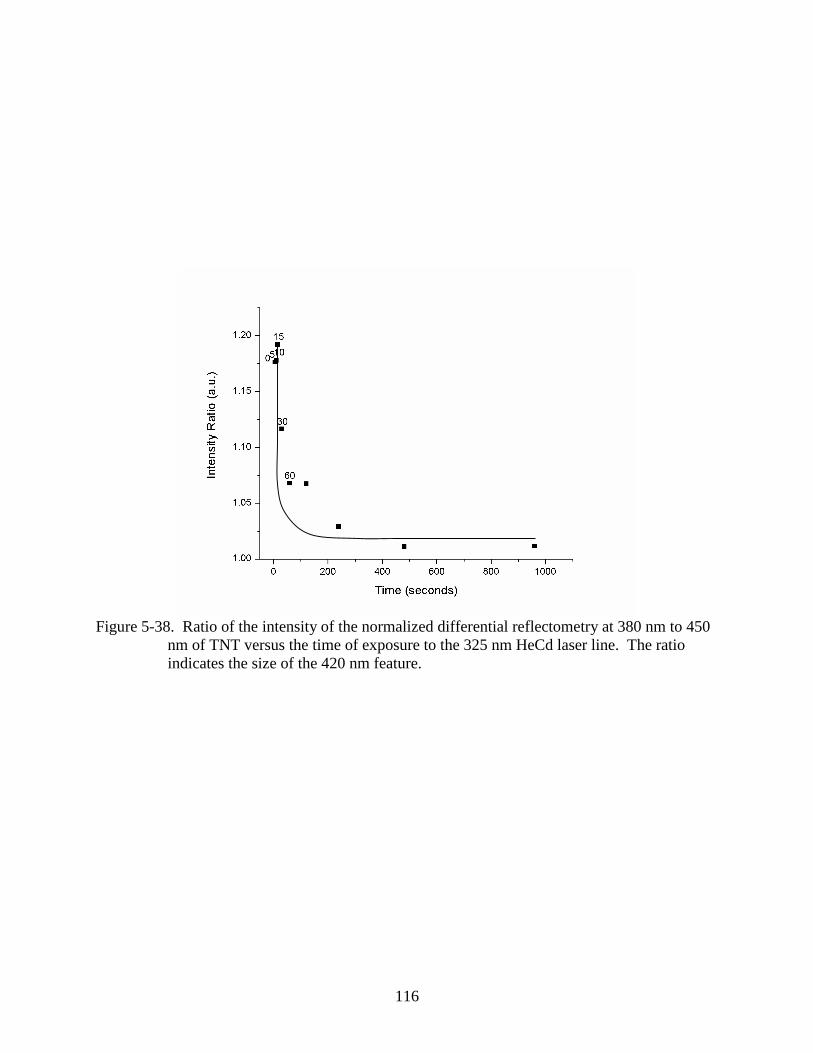
116
Figure 5-38. Ratio of the intensity of the normalized differential reflectometry at 380 nm to 450
nm of TNT versus the time of exposure to the 325 nm HeCd laser line. The ratio
indicates the size of the 420 nm feature.

117
Figure 5-39. Differential reflectograms of solid TNT that has been irradiated for 16 minutes with
the 325 nm HeCd laser line followed by annealing for various times at 45°C. There is
no restoration of the 420 nm feature due to increased annealing times.
Figure 5-40. Ratio of the normalized differential reflection intensity at 380 nm and 450 nm of
TNT that has been irradiated with the 325 nm line of the HeCd laser for 16 minutes
The samples have been subsequently annealed for various times at 45°C. Asterisks
indicate samples annealed at 75°C.

118
Figure 5-41. Differential reflectograms of solid TNT that has not been exposed to a UV laser
versus annealing time at 45°C. There is virtually no change in the observed spectra
with increased annealing time.
Figure 5-42. Differential reflectograms of solid TNT with increasing time of exposure to the 457
nm (A) and 488 nm (B) lines of an Ar ion laser. There is no distinguishable decrease
in the 420 nm feature with increasing exposure time.
A B

119
Figure 5-43. Ratio of the normalized differential reflection at 380 and 450 nm of solid TNT
versus increasing time of exposure to the 488 nm line of an Ar ion laser. Compare to
Figure 5-38 where exposure to a HeCd laser (325 nm ) is shown.

120
Figure 5-44. Fourier transform infrared spectrometry of solid TNT on stainless steel with
and without 16 minutes of exposure to the 325 nm line of a HeCd laser. There is not a noticeable shift in the absorption bands or a large decrease in intensity that would indicate a bonding change.
Figure 5-45. Chemical analysis results by high pressure liquid chromatography and mass spectrometry. The expected peaks (from constants) for DNT (A), MNT (B), and the measured spectrum for UV irradiated TNT (C).
0 5 10 15 20 25 30 35 40 45 50 55 60 65 70 75 80 85Tim e (m in)
0
50
100
Rel
ativ
e In
tens
ity
0
50
100
0
50
100
0
Expected m /z 181 [M-H]- of DNTNOT DETECTED
36.86181.2
Expected m /z 136 [M-H]- of NTNOT DETECTED
36.45135.8
MW 227TNT
RT: 36.62BP: 0.0
TNT
Time (min)
A
B
CRel
ativ
e In
tens
ity
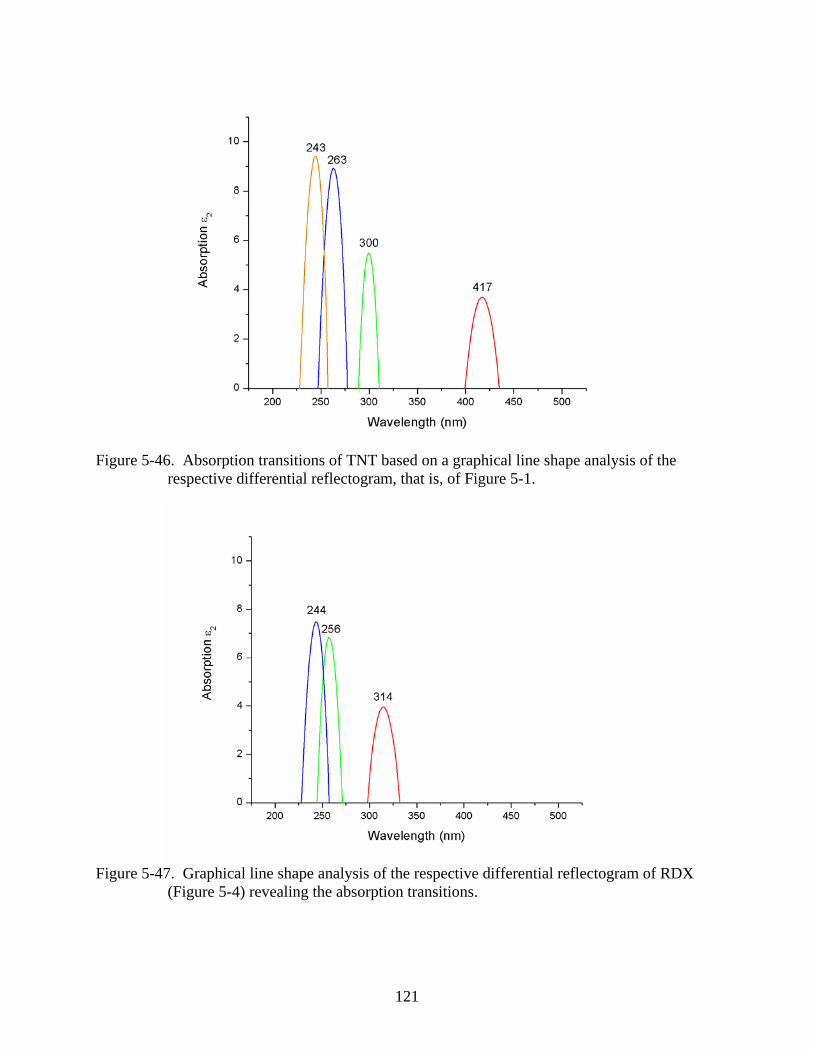
121
Figure 5-46. Absorption transitions of TNT based on a graphical line shape analysis of the respective differential reflectogram, that is, of Figure 5-1.
Figure 5-47. Graphical line shape analysis of the respective differential reflectogram of RDX (Figure 5-4) revealing the absorption transitions.

122
Figure 5-48. Absorption transitions of PETN based on graphical line shape analysis of the respective differential reflectogram, that is, of Figure 5-4.
Figure 5-49. Graphical line shape analysis of the respective differential reflectogram of HMX (Figure 5-4) giving the absorption transitions.

123
Figure 5-50. Absorption transitions of Tetryl based on graphical line shape analysis of the respective differential reflectogram, that is, of Figure 5-4.
Figure 5-51. The absorption transitions of 2, 6 DNT found using graphical line shape analysis of the respective differential reflectogram that is Figure 5-4.
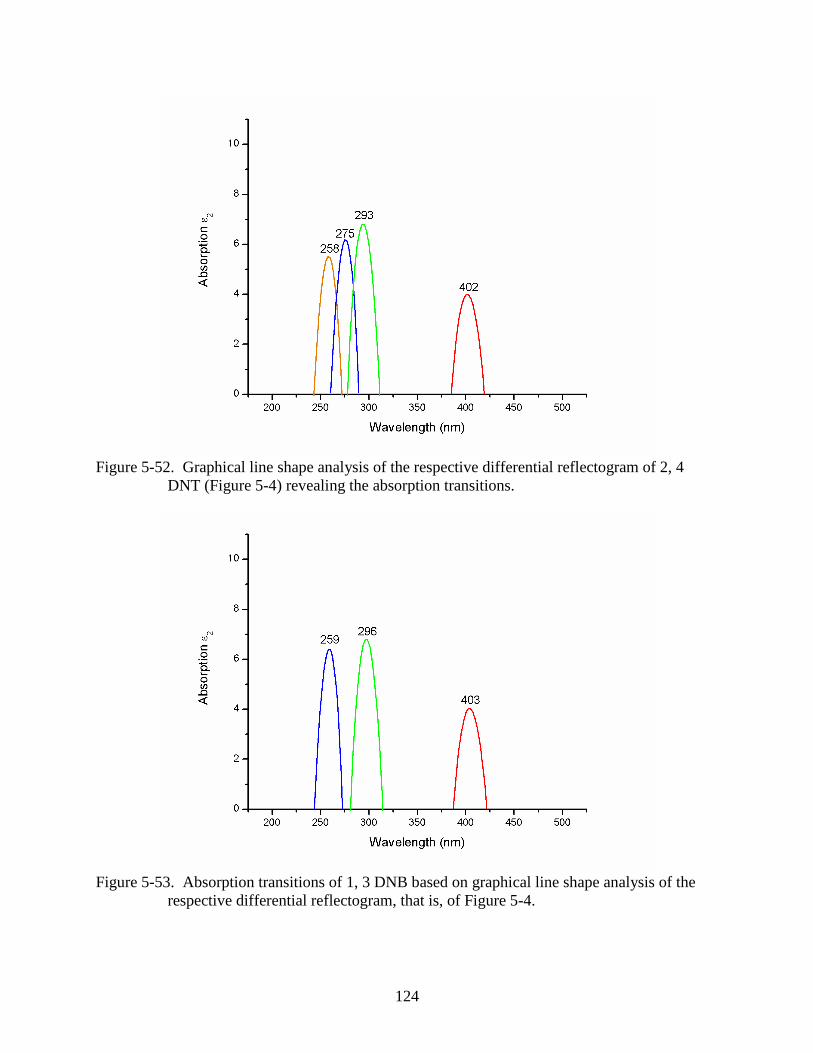
124
Figure 5-52. Graphical line shape analysis of the respective differential reflectogram of 2, 4
DNT (Figure 5-4) revealing the absorption transitions.
Figure 5-53. Absorption transitions of 1, 3 DNB based on graphical line shape analysis of the
respective differential reflectogram, that is, of Figure 5-4.

125
Table 5-1. Polarities of the solvent used in UV-Visible transmission spectrophotometry.
Solvent Polarity
Acetone 21
Ethanol 24
Acetonitrile 37
Isoproponal 18
Methanol 33
Toluene 2.4
Table 5-2. Electron transitions of various energetic materials determined by the graphical line
shape analysis of the differential reflectograms.
Energetic
Material
First transition
(nm)
Second transition
(nm)
Third transition
(nm)
Fourth
transition (nm)
TNT 417 300 263 243
RDX 314 256 244
PETN 308 285 236
HMX 276 241
Tetryl 276 241
2, 6 DNT 397 286 270 254
2, 4 DNT 402 293 275 258
1, 3 DNB 403 296 259
126
CHAPTER 6
COMPUTATIONAL CHEMISTRY RESULTS
The experimental results discussed in Chapter 5 give a reasonable idea of where the
characteristic differential reflectogram traits may originate. Moreover, computational chemistry
is a tool that can assist in discovering almost exactly where the features are originating and under
what circumstances they can occur103
. As outlined in Section 4.3 the ZINDO method was
utilized for this task except where noted.
6.1 Single Isolated Molecule of TNT
The computational analysis began with modeling a simple system of a single isolated TNT
molecule drawn into the user interface and optimized using PM3 geometry. The calculated
molecular orbital transitions are shown in Figure 6-1 as the wavelength versus the oscillator
strength. Oscillator strength is an indication of the probability of the transition and subsequently
the intensity of the absorption as explained in Section 3.2. Transitions that are forbidden in that
the oscillation strength is zero, are indicated in the graphs with an asterisk at the wavelength of
the transition. As can be seen in Figure 6-1, most of the molecular orbital (MO) transitions are at
wavelengths smaller than 310 nm. Further, a forbidden transition is located at 460 nm. For
comparison, one monoclinic molecule A was drawn using the fractional coordinates. The
geometry was optimized using the PM3 method and the resulting molecular orbital transitions
were calculated. The pertinent MO transitions versus the oscillator strength are shown in Figure
6-2 and are identical to those in Figure 6-1. A modeled absorbance spectrum based on this
calculation is shown in Figure 6-3 with six features highlighted. The molecular orbitals that
correspond to these transitions are displayed in Figure 6-4. The forbidden transition does not
appear in Figure 6-3 because such transitions are not included in modeled spectra. A small
intensity transition is observed near 300 nm where Figure 6-4 displays the molecular orbitals
127
mostly involved are the nitro groups. One orthorhombic molecule A is also drawn and
optimized, with the same results as the other two molecules, see Figure 6-5.
In order to compliment and confirm the calculated results by ZINDO, a time dependent
density functional theory (TDDFT) calculation of a single TNT molecule was also performed.
The molecule was geometry optimized and the MO transitions were calculated (Figure 6-6).
Figure 6-7 displays the MO energies versus occupancy that agree quite well with the ZINDO
calculations to further prove this point.
6.2 One Isolated TNT Molecule from Monoclinic and Orthorhombic Crystals
The molecular crystal structure of TNT was discussed in Section 2.2.1 as being monoclinic
or orthorhombic at room temperature. A single TNT molecule from each of the molecular
crystal structures were entered into the program using the calculated fraction coordinates. The
molecular geometry from the fractional coordinates is termed the current geometry. Molecules
of both conformations A and B for each crystal structure (see Table 2.4) were modeled
separately. The calculated MO transitions for conformation A are shown in Figure 6-8 for
monoclinic and Figure 6-9 for the orthorhombic structure. There are transitions near 420 nm in
both conformation A molecules with small oscillator strengths. A modeled absorbance spectrum
for the MO transitions for the monoclinic conformation A molecule is given in Figure 6-10 with
five transitions highlighted; corresponding molecular orbitals participating in these transitions
are depicted in Figure 6-11. It can be seen that all the long wavelength features originate from
transitions within the NO2 groups. The calculated MO transitions for the B conformation of the
molecules from both crystals are displayed in Figures 6-12 and 6-13. The longest wavelength
transition is at 360 nm for the monoclinic crystal and 370 nm for the orthorhombic. This result
demonstrates the effect of the difference in torsion angles of the NO2 groups in the A and B
conformations.

128
6.3 Two Isolated TNT Molecules from the Monoclinic and Orthorhombic Crystals
A pair of A and B molecules were put into the user interface using fractional coordinates
so that the pair of molecules appears just as they would in an ideal crystal. Figure 6-14 shows
the molecular orbital transitions in the monoclinic crystal without geometry optimization where
the longest wavelength transition is found to be at 320 nm. The majority of the MO transitions
occur between 275 nm and 300 nm and near 200nm which is similar to a combination of the
individual molecules A and B MO transitions. The exception is that no transitions appear above
320 nm. When the geometry of the molecular pair is optimized, the A molecule becomes nearly
perpendicular to the benzene plane. The resulting MO transitions are similar to the non-
optimized ones where many transitions occur near 200 nm and 275 nm, see Figure 6-15.
However, there is a weak oscillator strength transition near 350 nm.
Molecular pairs of A and B molecules for the orthorhombic structure were also modeled.
The non-optimized molecular pair has MO transitions shown in Figure 6-16 that are quite similar
to the non-optimized monoclinic pair. Several MO transitions appear in the 200 nm region and
between 275 nm and 300 nm with the longest wavelength transition at 300 nm. Optimization of
the molecular pair causes a weak MO transition at 360 nm and a reduction in the MO transitions
near 275 nm, see Figure 6-17. This behavior is comparable to the monoclinic molecular pair.
The treatment of the molecular pair by ZINDO raises questions to how it considers the pair
of molecules. This is observed where the 450 nm MO transition of the A molecule does not
appear in the pair but several of the other transitions are present. Therefore time dependant
density functional theory (TDDFT) and density functional theory (DFT) calculations were
performed to determine the energy and occupation of the molecular orbitals. The calculation
using TDDFT was performed on an in plane pair of monoclinic molecules similar to Figure 6-15.
Results of this calculation (Figure 6-18) are very similar to ZINDO where the longest

129
wavelength transition is near 320 nm, although the transition is forbidden in contrast to the
ZINDO results. In addition the energy of the molecular orbitals of two molecules was calculated
using DFT and were compared in Figure 6-19 to the same calculations performed by ZINDO
method INDO/1. There is virtually no difference between the occupied molecular orbital
energies of the single molecule and pair in both the ZINDO and DFT calculations. The
unoccupied molecular orbitals of the ZINDO and DFT calculations have higher energies for the
single molecule than the pair, but only for the highest energy molecular orbitals which are most
likely not involved in the lower energy or long wavelength transition of interest.
6.4 Several (more than two) Molecules Involving Monoclinic and Orthorhombic Crystals
In consideration of the above calculations, increasing numbers of TNT molecules were
added into the MO transition calculations in ZINDO. The number of monoclinic A and B
molecules were increased and calculated separately and are summarized in Figures 6-20 and 6-
21 as the longest wavelength MO transition versus the number of molecules. It is observed that
as the number of molecules is increased the wavelength of the longest transition decreased (blue
shift). The calculated results for the orthorhombic molecules are summarized in Figures 6-22
and 6-23. A similar trend as the monoclinic molecules is observed where the wavelength of the
longest wavelength MO transition decreases with increasing number of molecules. For both the
monoclinic and orthorhombic crystals, the longest wavelength MO transition reaches a point
after which it remains constant. Therefore it is assumed that as more molecules are added the
wavelength of the transition will no longer decrease significantly nor will it increase to 420 nm.
6.5 Entire Molecular Crystals of TNT: Monoclinic and Orthorhombic
The entire unit cell of both the monoclinic and orthorhombic molecular crystals contains
eight molecules. Section 6.4 discussed calculated MO transitions for several molecules up to
130
seven molecules. The entire unit cell then involves a continuation of these calculations and the
results are in turn very close to the seven molecules results.
The monoclinic crystal is considered first and the unit cell from several directions is shown
in Figure 2-4. In the non-optimized unit cell, the longest wavelength transition is at 270 nm, as
depicted in Figure 6-24. The majority of the MO transitions occur between 250 and 275 nm with
several weak oscillator strength transitions near 200 nm. When the geometry of the unit cell is
optimized several molecules turn so that there are nearly perpendicular to the neighboring
molecules and the (100) plane, as can be seen in Figure 6-25. Figure 6-26 shows the MO
transitions of this optimized geometry unit cell. The longest wavelength transition is slightly
longer than the non-optimized at 280 nm and the remaining transitions are mostly between 250
and 275 nm.
The orthorhombic unit cell is seen in Figure 2-4 from several different directions. It is
closely related to the monoclinic unit cell and in turn there are several similarities. From this,
one might assume that the calculated MO transitions would be analogous to the monoclinic unit
cell. The non-optimized unit cell has several large oscillator strength transitions. They are
longer then 275 nm which is slightly different than the monoclinic case seen in Figure 6-27. In
the optimized geometry unit cell, the MO transitions, depicted in Figure 6-28, are essentially the
same as the monoclinic unit cell. Several of the molecules in the cell rotate in the same manner
as those in the monoclinic unit cell. This result is not unexpected.
6.6 Changing the Intermolecular Distance between Pairs of TNT Molecules
As described in Sections 6.4 and 6.5, increasing the number of molecules does not cause a
transition near 420 nm. In fact, more than one molecule causes the MO transition at 450 nm to
be no longer present. Due to the large amounts of defects found in a typical TNT crystal, the
transition of interest may be due to intermolecular distances different from the equilibrium

131
position used in the previous calculations. Pairs of molecules in the same plane and stacked (like
pancakes) as they appear in the molecular crystal were modified and the MO transitions were
calculated.
The in-plane molecular pair of A and B conformations in the monoclinic molecular crystal
were calculated as the intermolecular distance was increased and decreased from the equilibrium.
These calculations were performed with the molecules with and without geometry optimization
and summarized in Figure 6-29. For both geometries, as the intermolecular distance is increased
the wavelength of the longest wavelength transition decreases at first substantially and then
remains about the same towards larger distances. In contrast, decreasing the intermolecular
distance causes an increase in the wavelength of the longest transition at a fairly steep rate.
Similarly orthorhombic molecules results involving in-plane A and B pairs are summarized in
Figure 6-30. As the intermolecular distance increases, the trend of the wavelength is equivalent
to the monoclinic result, although the longest wavelength transition increases less dramatically
than the monoclinic pairs. This is especially noted in that the longest wavelength MO transition
is near 500 nm for the optimized geometry and below 400 nm for the non-optimized. In the
monoclinic pairs, the longest wavelength MO transition extends to nearly 2500 nm in the non-
optimized pair and 1250 nm for the optimized geometry.
The molecules in the monoclinic crystal are stacked in the direction of the z-axis in the A
then B molecular sequence. Along the b-axis direction the (010) plane is repeated so that an A
molecule lies directly below, at an equilibrium spacing, another A molecule and the same for the
B molecules. Thus, pairs of molecules that appear to be stacked on top of each other like a
pancake stack are pairs of A molecules and pairs of B molecules. This is also true for the
orthorhombic unit cell even though the stacking sequence in the z-axis direction is ABBA.
132
Calculated results for pairs of monoclinic A molecules are presented in Figure 6-31. For
the intermolecular distance increasing from the equilibrium, the same trend of a stable longest
wavelength transition as in the in plane pairs is observed. An interesting feature is that the
wavelength of the optimized geometry pair MO transition is about 100 nm longer than the non-
optimized pairs down to a intermolecular distance of 1.29 Å. The wavelength of the low energy
MO transitions goes to 1500 nm as the distance decreases for the optimized geometry and to near
900 nm for the non-optimized.
The calculated results of monoclinic pairs of B molecules are illustrated in Figure 6-31. A
similar trend to the A molecules is seen where the optimized geometry transitions lay about 75
nm longer than the non-optimized geometry pairs. At about 1.7 Å the non-optimized geometry
pair surpasses the longest wavelength transition at 350 nm and quickly reaches extremely long
wavelengths. These wavelengths are much longer than those reached by the pair of A molecules.
Calculated results from the orthorhombic stacked A molecule pairs are summarized in
Figure 6-32. It is observed that the results are slightly different than the equivalent monoclinic
pair. This is best demonstrated by the smaller wavelength difference (about 60 nm) of the
optimized and non-optimized molecular pairs. As the intermolecular distance decreases, the
maximum wavelength achieved is distinctly lower than those found for the monoclinic pairs.
For the B molecular stacks of the orthorhombic crystal, the separation of the current and
optimized geometry longest wavelengths is the same as the A molecular pairs, 60 nm (see Figure
6-32). The longest wavelength transition for the optimized B molecular pairs at the smallest
intermolecular distance is at 1827 nm which is larger than the same for the A molecular pair at
620 nm.

133
In summary, a few distinct intermolecular distances display MO transitions at wavelengths
near 420 nm especially for the stacks of A molecules in both crystal structures. These are all
seen at intermolecular spacings approximately one Å smaller than the equilibrium spacing. This
result is depicted in Figure 6-33 for a pair of orthorhombic molecules in the A conformation at
an intermolecular distance of 1.5 Å, which is 1.2 Å smaller than the equilibrium distance. A MO
transition is found near 420 nm, specifically at 390 nm. From these observations, it is proposed
that the 420 nm transition is more likely to occur when the molecules are in compressive stress
than when they are at or further apart than the equilibrium distance.
6.7 Modifying the TNT Unit Cell to Yield Defects in the Crystal
It has been reported that the TNT crystal readily exists as a monoclinic crystal with large
amounts of stacking faults, in particular twinning65
. This is where an orthorhombic crystal is
essentially formed inside of the monoclinic crystal causing stacking defaults and other defects.
The modeling results of unit cells, as discussed in Section 6.5 were for perfect crystals. Using
the information from Section 6.6 it is reasonable that these calculations of perfect crystals did not
yield MO transitions near 420 nm, due to their equilibrium intermolecular distances. It is
possible that the 420 nm transitions only occur in non-ideal situations. Consequently each unit
cell was modified in order to simulate non ideal conditions.
The first modification considered molecular defects, that is, one molecule within the unit
cell was not an ideal TNT molecule. A TNT molecule was deconstructed within the unit cell by
systematically removing substituents of the molecule and finally creating a vacancy. Figure 6-34
depicts the MO transitions of a monoclinic unit cell where one TNT has had a nitro group
removed so that it is now a dinitrotoluene molecule. The system with optimized geometry is
shown in Figure 6-34. Another nitro group was removed creating a mononitrotoluene molecule
whose MO transitions of the current and optimized geometry are displayed in Figure 6-35. A

134
toluene molecule is created when the last nitro group is removed. The corresponding MO
transitions are found in Figure 6-36 for the current and optimized geometry. Then the methylene
(CH3) molecule was removed which left only a benzene ring in the crystal. MO transitions for
the current and optimized geometry are given in Figure 6-37. Finally the entire molecule was
removed leaving a vacancy in the TNT unit cell. These MO transitions are shown in Figure 6-38
for the current and optimized geometry.
The largest wavelength MO transitions are generally observed when the modified unit cell
geometry is not optimized. For example, the largest wavelength MO transition occurs when the
mononitrotoluene impurity is in the unit cell, at 333 nm. Several longer wavelength forbidden
transitions are noticed when toluene and benzene molecules are present. The toluene impurity
has the longest forbidden transition at 364 nm. When the vacancy is present there are no MO
transitions forbidden or allowed at wavelengths longer than 300 nm.
The second modification of the TNT unit cell was to insert a stacking fault and calculate
the MO transitions. This was performed in two instances, the first being an entire plane vacancy
where two planar molecules were removed from the unit cell. The resulting MO transitions are
depicted in Figure 6-39 for the current and optimized geometry. Second, four orthorhombic
molecules from the unit cell were inserted into the stacking sequence of the monoclinic unit cell.
These molecules essentially took the place of four monoclinic molecules but with the properties
of the orthorhombic unit cell. Figure 6-40 shows the calculated MO transitions for the current
and optimized geometry.
The plane vacancy configuration resulted in MO transitions at and below 288 nm for the
non-optimized geometry. Apparently, a stacking fault yielded the most dramatic change in the
MO transitions with a fairly strong transition at 409 nm (and several forbidden transitions at 460,

135
480, and 482 nm). In addition, MO transitions are found near 250 nm and 300nm which are in
good agreement with the experimental results for TNT in DRS (see inset of Figure 6-1). When
the geometry of the system was optimized several of the TNT molecules rotated out of the plane
moving the longest wavelength MO transition to 270 nm. This rotation is similar to what was
observed in the geometry optimization of the TNT monoclinic and orthorhombic unit cells.
It is therefore concluded that stacking faults inserted into the monoclinic molecular crystal,
are a distinct possibility for explaining the observed DR features of TNT.
6.8 Other Energetic Materials
The experimental results presented in Chapter 5 also included data taken on other energetic
materials related to TNT. Several of these explosives were also briefly investigated with
molecular modeling, namely RDX, HMX, Tetryl, and PETN. Additional modeling calculations
for all the energetic materials investigated, similar to what was performed for TNT, is proposed
as future work.
6.8.1 RDX
The RDX molecule, pairs, and unit cell was entered into the user interface using fractional
coordinates and cell parameters from the literature71
. The MO transitions for the single molecule
for the current and optimized geometry are shown in Figure 6-41. Calculations for the current
geometry molecule show several long wavelength transitions at 398 and 412 nm and the next
shortest transition is at 255 nm. The optimized geometry molecule has a long wavelength
transition at 384 nm and a very weak or forbidden transition at 369 nm. These MO transitions
are found at a much longer wavelength than the experimental results by nearly 60 nm which is
unlike the TNT molecule.
Next, two RDX molecules are placed in the user interface using the fractional coordinates
so that they are as they would appear in the molecular crystal. The calculated results for the

136
current and optimized geometry are depicted in Figure 6-42. Similar to two TNT molecules, the
longer wavelength transitions disappear when the two molecules are considered. In the current
geometry pair a forbidden or very low oscillation strength transition is seen at 381 nm and an
allowed transition at 309 nm. When the geometry is optimized the longest wavelength transition
is now seen at 282 nm. The current geometry RDX pair has MO transitions fairly close to the
experimental results. This behavior again is dissimilar to the TNT molecule pair.
The RDX unit cell contains eight molecules similar to the TNT crystals unit cells. Figure
6-43 displays the calculated MO transitions for the current and optimized geometry. Analagous
to the TNT unit cells the longest wavelength MO transitions are far into the blue region. For the
current geometry, the longest wavelength transition is at 245 nm and for the optimized geometry
at 254 nm. There are many forbidden MO transitions near 200 nm.
6.8.2 HMX
A single HMX molecule and subsequent combinations of molecules were entered into the
modeling program using fraction coordinates obtained from the literature107
. The calculated MO
transitions for current and optimized geometry are shown in Figure 6-44. For the current
geometry the longest wavelength MO transition at 385 nm has a fairly small oscillator strength.
When the geometry is optimized this transition becomes stronger and red shifts slightly. In
addition more transitions appear in the 200 nm region. This behavior is unusual compared to the
closely related RDX molecule.
The modeling of two HMX in plane molecules is shown in Figure 6-45. There are
noticeably no MO transitions found for either geometry at wavelengths larger than 300 nm. In
fact, the longest wavelength transition for both geometries is at 283 nm with nearly the same
oscillator strength.
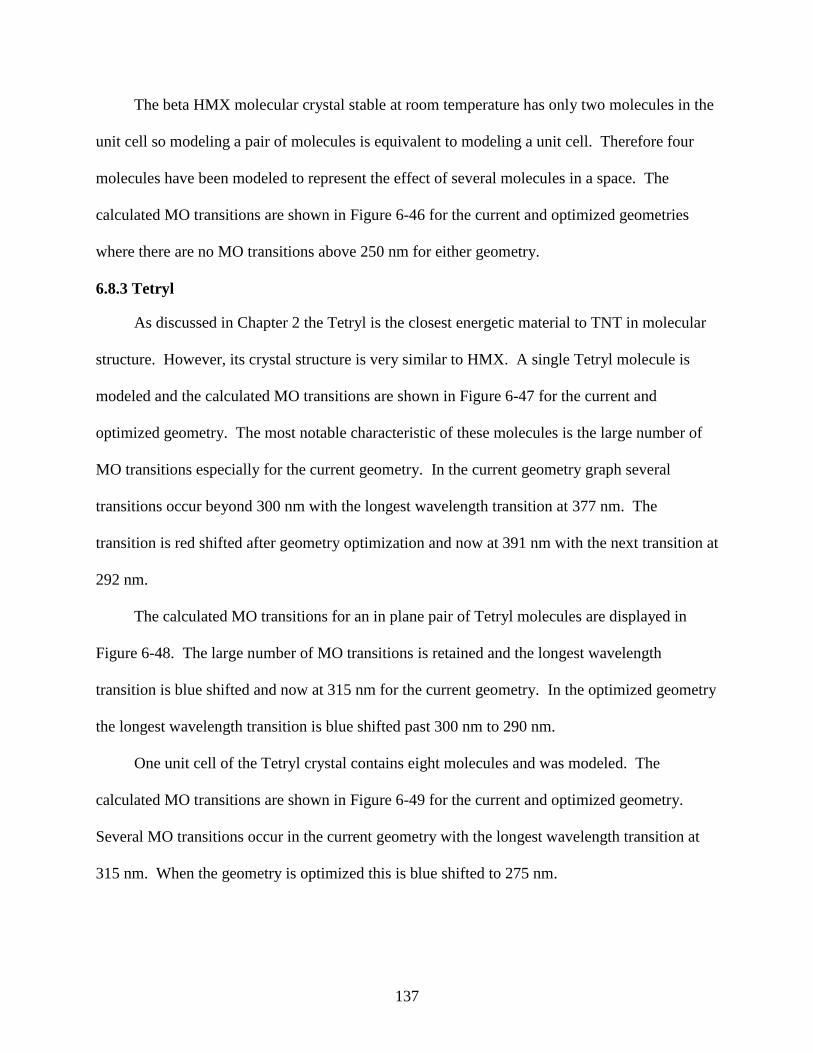
137
The beta HMX molecular crystal stable at room temperature has only two molecules in the
unit cell so modeling a pair of molecules is equivalent to modeling a unit cell. Therefore four
molecules have been modeled to represent the effect of several molecules in a space. The
calculated MO transitions are shown in Figure 6-46 for the current and optimized geometries
where there are no MO transitions above 250 nm for either geometry.
6.8.3 Tetryl
As discussed in Chapter 2 the Tetryl is the closest energetic material to TNT in molecular
structure. However, its crystal structure is very similar to HMX. A single Tetryl molecule is
modeled and the calculated MO transitions are shown in Figure 6-47 for the current and
optimized geometry. The most notable characteristic of these molecules is the large number of
MO transitions especially for the current geometry. In the current geometry graph several
transitions occur beyond 300 nm with the longest wavelength transition at 377 nm. The
transition is red shifted after geometry optimization and now at 391 nm with the next transition at
292 nm.
The calculated MO transitions for an in plane pair of Tetryl molecules are displayed in
Figure 6-48. The large number of MO transitions is retained and the longest wavelength
transition is blue shifted and now at 315 nm for the current geometry. In the optimized geometry
the longest wavelength transition is blue shifted past 300 nm to 290 nm.
One unit cell of the Tetryl crystal contains eight molecules and was modeled. The
calculated MO transitions are shown in Figure 6-49 for the current and optimized geometry.
Several MO transitions occur in the current geometry with the longest wavelength transition at
315 nm. When the geometry is optimized this is blue shifted to 275 nm.

138
6.8.4 PETN
The PETN molecule is quite distinctive from the other tested energetic materials and is
only similar in that it has several nitro groups. It is not cyclic and has almost a square-like
structure. This uniqueness is further affirmed by the calculated MO transitions depicted in
Figure 6-50. The current geometry calculations show many MO transitions above 200 nm with
several closely grouped transitions near 235, 260, and 340 nm with the latter being the longest
wavelength transition. When the geometry is optimized many of the transitions below 200 nm
reduce greatly in oscillator strength or become forbidden. The longest wavelength transition is
now at 215 nm.
Next, two PETN molecules are placed in the modeling program and the MO transitions are
calculated, as seen in Figure 6-51. The MO transitions reduce to four closely packed groups,
where the longest wavelength transition is within a group at 285 nm. While the geometry
optimization reduces the MO transitions even more to two groups both below 200 nm. The
PETN molecular crystal has two molecules in its unit cell. Therefore, like HMX, four molecules
have been modeled in order to observe the influence of several molecules in a space (Figure 6-
52). The number of transitions increases greatly from the molecular pair, however, the oscillator
strength decreases significantly as well. The MO transitions may have been present in the pair
but too small in strength to be seen in the graph. In contrast the geometry optimized calculation
displays almost the exact same behavior as the molecular pair.
6.8.5 Trinitrotoluene Derivatives: DNT and MNT
The dinitrotoluenes and mononitrotoluenes have a considerably smaller explosive power
than all the other energetic materials described above, but they are still considered energetic
molecules. They are the most common impurity in TNT due to incomplete nitration, which also
makes them of great interest.
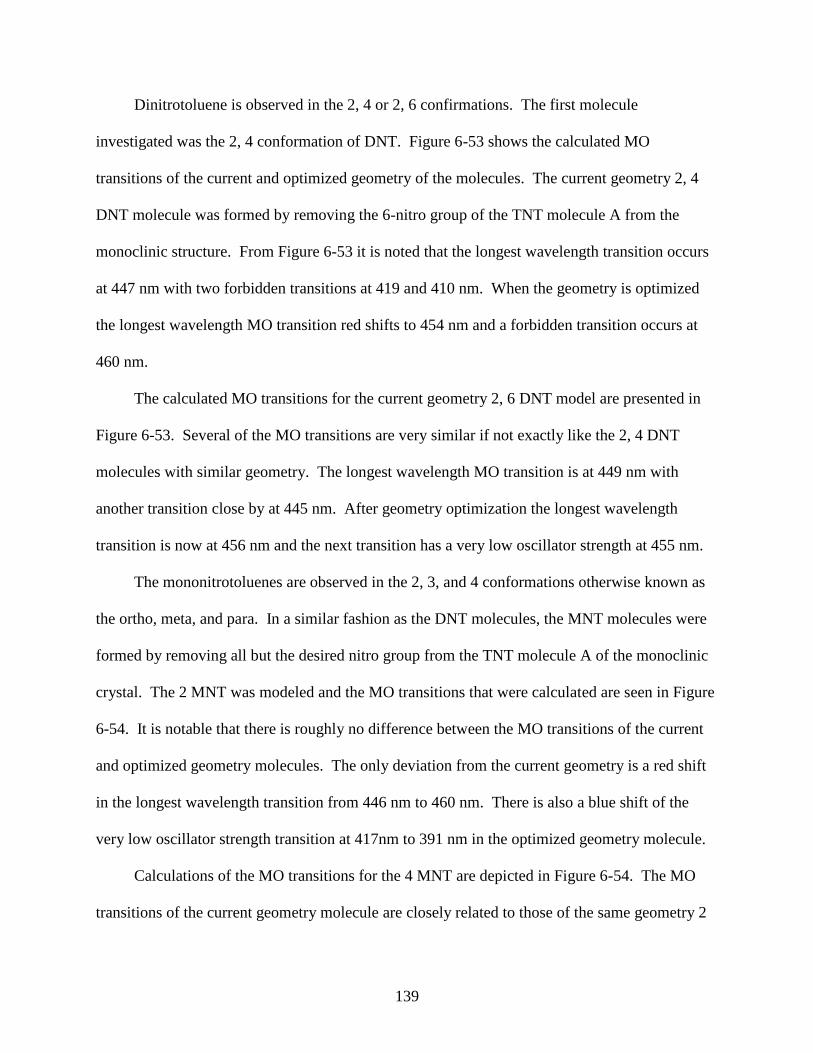
139
Dinitrotoluene is observed in the 2, 4 or 2, 6 confirmations. The first molecule
investigated was the 2, 4 conformation of DNT. Figure 6-53 shows the calculated MO
transitions of the current and optimized geometry of the molecules. The current geometry 2, 4
DNT molecule was formed by removing the 6-nitro group of the TNT molecule A from the
monoclinic structure. From Figure 6-53 it is noted that the longest wavelength transition occurs
at 447 nm with two forbidden transitions at 419 and 410 nm. When the geometry is optimized
the longest wavelength MO transition red shifts to 454 nm and a forbidden transition occurs at
460 nm.
The calculated MO transitions for the current geometry 2, 6 DNT model are presented in
Figure 6-53. Several of the MO transitions are very similar if not exactly like the 2, 4 DNT
molecules with similar geometry. The longest wavelength MO transition is at 449 nm with
another transition close by at 445 nm. After geometry optimization the longest wavelength
transition is now at 456 nm and the next transition has a very low oscillator strength at 455 nm.
The mononitrotoluenes are observed in the 2, 3, and 4 conformations otherwise known as
the ortho, meta, and para. In a similar fashion as the DNT molecules, the MNT molecules were
formed by removing all but the desired nitro group from the TNT molecule A of the monoclinic
crystal. The 2 MNT was modeled and the MO transitions that were calculated are seen in Figure
6-54. It is notable that there is roughly no difference between the MO transitions of the current
and optimized geometry molecules. The only deviation from the current geometry is a red shift
in the longest wavelength transition from 446 nm to 460 nm. There is also a blue shift of the
very low oscillator strength transition at 417nm to 391 nm in the optimized geometry molecule.
Calculations of the MO transitions for the 4 MNT are depicted in Figure 6-54. The MO
transitions of the current geometry molecule are closely related to those of the same geometry 2
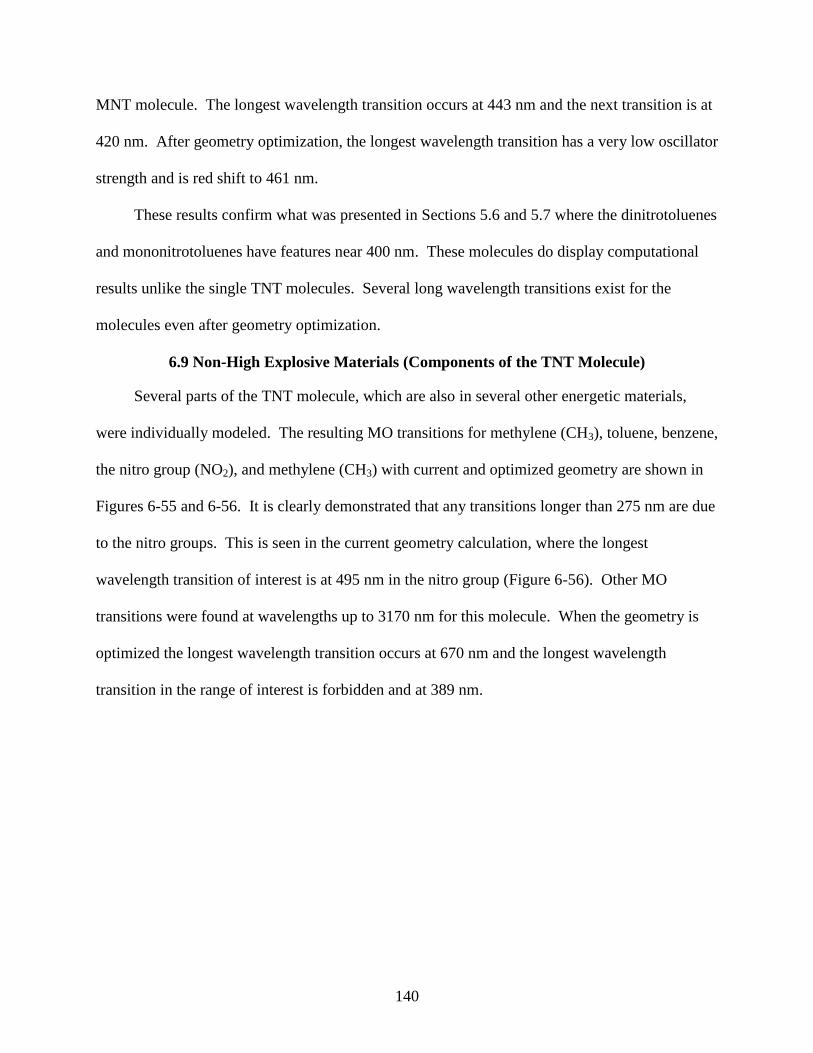
140
MNT molecule. The longest wavelength transition occurs at 443 nm and the next transition is at
420 nm. After geometry optimization, the longest wavelength transition has a very low oscillator
strength and is red shift to 461 nm.
These results confirm what was presented in Sections 5.6 and 5.7 where the dinitrotoluenes
and mononitrotoluenes have features near 400 nm. These molecules do display computational
results unlike the single TNT molecules. Several long wavelength transitions exist for the
molecules even after geometry optimization.
6.9 Non-High Explosive Materials (Components of the TNT Molecule)
Several parts of the TNT molecule, which are also in several other energetic materials,
were individually modeled. The resulting MO transitions for methylene (CH3), toluene, benzene,
the nitro group (NO2), and methylene (CH3) with current and optimized geometry are shown in
Figures 6-55 and 6-56. It is clearly demonstrated that any transitions longer than 275 nm are due
to the nitro groups. This is seen in the current geometry calculation, where the longest
wavelength transition of interest is at 495 nm in the nitro group (Figure 6-56). Other MO
transitions were found at wavelengths up to 3170 nm for this molecule. When the geometry is
optimized the longest wavelength transition occurs at 670 nm and the longest wavelength
transition in the range of interest is forbidden and at 389 nm.
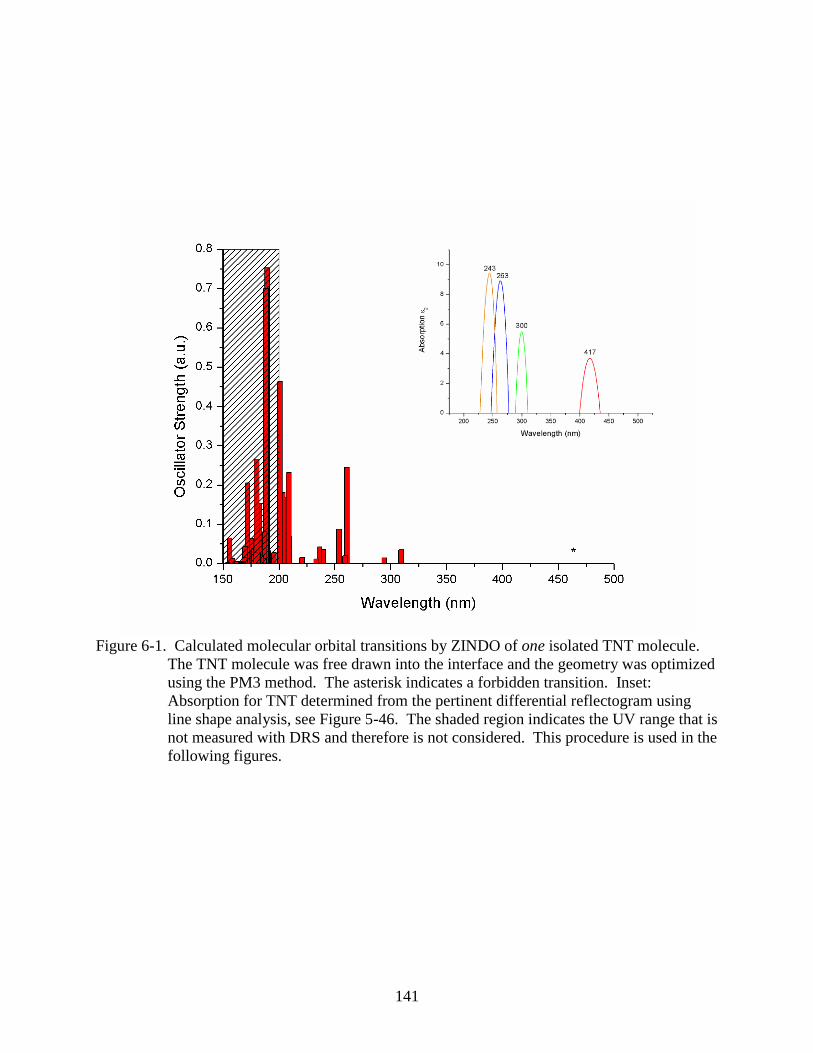
141
Figure 6-1. Calculated molecular orbital transitions by ZINDO of one isolated TNT molecule.
The TNT molecule was free drawn into the interface and the geometry was optimized
using the PM3 method. The asterisk indicates a forbidden transition. Inset:
Absorption for TNT determined from the pertinent differential reflectogram using
line shape analysis, see Figure 5-46. The shaded region indicates the UV range that is
not measured with DRS and therefore is not considered. This procedure is used in the
following figures.
142
Figure 6-2. Calculated molecular orbital transitions by ZINDO of one TNT molecule based on
monoclinic molecular crystal geometry and optimized using the PM3 method.
143
Figure 6-3. A modeled UV-Visible spectrum based on the calculated molecular orbital
transitions by ZINDO for one TNT molecule based on the monoclinic molecular
crystal geometry optimized with the PM3 method. Absorbance transitions of interest
are indicated numerically and described by the participating molecular orbitals shown
in Figure 6-4.
144
Figure 6-4. One isolated TNT molecule based on the monoclinic molecular crystal geometry and
geometry optimized using the PM3 method with molecular orbitals that participate in
absorption transitions highlighted. The solid orbitals are the highest occupied
molecular orbitals (HOMO) and the shaded orbitals are the lowest unoccupied
molecular orbitals (LUMO). The numerical labels indicate the corresponding
transition in Figure 6-3. In this and other diagrams of the molecules the atoms are
color coded where gray is carbon, white hydrogen, blue nitrogen, and red oxygen.
The color and shape of the orbitals indicate the type of molecular orbital. The
molecular orbitals are colored to better differentiate them from each other and are not
characteristic of a particular type. The orbital shape is based on classical orbital
shapes e.g. spheres for s orbitals.
145
Figure 6-5. Molecular orbital transitions calculated by ZINDO for one isolated TNT molecule
based on the orthorhombic molecular crystal geometry and optimized using the PM3
method. Asterisks indicated forbidden transitions.
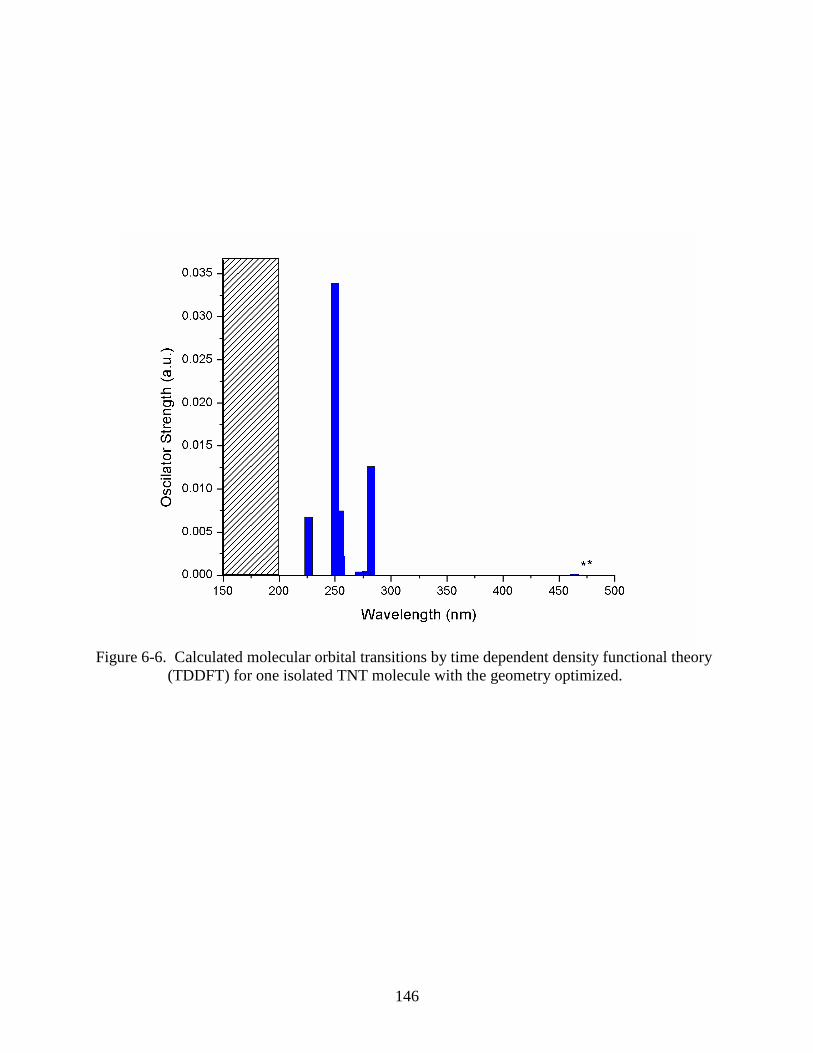
146
Figure 6-6. Calculated molecular orbital transitions by time dependent density functional theory
(TDDFT) for one isolated TNT molecule with the geometry optimized.
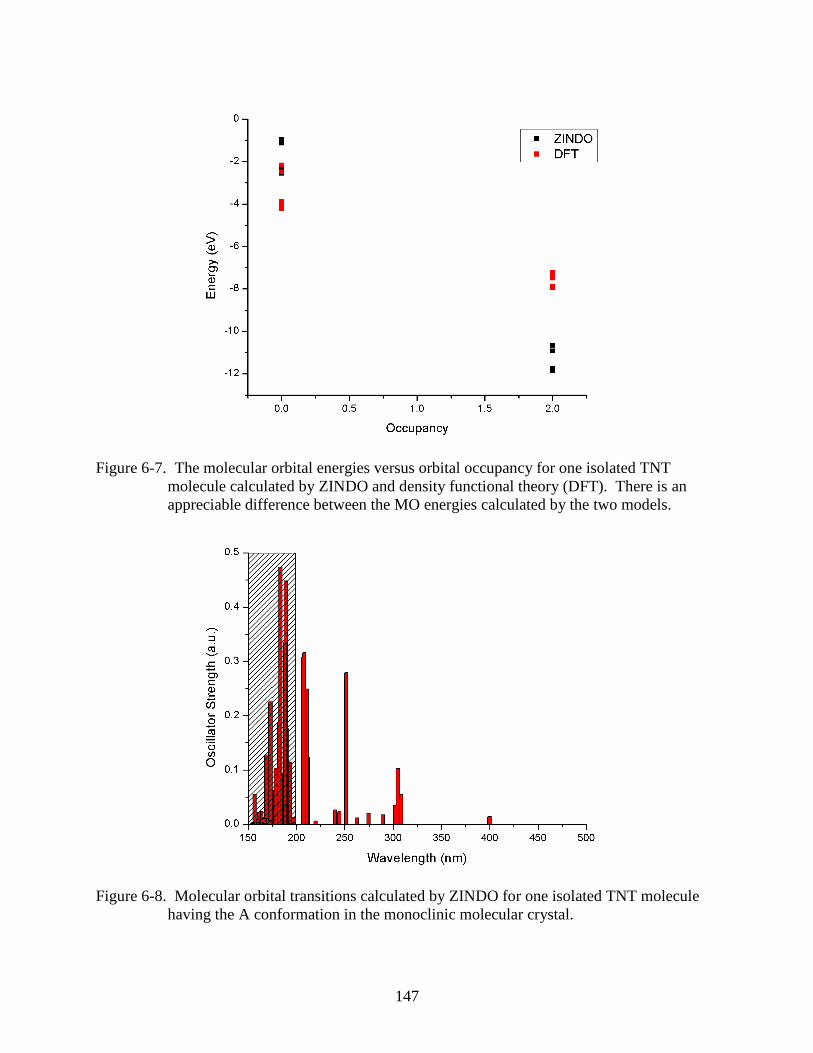
147
Figure 6-7. The molecular orbital energies versus orbital occupancy for one isolated TNT
molecule calculated by ZINDO and density functional theory (DFT). There is an
appreciable difference between the MO energies calculated by the two models.
Figure 6-8. Molecular orbital transitions calculated by ZINDO for one isolated TNT molecule
having the A conformation in the monoclinic molecular crystal.

148
Figure 6-9. The molecular orbital transitions for one isolated TNT molecule in the A
conformation of the orthorhombic molecular crystal.

149
Figure 6-10. Modeled spectrum of one isolated TNT molecule with the A conformation of the
monoclinic molecular crystal based on the molecular orbital transitions calculated by
ZINDO. Arabic numerals label the transitions of interest further described by Figure
6-11.
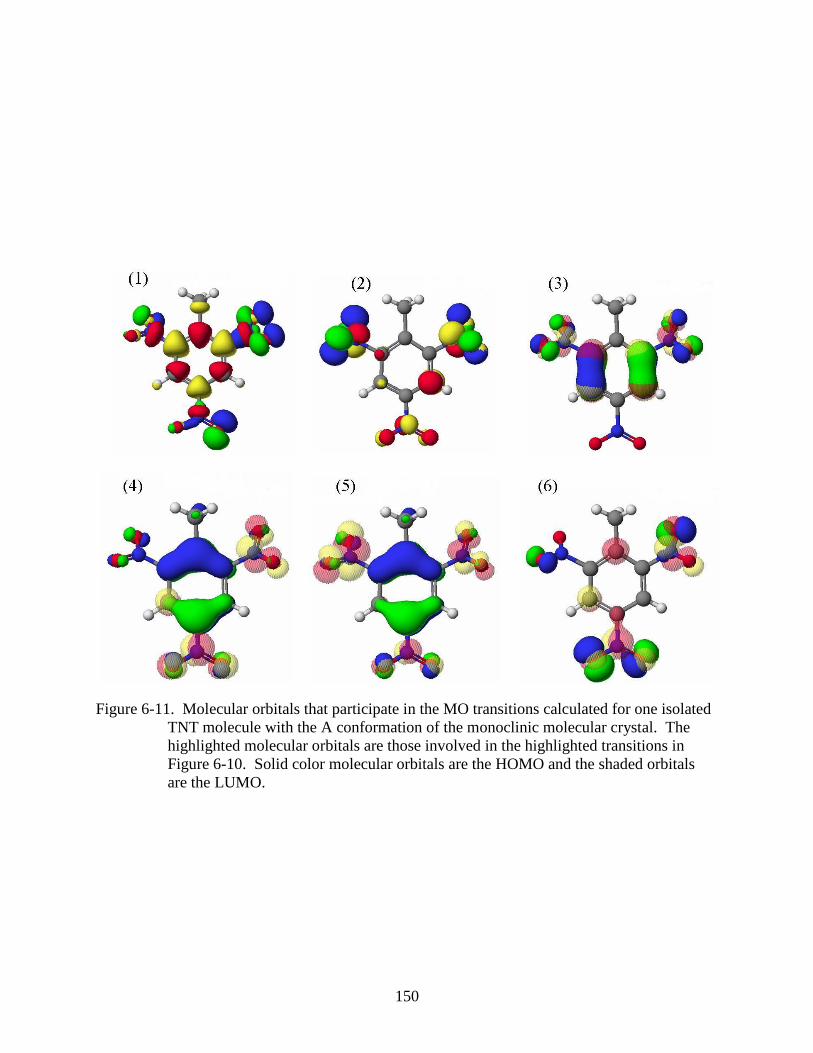
150
Figure 6-11. Molecular orbitals that participate in the MO transitions calculated for one isolated
TNT molecule with the A conformation of the monoclinic molecular crystal. The
highlighted molecular orbitals are those involved in the highlighted transitions in
Figure 6-10. Solid color molecular orbitals are the HOMO and the shaded orbitals
are the LUMO.
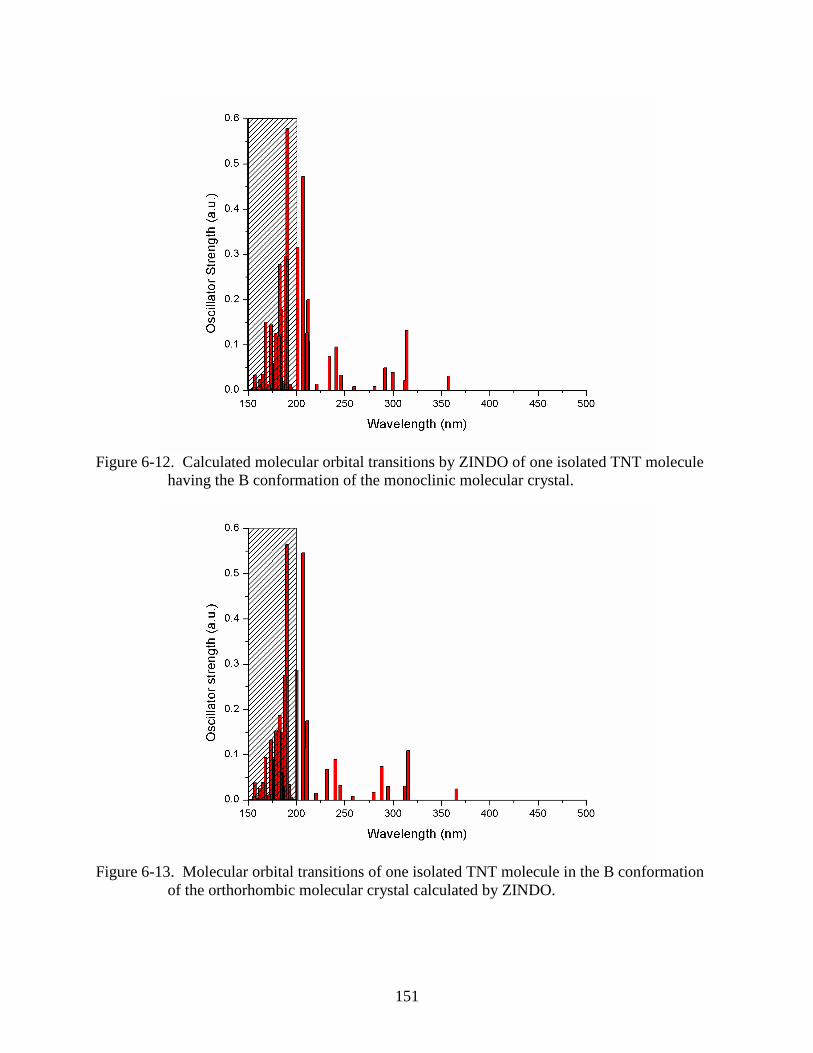
151
Figure 6-12. Calculated molecular orbital transitions by ZINDO of one isolated TNT molecule
having the B conformation of the monoclinic molecular crystal.
Figure 6-13. Molecular orbital transitions of one isolated TNT molecule in the B conformation
of the orthorhombic molecular crystal calculated by ZINDO.

152
Figure 6-14. Calculated molecular orbital transitions of two TNT molecules in both A and B
conformations of the monoclinic molecular crystal as they would appear in the crystal
as a pair in the same plane.

153
Figure 6-15. Molecular orbital transitions of two TNT molecules based on the A and B
conformations of the monoclinic molecular crystal and geometry optimized using the
PM3 method calculated by ZINDO.
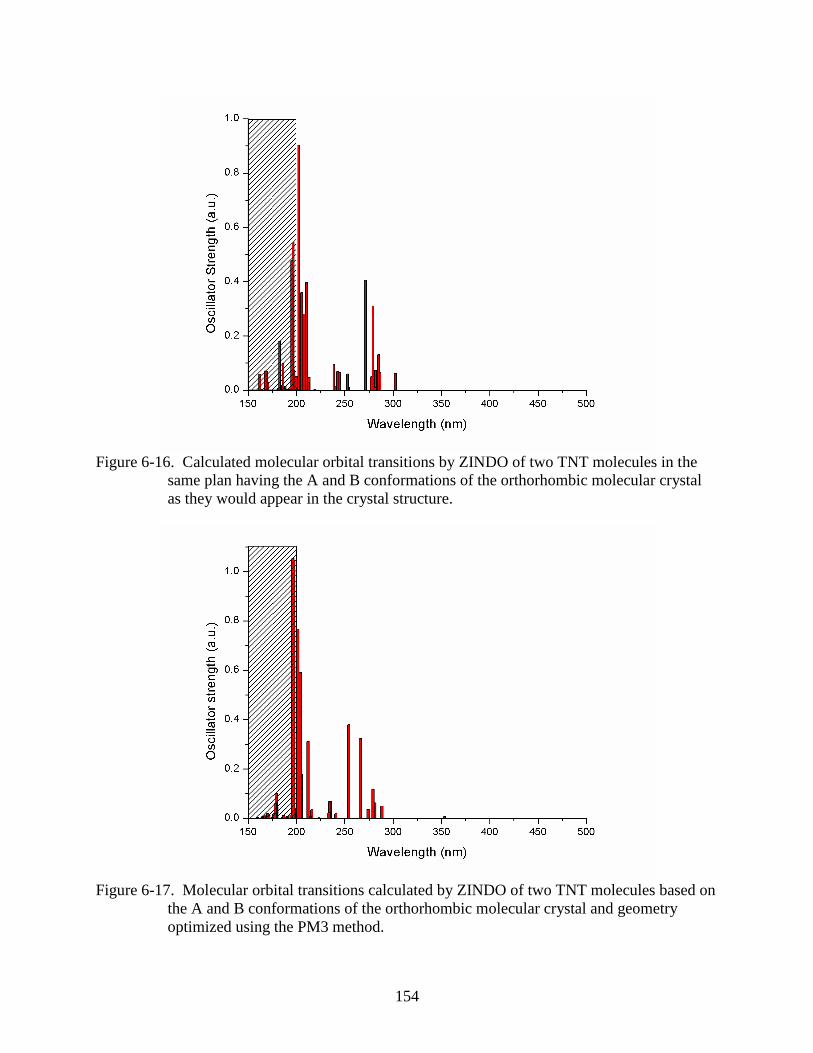
154
Figure 6-16. Calculated molecular orbital transitions by ZINDO of two TNT molecules in the
same plan having the A and B conformations of the orthorhombic molecular crystal
as they would appear in the crystal structure.
Figure 6-17. Molecular orbital transitions calculated by ZINDO of two TNT molecules based on
the A and B conformations of the orthorhombic molecular crystal and geometry
optimized using the PM3 method.
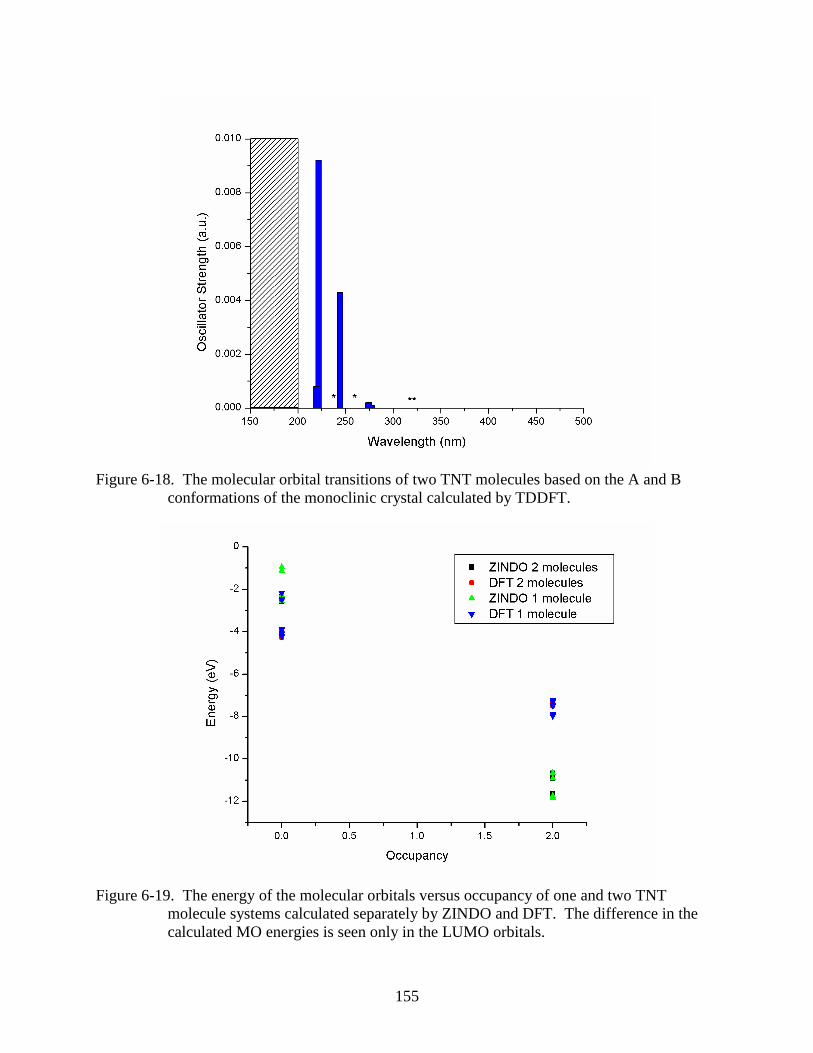
155
Figure 6-18. The molecular orbital transitions of two TNT molecules based on the A and B
conformations of the monoclinic crystal calculated by TDDFT.
Figure 6-19. The energy of the molecular orbitals versus occupancy of one and two TNT
molecule systems calculated separately by ZINDO and DFT. The difference in the
calculated MO energies is seen only in the LUMO orbitals.

156
Figure 6-20. Summary of the calculated molecular orbital transitions by ZINDO for increasing
numbers of monoclinic conformation A TNT molecules in a system. The longest
(reddest) wavelength transition for each calculation is shown versus the number of
molecules present. Geometry optimization using the PM3 method was also
performed and the resulting longest wavelength MO transitions are indicated in red.

157
Figure 6-21. Wavelength of the longest wavelength (reddest) calculated molecular orbital
transition by ZINDO for increasing numbers of TNT molecules in the B conformation
of the monoclinic molecular crystal. Geometry optimization using the PM3 method
was also performed for each calculation and the resulting longest wavelength MO
transitions shown in red.
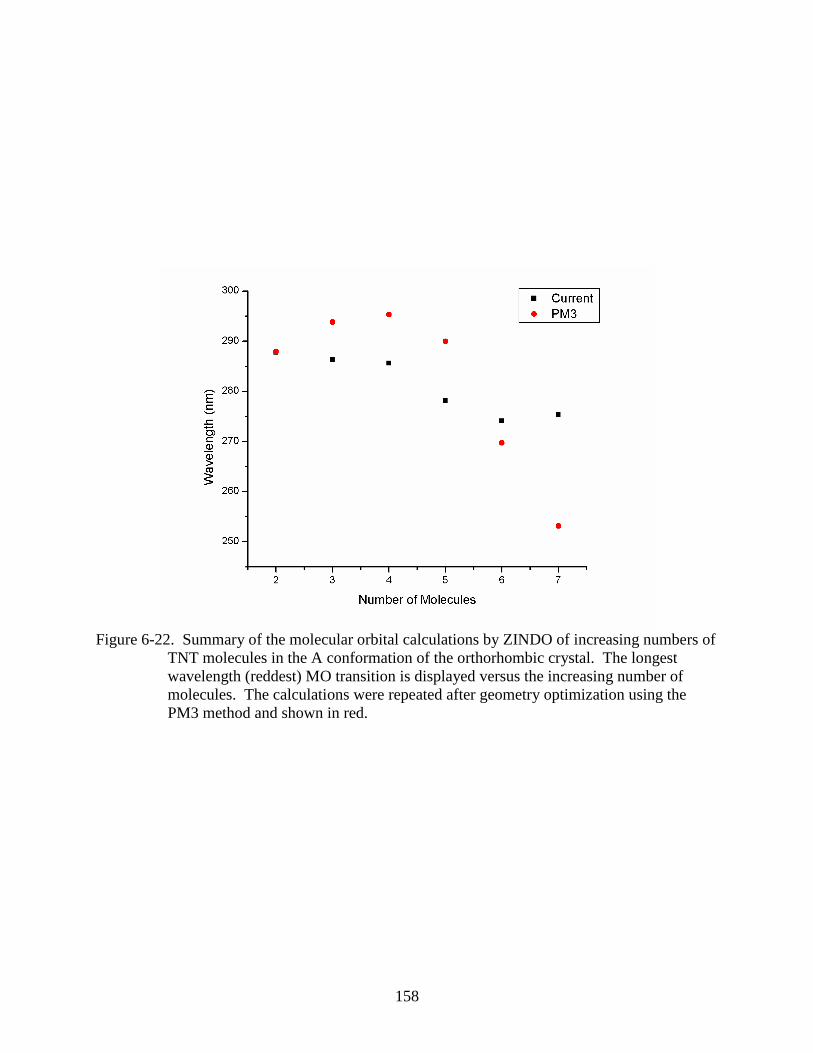
158
Figure 6-22. Summary of the molecular orbital calculations by ZINDO of increasing numbers of
TNT molecules in the A conformation of the orthorhombic crystal. The longest
wavelength (reddest) MO transition is displayed versus the increasing number of
molecules. The calculations were repeated after geometry optimization using the
PM3 method and shown in red.

159
Figure 6-23. The longest wavelength (reddest) MO transition calculated by ZINDO with
increasing number of TNT molecules in conformation B of the orthorhombic crystal.
Geometry optimization using the PM3 method was also performed and the
calculations repeated and displayed in red.
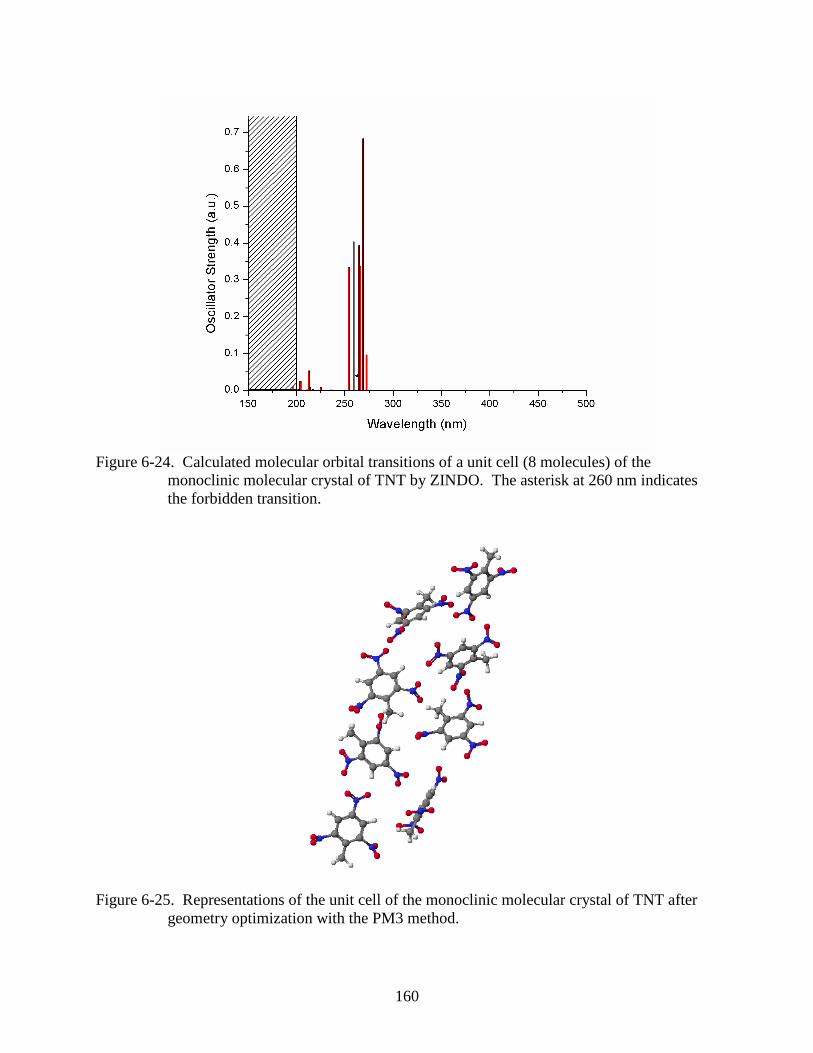
160
Figure 6-24. Calculated molecular orbital transitions of a unit cell (8 molecules) of the
monoclinic molecular crystal of TNT by ZINDO. The asterisk at 260 nm indicates
the forbidden transition.
Figure 6-25. Representations of the unit cell of the monoclinic molecular crystal of TNT after
geometry optimization with the PM3 method.

161
Figure 6-26. Molecular orbital transitions calculated by ZINDO of 8 molecules based on the unit
cell of the monoclinic molecular crystal of TNT and geometry optimized using the
PM3 method.
Figure 6-27. Calculated molecular orbital transitions by ZINDO of a TNT unit cell (8
molecules) of the orthorhombic molecular crystal.
162
Figure 6-28. Molecular orbital transitions of 8 TNT molecules based on the unit cell of the
orthorhombic molecular crystal and geometry optimized using the PM3 method
calculated by ZINDO.

163
Figure 6-29. Summary of the calculated molecular orbital transitions by ZINDO for two TNT
molecules in the A and B conformation of the monoclinic molecular crystal at
varying intermolecular distances. The longest wavelength (reddest) MO transition for
each pair is displayed for each intermolecular distance. The calculations performed
on molecular pairs that have optimized geometry using the PM3 method are shown in
red. The inset depicts an enlargement of the wavelength scale to make the transition
wavelength around 400 nm more visible. The smallest inset is a representation of the
molecular pair used in the calculation at the equilibrium intermolecular distance
which is indicated by the arrow in the graphs.

164
Figure 6-30. Calculated molecular orbital transitions by ZINDO for pairs of TNT molecules in
the A and B conformations of the orthorhombic crystals as they would appear in the
crystal at varying intermolecular distances. The longest wavelength (reddest)
transition for each intermolecular distance is plotted. The calculation was repeated
for the pairs after geometry optimization using the PM3 method and are shown in red.
Figure 6-31. The longest wavelength (reddest) calculated molecular orbital transition by ZINDO
versus the intermolecular distance of a pair of TNT molecules in the A conformation
(A) and B conformation (B) of the monoclinic crystal. The molecules are stacked as
they would appear in the molecular crystal. The calculation was repeated after
geometry optimization using the PM3 method, of the pairs at each intermolecular
distance and is shown in red.
A B

165
Figure 6-32. Summary of the calculated molecular orbital transitions by ZINDO for pairs of
TNT molecules in the A conformation (A) and B conformation (B) of the
orthorhombic molecular crystal at varying intermolecular distances. The molecular
pairs of two A molecules or two B molecules are stacked as they would appear in the
crystal (see insets). The calculations repeated after geometry optimization using the
PM3 method, are displayed in red.
Figure 6-33. Molecular orbital transitions for a pair of orthorhombic conformation A TNT
molecules stacked like pancakes at an intermolecular distance of 1.5 Å calculated by
ZINDO.
A B

166
Figure 6-34. Calculated molecular orbital transitions by ZINDO of the monoclinic unit cell of
TNT with one TNT molecule replaced with a DNT molecule (A). The calculation
was repeated for the modified unit cell after geometry optimization using the PM3
method (B).
Figure 6-35. Molecular orbital transitions calculated by ZINDO of the monoclinic unit cell of
TNT with a MNT molecule in the place of one TNT molecule (A). After geometry
optimization using the PM3 method of the modified unit cell, the calculation was
repeated (B).
A B
A B
167
Figure 6-36. The calculated molecular orbital transitions by ZINDO of a modified monoclinic
molecular crystal unit cell of TNT where one TNT molecule is replaced with a
toluene molecule (A). The PM3 method was used for geometry optimization of the
modified unit cell and the calculation repeated (B). Forbidden transitions are
indicated by an asterisk.
Figure 6-37. Molecular orbital transitions calculated by ZINDO of a unit cell of the monoclinic
molecular crystal of TNT with a benzene molecule replacing one TNT molecule (A).
The calculation was repeated after the modified unit cell geometry was optimized
using the PM3 method (B).
A B
A B
168
Figure 6-38. Calculated molecular orbital transitions by ZINDO of a monoclinic molecular
crystal unit cell of TNT where one TNT molecule has been removed leaving a
vacancy (A). After geometry optimization of the modified unit cell using the PM3
method, the calculation was repeated (B).
Figure 6-39. The molecular orbital transitions for a unit cell of the monoclinic molecular crystal
of TNT where two TNT molecules have been removed leaving a plane vacancy
calculated by ZINDO (A). The calculation was repeated after geometry optimization
of the modified unit cell using the PM3 method (B).
A B
A B
169
Figure 6-40. Calculated molecular orbital transitions by ZINDO of the monoclinic molecular
crystal unit cell of TNT where four TNT molecules in the stacking sequence have
been removed and four TNT molecules with orthorhombic molecular crystal
conformations have been inserted creating a stacking fault (A). The geometry of the
modified unit cell was optimized using the PM3 method and the molecular orbital
transition calculations repeated (B). Asterisks designate the wavelength of forbidden
transitions.
A B

170
Figure 6-41. Molecular orbital transition calculations by ZINDO of one RDX molecule from the
molecular crystal stable at room temperature (A). Molecular orbital transition
calculated by ZINDO after optimizing the geometry of the RDX molecule (B). Inset
of (A) is the absorption transitions determined by line shape analysis of the respective
differential reflectogram (see Figure 5-47).
B
A
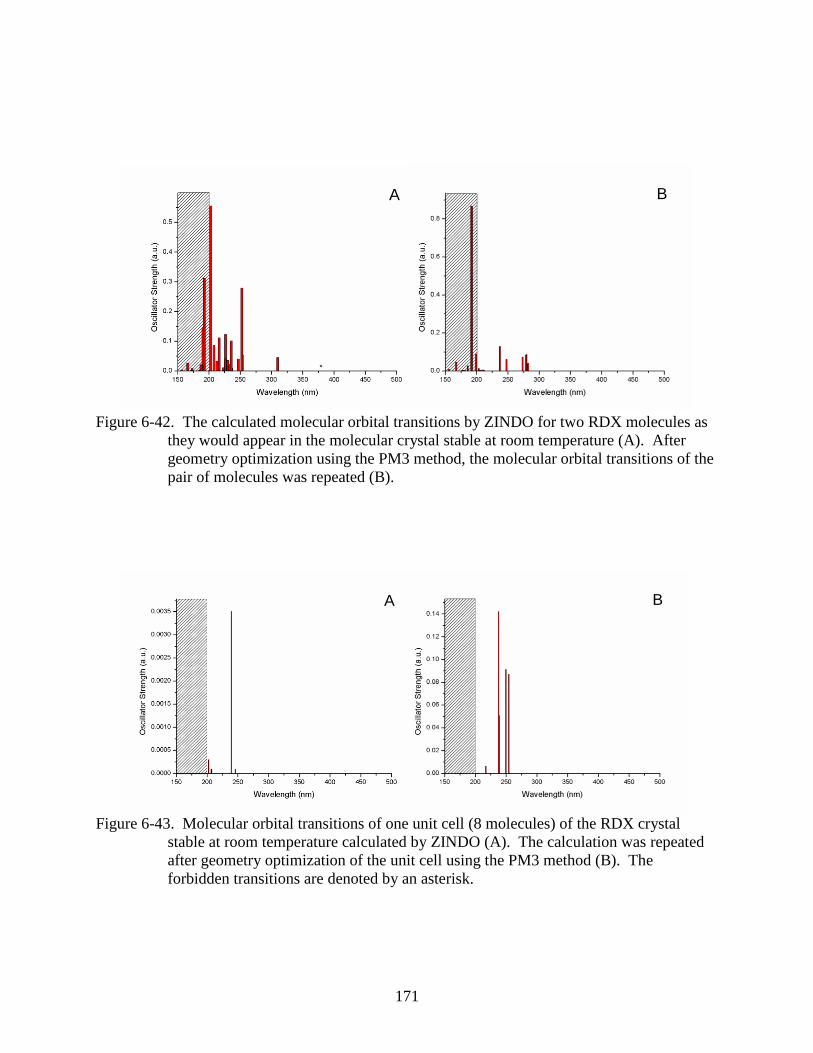
171
Figure 6-42. The calculated molecular orbital transitions by ZINDO for two RDX molecules as
they would appear in the molecular crystal stable at room temperature (A). After
geometry optimization using the PM3 method, the molecular orbital transitions of the
pair of molecules was repeated (B).
Figure 6-43. Molecular orbital transitions of one unit cell (8 molecules) of the RDX crystal
stable at room temperature calculated by ZINDO (A). The calculation was repeated
after geometry optimization of the unit cell using the PM3 method (B). The
forbidden transitions are denoted by an asterisk.
A B
A B
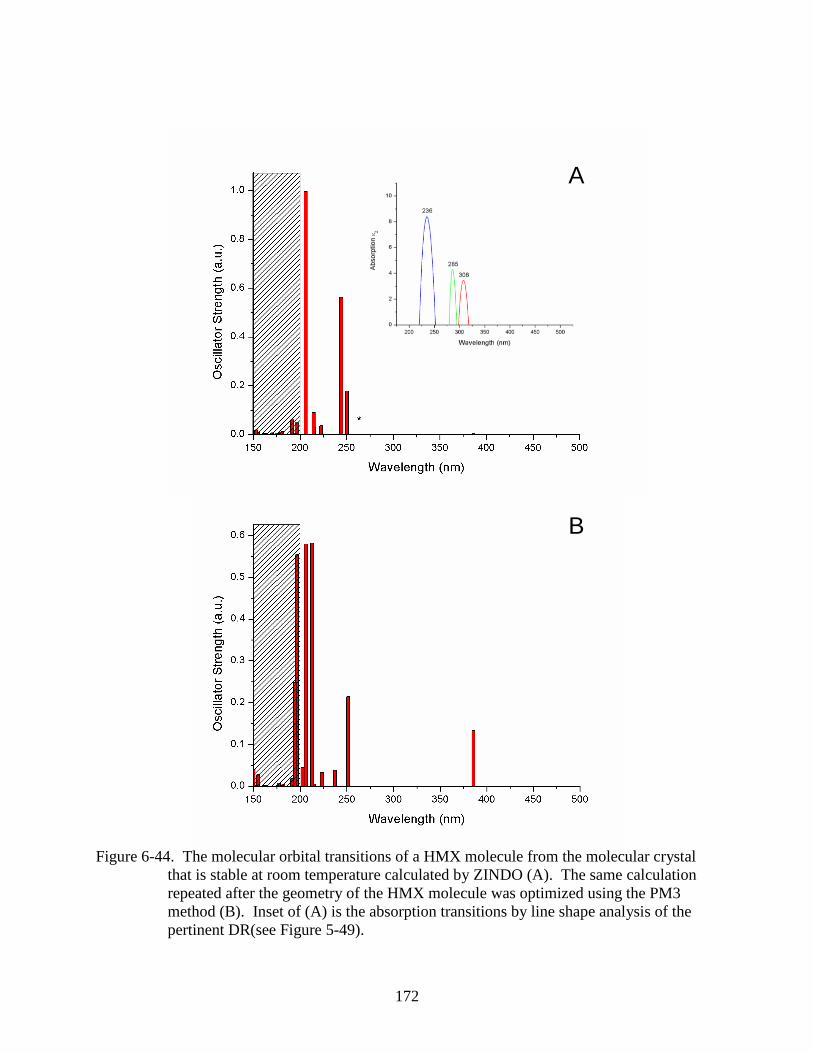
172
Figure 6-44. The molecular orbital transitions of a HMX molecule from the molecular crystal
that is stable at room temperature calculated by ZINDO (A). The same calculation
repeated after the geometry of the HMX molecule was optimized using the PM3
method (B). Inset of (A) is the absorption transitions by line shape analysis of the
pertinent DR(see Figure 5-49).
B
A
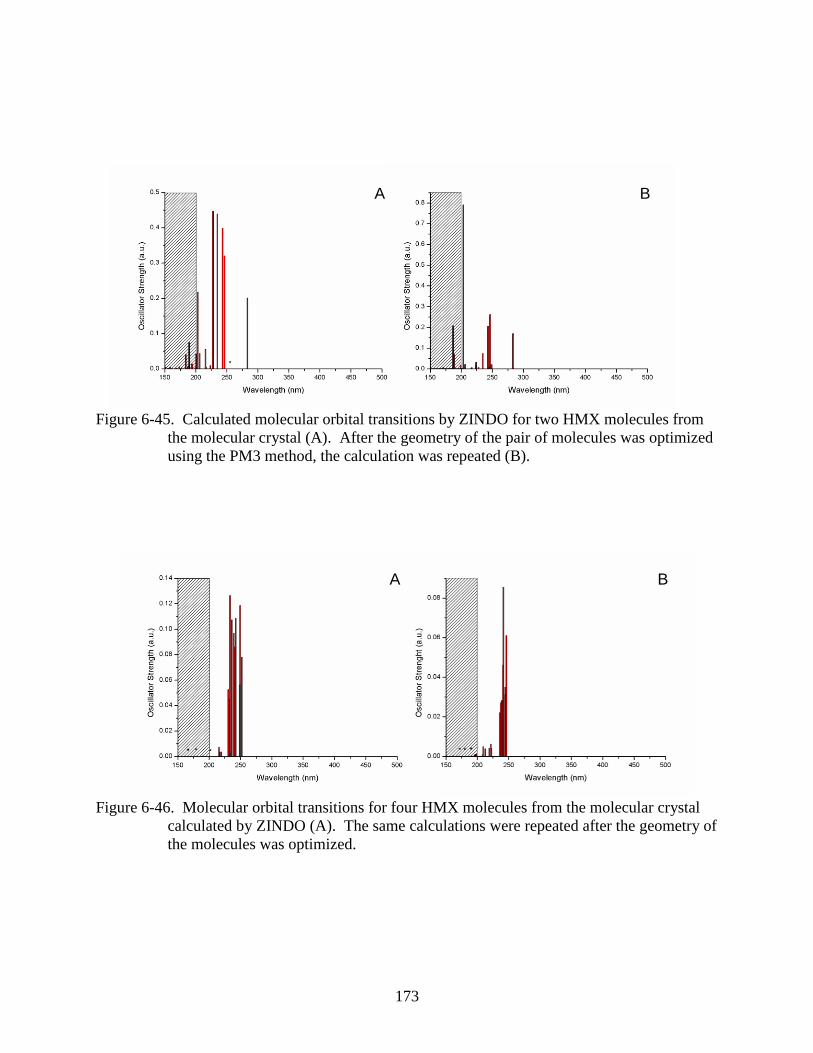
173
Figure 6-45. Calculated molecular orbital transitions by ZINDO for two HMX molecules from
the molecular crystal (A). After the geometry of the pair of molecules was optimized
using the PM3 method, the calculation was repeated (B).
Figure 6-46. Molecular orbital transitions for four HMX molecules from the molecular crystal
calculated by ZINDO (A). The same calculations were repeated after the geometry of
the molecules was optimized.
A B
A B

174
Figure 6-47. The calculated molecular orbital transitions by ZINDO of one Tetryl molecule
from the molecular crystal stable at room temperature (A). After geometry
optimization of the molecule using the PM3 method, the calculation was repeated (B).
Inset of (A) is the absorption transitions found by line shape analysis of the respective
differential reflectogram(see Figure 5-50).
A
B

175
Figure 6-48. Molecular orbital transitions calculated by ZINDO for two Tetryl molecules as they
would appear in the molecular crystal (A). The calculation was repeated after the
geometry of the pair was optimized (B).
Figure 6-49. Calculated molecular orbitals transitions by ZINDO of an entire unit cell (eight
molecules) of Tetryl (A). The MO transitions were recalculated after the geometry of
the unit cell was optimized (B). Forbidden transitions are indicated by an asterisk.
A B
A B

176
Figure 6-50. The molecular orbital transitions of one PETN molecule as calculated by ZINDO
(A). After geometry optimization of the PETN molecule (B). Inset is the line shape
analysis of the pertinent differential reflectogram (see Figure 5-48).
B
A

177
Figure 6-51. The results of calculating the molecular orbital transitions by ZINDO for a pair of
PETN molecules as they appear in the molecular crystal (A). The MO transitions
calculated after geometry optimization of the pair of molecules (B).
Figure 6-52. Molecular orbital transitions of four PETN molecules as they would appear in the
molecular crystal calculated by ZINDO (A). Calculated MO transitions after the
geometry of the PETN molecules was optimized (B).
A B
A B

178
Figure 6-53. The calculated MO transitions by ZINDO of one molecule of 2, 4 DNT (A), 2, 4
DNT with geometry optimization (B), 2, 6 DNT (C), and 2, 6 DNT with geometry
optimization (D).
A
C D
B
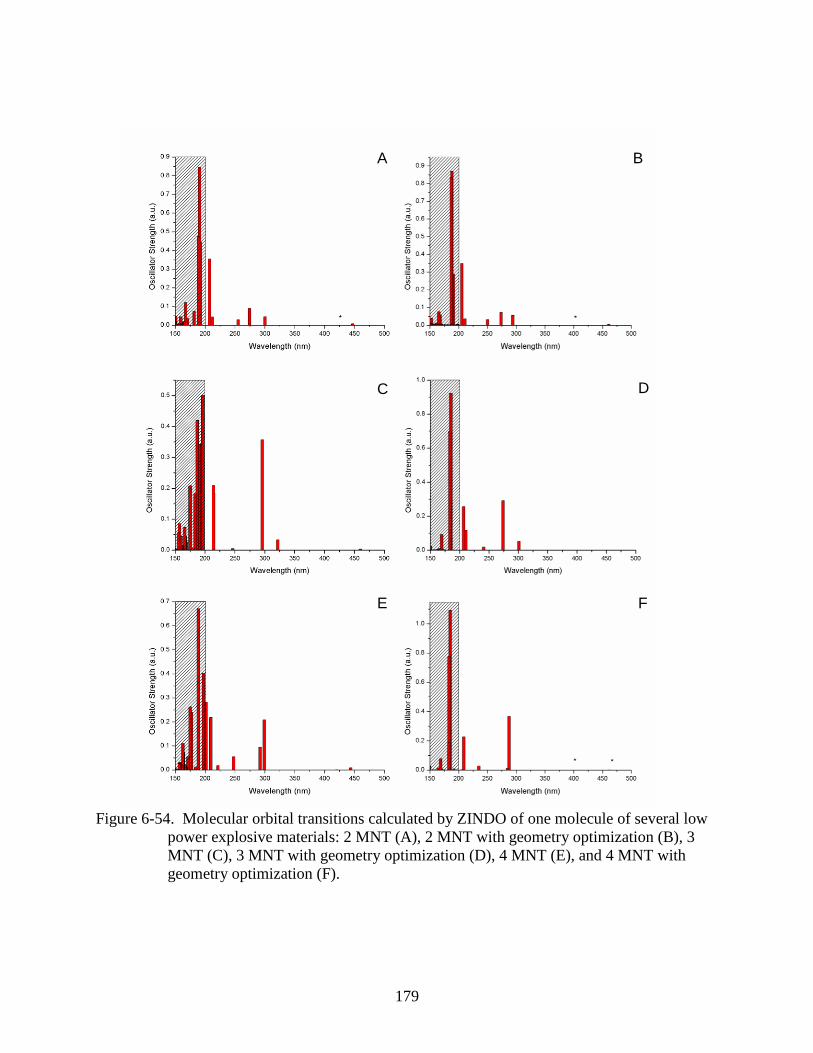
179
Figure 6-54. Molecular orbital transitions calculated by ZINDO of one molecule of several low
power explosive materials: 2 MNT (A), 2 MNT with geometry optimization (B), 3
MNT (C), 3 MNT with geometry optimization (D), 4 MNT (E), and 4 MNT with
geometry optimization (F).
A B
DC
E F
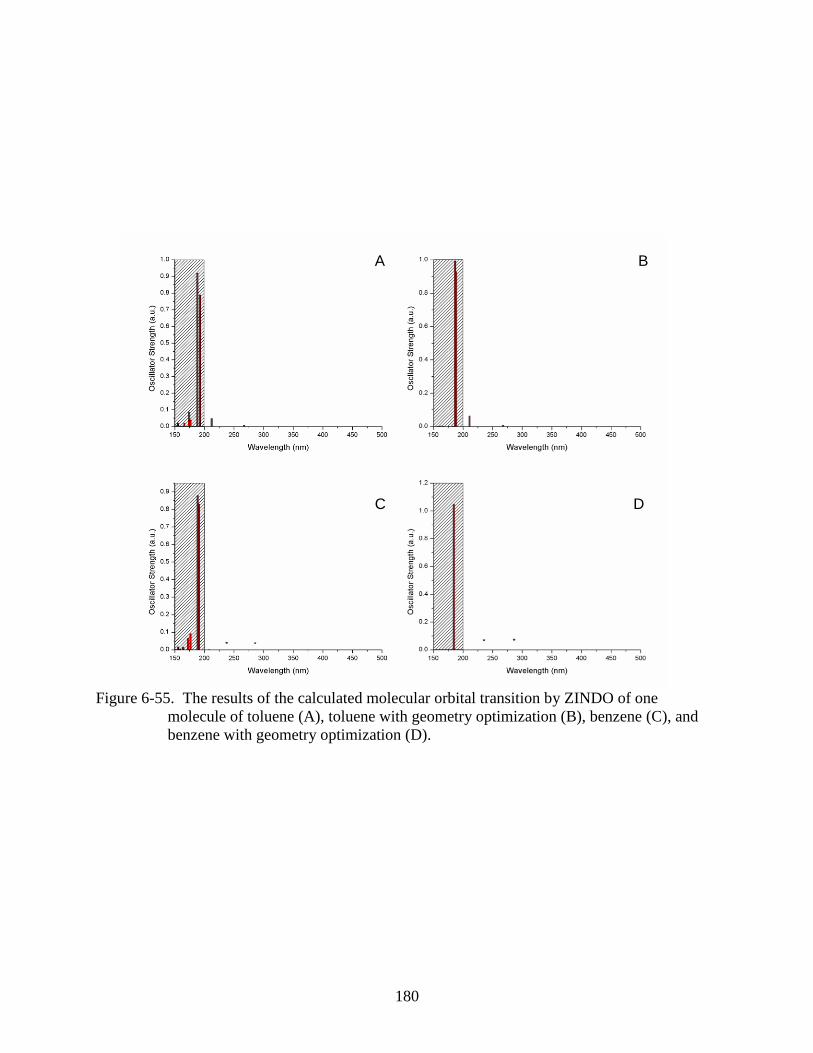
180
Figure 6-55. The results of the calculated molecular orbital transition by ZINDO of one
molecule of toluene (A), toluene with geometry optimization (B), benzene (C), and
benzene with geometry optimization (D).
A B
C D
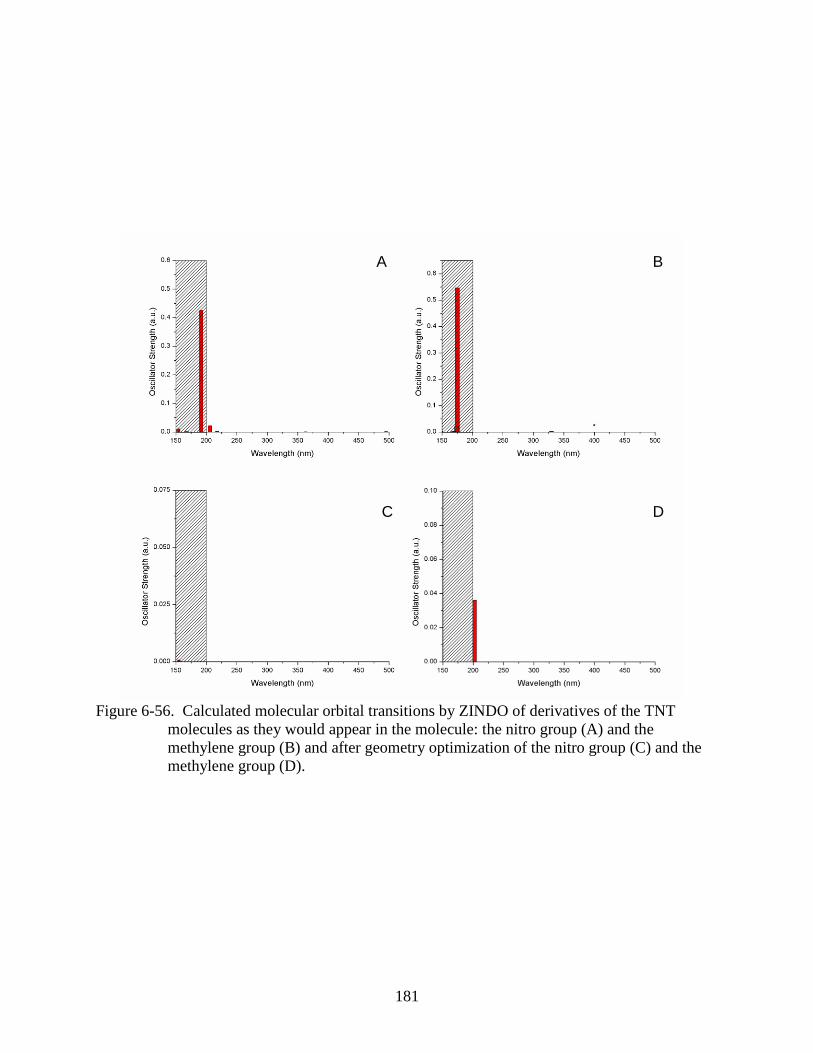
181
Figure 6-56. Calculated molecular orbital transitions by ZINDO of derivatives of the TNT
molecules as they would appear in the molecule: the nitro group (A) and the
methylene group (B) and after geometry optimization of the nitro group (C) and the
methylene group (D).
A
C D
B

182
CHAPTER 7
FURTHER DISCUSSION
Chapter 5 introduced the low energy or long wavelength differential reflectogram features
of several energetic materials. Additional experiments confirm that the features are not only
unique to the individual energetic materials but they are also robust. The features exist
independent of the sample treatment or supplier and retain their characteristics in mixes of
energetic materials. Investigation of these results leads to the question of the physical origin of
the long wavelength feature.
7.1 Review of TNT Absorption
The majority of the presented experiments are performed using TNT so the discussion will
begin with its 420 nm feature. Few researchers have reported this result directly. In fact the only
references to a large wavelength feature were by Cantillo and Felt et al23,108
. Cantillo observed
an absorption edge near 400 nm for a solid sample of TNT using a plain reflection spectrometer
and attributed it to the NO2 groups of the molecule, due to spectra of NO2 gas giving an
equivalent absorption edge. The same research group had also reported near field reflectance
microscopy measurements where a feature in the 395 to 405 nm range is seen109
. Felt et al.
observed a broad optical absorbance peak near 400 nm for a TNT and hydroxide reaction in a
relatively dilute solution. As the time of the hydroxide reaction increased the intensity of the
absorption increased until it reached a saturation point and then decreased as the reaction
continued. Downs and Forsyth reported an absorption onset for single crystals of TNT near 400
nm98
. Downs and Forsyth and Cantillo attributed this absorption to an n→π* transition in the
NO2 groups based on the logic that it could not be from the benzene ring. Felt only described the
absorption feature to be from a product of the TNT hydroxide reaction.
183
7.2 Origin of the Long Wavelength Feature
Several of the experimental results in Chapter 5 give an indication of the origin of the 420
nm feature. The first addressed are the UV-visible transmission spectrophotometry
measurements of varying concentrations of solutions. As discussed in Section 5.8.1 the
absorbance at 420 nm decreased in intensity with the decrease in concentration but this trend was
not completely linear. The trend had two regions of linearity; the higher concentrations above
1.7 g/L or 1700ppm and the lower concentrations below this value. This deviates from the Beer
Lambert law which states that the absorbtivity of a chromophore or light absorbing species,
decreases linearly with the concentration. Essentially the smaller number of chromophores that
are present, the smaller the amount of absorption. A deviation from this behavior indicates that
the absorbing species is not independent of the molecule’s environment and is affected by the
solvent molecules or other molecules. Measurements of TNT in the DRS after recrystallization
from several different solvents and UV-visible transmission spectra where the solvent for the
solution was varied show that neither affects the wavelength of the absorption feature at 420 nm.
Therefore, it is inferred that the cause of the observed absorption is not an interaction with the
solvent. It is possible that the absorption at 420 nm occurs due to an interaction or the formation
of a complex between molecules of the energetic material. The nature of this effect needs to be
addressed.
Marinkas et al. have observed the same phenomenon as above in solid and supersaturated
solutions of RDX and HMX84,110
. An absorption edge near 355 nm for RDX and HMX was
found in the solid phase and solvated solutions but as the concentration was decreased the
features were no longer observed. These results are compared to those reported in Section 5.1
and 5.8.1 where an absorption feature near 335 nm for RDX and 320 nm for HMX were seen
using DRS. Similar wavelength transitions were observed in UV-visible absorbance of high
184
concentration solutions. As the concentrations of the solutions were decreased, the intensity of
the absorbance decreases until it is no longer measurable. Marinkas and his colleagues attributed
this phenomenon to a charge transfer self-complex that has a low intensity due to selection rules
that render the transition forbidden and is a solid state effect. A charge transfer self-complex is
where an electron is exchanged between moieties (components of the molecule and can be either
atoms or small molecules) within the molecule or between large molecules that do not ordinarily
share electrons. For illustration, consider an electron from the sp2 molecular orbital of a ring N
in an RDX molecule. This electron normally is shared with the nearest neighbors in the ring but
not with the N-O sp2 orbital but instead in a charge transfer complex the electron is transferred to
the N-O orbital.
7.2.1 Solid State Effect?
There are several interesting arguments to this proposal. First of all, the long wavelength
transition was readily observed in the high concentrated solutions of TNT, RDX, HMX, Tetryl,
and PETN suggesting that the transition is not a solid state effect. Marinkas and his colleague
may not have observed this due to either using a low resolution spectrometer or solutions that
were too dilute. The concentration of the solutions was not reported so the latter cannot be
confirmed. In comparison, the particle size analysis of the high concentration solution of TNT
measured in the UV-Visible transmission spectrometry reported, was performed using dynamic
light scattering. No particles (assuming a sphere) larger than 3 nm in size, the lower limit of the
instrument, were observed in the solution after multiple trials, as described in Section 5.7. Using
a sphere 3 nm in diameter and each molecule within the sphere is the equilibrium distance apart;
this is the particle size equivalent to roughly 13 TNT molecules, or just shy of two unit cells. A
group of thirteen TNT molecules together is the largest a particle could be in the high
concentration solution but there could well be far smaller particles present. The definition of a

185
crystal is a substance having long range order; groups of less than 13 molecules suspended in a
solution do not seem to meet this criterion58
. Second, the absorbance features were observed in
concentrations much lower than the 3.3 g/L that was used for the particle size analysis.
Therefore it is argued that the transition is an effect that is not constrained to the solid state.
7.2.2 Charge Transfer Self-Complex
It is well reported in the literature that the energetic materials, such as TNT, RDX, HMX,
Tetryl, and PETN do not have strong intermolecular bonds in the crystalline state41,66,69,89,111
. In
fact TNT, RDX, HMX, and Tetryl have been observed to have weak intra- and intermolecular
bonds that are described in the literature as hydrogen bonds although they are not the traditional
hydrogen bonds. These weak bonds occur mostly between the O of a nitro group and the H of
either a ring carbon or methylene group (if one exists) where the bonded atoms are in the same
molecule for intramolecular bonds or in neighboring molecules for intermolecular bonds. These
bonds are in the form of a relatively strong electrostatic or dipole-dipole interaction where no
electrons are shared rather, they cause the molecules to attract each other and influence the
molecular orbitals. Charge transfer complexes can exist between molecules in highly
concentrated solutions or solid crystals. In the discussed system the complexes would be
between molecules of the same type i.e. TNT to TNT. This supports the self-complex portion of
Marinkas’s theory.
It is important to note that in the case of TNT the intermolecular interactions mentioned
above occur only with the molecules in the same plane66,69,112
. The interactions cause an
increased distortion of the NO2 groups from that of the single molecule to that of the molecule
found in the molecular crystal. This has been reported in the literature and confirmed by
computational results, see Sections 6.1 and 6.8, where the molecular geometry for one isolated
molecule of TNT, RDX, HMX, or Tetryl in a crystal changes significantly when the geometry is
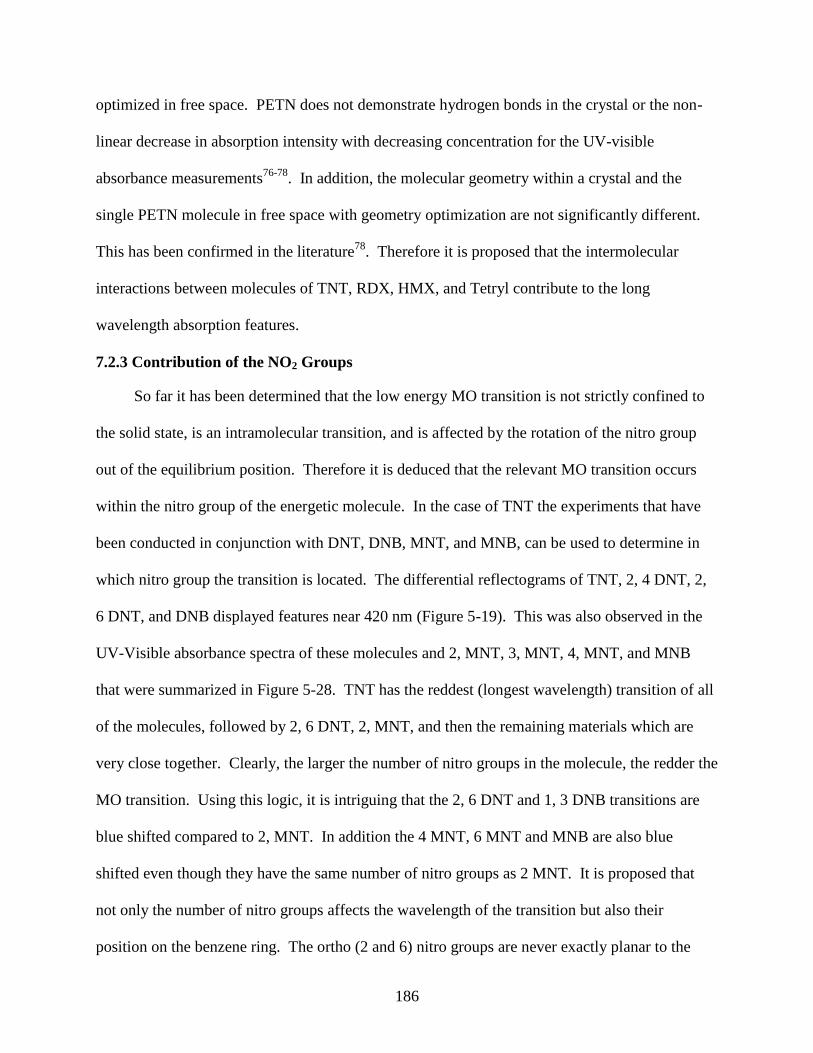
186
optimized in free space. PETN does not demonstrate hydrogen bonds in the crystal or the non-
linear decrease in absorption intensity with decreasing concentration for the UV-visible
absorbance measurements76-78
. In addition, the molecular geometry within a crystal and the
single PETN molecule in free space with geometry optimization are not significantly different.
This has been confirmed in the literature78
. Therefore it is proposed that the intermolecular
interactions between molecules of TNT, RDX, HMX, and Tetryl contribute to the long
wavelength absorption features.
7.2.3 Contribution of the NO2 Groups
So far it has been determined that the low energy MO transition is not strictly confined to
the solid state, is an intramolecular transition, and is affected by the rotation of the nitro group
out of the equilibrium position. Therefore it is deduced that the relevant MO transition occurs
within the nitro group of the energetic molecule. In the case of TNT the experiments that have
been conducted in conjunction with DNT, DNB, MNT, and MNB, can be used to determine in
which nitro group the transition is located. The differential reflectograms of TNT, 2, 4 DNT, 2,
6 DNT, and DNB displayed features near 420 nm (Figure 5-19). This was also observed in the
UV-Visible absorbance spectra of these molecules and 2, MNT, 3, MNT, 4, MNT, and MNB
that were summarized in Figure 5-28. TNT has the reddest (longest wavelength) transition of all
of the molecules, followed by 2, 6 DNT, 2, MNT, and then the remaining materials which are
very close together. Clearly, the larger the number of nitro groups in the molecule, the redder the
MO transition. Using this logic, it is intriguing that the 2, 6 DNT and 1, 3 DNB transitions are
blue shifted compared to 2, MNT. In addition the 4 MNT, 6 MNT and MNB are also blue
shifted even though they have the same number of nitro groups as 2 MNT. It is proposed that
not only the number of nitro groups affects the wavelength of the transition but also their
position on the benzene ring. The ortho (2 and 6) nitro groups are never exactly planar to the

187
benzene ring due to the steric hindrance caused by the large methylene group. The charge in the
molecular orbitals of the methylene group attracts the lone pair of electrons on the single bonded
oxygen and repels the double bonded oxygen. Meanwhile the para, or 4 nitro group is almost
exactly planar in the single molecule and is slightly rotated due to an intermolecular hydrogen
bond in the molecular crystal. Thus, the closer to the methylene group is to the nitro group, the
greater the degree of rotation. This rotation increases when the molecule is in the molecular
crystal. When the nitro groups are close to the methylene group then the MO transition is redder.
This is most apparent in the DNB and MNB molecules where no methylene group is present on
the ring and the transition is greatly blue shifted. In addition, the transition is bluer for 2, 4 DNT
than for 2, 6 DNT and bluer for 3 and 4 MNT than for 2 MNT. Therefore it is concluded that the
energy of the transition is lowered as the rotation of the nitro group increases and as the number
of nitro groups increases. This conclusion affirms that the symmetry of the molecular orbitals of
the nitro groups is essential to the wavelength and intensity of the long wavelength feature.
The computational chemistry results for the varying intermolecular distance between pairs
of TNT molecules and the modified unit cell also support the stated conclusion. As the distance
between the molecules increased, the interaction of the two molecules deceased and in the
optimized geometry calculations of the rotation of the nitro groups decreased as well. The
resulting longest wavelength MO transition remained at the same wavelength significantly below
420 nm. But as the distance was decreased the interaction between the molecules increased and
the wavelength of the longest wavelength MO transition increased sharply. Similarly when a
stacking fault is introduced several long wavelength transitions appeared in the area of 400 nm.
In summary, as the molecules were stressed or forced to interact with each other, the wavelength

188
of the longest transition increased. These interactions often caused or maintained the rotation of
the nitro groups out of the equilibrium position.
Since it has been thus determined that the low energy transition is due to the nitro groups
and is dependent on the MO symmetry within these molecules, the specific molecular orbitals
involved in the transition should be discussed. The orbitals involved can be inferred from a
couple of experiments. One of these is observing the effect of the solvent on the transition
wavelength in UV-Visible transmission spectrophotometry. The wavelength of the transition can
be shifted if the solvent forms a complex with the molecular orbitals involved in the given
transition. This occurs more often with polar solvents where the energy of a non-bonding orbital
is decreased subsequently increasing the energy of a molecular transition of n→π*. A blue shift
is then observed for the transition with increasingly polar solvents. Other molecular transitions
are more robust, such as π → π *, and the wavelength of these transitions will generally not shift
with increasingly polar solvents. One exception of this is when the molecule is in the excited
state, a complex can form with the LUMO orbital causing the MO energy to decrease and the
wavelength of the transition to red shift. Figure 5-32 shows the UV-Visible transmission spectra
for TNT in varying solvents. The 420 nm absorption feature did not significantly change with
the polarity of the solvent although there was a slight red shift of about 2 nm. Therefore the
transition is not an n→ π * transition but it may be an excited state π → π * transition.
The computation modeling allowed the user to visualize what molecular orbitals were
contributing to a particular transition. The type of orbital was indicated by its shading and shape.
In the case of the isolated TNT molecules where the 420 nm transition was observed, the
transition involves several orbitals that are seen in Figure 6-11. The unoccupied (indicated as
shaded) orbital for the 420 nm transition, is the sp2 orbital of the nitrogen to the single bonded

189
oxygen. The ground state of the electron is the non-hybridized orbital of the ring carbon (σ
orbital) that is bonded to the nitro group. Therefore the MO transition is caused by a charge
transfer from the ring carbon to the LUMO or the π* orbital of the nitrogen to oxygen bond.
7.3 Summary
From the preceding discussion, the proposed origin of the long wavelength transition for
TNT has been defined; a charge transfer self-complex causes the transition which is only allowed
when the molecular orbitals have a particular symmetry. This theory essentially agrees with the
explanation by Marinkas and his colleagues for the feature seen in solid RDX and HMX. A
complete set of experiments was performed only for TNT; however, from the experiments
performed for the energetic materials, the same theory can be applied. For instance, it has been
discussed that RDX, HMX, and Tetryl displayed both long wavelength DR and UV-Visible
transmission spectral features that decreased non-linearly with concentration similar to TNT.
These energetic materials have also been shown to have hydrogen bonding within the molecular
crystal similar to TNT. Thus, the long wavelength transition in the energetic materials tested is a
charge transfer self-complex from a ring atom to the unoccupied orbital of the nitro group.
190
CHAPTER 8
SUMMARY AND CONCLUSIONS
Energetic materials have unique optical absorption in the UV and blue visible range that is
best measured by differential reflectometry. These characteristic features can be exploited for
development of a commercial detection system for several reasons. Each individual energetic
material has its own feature from 270 to 420 nm that is distinct from other organic and inorganic
materials tested. Several items of vegetation did have some weak absorption near 400 nm.
However, this was accompanied by additional features in the UV, distinguishing them from the
energetic materials. This insures a low number of false positives and proper identification of the
individual explosives. The absorption feature is a property of energetic materials in that it is
independent of the source, the solvent (if used), substrate, and degree and kind of impurities. In
addition, the absorption can be confirmed by other UV reflection techniques as well as in
transmission using sample solutions of relatively high concentrations. It is important to note that
non-energetic cyclic materials do not have the described absorption features.
The energetic materials retain their individual optical absorption features in mixtures of
several different explosives. It has also been shown that the feature in TNT is independent of
crystal face orientation and angle of reflection of the incident light from the sample surface. The
wavelength of the TNT feature is dependent on the number and the position of the nitro groups
present in the molecule as determined by measuring several DNTs and DNB in the DRS and in
UV-Visible transmission spectrophotometry.
When TNT, HMX, RDX, and Tetryl are in solution the presence and wavelength of the
UV feature depends on the degree of concentration. The concentration dependence deviates
from the Beer-Lambert law leading to the conclusion that the transition is dependent on its
environment. This is further confirmed for TNT by the slight shift in wavelength of the solution

191
due to the polarity of the solvent. From this shift, it is interpreted that the MO transition is not an
n→π* transition, or a complex of the solvent and sample molecules. However, it does show that
the transition is due to a complex between sample molecules.
The absorption feature of interest in TNT is sensitive to high energy UV light, in that it
disappears with prolonged exposure at least at the surface. A change in the measured TNT
spectra is seen where only the near 420 nm feature diminished while the remainder of the
spectrum remains unchanged. From FTIR and chemical analysis, it is shown that this photo
effect is not due to the photodissociation of the NO2 groups creating DNT or MNT.
Molecular modeling results for TNT from ZINDO and DFT calculations are essentially
similar showing confidence in the reported results. The closest duplication of experimental
results and theory for TNT is achieved for three cases namely (1) involving one isolated
conformation A molecule, (2) molecular pairs compressed from equilibrium spacing, and (3) a
unit cell containing a twinning stacking fault. In the computational results, the MO transitions
that most closely represent the long wavelength transition in TNT is from the HOMO of a ring
carbon and the nitrogen-oxygen molecular orbital to the LUMO of the same nitrogen and oxygen
molecular orbital.
A number of other modeling attempts were conducted to possibly interpret the
experimental results including, derivatives of TNT, components of the TNT molecule, varying
numbers of molecules in a space, and pairs and unit cells of energetic materials. However, they
did not lead to the UV or blue absorption features.
Computational chemistry results for other energetic materials show interesting results as
well. All the long wavelength MO transitions are located within the molecular orbitals of the

192
nitro groups in all of the materials similar to TNT. Unlike TNT, MO transitions at longer
wavelengths than the experimental results were found for RDX, HMX, Tetryl and PETN.
The experimental and computational results lead to the conclusion that the observed
transitions at the long wavelength end of the UV range are charge transfer self-complexes.
These complexes occur not only in the solid state but also in highly concentrated solutions in that
the particular molecule must interact with a second identical molecule in order for the observed
transition to be allowed. This conclusion can be extended to all of the tested energetic materials
that display similar experimental and computational results to TNT namely, RDX, HMX, and
Tetryl.
193
CHAPTER 9
FUTURE WORK
The physical origin of the observed 420 nm absorption for TNT has been presented. While
this explanation is sound, further work would solidify the proposed theory and applicability to
other energetic materials.
9.1 Optical Characterization
The differential reflection work was performed using polycrystalline samples of the
energetic materials and unpolarized light. As described in Section 3.2, the components of the
dipole strength vector can determine the probability of a particular electron transition. This
information can be found for a sample molecule by measuring the absorption using polarized
light and a single crystal or thin-film sample93
. The molecular orbitals in a molecule can be
probed by light that is polarized in the same direction as their dipole moment components. If the
polarity is in a different direction than the dipole moment component of molecular transition, it
will not be allowed and no interaction with the molecular orbital will occur. From this, the
specific molecular orbitals involved in the transition of interest are determined.
In regards to the samples, several processes for growing single crystals of TNT has been
describe in the literature. However, the applicability of the crystals to DRS measurements is
questionable78,84,98
. DRS depends on the presence of an inhomogeneous sample in order for a
difference in reflectivity to be detected; a single crystal may be too homogeneous to yield
detectable absorption features. Therefore a thin film process is recommended. The DRS
instrument would also need to be fitted with a polarizer for the incident and the reflected light
from the sample.
The vast majority of the experimental work was performed using TNT due to its
availability and common use in explosive devices. Optical characterization, particularly the

194
experiments using the UV-Visible spectrophotometer, should be repeated with other energetic
materials, particularly the recently used liquid explosives based on peroxide and acetone. It is
proposed to perform further experimentation using the energetic materials in different solvents
and investigating more closely the behavior of the absorption peak of interest with decreasing
concentration are proposed. The results can then be compared to those of TNT and the
applicability of the proposed theory investigated.
As mentioned in Section 4.1.1 the optical constants of energetic materials are not widely
known inhibiting the accuracy of line shape analysis. This problem can possibly be addressed by
using a spectroscopic ellipsometer to measure the optical constants for a single crystal sample
over a range of wavelengths.
9.2 Photolysis of Energetic Materials
The photolysis of TNT was briefly described and investigated in the reported research.
There are clearly several processes in the samples occurring concurrently during high energy UV
radiation. A limitation of light sources and their power output allowed only a few experiments to
be performed. Using stronger light sources of different wavelengths would make additional
experiments more successful and meaningful. In addition, several of the other energetic
materials measured by the DRS have a C-N bond that could potentially be photodissociated with
high energy light. The effect of UV radiation on these materials should also be investigated.
Additional chemical analysis on the irradiated samples along with the relationship to the
molecular crystal structure may provide more information on the observed phenomena.
9.3 Computational Chemistry
Chapter 6 demonstrated the great amount of information that can be discovered using
computational chemistry methods. It is admitted that a simplified method was used for the
calculations. A more complicated method such as time dependant density functional theory

195
(TDDFT) would probably be able to show more molecular orbital transitions. In addition,
calculations involving far more than eight molecules could be accomplished with a more
powerful computer, which may better represent a real system.

196
APPENDIX A
EXTENDED BACKGROUND OF MOLECULAR ORBITAL THEORY
A.1 Electrons
An atom is constructed mainly of protons, neutrons, and electrons. The protons and
neutrons are primarily located in the mass center of the atom termed the nucleus, while the
electrons occupy the space outside the nucleus as an electron cloud. In essence the electrons
orbit the atom nucleus as the planets orbit the sun. This orbit is not a defined path like the
planets but instead a position outside the nucleus of the atom where the electron has a high
probability of occupying93
. The exact location of an electron cannot be pin pointed. Only the
effects of an electron are seen and can be found daily in cathode ray tube televisions and in
science by electron microscopy techniques.
An electron portrays both particle and wave characteristics, making it a very unique and
fascinating entity. The particle behavior is embodied by the electron having a defined mass and
charge. This is seen when the velocity vector of an electron is disturbed by the presence of an
external electric field, such as in a cathode ray tube. A wave is characterized as having
periodicity in space and time and defined by a velocity, wavelength, and a frequency. Electron
beams are examples of these wave characteristics.
The wave characteristics of an electron are mathematically described by a wave function as
contained in the Schrödinger equation. A time dependent Schrödinger equation defines the wave
with respect to space and time. The physical behavior of the electron can be calculated from this
equation and is the basis of nearly all the principles in this research.
A.2 Atomic orbitals
As stated in Section A.1 the electrons of an atom occupy the space surrounding the nucleus
in an atom. The manner in which they occupy this space is determined by the number of

197
electrons present and their energies. Even though the electrons do no have a defined position in
the atom, since they exist in an electron cloud, they are expressed to occupy defined energy
levels. These levels are often termed as orbitals because they are depicted as orbits surrounding
the center nucleus much like the solar system.
For simplicity, simple integers termed quantum numbers are used to describe the electrons
in an atom that are represented in the wave equation. The first (principle) quantum number (n)
describes the energy as a number that is always positive and whole, the smallest possible being
one (ground state). Atomic orbital shape is described by the second (azimuthal) quantum
number (l). The value of l is determined by the angular momentum of the electron due to the
orbit around the nucleus. By quantum theory the shape of an orbital is restricted by the energy of
the orbital. Therefore, the smaller n is the smaller the orbital and consequently the possible
shape of the orbital is more restricted. For example, hydrogen atom n is equal to one and the
orbital shape can only be spherical. The second quantum number is most commonly represented
by the letters s, p, d, and f that correspond to the different shapes of the atomic orbitals.
The last two quantum numbers are the magnetic and the spin quantum numbers ml and ms
respectively. An orbital’s preferred orientation (of the vector representing the angular
momentum) is described by the magnetic quantum number. This is not applied to s orbitals
because they are spherical and do not have a preferred orientation. These quantum numbers are
a positive or negative whole integer between 1 and -1. The spin quantum number has two
possible values spin up (+1/2) and spin down (-1/2) that represent the spin direction of the
electron. The Pauli exclusion principle states that no two electrons in an atom can have the same
set of quantum numbers. This simply declares that no two electrons can occupy the same place
at the same time, which is intuitive. The exclusion principle also determines how the electrons in
198
an atom are distributed. For example, an oxygen has eight electrons, so with the exclusion
principle in mind, the electrons are distributed as two in 1s, two in 2s, and four in 2p.
The quantum numbers described determine the symmetry of the atomic orbitals which in
turn express the molecular orbitals and have a great impact on the energies of these molecular
orbitals and the transitions that are allowed.
A.3 Molecular orbitals
Atomic orbitals are combined in the bonding of two or more atoms creating molecules. As
two atoms approach each other in space and their electrons interact for covalent bonding, their
atomic orbitals engage as well. Depending on the atomic orbitals of the individual atoms, the
electrons are redistributed between the two atoms so that the electrons are shared and the total
energy of the new molecule is minimized. Consequently the atomic orbitals combine into
molecular orbitals where the electrons now shared by more than one atoms in the molecule.
The molecular orbitals described above are formed by the linear combination of the
contributing atomic orbitals. That is, the wave functions of the molecular orbitals are simply
added together to form one new orbital. Quantum mechanics dictates that the linear combination
of the two atomic orbitals must yield two molecular orbitals. Hence the atomic orbitals are
subtracted, another linear combination, giving the second unoccupied orbital or anti-bonding
orbital. Non-bonding orbitals are not combined because they do not participate in the bonding of
the molecule and are usually seen as lone electrons in the valence orbitals of the atom and
molecule.
The molecular orbitals are named according to their function in the bond62
. Bonding
orbitals σ and π are those that are occupied by electrons forming chemical bonds from the s and p
orbitals of the atoms respectively. The non-bonding orbitals n contain electrons that are not
bonded to another atom, while anti-bonding orbitals, here σ* and π*, are unoccupied. These

199
orbitals have a given energy and are arranged in that the energy of σ* > π* >n> π> σ. The
energy of the molecular orbitals is lower than the energy of the atomic orbitals shown in Figure
A-1. This reflects the higher stability and lower overall energy of a molecule than the individual
atoms.
Large molecules are composed of several smaller molecules. When these are combine the
resulting molecular orbitals can be distributed throughout the entire molecule, among bonded
molecules, or remain within the small molecule. This can be observed in the molecular orbital
energy diagram of TNT. TNT is synthesized by nitrating toluene where nitro (NO2) groups are
substituted on the benzene ring at available sites. The nitro groups are electron withdrawing in
that they take an electron from the benzene ring. This alters the energy of the benzene molecular
orbital but the π orbitals are still localized on the ring carbons. A molecular orbital is formed
from the atomic orbital of the C of the benzene ring and the N of the nitro group. However, there
are no molecular orbitals between the oxygen of the nitro groups and the ring carbons.
Similar to space groups for crystal structures molecules have a defined symmetry that
belongs to a specific point group93
. The influence of the symmetry operators on the molecule
determines the symmetry of its molecular orbitals. This symmetry is reflected in the wave
equations that describe the molecular orbitals.
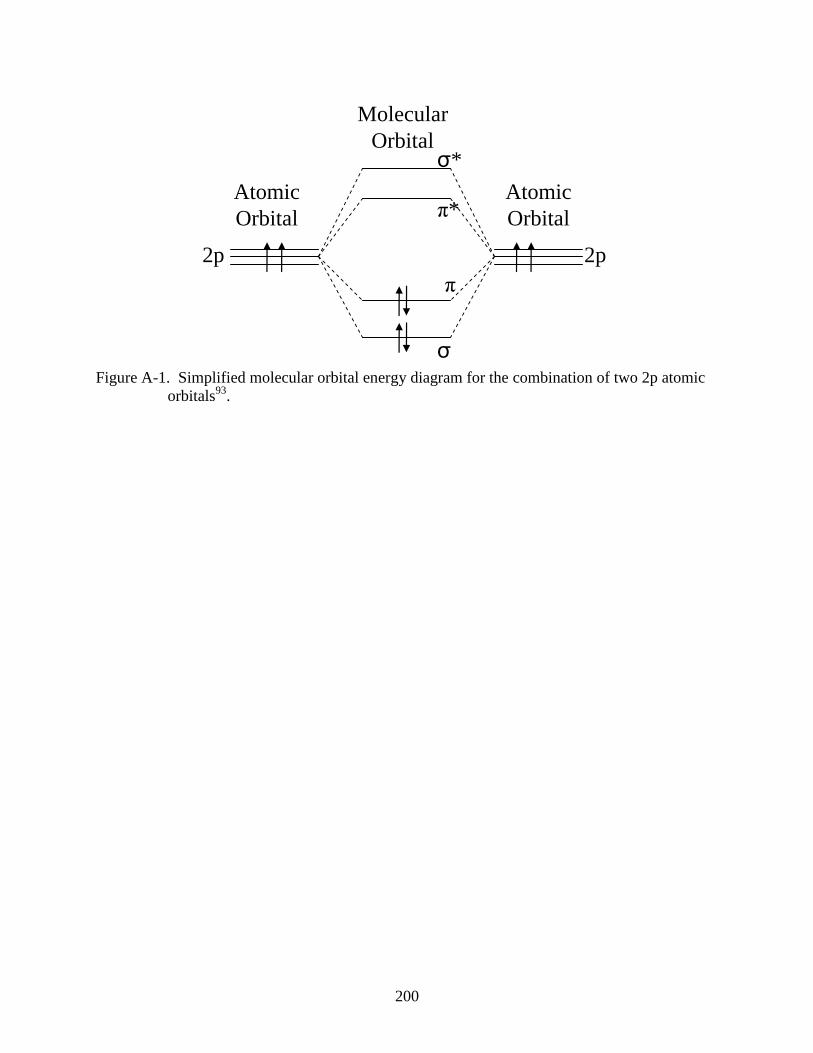
200
Figure A-1. Simplified molecular orbital energy diagram for the combination of two 2p atomic
orbitals93
.
Atomic
Orbital
Atomic
Orbital
Molecular
Orbital
2p 2p
σ
π
π*
σ*
201
LIST OF REFERENCES
1 M. W. Todd, R. A. Provencal, T. G. Owano, B. A. Paldus, A. Kachanov, K. L.
Vodopyanov, M. Hunter, S. L. Coy, J. I. Steinfeld, and J. T. Arnold, Applied Physics B-
Lasers and Optics 75, 367-376 (2002).
2
D. M. Sheen, D. L. McMakin, and T. E. Hall, Abstracts of Papers of the American
Chemical Society 230, U328-U329 (2005).
3
G. P. Kulemin and V. B. Razskazovsky, Ieee Transactions on Antennas and Propagation
45, 740-743 (1997).
4
I. Morino, K. M. T. Yamada, and A. G. Maki, Journal of Molecular Spectroscopy 196,
131-138 (1999).
5
J. Yinon and S. Zitrin, The analysis of explosives, Vol. 3 (Pergamon, USA, 1981). 6
E. R. Menzel, L. W. Menzel, and J. R. Schwierking, TheScientificWorldJOURNAL 4,
725-735 (2004).
7
E. R. Menzel, K. K. Bouldin, and R. H. Murdock, TheScientificWorldJOURNAL 4, 55-
66 (2004).
8
S. K. Sharma, A. K. Misra, and B. Sharma, Spectrochimica Acta Part a-Molecular and
Biomolecular Spectroscopy 61, 2404-2412 (2005).
9
K. Albert, M. L. Myrick, S. Brown, D. James, F. Milanovich, and D. Walt,
Environmental Science Technology 35, 3193-3200 (2001).
10
R. E. Hummel, D. B. Dove, and J. A. Holbrook, Physical Review Letters 25, 290-292
(1970).
11
R. E. Hummel, A. Fuller, C. Schollhorn, and P. Holloway, Applied Physics Letters 88,
1903-1905 (2006).
12
C. Schoellhorn, A. Fuller, J. Gratier, and R. E. Hummel, Applied Optics 46 (2007).
13
C. Schoellhorn, A. Fuller, J. Gratier, and R. E. Hummel, in New developments on
standoff detection of explosive materials by differential reflectometry, Orlando, FL, 2007
(SPIE).
14
R. E. Hummel, A. Fuller, C. Schoellhorn, and P. Holloway, in Trace chemical sensing of
explosives, edited by R. L. Woodfin (John Wiley, N.Y., 2007), p. 301.
15
A. Fuller, R. E. Hummel, C. Schoellhorn, and P. Holloway, in Stand off Detection of
Explosive Materials by Differential Reflectometry, Boston, MA, 2006 (SPIE).
202
16 D. Stull, Fundamentals of Fire and Explosions (American Institute of Chemical
Engineers, New York, 1977).
17
J. Yinon, Trends in analytical chemistry 21, 292-301 (2002).
18
N. E. Ipe, A. Akery, P. Ryge, D. Brown, F. Liu, J. Thieu, and B. James, Radiation
Protection Dosimetry 116, 347-351 (2005).
19
R. M. Deas, M. J. Gaskell, K. Long, N. F. Peirson, M. D. Rowe, and J. A. S. Smith,
Proceedings of the SPIE 5415, 510-520 (2003).
20
G. Bakken, G. Kauffman, P. Jurs, K. Albert, and S. Stitzel, Sensors and Actuators B 79,
1-10 (2001).
21
W. A. Schroeder, P. E. Wilcox, K. N. Trueblood, and A. O. Dekker, Analytical
Chemistry 23, 1740-1747 (1951).
22
A. Usachev, Applied Spectroscopy 55, 125-136 (2001).
23
D. Felt, S. Larson, and E. Valente, Chemosphere 49, 287-295 (2002).
24
R. L. Prasad and R. Prasad, Spectrochimica acta Part A 58, 3093-3102 (2002).
25
D. Stahl and D. Tilotta, Environmental Science Technology 35, 3507-3512 (2001).
26
K. J. Smit, Journal of Energetic Materials 9, 82-103 (1991).
27
K. W. Weissmahr, S. B. Haderlein, R. P. Schwarzenbach, R. Hany, and R. Nuesch,
Environmental Science & Technology 31, 240-247 (1997).
28
S. Content, W. Trogler, and M. Sailor, Chem Eur J. 6, 2205-2213 (2000).
29
S. Glazier, J. Barron, N. Morales, A. M. Ruschak, P. Houston, and H. Abruna,
Macromolecules 36, 1272-1278 (2003).
30
W. J. Salcedo, F. J. R. Fernandez, and J. C. Rubin, Spectrochimica Acta Part A 60, 1065-
1070 (2004).
31
H. Sohn, Journal of the American Chemical Society 125, 3821-3830 (2003).
32
J. Goodpaster and V. McGuffin, Analytical Chemistry 73, 2004-2011 (2001).
33
J. C. Carter, S. M. Angel, M. Lawrence-Snyder, J. Scaffidi, R. E. Whipple, and J. G.
Reynolds, Applied Spectroscopy 59, 769-775 (2005).

203
34 J. Janni, B. D. Gilbert, R. W. Field, and J. I. Steinfeld, Spectrochimica Acta Part a-
Molecular and Biomolecular Spectroscopy 53, 1375-1381 (1997).
35
I. R. Lewis, N. W. Daniel Jr., N. C. Chaffin, P. R. Griffiths, and M. W. Tungol,
Spectrochimica acta Part A 51, 1985-2000 (1995).
36
M. L. Lewis, I. R. Lewis, and P. R. Griffiths, Vibrational Spectroscopy 38, 17-28 (2005).
37
M. L. Lewis, I. R. Lewis, and P. R. Griffiths, Vibrational Spectroscopy 38, 11-16 (2005).
38
D. S. Moore, Review of Scientific Instruments 75, 2499-2512 (2004).
39
C. McHugh, R. Keir, D. Graham, and W. E. Smith, Chem Communications, 580-581
(2002).
40
C. J. McHugh, W. E. Smith, and D. Graham, Abstracts of Papers of the American
Chemical Society 222, U86-U87 (2001).
41
D. Graham, A. R. Kennedy, C. J. McHugh, W. E. Smith, W. I. F. David, K. Shankland,
and N. Shankland, New Journal of Chemistry 28, 161-165 (2004).
42
C. J. McHugh, W. E. Smith, R. Lacey, and D. Graham, Chemical Communications,
2514-2515 (2002).
43
C. J. McHugh, R. Keir, D. Graham, and W. E. Smith, Chemical Communications, 580-
581 (2002).
44
Y. Hu, P. Huang, L. Guo, X. Wang, and C. Zhang, Physics Letters A 359, 728-732
(2006).
45
M. C. Kemp, P. F. Taday, B. E. Cole, J. A. Cluff, A. J. Fitzgerald, and W. R. Tribe, in
Security applications of terahertz technology, Orlando, FL, 2003 (SPIE), p. 44-52.
46
J. Federici, R. Barat, D. Gary, Z. H. Michalopoulou, and D. Zimdars, American
Laboratory 38, 28-33 (2006).
47
H. Zhong, A. Redo-Sanchez, and X. C. Zhang, Optics Express 14, 9130-9141 (2006).
48
T. Arusi-Parpar, D. Heflinger, and R. Lavi, Applied Optics 40, 6677-6681 (2001).
49
G. Boudreaux, T. Miller, A. Kunefke, J. Singh, F.-Y. Yueh, and D. Monts, Applied
Optics 38, 1411-1417 (1999).
50
R. L. Pastel and R. C. Sausa, Applied Optics 39, 2487-2495 (2000).
51
M. O. Rodgers, K. Asai, and D. D. Davis, Applied Optics 19, 3597-3605 (1980).

204
52
J. Shu, I. Bar, and S. Rosenwaks, Applied Optics 38, 4705-4710 (1999).
53
J. B. Simeonsson and R. C. Sausa, Applied Spectroscopy Reviews 31, 1-72 (1996).
54
V. Swayambunathan, G. Singh, and R. Sausa, Applied Optics 38, 6447-6454 (1999).
55
D. Wu, J. Singh, F. Yueh, and D. Monts, Applied Optics 35, 3998-4003 (1996).
56
C. Bohling, D. Scheel, K. Hohmann, W. Schade, M. Reuter, and G. Holl, Applied Optics
45, 3817-3825 (2006).
57
F. C. De Lucia, R. S. Harmon, K. L. McNesby, R. J. Winkel, and A. W. Miziolek,
Applied Optics 42, 6148-6152 (2003).
58
R. E. Hummel, Electronic Properties of Materials, 3 ed. (Springer-Verlag New York
Inc., New York, 2001).
59
J. Akhavan, The Chemistry of Explosives, second ed. (The Royal Society of Chemistry,
Cambridge, 2004).
60
R. Gilardi and J. Karle, The structural Investigation of Energetic Materials: Chemistry of
Energetic Materials (Academic Press Inc., San Diego, CA, 1991).
61
H. Hart, L. Craine, and D. Hart, Organic Chemistry: A short course, tenth ed. (Houghton
Mifflin Company, New York, 1999).
62
J. Yinon and S. Zitrin, The analysis of explosives, Vol. 3 (Pergamon, USA, 1983).
63
R. Meyer, Explosives, Third ed. (VCH, Weinheim, Germany 1987).
64
P. Corfield, Chemistry & Industry, 4-4 (2006).
65
H. G. Gallagher, R. M. Vrcelj, and J. N. Sherwood, Journal of Crystal Growth 250, 486-
498 (2003).
66
W. R. Carper, L. P. Davis, and M. W. Extine, Journal of Physical Chemistry 86, 459-462
(1982).
67
J. Clarkson, W. E. Smith, D. Batchelder, and A. Smith, Journal of Molecular Structure
648, 203-214 (2003).
68
H. G. Gallagher, K. J. Roberts, J. N. Sherwood, and L. A. Smith, Journal of Materials
Chemistry 7, 229-235 (1997).
205
69 W. R. Carper, S. R. Bosco, and J. J. P. Stewart, Spectrochimica Acta Part a-Molecular
and Biomolecular Spectroscopy 42, 461-466 (1986).
70
P. C. Chen and W. Lo, Theochem-Journal of Molecular Structure 397, 21-32 (1997).
71
C. S. Choi and E. Prince, Acta Crystallographica Section B-Structural Crystallography
and Crystal Chemistry B 28, 2857-2862 (1972).
72
M. M. Kuklja and A. B. Kunz, Journal of Physical Chemistry B 103, 8427-8431 (1999).
73
W. L. Elban, R. W. Armstrong, K. C. Yoo, R. G. Rosemeier, and R. Y. Yee, Journal of
Materials Science 24, 1273-1280 (1989).
74
C. S. Choi and H. P. Boutin, Acta Crystallographica Section B-Structural Crystallography
and Crystal Chemistry B 26, 1235-1240 (1970).
75
H. H. Cady, Acta Crystallographica 23, 601-609 (1967).
76
Y. A. Gruzdkov and Y. M. Gupta, Journal of Physical Chemistry A 105, 6197-6202
(2001).
77
P. S. Makashir and E. M. Kurian, Propellants Explosives Pyrotechnics 24, 260-265
(1999).
78
M. M. Kuklja and A. B. Kunz, Journal of Applied Physics 89, 4962-4970 (2001).
79
D. Pavia, G. Lampman, and G. Kriz, Introduction to Spectroscopy (Harcourt, Inc.,
Orlando, 2001).
80
P. W. Atkins, Physical Chemistry, Third ed. (Oxford University Press, Oxford, 1986). 81
T. Abe, Bulletin of the Chemical Society of Japan 31, 904-907 (1958).
82
M. J. Kamlet, H. G. Adolph, and J. C. Hoffsommer, Journal of the American Chemical
Society 84, 3925-3928 (1962).
83
C. P. Conduit, Journal of the Chemical Society, 3273-3277 (1959).
84
P. L. Marinkas, J. E. Mapes, D. S. Downs, P. J. Kemmey, and A. C. Forsyth, Molecular
Crystals and Liquid Crystals 35, 15-25 (1976).
85
J. Stals, Barraclo.Cg, and A. S. Buchanan, Transactions of the Faraday Society 65, 904-
914 (1969).
86
M. K. Orloff, P. A. Mullen, and F. C. Rauch, Journal of Physical Chemistry 74, 2189-
2192 (1970).

206
87 J. N. Maycock, V. R. Verneker, and W. Lochte, Physica Status Solidi 35, 849-851
(1969).
88
F. Pristera, M. Halik, A. Castelli, and W. Fredericks, Analytical Chemistry 32, 495-508
(1960).
89
P. S. Makashir and E. M. Kurian, Journal of Thermal Analysis and Calorimetry 55, 173-
185 (1999).
90
J. A. Ciezak and S. F. Trevino, Journal of Physical Chemistry A 110, 5149-5155 (2006).
91
W. M. Trott and A. M. Renlund, Applied Optics 24, 1520-1525 (1985).
92
N. F. Fell, J. M. Widder, S. V. Medlin, J. B. Morris, R. A. PesceRodriguez, and K. L.
McNesby, Journal of Raman Spectroscopy 27, 97-104 (1996).
93
M. Orchin and H. H. Jaffe, Symmetry, Orbitals, and Spectra (S.O.S.) (John Wiley &
Sons, Inc., New York, 1971).
94
R. E. Hummel, in Encyclopedia of Analytical Chemistry, edited by R. A. Meyers (John
Wiley and Sons Ltd, Chichester, 2000), p. 9047-9071.
95
R. E. Hummel, Physica Status Solidi a-Applied Research 76, 11-44 (1983).
96
J. A. Holbrook and R. E. Hummel, Review of Scientific Instruments 44, 463-466 (1973).
97
R. Enderlein, R. E. Hummel, J. B. Andrews, R. J. Nastasiandrews, and C. W. Shanley,
Physica Status Solidi B-Basic Research 88, 173-178 (1978).
98
D. S. Downs and A. C. Forsyth, “Optical absorption of TNT single crystals,” (1973).
99
R. E. Hummel and R. Enderlein, Physical Review B 29, 1529-1533 (1984).
100
B. O. Seraphin and N. Bottka, Physical Review 145, 628-636 (1966).
101
R. M. Vrcelj, H. G. Gallagher, and J. N. Sherwood, Journal of the American Chemical
Society 123, 2291-2295 (2001).
102
ASM Handbook Volume 10: Materials Characterization; Vol., edited by R. E. Whan
(ASM international, USA, 1986).
103
C. Cramer, Essentials of computational chemistry: theories and models, 2nd ed. (Wiley,
Hoboken, NJ, 2004).
104
W. R. Mabey, D. Tse, A. Baraze, and T. Mill, Chemosphere 12, 3-16 (1983).

207
105 D. C. Schmelling, K. A. Gray, and P. V. Kamat, Environmental Science & Technology
30, 2547-2555 (1996).
106
M. A. Ronning, R. L. Atkins, and C. A. Heller, Journal of Photochemistry 9, 403-405
(1978).
107
H. H. Cady, D. T. Cromer, and A. C. Larson, Acta Crystallographica 16, 617-623 (1963).
108
C. Cantillo, Thesis, University of Puerto Rico, 2006.
109
L. M. Gomez, C. Osorio, E. Amman, S. P. Hernandez, and M. E. Castro, Chemical
Physics Letters 422, 313-316 (2006).
110
P. L. Marinkas, Journal of Luminescence 15, 57-67 (1977).
111
F. D. Lewis and B. A. Yoon, Journal of Organic Chemistry 59, 2537-2545 (1994).
112
C. P. Nash, T. E. Nelson, J. J. P. Stewart, and W. R. Carper, Spectrochimica Acta Part a-
Molecular and Biomolecular Spectroscopy 45, 585-588 (1989).

208
BIOGRAPHICAL SKETCH
Anna Fuller was born in Albuquerque, New Mexico on July 30, 1980. She graduated from
La Cueva High School in 1998 and enrolled in the University of Arizona in Tucson, AZ for the
fall semester. Anna graduated from the University of Arizona in May 2002 with her Bachelor of
Science in materials science and engineering specializing in electronic materials. She then began
attending the University of Florida in August of 2002 and received her Master of Science in
materials science and engineering in December 2004. Anna greatly anticipates working in
research and development to sharpen her skills and looks to eventually becoming a professor.