energy and global warming - amazon s3 · energy and global warming mcb 113 13 march 2007 note: some...
TRANSCRIPT
1
Lecture 1:Energy and Global Warming
MCB 11313 March 2007
Note: Some of the material in this talk was donated by Chris Somerville.
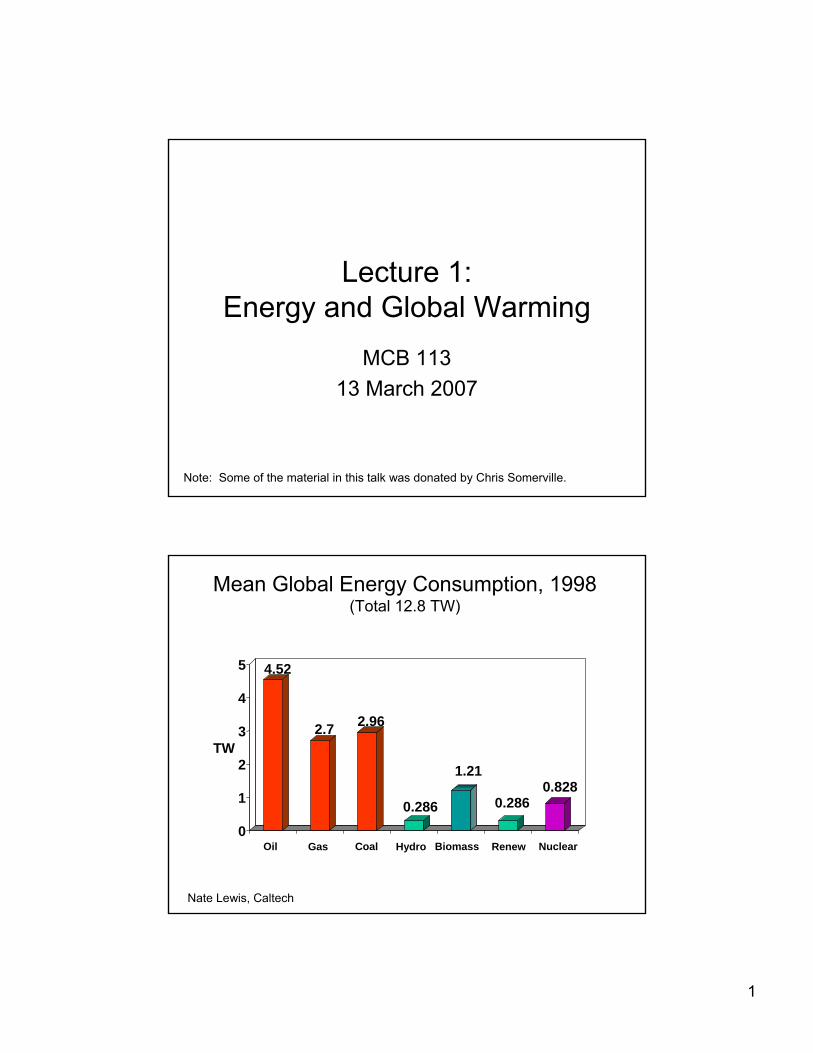
Mean Global Energy Consumption, 1998(Total 12.8 TW)
Gas Hydro Renew
4.52
2.7 2.96
0.286
1.21
0.2860.828
0
1
2
3
4
5
TW
Oil Coal Biomass Nuclear
Nate Lewis, Caltech
2
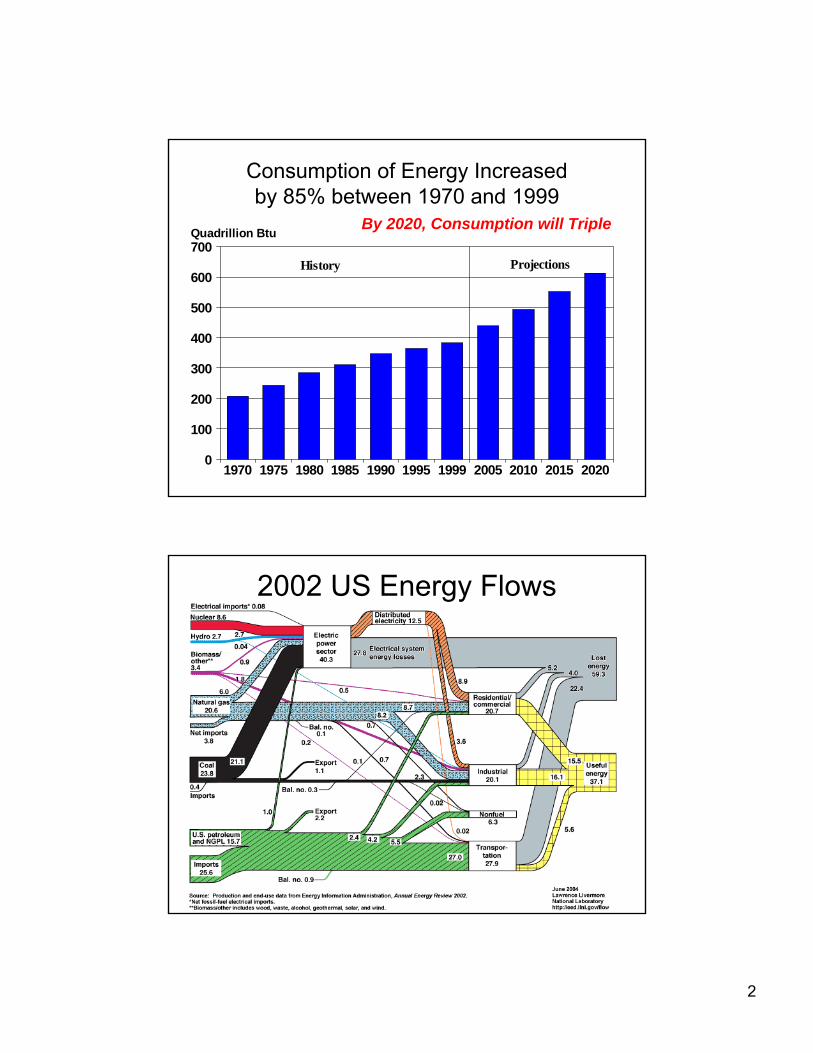
Consumption of Energy Increased by 85% between 1970 and 1999
20202015201020051999199519901985198019751970
700
600
500
400
300
200
100
0
Quadrillion Btu
History Projections
By 2020, Consumption will Triple
2002 US Energy Flows

3
World marketed energy use by fuel type
Source: Energy Information Administration
Net Petroleum Imports as a Percent of U.S. Petroleum Consumption

4
Hubbert Peak Theory for crude oil production
World Oil Production
Note: NGL = Natural Gas LiquidsSource: info.energyscenariosireland.com
Billions of barrels per year

5
World Oil Production
Historical Price of Oil
6
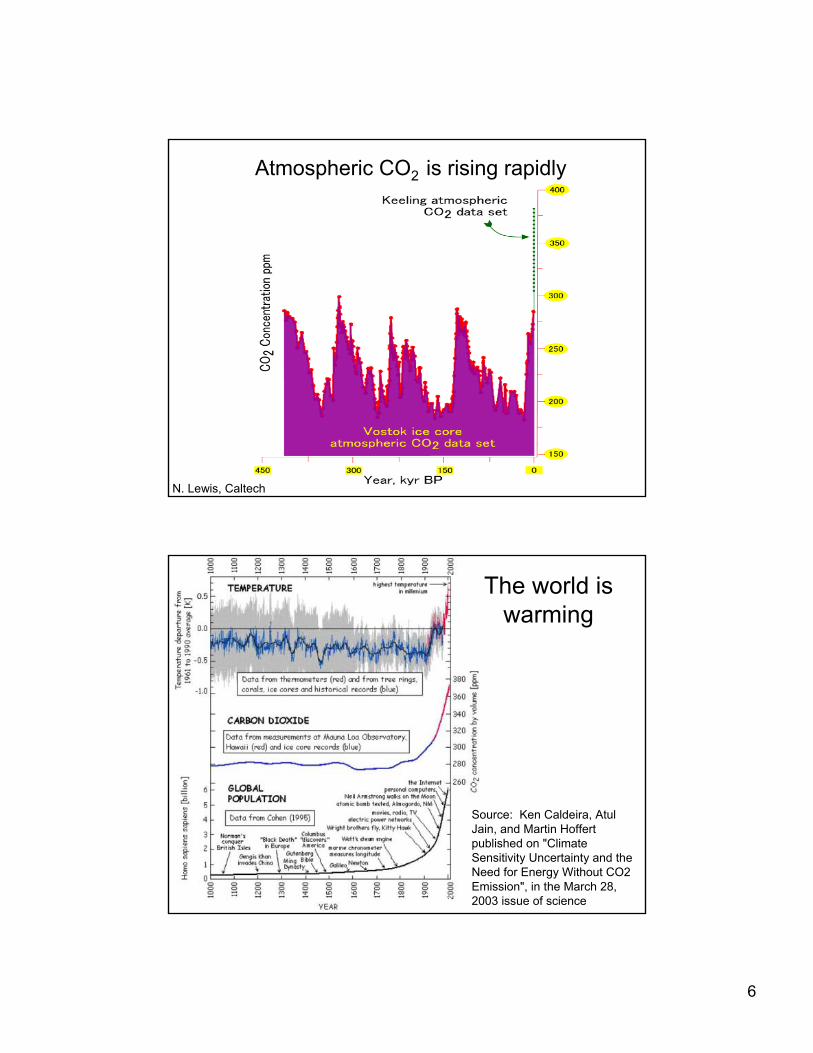
N. Lewis, Caltech
Atmospheric CO2 is rising rapidly
The world is warming
Source: Ken Caldeira, AtulJain, and Martin Hoffertpublished on "Climate Sensitivity Uncertainty and the Need for Energy Without CO2 Emission", in the March 28, 2003 issue of science

7
N. Lewis Caltech
CO2 release rises with per capita GDP
Carbon emissions per capita

8
Predicted effects on rainfall
www.metoffice.com/research/hadleycenter
CO2 concentration, temperature, and sea level continue to rise long after emissions are reduced

9
CO2 neutral options Estimated consumption 25 TW in 2050
• Nuclear– 1 new plant every 2 days for next 45 y
• Wind– 4 TW worldwide (~ 2 million windmills)
• Hydro, ocean, thermal• Photovoltaics• Sequestration• Biomass
The Sleipner Experiment1 million tons/y; capacity 600 B tons
7000 such sites needed
www.agiweb.org/geotimes
1000
M

10
Basis for a “hydrogen economy”
Hoffert et al. Science 298,981
Why Biofuels?
• Reduce dependency on imports– Strategic issues– Balance of payments– Economic development
• Global climate changeImported Domestic
6.4 bbl/year

11
Potential of underused renewable energy sources
Hydro Tides ¤ts
Wind Geothermal Solar Current use0.1
1
10
100
1000
10000
100000
1000000
TW
How much would every roof contribute?
• 7x10⁷ detached single family homes in U.S.• ≈2000 sq ft/roof = 180 m2/home• = 1.2x10¹⁰ m2 total roof area• Hence can (only) supply 0.25 TW, ≈7.5% U.S. Primary Energy Consumption
Nate Lewis, Caltech

12
~160,000 km2 of photovoltaic devices would meet US energy needs
3.3 TW
N. Lewis, Caltech
(in the U.S. in 2002)
1-4¢ 2.3-5.0¢ 6-8¢ 5-7¢
Production Cost of Electricity
6-7¢
25-50¢
Cos
t, ¢/
kW-h
r
0
5
10
15
20
25
Coal Gas Oil Wind Nuclear Solar
Courtesy of Nate Lewis, Caltech
No storage

13
How Biomass is Used for Energy
Biomass
Burn produce electricity
Thermochemicalconversion to
syngas products
Biochemicalconversion toethanol and other fuels
Mature Semi-mature(Capital intensive
ineficient)
In development
Current Bioenergy and Bioproduct Facilities
NREL

14
Chemical structure of starch
http://www.scientificpsychic.com/fitness/carbohydrates1.html
http://www.ucmp.berkeley.edu/monocots/corngrainls.jpg
STARCH
Corn yield averages 4.5 tons/acre at ~$77/ton
Ethanol from Cornstarch
Source: www.ethanol.org

15
A. E. Farrell et al., Science 311, 506 -508 (2006)
Net energy and net greenhouse gases for gasoline, six studies, and three cases
A DOE Ethanol Vision
Grain
Cellulose
0
10
20
30
40
50
60
70
2000 2005 2010 2015 2020 2025
Year
Eth
an
ol (B
illio
ns
of
gal/
yr)
EXISTING EMERGING
SugarPlatform-New Enzymes-Pretreatment-Fermentation
ADVANCED
FundamentalAdvances inLignocelluloseProcessingand fermentation
Modified from Richard Bain, NREL
16
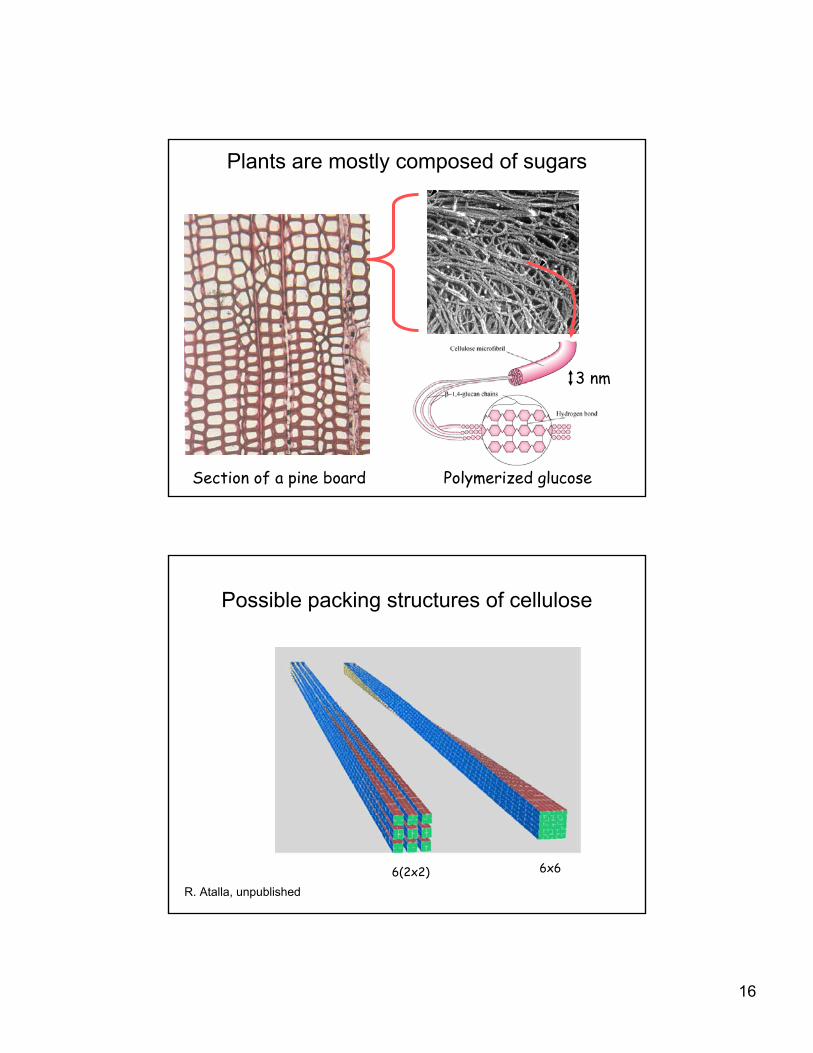
Plants are mostly composed of sugars
Section of a pine board
3 nm
Polymerized glucose
Possible packing structures of cellulose
6(2x2) 6x6
R. Atalla, unpublished
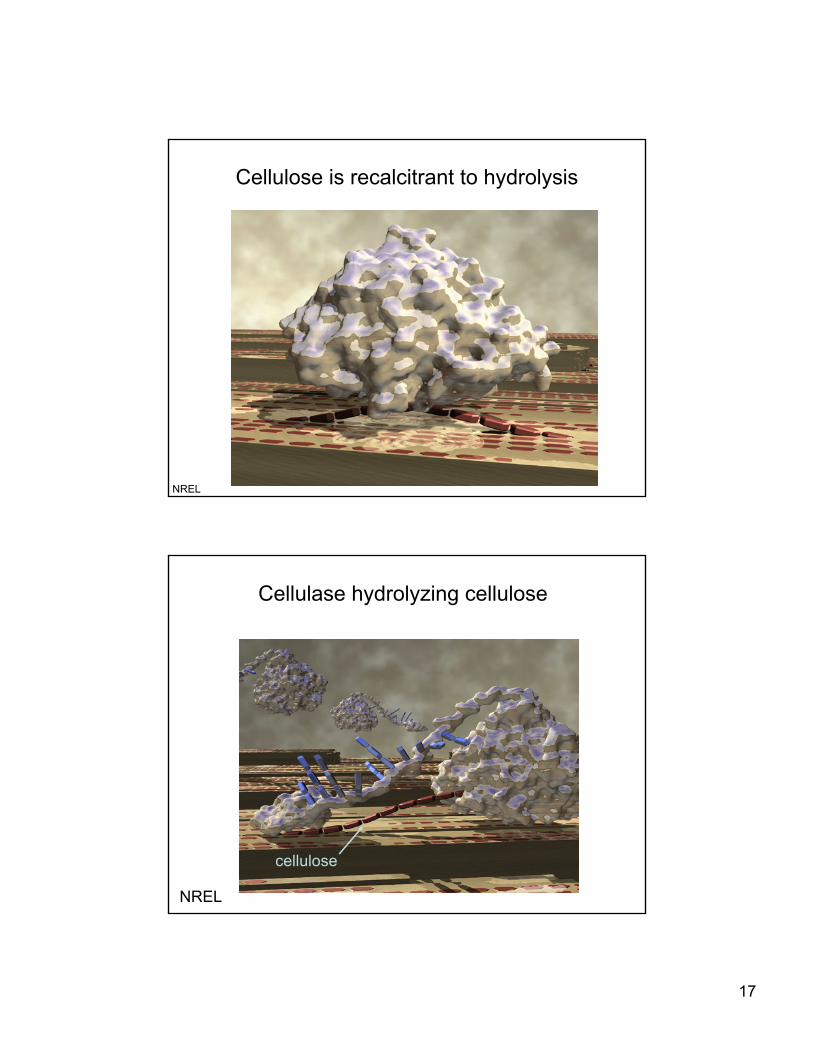
17
Cellulose is recalcitrant to hydrolysis
NREL
Cellulase hydrolyzing cellulose
cellulose
NREL

18
Scale model of a cell wall
Cellulose
Hemicellulose+ Lignin
Cellulose is occluded by other polymers

19
Linocellulose to ethanol process
Conc. H 2SO4
Water
Gypsum
Water
PurifiedSugar Solution
Lignin Utilization
Ethanolrecovery
Fermentor
Neutralization Tank
Acid Reconcentration
Acid/Sugar Separation
DecrystallizationHydrolysis
Hydrolysis
Biomass
Ethanoldehydration
The challenge is efficient conversion
• Burning switchgrass (10 t/ha) yields 14.6-fold more energy than input to produce*
• But, converting switchgrass to ethanol calculated to consume 45% more energy than produced
Biomass
Transport
Other
Steam
Electricity
Grinding
Energy consumption
*Pimentel & Patzek, Nat Res Res 14,65 (2005)

20
Linocellulose to Hydrophobe Process
Conc. H 2SO4
Water
Gypsum
Water
PurifiedSugar Solution
Lignin Utilization
Hydrophobe
Fermentor
Neutralization Tank
Acid Reconcentration
Acid/Sugar Separation
DecrystallizationHydrolysis
Hydrolysis
Biomass 69 kt Ca, K, Mg, P66 kt lipids, waxes171 kt protein
Ethanol from glucose or xylose
Jeffries & Shi Adv Bioch Eng 65,118

21
Conversion of sugar to alkanes
Huber et al., (2005) Science 308,1446
Relative cost factors of cellulosic ethanol
Biomass Feedstock
Feed Handling
Pretreatment / Conditioning
Saccharification and fermentation
Cellulase
Distillation and Solids Recovery
Wastewater Treatment
Boiler/Turbogenerator
Utilities
Storage
(0.30) (0.20) (0.10) - 0.10 0.20 0.30 0.40
Capital Recovery Charge* Raw Materials Process ElectricityGrid Electricity Total Plant Electricity Fixed Costs
33%
5%
18%
12%
9%
10%
4%
4%
4%
1%
NREL Analysis

22
Cost/gallon = (Y + aX)/X
GALLONS (X)
Feedstock, energy,Transportation, etc
capitalCost
Y
Y1
Plot of Cost/gal = (Y + aX)/X
0
20
40
60
80
100
120
1 2 3 4 5 6 7 8 9 10
Gallons (X)
Cos
t/Gal
At 15 t/a, 300 Mgal ~ 30% of all land in 20 mile radius1 mi x 0.5 mi x 35 ft
23
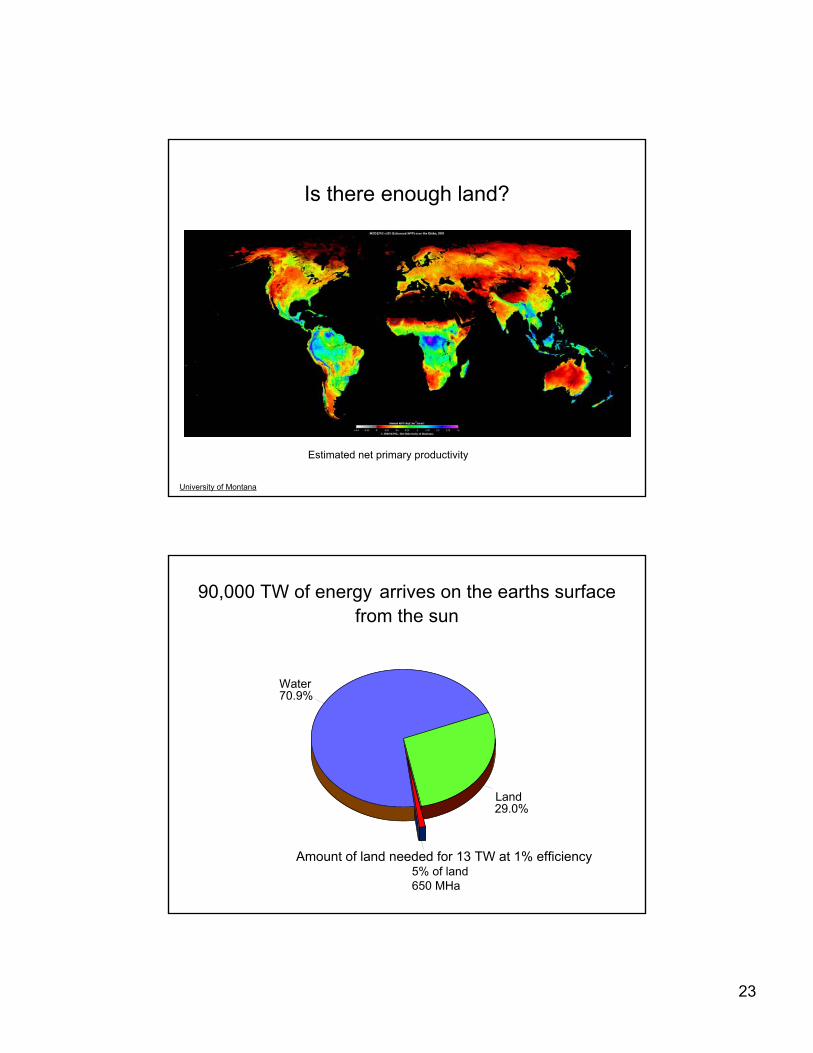
Is there enough land?
Estimated net primary productivity
University of Montana
90,000 TW of energy arrives on the earths surface from the sun
5% of land650 MHa
Land29.0%
Water70.9%
Amount of land needed for 13 TW at 1% efficiency

24
>2% yield is feasibleYield of 26.5 tons/acre observed by Young & colleagues
in Illinois, without irrigation
Cou
rtesy
of S
teve
Lon
g et
al
Why is photosynthetic efficiency so low?
• Visible portion of spectrum• Active areas of plants• Photo-inhibition
– Antenna length• Electron transfer losses
Wes Hermann, Stanford

25
Julian day 1993
100 150 200 250 300 350
PAR
inte
rcep
tion
(%)
0
20
40
60
80
100
Miscanthus x giganteus
Spartinacynosuroides
Zea mays
Courtesy of Steve Long, University of Illinois
Perennials have more photosynthesis
Harvesting Miscanthus
http://bioenergy.ornl.gov/gallery/index.html

26
Land Usage
Forest & Savannah
Cereal4.6% Pasture & Range
23.7%
30.5%
Other crops6.9%
Nonarable
34.4%
1950 1955 1960 1965 1970 1975 1980 1985 1990 1995Year
0
500
1000
1500
2000
M H
ecta
res
Actual1950 equivalent
Data from Worldwatch database 1996, 1997
Hectares of Grain With and Without Yield Improvements

27
Limiting factors for global NPP
Baldocchi et al. 2004 SCOPE 62
Land use is fungible
• High plant productivity is equally important for food and energy production
• Plant productivity is a function of many aspects of growth and development so a broad approach to knowledge creation is essential
28
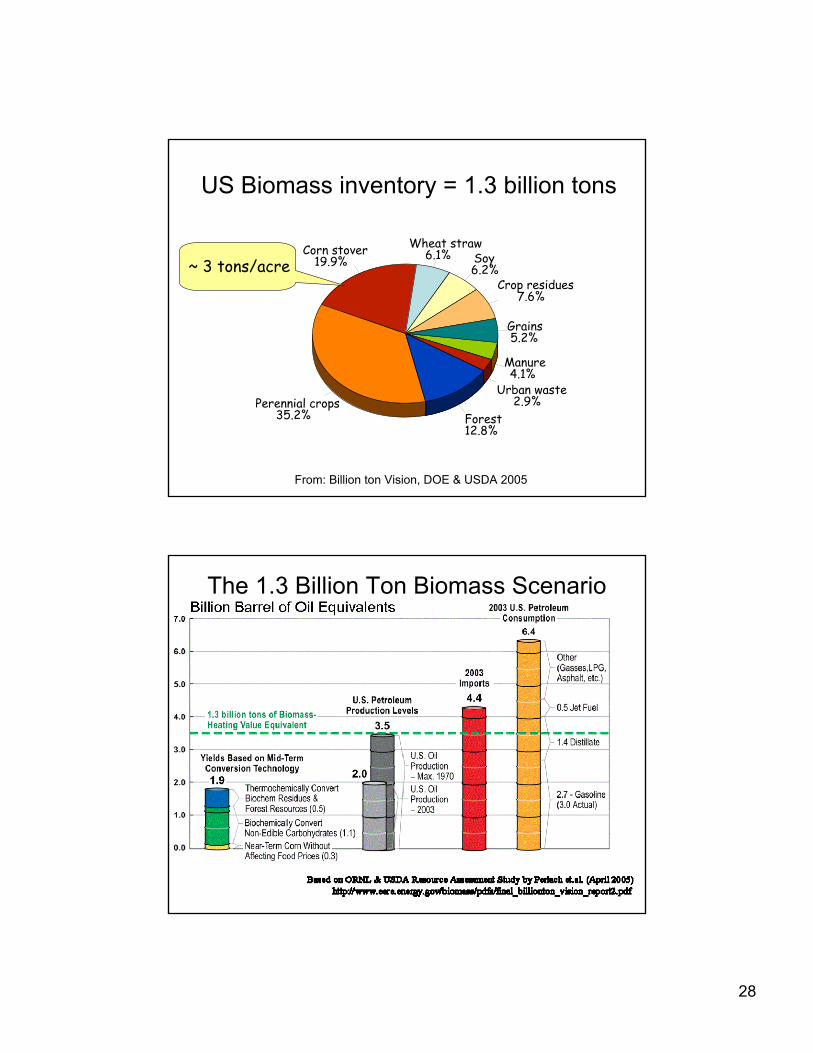
US Biomass inventory = 1.3 billion tons
Forest12.8%
Urban waste2.9%
Manure4.1%
Grains5.2%
Crop residues7.6%
Soy6.2%
Wheat straw6.1%Corn stover
19.9%
Perennial crops35.2%
From: Billion ton Vision, DOE & USDA 2005
~ 3 tons/acre
The 1.3 Billion Ton Biomass Scenario

29
Geographic distribution of biomass crops
Wright et al DOE-ORNL-EERE
Economics of Perennials are Favorable
33219352515 tonsMiscanthus
212138**35010 tonsSwitchgrass
170193*362160 buCorn
Profit$
Cost$
Value $@$35/t
Yieldper Acre
CROP
*USDA economic research service 2004**50% as much fertilizer, no chemicals

30
Conclusions
• We can meet a significant proportion of our fuel needs from plants– If pressed, we could meet all our needs
• Productivity of energy crops is not yet optimized
• The industrial processing of energy crops to fuels is not yet optimized
• There are no insurmountable problems to achieving cost-effective, carbon-neutral solar energy production from plants
Comments
• Energy crops are expected to be more environmentally benign than production agriculture– Low fertilizer and chemical inputs– Late-harvest supports biodiversity– Mixed cultures possible– Many species can be used