energy balances of bio-energy systems; the relative
TRANSCRIPT
Copernicus InstituteSustainable Development and Innovation Management
Energy balances of bio-energysystems; the relative position of
biogas production.- Workshop: Energy Crops & Biogas, ’pathways tosuccess?, Organized by Cropgen & IEA task 37,Utrecht, the Netherlands, September 22, 2005’ -
Andre FaaijCopernicus Institute – Utrecht University
Copernicus InstituteSustainable Development and Innovation Management
Issues
• Development of digestion so far.• Digestion as waste treatment option in
waste treatment infrastructure.• Some notions on energy crops.• Final remarks on energy crops &
digestion
Copernicus InstituteSustainable Development and Innovation Management
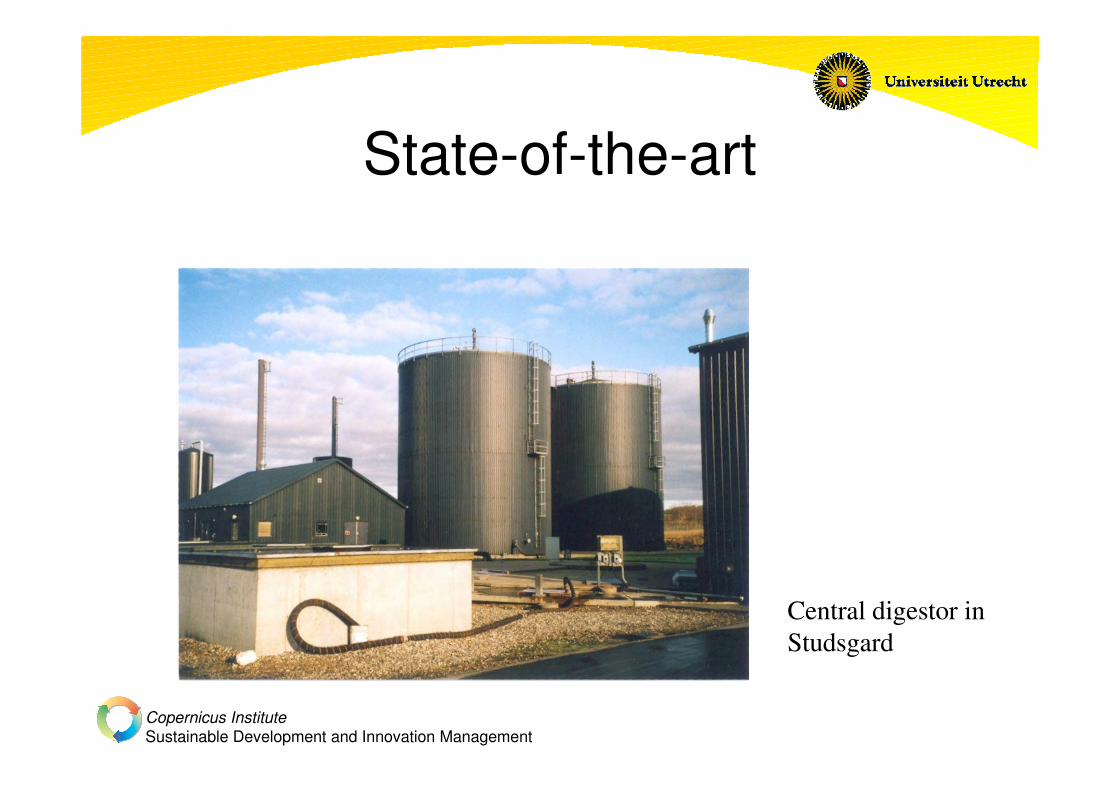
State-of-the-art
Central digestor in Studsgard
Copernicus InstituteSustainable Development and Innovation Management
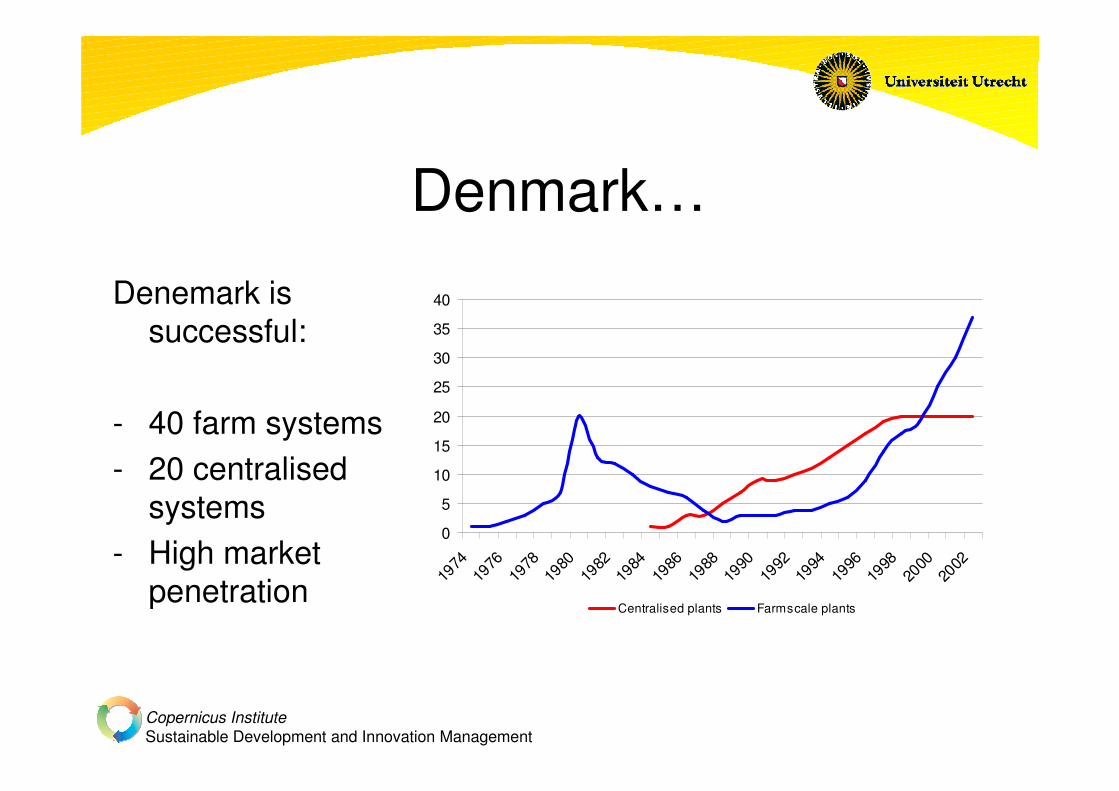
Denmark…
Denemark issuccessful:
- 40 farm systems- 20 centralised
systems- High market
penetration
0
5
10
15
20
25
30
35
40
1974
1976
1978
1980
1982
1984
1986
1988
1990
1992
1994
1996
1998
2000
2002
Centralised plants Farmscale plants
Copernicus InstituteSustainable Development and Innovation Management
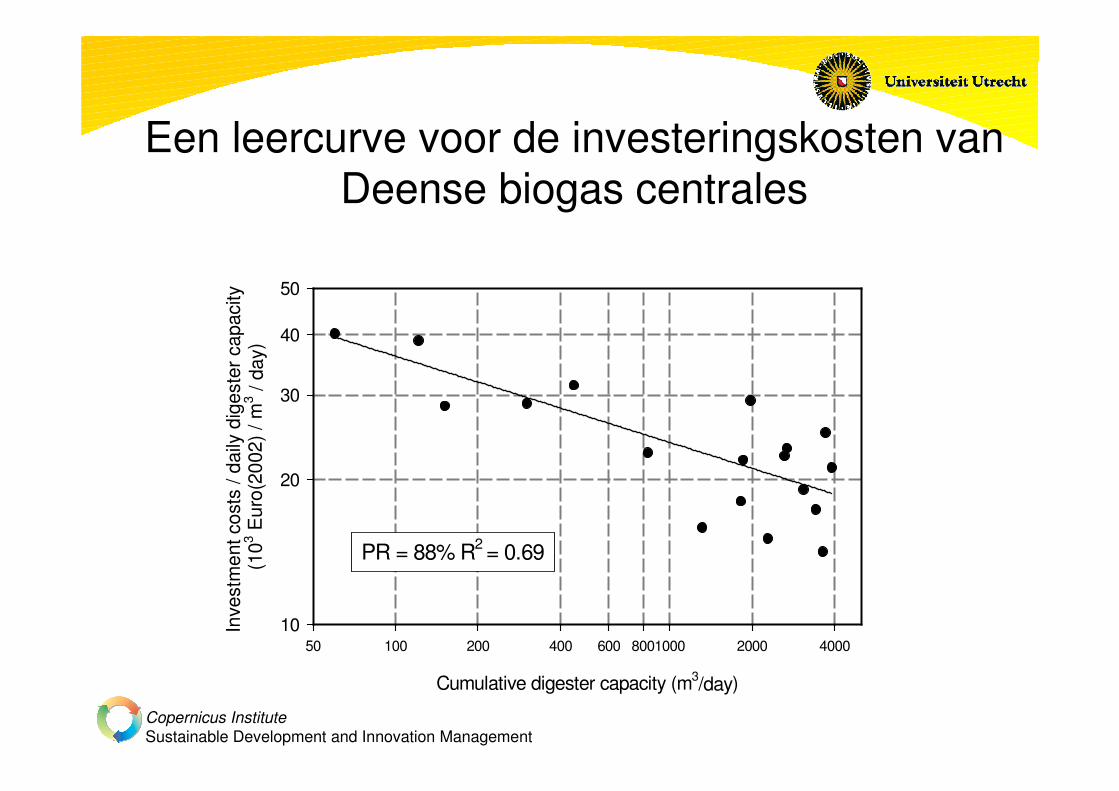
Een leercurve voor de investeringskosten vanDeense biogas centrales
Cumulative digester capacity (m3/day)
50 100 200 400 600 8001000 2000 4000
Inve
stm
ent c
osts
/ da
ily d
iges
ter c
apac
ity
(103 E
uro(
2002
) / m
3 / da
y)
10
20
30
40
50
PR = 88% R2 = 0.69
Copernicus InstituteSustainable Development and Innovation Management
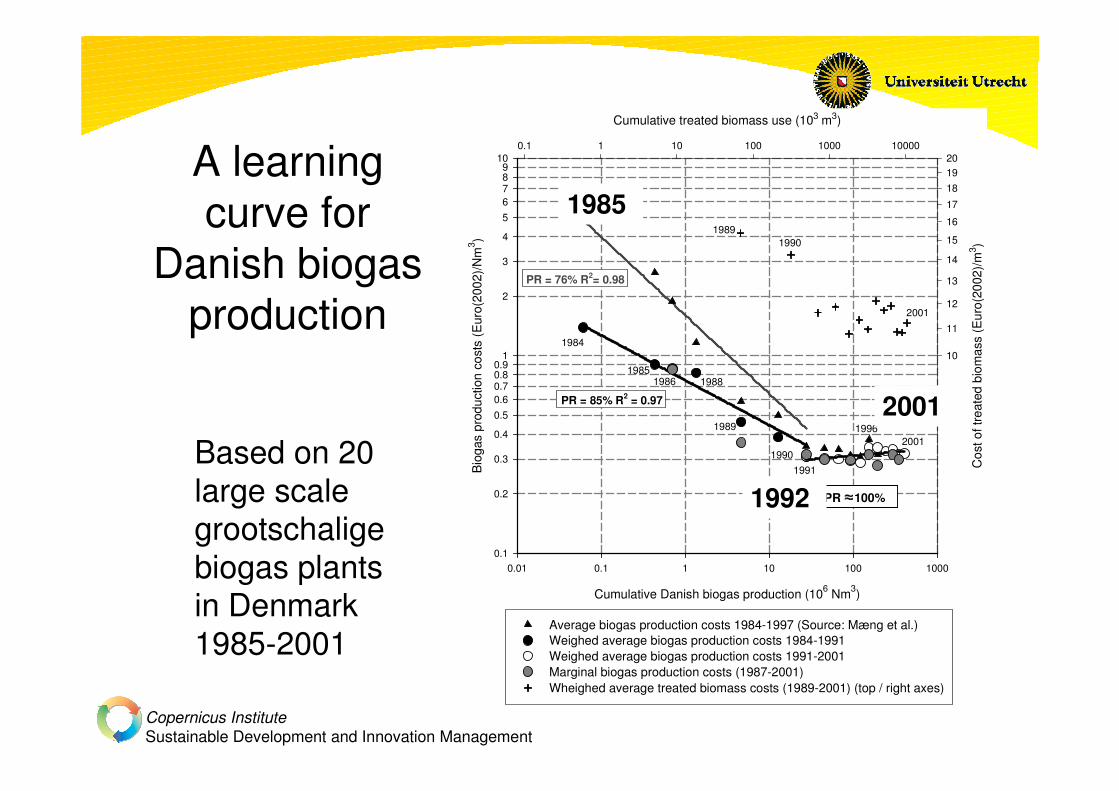
Based on 20large scalegrootschaligebiogas plantsin Denmark1985-2001
Cumulative Danish biogas production (106 Nm3)
0.01 0.1 1 10 100 1000
Bio
gas
prod
uctio
n co
sts
(Eur
o(20
02)/N
m3 )
0.1
0.2
0.3
0.4
0.50.60.70.80.9
1
2
3
4
56789
10
Cumulative treated biomass use (103 m3)
0.1 1 10 100 1000 10000
Cos
t of t
reat
ed b
iom
ass
(Eur
o(20
02)/m
3 )
10
11
12
13
14
15
16
17
181920
Average biogas production costs 1984-1997 (Source: Mæng et al.)Weighed average biogas production costs 1984-1991Weighed average biogas production costs 1991-2001Marginal biogas production costs (1987-2001)Wheighed average treated biomass costs (1989-2001) (top / right axes)
1984
1988
1989
1990
1986
2001
1991
1985
PR = 85% R2 = 0.97
PR = 76% R2= 0.98
1996
19891990
2001
PR 100%
A learningcurve for
Danish biogasproduction
1985
1992
2001
Copernicus InstituteSustainable Development and Innovation Management
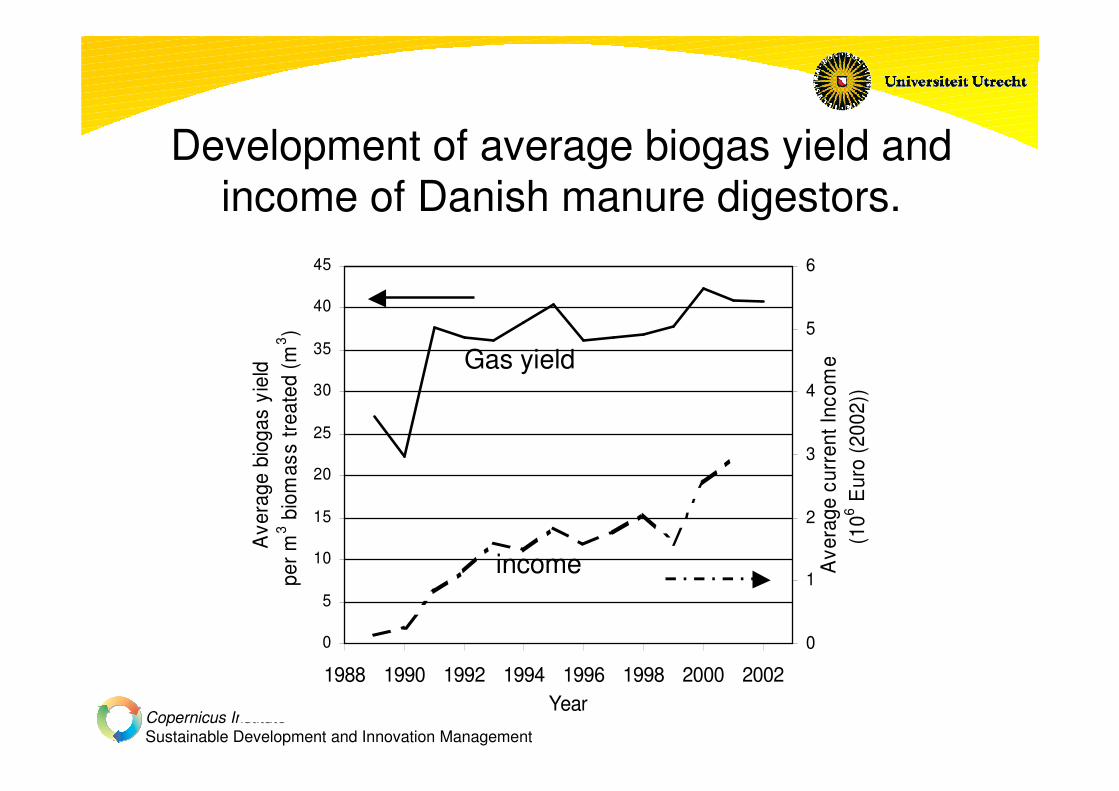
Development of average biogas yield andincome of Danish manure digestors.
0
5
10
15
20
25
30
35
40
45
1988 1990 1992 1994 1996 1998 2000 2002Year
Ave
rage
bio
gas
yiel
d pe
r m3 b
iom
ass
treat
ed (m
3 )
0
1
2
3
4
5
6
Ave
rage
cur
rent
Inco
me
(106 E
uro
(200
2))
Gas yield
income
Copernicus InstituteSustainable Development and Innovation Management
Some remarks:• Digestion has reached sound maturity
level (significant learning achieved overpast decades).
• Further cost reductions hampered byscarcity of co-digestate, stalling ofscale-up and market liberalisation.
• Continuity/stability of government policyvery important.
Copernicus InstituteSustainable Development and Innovation Management
More information on digestion:
Learning in renewable energytechnology development
(Martin Junginger)
Strategic Niche Managementfor Biomass (Rob Raven)
Copernicus InstituteSustainable Development and Innovation Management
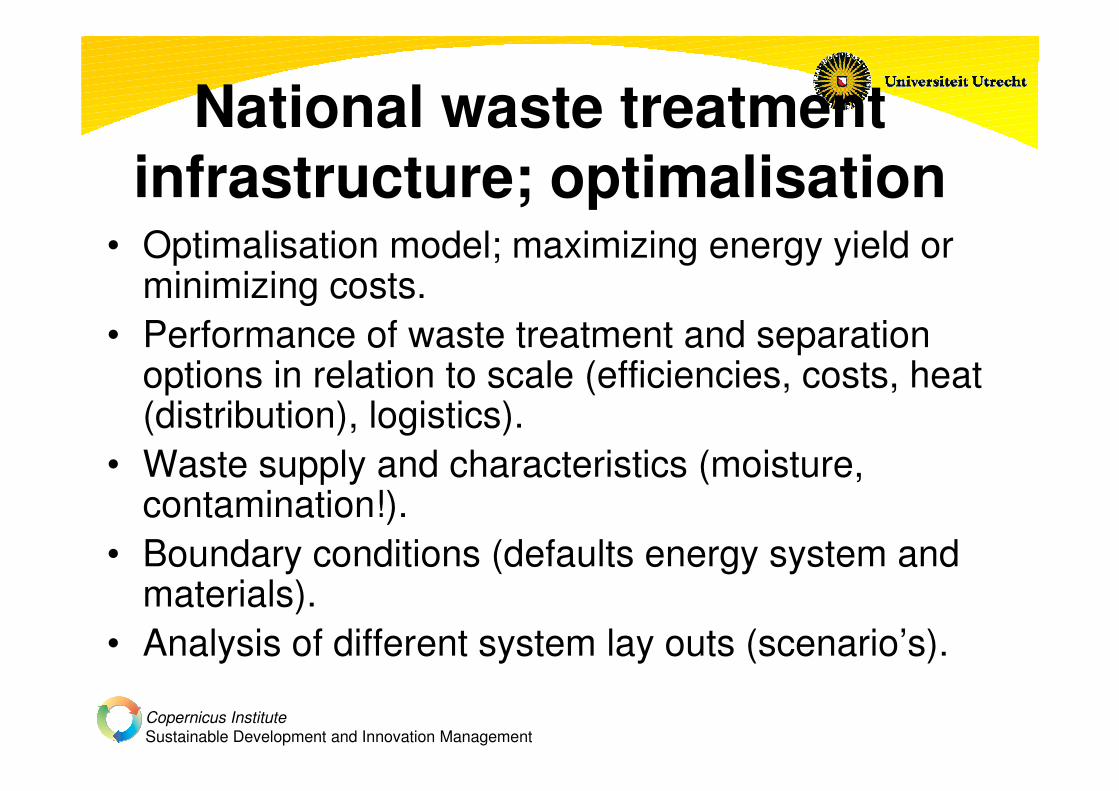
National waste treatmentinfrastructure; optimalisation
• Optimalisation model; maximizing energy yield orminimizing costs.
• Performance of waste treatment and separationoptions in relation to scale (efficiencies, costs, heat(distribution), logistics).
• Waste supply and characteristics (moisture,contamination!).
• Boundary conditions (defaults energy system andmaterials).
• Analysis of different system lay outs (scenario’s).
Copernicus InstituteSustainable Development and Innovation Management
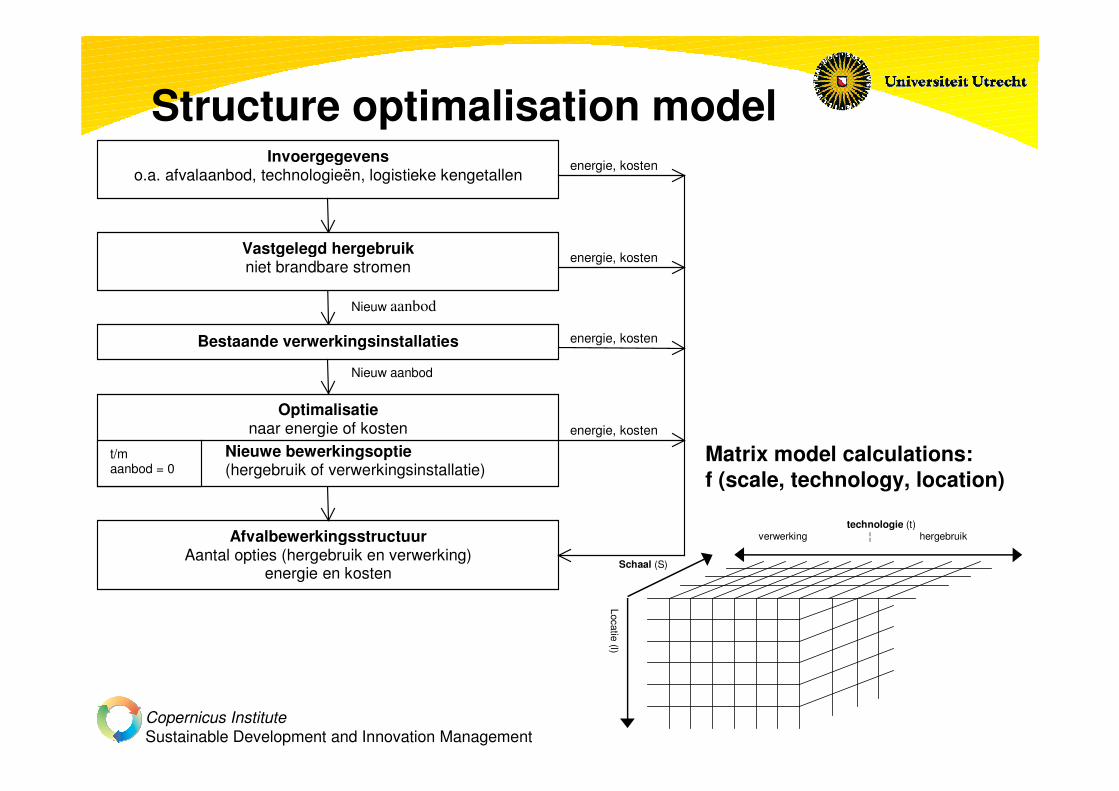
Structure optimalisation modelInvoergegevens
o.a. afvalaanbod, technologieën, logistieke kengetallen
Vastgelegd hergebruikniet brandbare stromen
Nieuw aanbod
Bestaande verwerkingsinstallaties
Nieuw aanbod
AfvalbewerkingsstructuurAantal opties (hergebruik en verwerking)
energie en kosten
Optimalisatienaar energie of kosten
Nieuwe bewerkingsoptie(hergebruik of verwerkingsinstallatie)
t/maanbod = 0
energie, kosten
energie, kosten
energie, kosten
energie, kosten
technologie (t)verwerking ¦ hergebruik
Schaal (S)
Locatie (l)
Matrix model calculations:f (scale, technology, location)
Copernicus InstituteSustainable Development and Innovation Management
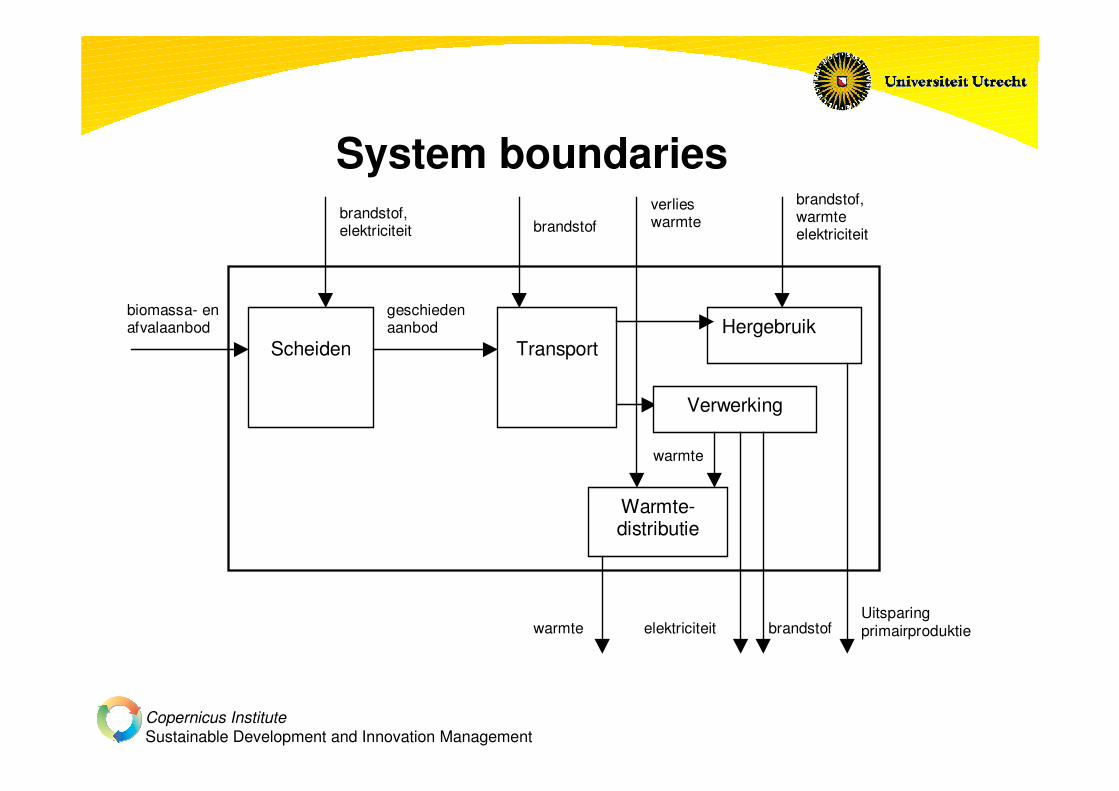
System boundaries
biomassa- enafvalaanbod
Scheiden
brandstof,elektriciteit
geschiedenaanbod
Transport
brandstof
Verwerking
brandstof,warmteelektriciteit
verlieswarmte
Hergebruik
Warmte-distributie
warmte elektriciteit
warmte
brandstofUitsparingprimairproduktie
Copernicus InstituteSustainable Development and Innovation Management
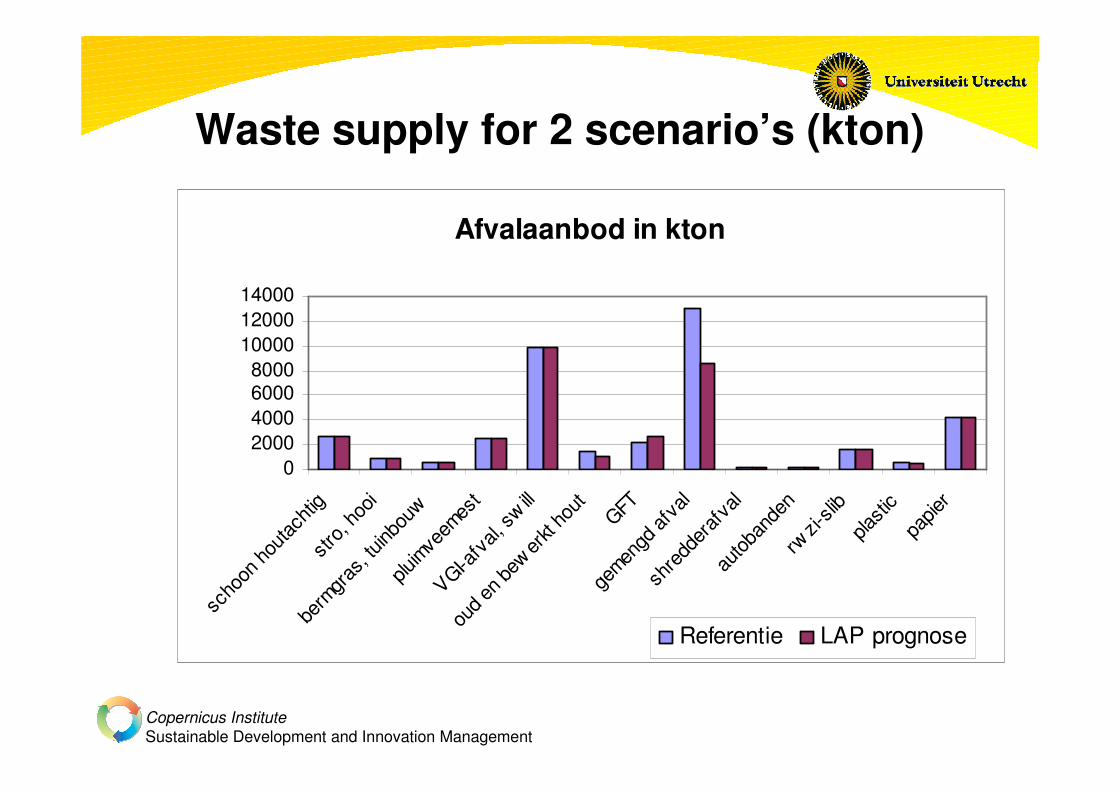
Waste supply for 2 scenario’s (kton)
Afvalaanbod in kton
02000400060008000
100001200014000
scho
on ho
utach
tigstr
o, ho
oi
berm
gras
, tuinb
ouw
pluim
veem
est
VGI-afv
al, sw
ill
oud e
n bew
erkt
hout
GFTge
mengd
afva
l
shre
dder
afva
lau
toban
den
rwzi-
slib
plasti
cpa
pier
Referentie LAP prognose
Copernicus InstituteSustainable Development and Innovation Management
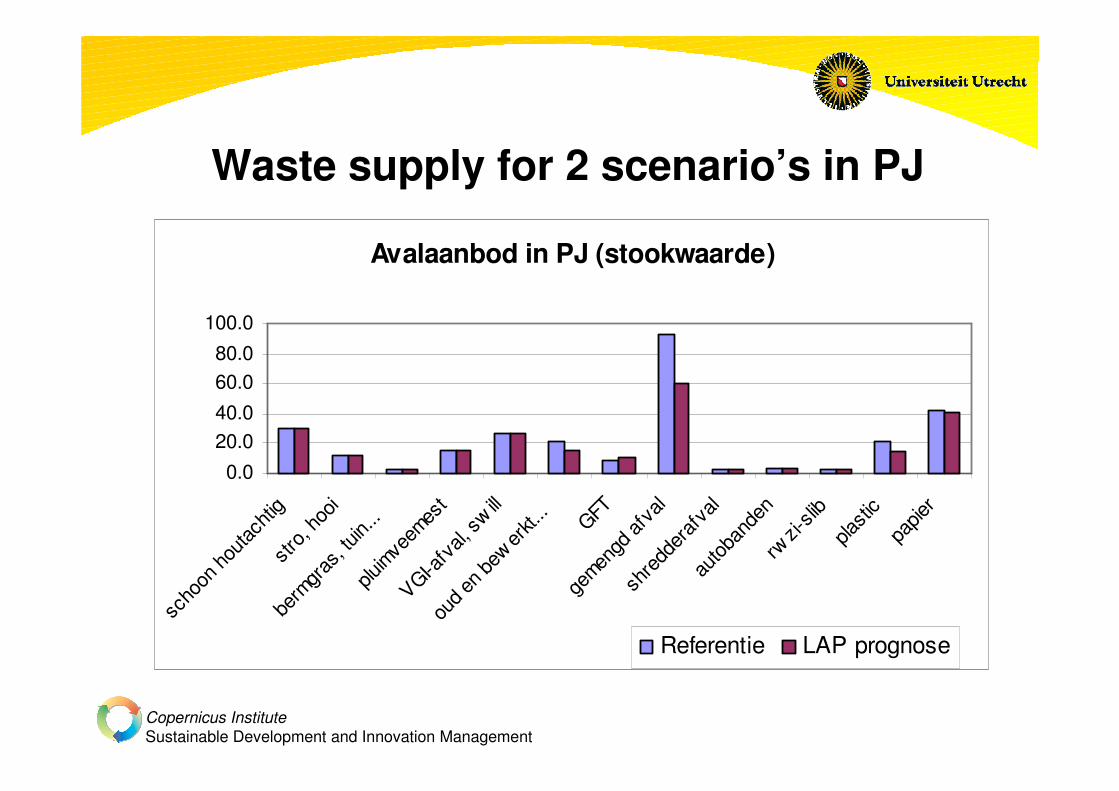
Waste supply for 2 scenario’s in PJ
Avalaanbod in PJ (stookwaarde)
0.020.040.060.080.0
100.0
scho
on ho
utach
tigstr
o, ho
oi
berm
gras
, tuin.
..plu
imve
emes
t
VGI-afv
al, sw
ill
oud e
n bew
erkt.
.. GFTge
mengd
afva
lsh
redd
eraf
val
autob
ande
nrw
zi-sli
bpla
stic
papie
r
Referentie LAP prognose
Copernicus InstituteSustainable Development and Innovation Management
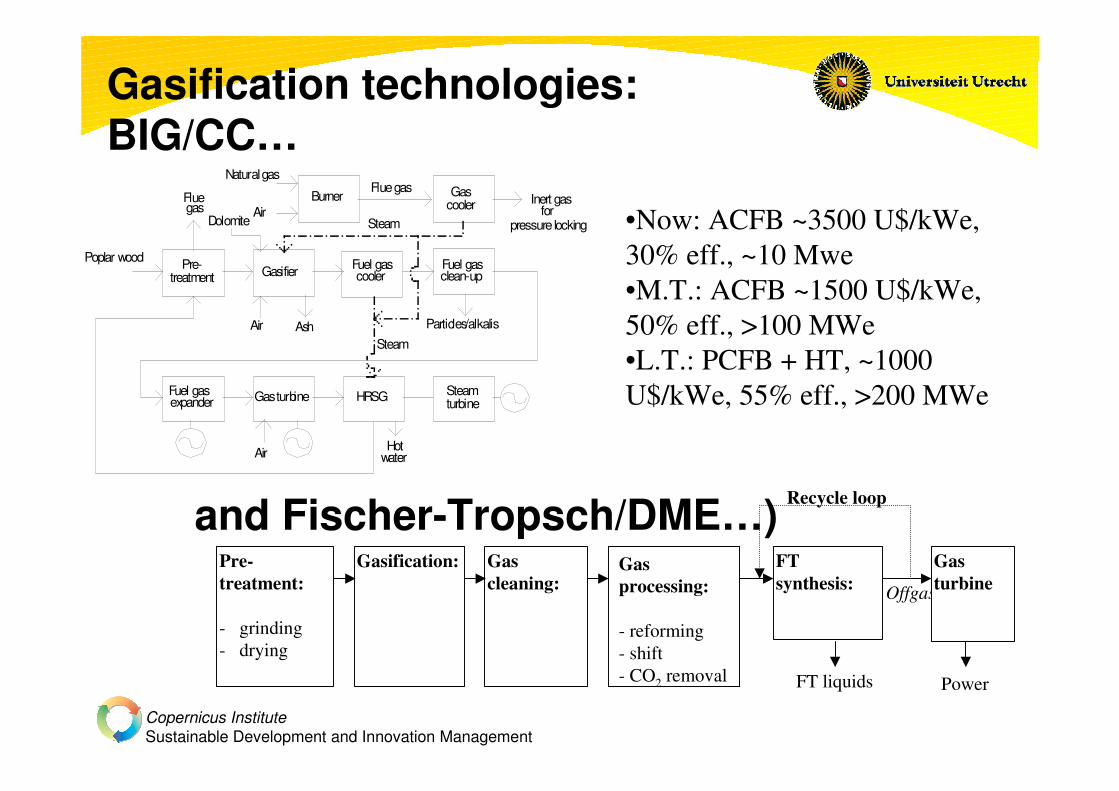
Gasification technologies:BIG/CC…
Pre-treatment Gasifier Fuel gas
clean-up
Fuel gasexpander Gas turbine HRSG
Air
Steamturbine
Ash Particles/alkalis
Fluegas
Fuel gascooler
Steam
Poplar wood
Natural gas
AirBurner
Flue gasInert gasGas
coolerSteam
Air
forpressure lockingDolomite
Hotwater
•Now: ACFB ~3500 U$/kWe,30% eff., ~10 Mwe•M.T.: ACFB ~1500 U$/kWe,50% eff., >100 MWe•L.T.: PCFB + HT, ~1000U$/kWe, 55% eff., >200 MWe
Power
Pre-treatment:
- grinding- drying
Gasification: Gascleaning:
FT liquids
Offgas
Recycle loop
FTsynthesis:
Gasturbine
Gasprocessing:
- reforming- shift- CO2 removal
and Fischer-Tropsch/DME…)

Copernicus InstituteSustainable Development and Innovation Management
Performance technologies vs.capacity (costs)
Technologievergelijk - kosten
-5
0
5
10
15
20
25
30
0 200 400 600 800 1000
Schaal MWth-input
Euro
/GJ u
itg
. p
rim
air
Vergas s ing/m o to r
B IG/C C
IG/C C
Verg.-a a rdga s S TEG
AVI-ro o s te r
AVI-we rve lbe d
P yro lys e /bijs to o k-ko le n
HTU/bijs to o k-ko len
Vergis ting
B ijs to o k-ko le n indire c t
B ijs to o k-ko le n ve rg.
B io m as s a ve rbra nde n-WKK
He rge bruik-ine rt
Auto ba nde n
Vee vo e de r
M e s ts to f
Die rvo e de r
P la s tie k, m a te ria a l
F is che r-Tro ps ch
M e tha no l
P a pie rindus trie
P la s tie k, B TF
Copernicus InstituteSustainable Development and Innovation Management
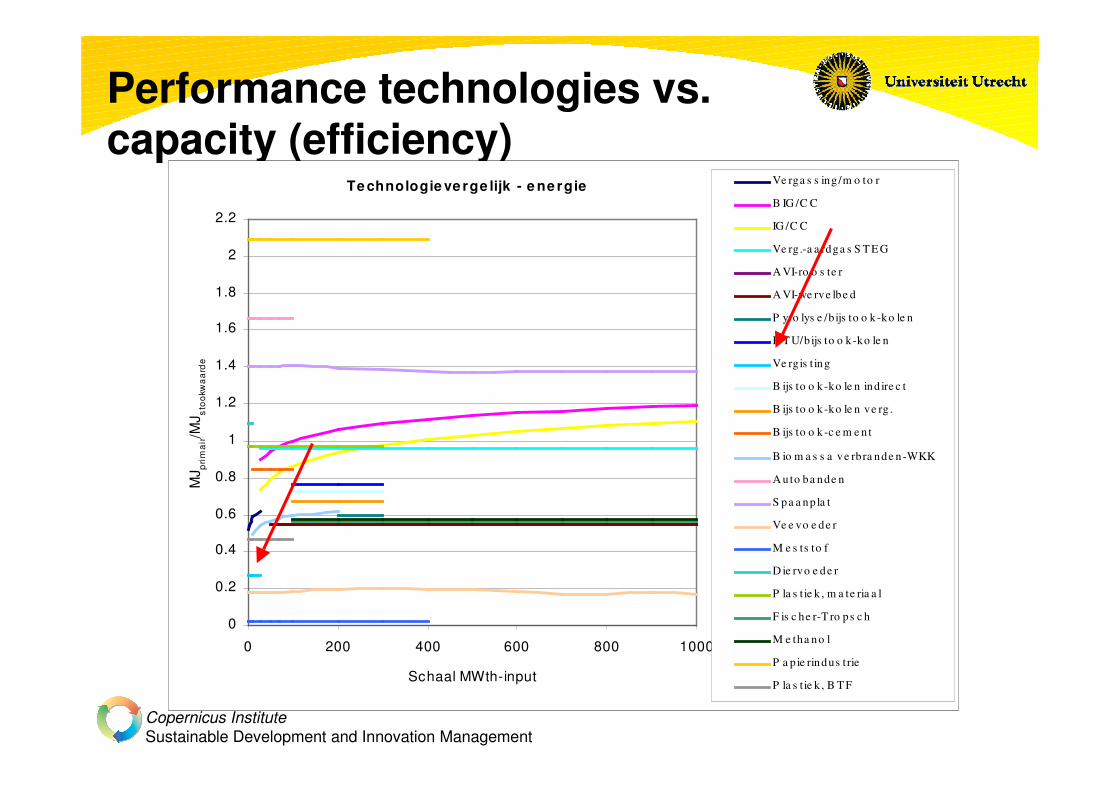
Performance technologies vs.capacity (efficiency)
Te chnologie ve rge lijk - e ne rgie
0
0.2
0.4
0.6
0.8
1
1.2
1.4
1.6
1.8
2
2.2
0 200 400 600 800 1000
Schaal MWth-input
MJ p
rim
air/M
J sto
okw
aa
rde
Ve rga s s ing /m o to r
B IG /C C
IG /C C
Ve rg.-a a rdga s S T E G
A VI-ro o s te r
A VI-we rve lbe d
P yro lys e /bijs to o k-ko le n
H T U/b ijs to o k-ko le n
Ve rgis t ing
B ijs to o k-ko le n ind ire c t
B ijs to o k-ko le n ve rg .
B ijs to o k-c e m e nt
B io m a s s a ve rbra nde n-WKK
A uto ba nde n
S pa a np la t
Ve e vo e de r
M e s ts to f
D ie rvo e de r
P la s tie k , m a te ria a l
F is c he r-T ro ps c h
M e tha no l
P a p ie rindus trie
P la s t ie k , B T F
Copernicus InstituteSustainable Development and Innovation Management
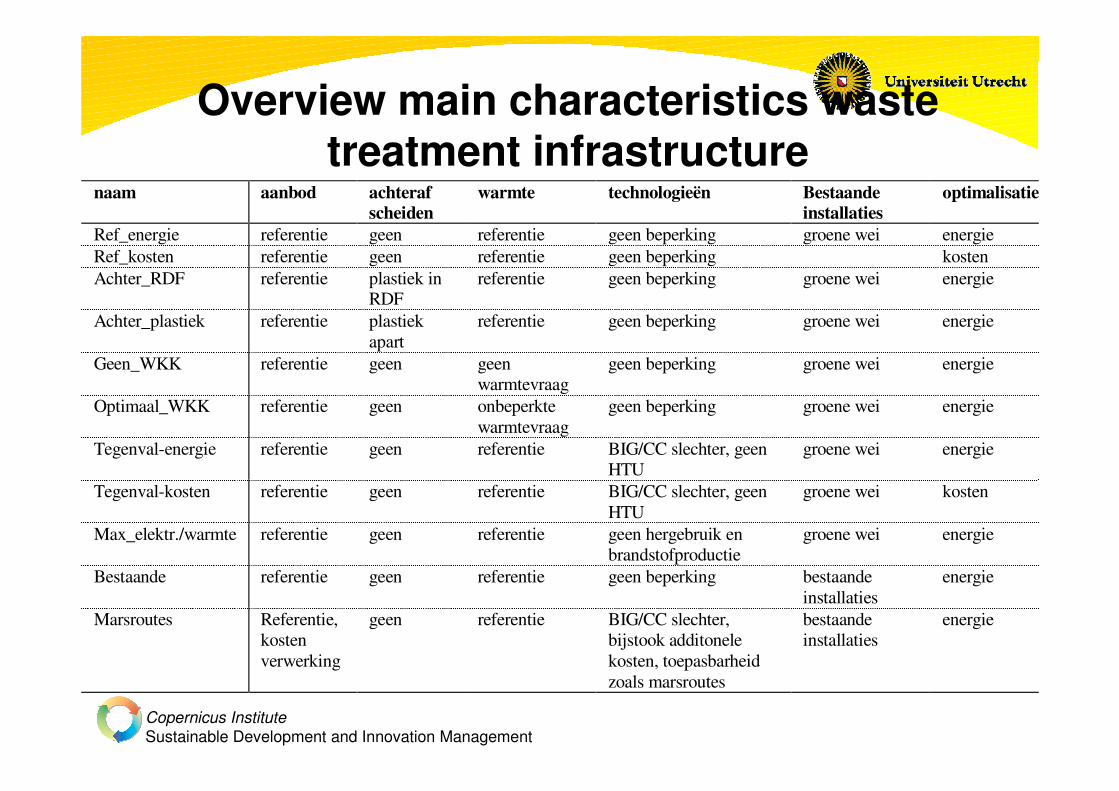
Overview main characteristics wastetreatment infrastructure
naam aanbod achterafscheiden
warmte technologieën Bestaandeinstallaties
optimalisatie
Ref_energie referentie geen referentie geen beperking groene wei energieRef_kosten referentie geen referentie geen beperking kostenAchter_RDF referentie plastiek in
RDFreferentie geen beperking groene wei energie
Achter_plastiek referentie plastiekapart
referentie geen beperking groene wei energie
Geen_WKK referentie geen geenwarmtevraag
geen beperking groene wei energie
Optimaal_WKK referentie geen onbeperktewarmtevraag
geen beperking groene wei energie
Tegenval-energie referentie geen referentie BIG/CC slechter, geenHTU
groene wei energie
Tegenval-kosten referentie geen referentie BIG/CC slechter, geenHTU
groene wei kosten
Max_elektr./warmte referentie geen referentie geen hergebruik enbrandstofproductie
groene wei energie
Bestaande referentie geen referentie geen beperking bestaandeinstallaties
energie
Marsroutes Referentie,kostenverwerking
geen referentie BIG/CC slechter,bijstook additonelekosten, toepasbarheidzoals marsroutes
bestaandeinstallaties
energie
Copernicus InstituteSustainable Development and Innovation Management
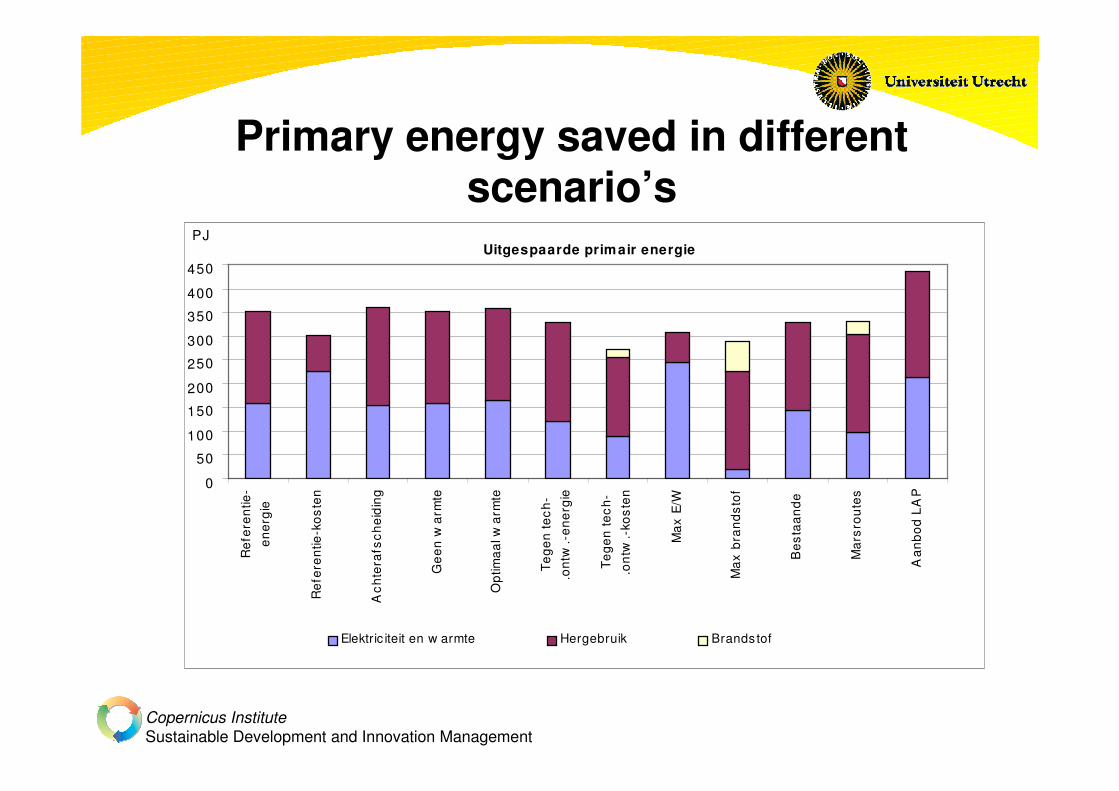
Primary energy saved in differentscenario’s
Uitgespaarde primair energie
0
50
100
150
200
250
300
350
400
450
Ref
eren
tie-
ener
gie
Ref
ere
ntie
-kos
ten
Ach
tera
fsch
eid
ing
Ge
en w
arm
te
Opt
imaa
l war
mte
Tege
n te
ch-
.ont
w.-
ene
rgie
Tege
n te
ch-
.on
tw.-
kos
ten
Max
E/W
Max
bra
ndst
of
Bes
taan
de
Mar
srou
tes
Aan
bod
LA
P
PJ
Elektric iteit en w armte Hergebruik Brandstof
Copernicus InstituteSustainable Development and Innovation Management
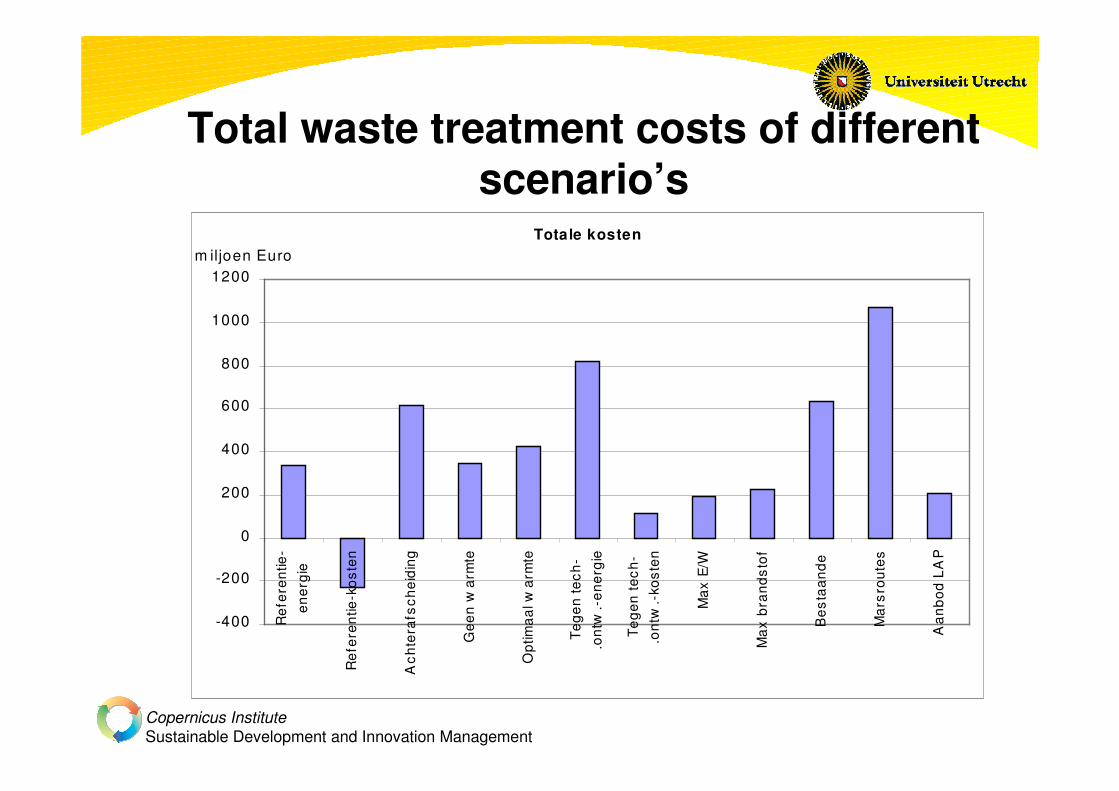
Total waste treatment costs of differentscenario’s
Totale kosten
-400
-200
0
200
400
600
800
1000
1200R
efer
entie
-en
ergi
e
Ref
eren
tie-k
oste
n
Ach
tera
fsch
eidi
ng
Gee
n w
arm
te
Opt
imaa
l war
mte
Tege
n te
ch-
.ont
w.-
ener
gie
Tege
n te
ch-
.ont
w.-
kost
en
Max
E/W
Max
bra
ndst
of
Bes
taan
de
Mar
srou
tes
Aan
bod
LAP
m iljoen Euro
Copernicus InstituteSustainable Development and Innovation Management
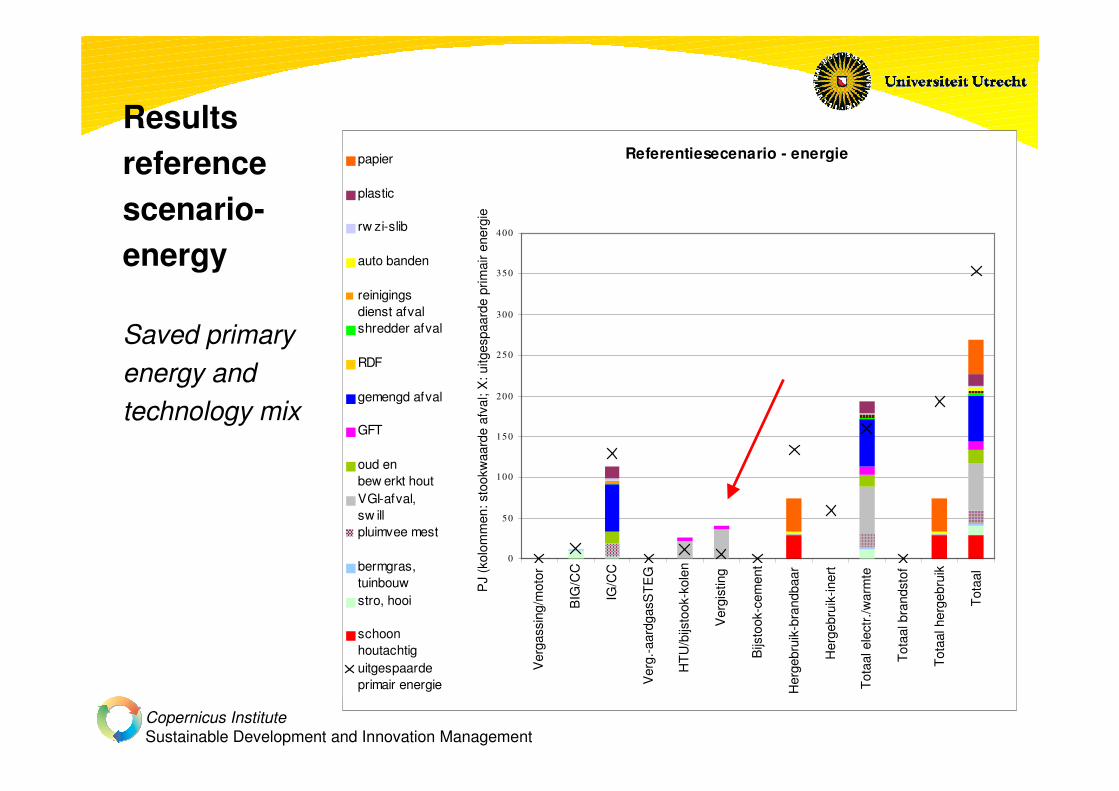
Resultsreferencescenario-energy
Saved primaryenergy andtechnology mix
Referentiesecenario - energie
0
50
100
150
200
250
300
350
400
Ver
gass
ing/
mot
or
BIG
/CC
IG/C
C
Ver
g.-a
ardg
asS
TEG
HTU
/bijs
took
-kol
en
Ver
gist
ing
Bijs
took
-cem
ent
Her
gebr
uik-
bran
dbaa
r
Her
gebr
uik-
iner
t
Tota
al e
lect
r./w
arm
te
Tota
al b
rand
stof
Tota
al h
erge
brui
k
Tota
al
PJ
(kol
omm
en: s
took
waa
rde
afva
l; X
: uitg
espa
arde
prim
air e
nerg
ie)
papier
plastic
rw zi-slib
auto banden
reinigingsdienst afvalshredder afval
RDF
gemengd afval
GFT
oud enbew erkt houtVGI-afval,sw illpluimvee mest
bermgras,tuinbouwstro, hooi
schoonhoutachtiguitgespaardeprimair energie

Copernicus InstituteSustainable Development and Innovation Management
Referentiescenario - kosten
0
50
100
150
200
250
300
350
400
Bijs
took
-cem
ent
BIG
/CC
IG/C
C
Bio
mas
sa v
erbr
.-WK
K
HTU
/bijs
took
-kol
en
Ver
gist
ing
Bijs
took
-cem
ent
Her
gebr
uik-
bran
dbaa
r
Her
gebr
uik-
iner
t
Tota
al e
lect
r./w
arm
te
Tota
al b
rand
stof
Tota
al h
erge
brui
k
Tota
al
papier
plastic
rw zi-slib
autobanden
reinigingsdienstafval
shredderafval
RDF
gemengd afval
GFT
oud en bew erkt hout
VGI-afval, sw ill
pluimveemest
bermgras, tuinbouw
stro, hooi
schoon houtachtig
uitgespaarde primairenergie
Resultsreferencescenario-costs
Costs andtechnology mix
Copernicus InstituteSustainable Development and Innovation Management
Some findings• Depending on boundary conditions, large shifts
between electricity and heat, savings by recycling andtransport fuels (high sensitivities).
• Key advanced technologies: 1: (B)IG/CC, 2: co-firingand gasification with NGCC, 3: Separate collection &Waste separation, 4: HTU for wet streams (possiblystrong alternative for digestion).
• Large scale facilities generally more attractive.• Increasing heat utilisation has significant potential but
strongly competes with NG and possibly efficiencymeasures.
Copernicus InstituteSustainable Development and Innovation Management
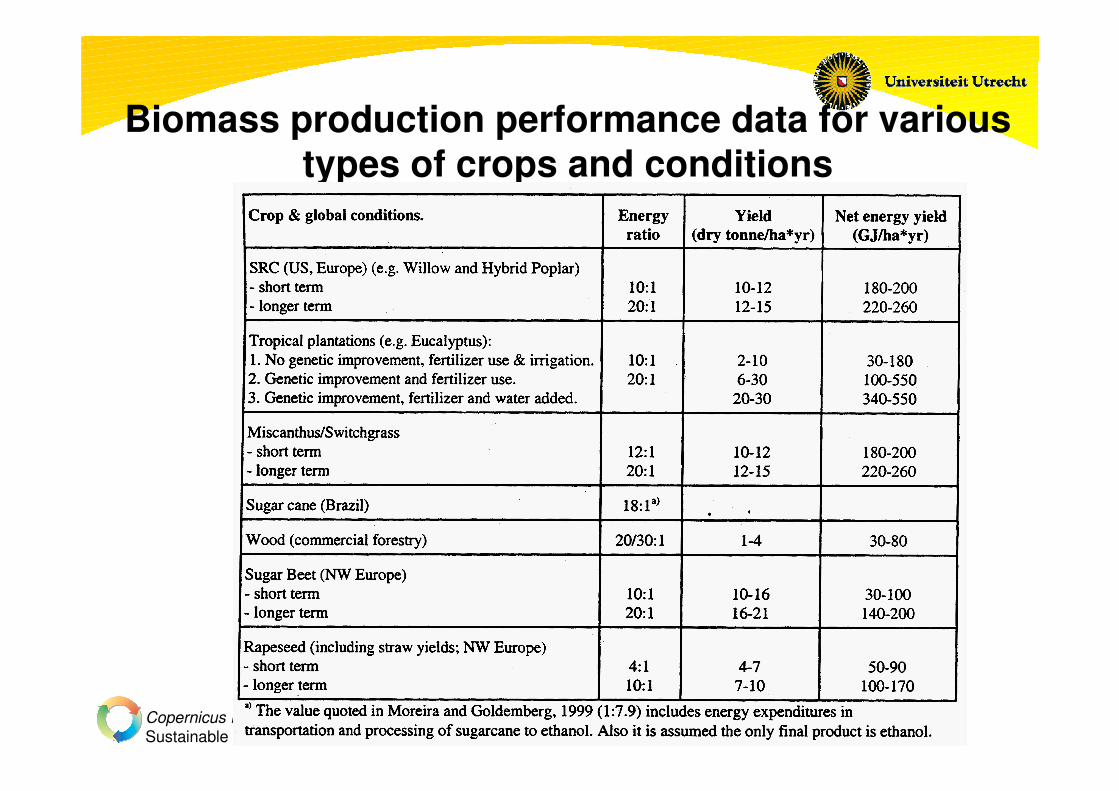
Biomass production performance data for varioustypes of crops and conditions
Copernicus InstituteSustainable Development and Innovation Management
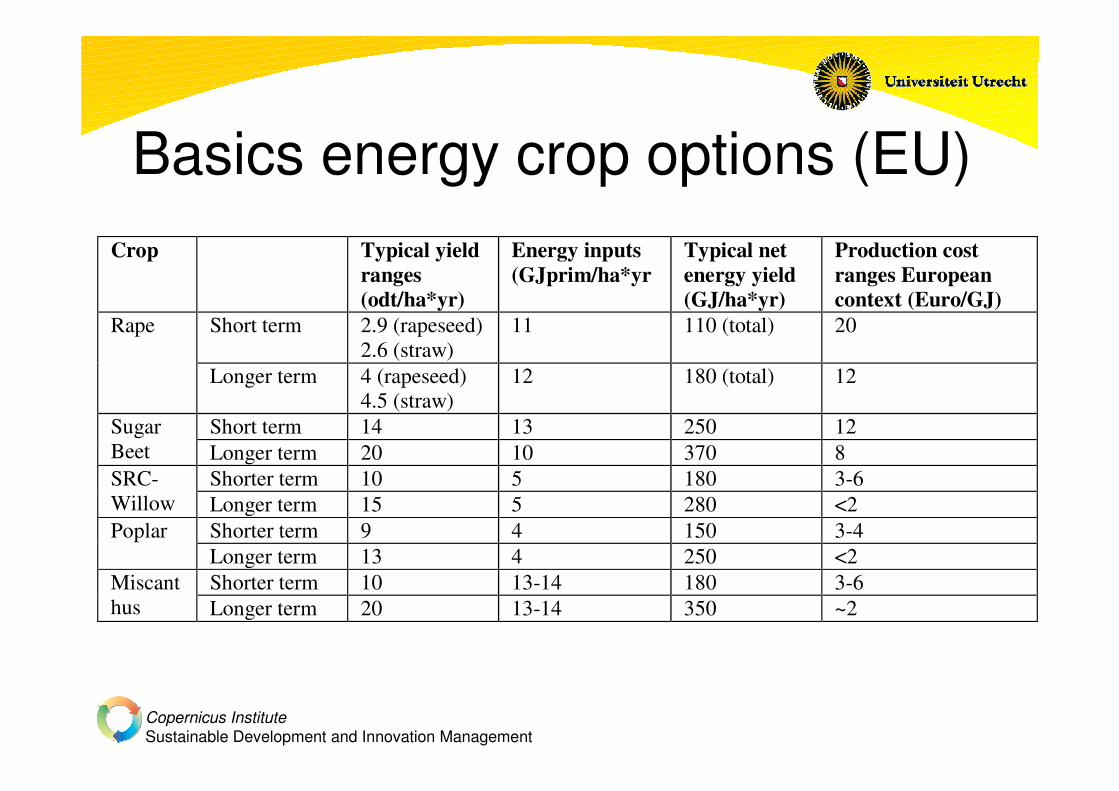
Basics energy crop options (EU)Crop Typical yield
ranges (odt/ha*yr)
Energy inputs (GJprim/ha*yr
Typical net energy yield (GJ/ha*yr)
Production cost ranges European context (Euro/GJ)
Short term 2.9 (rapeseed) 2.6 (straw)
11 110 (total) 20 Rape
Longer term 4 (rapeseed) 4.5 (straw)
12 180 (total) 12
Short term 14 13 250 12 Sugar Beet Longer term 20 10 370 8
Shorter term 10 5 180 3-6 SRC-Willow Longer term 15 5 280 <2
Shorter term 9 4 150 3-4 Poplar Longer term 13 4 250 <2 Shorter term 10 13-14 180 3-6 Miscant
hus Longer term 20 13-14 350 ~2
Copernicus InstituteSustainable Development and Innovation Management
Final remarks• Digestion is a sound and available conversion
technology for wet(ter) biomass streams(including manure) .
• Thermal conversion options strongcompetitors for drier and lignocellulosicbiomass.
• Perennial crops (lignocell…) generally havebetter energy & GHG & environmentalbalances (and economics!) than annualcrops.
• Role of digestion…?