energy consumption and carbon footprint of...
TRANSCRIPT
Energy Consumption and Carbon Footprint of
Secondary Aluminum Cast House
Master Thesis
Wenjing Wei
Department of Materials Science and Engineering
Division of Energy and Furnace Technology
Royal Institute of Technology
SE-100 44 Stockholm, Sweden
ii
Abstract
Primary aluminum production brings about severe environmental burden due to its energy
intensive process. Secondary aluminum production contributes to cutting off high energy
demand around 90-95% and greenhouse gas emission by remelting scraps. However, previous
research indicates melting furnace’s energy efficiency in secondary plant is still very low,
which is around 26-29% and more than 70% heat is lost in different way. The objective of this
project is to investigate energy consumption and greenhouse gas (GHG) emission in
secondary aluminum cast house through process analysis. The result offers a comprehensive
overview to aid decision-maker to compare energy consumption and environmental impacts
caused by different product or process.
This project has been done in collaboration with SAPA Heat Transfer. This project consists of
two tasks. First task is aimed to give an overview of annual energy distribution and carbon
footprint of per ton aluminum slab in SAPA cast house. In order to analyze energy
distribution, mass and energy conservation has been applied for calculation. Meanwhile,
International standard method, life cycle assessment, has been used to evaluate greenhouse
gas contribution of the whole production process. The second task intends to investigate two
effects (melting furnace type, raw material type) on products’ energy consumption and carbon
footprint. Melting furnace’s effect is compared by selecting electric induction furnace and
oxy-fuel furnace. On the other hand, raw material’s effect is studied by comparison of four
different cast house products which have different raw material recipe.
Calculation and analysis results indicates that per ton Sapa cast house aluminum slab
consumes energy 3826MJ and contributes to 306kgCO2eq. green house gas. Meanwhile,
comparison results show that oxy-fuel melting furnace has higher energy efficiency than
electric induction furnace, however, it contributes much more GHG due to consumption of
propane fuel. In addition, primary ingot has been concluded as distinct carbon footprint
contribution than others contributors (i.e. fuel) for Sapa cast house’s slab.
Key words: secondary aluminum cast house, energy consumption, carbon footprint,
melting furnace, efficiency

iii
Acknowledgement
I am grateful to my supervisor Docent Weihong Yang (KTH) for the gracious supervision and
inspiring guidance. I am also thankful to my supervisors Anders Johansson (Sapa) and Robbin
Kanterp (Sapa), who have supported me throughout the thesis work with their patience and
knowledge. I would also like to show my great thanks to other Sapa staff members, Ye Yan,
Niclas Allard, Lennart Daun, Jonas Viitanen, Håkan Ottoson, Kent Pettersson and all the
operators, who helped me with on-site data collection as well as assisted me to get familiar
with production process.
I would like to thank Sapa Heat Transfer for providing the opportunity and financial support
for this interesting topic.
I would like to thank my parents’ support and my friend Nabeel Muhammad for his peer-
review of thesis writing.

iv
Contents
Abstract .................................................................................................................................................... ii
Acknowledgement ................................................................................................................................... iii
1. Introduction ..................................................................................................................................... 1
1.1 Objectives .................................................................................................................................. 1
2. Background ...................................................................................................................................... 3
2.1 Primary aluminum production .................................................................................................. 3
2.1.1 Bauxite mining .................................................................................................................. 3
2.1.2 Alumina refining (Bayer Process) ..................................................................................... 3
2.1.3 Smelting (Electrolysis) ...................................................................................................... 3
2.1.4 Casting .............................................................................................................................. 4
2.2 Secondary aluminum production .............................................................................................. 4
2.2.1 Charging ............................................................................................................................ 4
2.2.2 Melting ............................................................................................................................. 4
2.2.3 Refining ............................................................................................................................. 4
2.2.4 Holding ............................................................................................................................. 6
3. Literature Review ............................................................................................................................. 7
3.1 Energy consumption .................................................................................................................. 7
3.2 Carbon footprint ........................................................................................................................ 7
3.2.1 Carbon footprint ............................................................................................................... 7
3.2.2 Life cycle assessment........................................................................................................ 7
4. Methodology ................................................................................................................................. 10
4.1 Process map and boundaries .................................................................................................. 10
4.2 Function units and on-site data ............................................................................................... 12
4.2.1 Pre-heat furnace ............................................................................................................. 12
4.2.2 Melting furnace .............................................................................................................. 13
4.2.3 Holding furnace .............................................................................................................. 16
v
4.2.4 Casting ............................................................................................................................ 17
4.2.5 Sawing ............................................................................................................................ 17
4.2.6 Homogenizing ................................................................................................................. 17
4.2.7Data Collection ................................................................................................................ 18
4.3 Mass and energy conservation ................................................................................................ 21
4.3.1 Input energy ................................................................................................................... 21
4.3.2 Output energy ................................................................................................................ 22
4.3.3Computational thermodynamic calculations .................................................................. 27
4.4Carbon footprint analysis ......................................................................................................... 28
4.4.1 Goal and boundaries definition ...................................................................................... 28
4.4.2 Data collection ................................................................................................................ 29
4.4.3 Carbon footprint calculation .......................................................................................... 31
5. Results and Discussion ................................................................................................................... 33
5.1 Energy flow and carbon footprint in the whole casting house ............................................... 33
5.2 Effects on melting product’s energy consumption and carbon footprint ............................... 36
5.2.1 Effect of melting furnace type on energy consumption and carbon footprint .............. 37
5.2.2 Effect of raw material on energy consumption and carbonfootprint ............................ 39
5.3 Potential improvement ........................................................................................................... 41
6. Conclusion ...................................................................................................................................... 44
7. Reference ....................................................................................................................................... 45
1
1. Introduction
Aluminum represents the second largest metals in the world and it has played an important
role in the development of human society civilization. As a critical industrial metal, typical
properties of aluminum such as lightweight, high resistance, high reflectivity, high elasticity,
capability of conducting heat and electricity, result in rapid growth of aluminum consumption
in industrial fields. Based on production plans, future worldwide aluminum production
capacity has been estimated to reach 120 MT in 2025 compared with a 45.3 MT capacity in
year of 2006, with an annual growth rate 4.1% and a total increase of 160%.[1]
Estimation of Bureau of International Recycling (BIR)[2]
shows that producing 1 kilogram Al
in primary production requires150MJ hydroelectricity with 89% efficiency..Alternatives for
hydroelectricity, black coal or natural gas, has relatively low efficiency. Black coal consumes
211MJ/kg with efficiency 35% and natural gas requires 150MJ/kg with efficiency 54%. The
energy consumption of secondary production has calculated to be 6 and 10 MJ/kg with
efficiency of 60%-80%. Significant energy saving around 90-95% has been reported for
secondary aluminum compared to primary aluminum, which is showing great attraction today
and will be a potential production routine in the future. Among current global 60-million
aluminium supply, 50% is from secondary aluminium production and those recycling
aluminium scraps are mainly from automobile and construction industry. Right now EU
government has polices regarding recycling, which demands all vehicles must be 95%
recyclable by the year 2015.[3]
In addition to less energy cost, another reason for rapid
development of secondary aluminium market is that aluminium recycling can be repeated
with low loss of metal quality and quantity.
Same as the other materials industry, aluminum must also contend with factors and
constraints which will influence the cost of raw materials, energy and environmental control.
Aluminum production is energy intensive, especially in smelting process which relies on
electricity and fuel burning. Energy cost, energy use as well as energy availability,
consequently influence on competiveness and economics. The biggest challenge for
aluminum industry in the future is energy efficiency and nowadays aluminum manufactures
are taking every possible opportunity to get maximum energy efficiency through production
process. T.X. Li [4]
has investigated secondary aluminium melting furnace and shows that gas-
fired melting furnaces have effective energy around 26%-29%, which means more than70%
heat is lost during production. Energy effectiveness is not only influencing industry benefit
but also has a positive effect on environmental impact. In March 2011, European Commission
has set targets on different key sector, such as industry, transport, power generation to
promote a low-carbon economy over the coming decades. Highly energy demand of
aluminum is therefore significant producer of air pollution such as CO2, NOx. From the view
of green and sustainable products, waste product especially greenhouse gases must be taken
into consideration due to public’s concern of environment.
1.1 Objectives
This project is conducted at Department of MSE, KTH in cooperation with SAPA Heat
Transfer (SHT) in Finspång, Sweden. SHT owns a secondary cast house producing 80000MT
aluminum rolling slabs from ingots and aluminum scraps.

2
This project aims at reducing energy consumption and carbon dioxide emission in secondary
aluminum cast house, exploring possibilities of self-improvement with respect to saving
energy and producing green aluminum products.
The project is divided into two basic tasks according to company’s requirements:
Overview of cast house annual energy and metal flow in 2011: To estimate energy
consumption and carbon footprint per ton slab in cast house.
To investigate possible effects (different melting furnace, different raw material group)
on product’s energy consumption and carbon footprint.
To achieve these objectives, on-site data and experiments have been collected and conducted.
3
2. Background
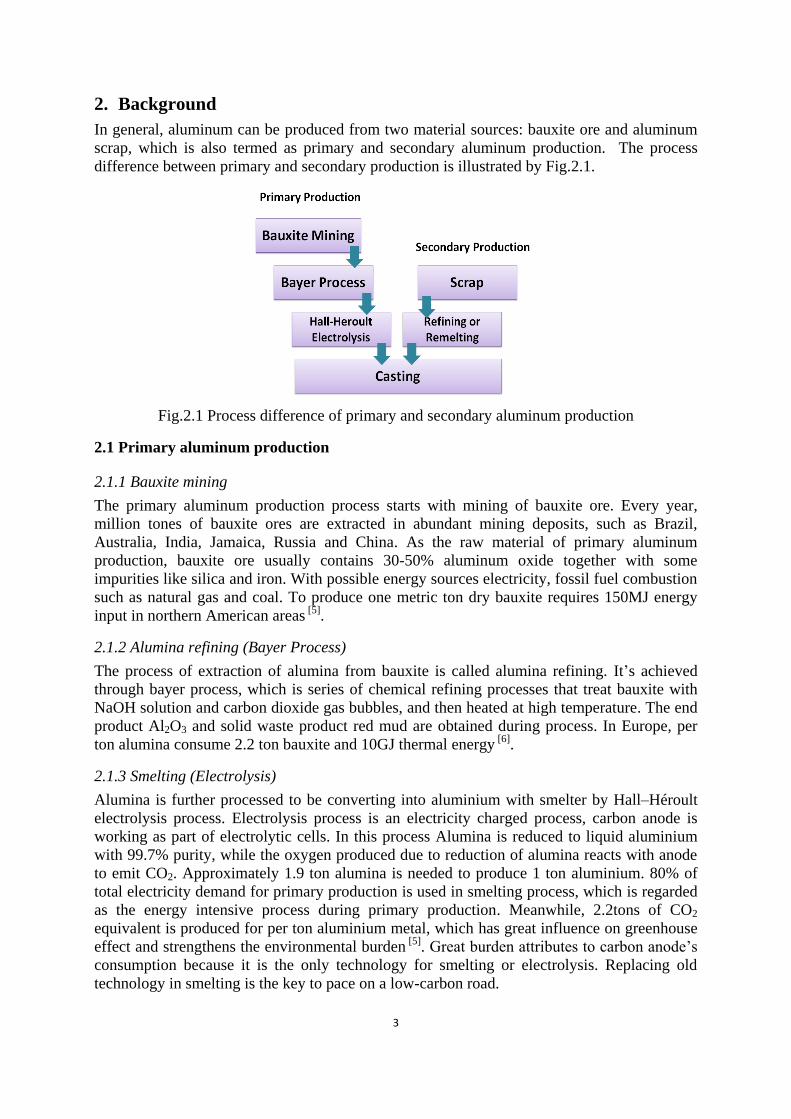
In general, aluminum can be produced from two material sources: bauxite ore and aluminum
scrap, which is also termed as primary and secondary aluminum production. The process
difference between primary and secondary production is illustrated by Fig.2.1.
Fig.2.1 Process difference of primary and secondary aluminum production
2.1 Primary aluminum production
2.1.1 Bauxite mining
The primary aluminum production process starts with mining of bauxite ore. Every year,
million tones of bauxite ores are extracted in abundant mining deposits, such as Brazil,
Australia, India, Jamaica, Russia and China. As the raw material of primary aluminum
production, bauxite ore usually contains 30-50% aluminum oxide together with some
impurities like silica and iron. With possible energy sources electricity, fossil fuel combustion
such as natural gas and coal. To produce one metric ton dry bauxite requires 150MJ energy
input in northern American areas [5]
.
2.1.2 Alumina refining (Bayer Process)
The process of extraction of alumina from bauxite is called alumina refining. It’s achieved
through bayer process, which is series of chemical refining processes that treat bauxite with
NaOH solution and carbon dioxide gas bubbles, and then heated at high temperature. The end
product Al2O3 and solid waste product red mud are obtained during process. In Europe, per
ton alumina consume 2.2 ton bauxite and 10GJ thermal energy [6]
.
2.1.3 Smelting (Electrolysis)
Alumina is further processed to be converting into aluminium with smelter by Hall–Héroult
electrolysis process. Electrolysis process is an electricity charged process, carbon anode is
working as part of electrolytic cells. In this process Alumina is reduced to liquid aluminium
with 99.7% purity, while the oxygen produced due to reduction of alumina reacts with anode
to emit CO2. Approximately 1.9 ton alumina is needed to produce 1 ton aluminium. 80% of
total electricity demand for primary production is used in smelting process, which is regarded
as the energy intensive process during primary production. Meanwhile, 2.2tons of CO2
equivalent is produced for per ton aluminium metal, which has great influence on greenhouse
effect and strengthens the environmental burden [5]
. Great burden attributes to carbon anode’s
consumption because it is the only technology for smelting or electrolysis. Replacing old
technology in smelting is the key to pace on a low-carbon road.
4
2.1.4 Casting
Continued with smelting process, normally molten aluminium is then transported to holding
furnace in cast house. The molten aluminium is alloyed by charging alloy element, such as
manganese, titanium, silicon, zinc, as well as purified by using flux for which the main
composition is alkali chlorides and fluorides. Alloying is followed by pouring liquid
aluminium into moulds on a platform and is then cooled by water when the platform is
lowered into a casting pit. The final product from cast house is primary aluminium ingot.
2.2 Secondary aluminum production
In comparison to primary aluminium secondary production is charging the aluminium scrap
as raw material. Aluminum scrap as raw material can be divided into two types. One type is
new scrap, also named as internal scrap which is from aluminum fabrication, for example,
aluminum material in skimming, scalping chips, sawn edge and end trim. This scrap has
characteristics of low carbon footprint and properties closer to the product’s properties, and
usually is collected on-site and charged as raw material. The other type is old scrap, or
external scrap, which is discarded by consumer but recycled to process as end-of-life actions.
Sources of old scraps are regional varied, it includes used appliances, aluminum foils,
automobiles, electrical wires, vehicle components and beverage cans. Used scraps are sorted
by removing coating and impurity process, and then can be charged in re-melters.
The scrap materials are collected and charged in the melting furnace. Alloying and refining
process can also occur in melting furnace. When the solid material has been converted to
molten form it is tapped into holding furnace and casted into moulds. Basically, secondary
aluminium production involves in a series of steps:
Charging
Melting
Refining
Holding
2.2.1 Charging
Before charging solid material in furnace, pre-heating or drying the charging material is
usually practiced, because it is beneficial to remove moisture, preventing explosion in the
furnace and reducing melting energy requirement. Then pre-heated material is placed into
melt aluminium pool in melting furnace and the heat from surrounding molten aluminium is
transferring to solid material through conduction.
2.2.2 Melting
Melting furnace supplies its energy from combustion of fuels, electricity or other energy
source to raise aluminium temperature above its melting point.
2.2.3 Refining
Refining is the process of adjusting the alloy composition within desired limit. Processes such
as alloying, fluxing, grain treatment, degassing and filtration are carried out in the molten
metal to improve the final casting metal’s quality.
Alloying is the step that adding alloy element such as silicon, magnesium, copper, zinc and
manganese in the melt to improve its strength and ductility according to product’s application.
This step requires analysis of furnace charge before alloying. After adjustment of melt
composition due to addition of alloying agents the second charge analysis is carried out. The
5
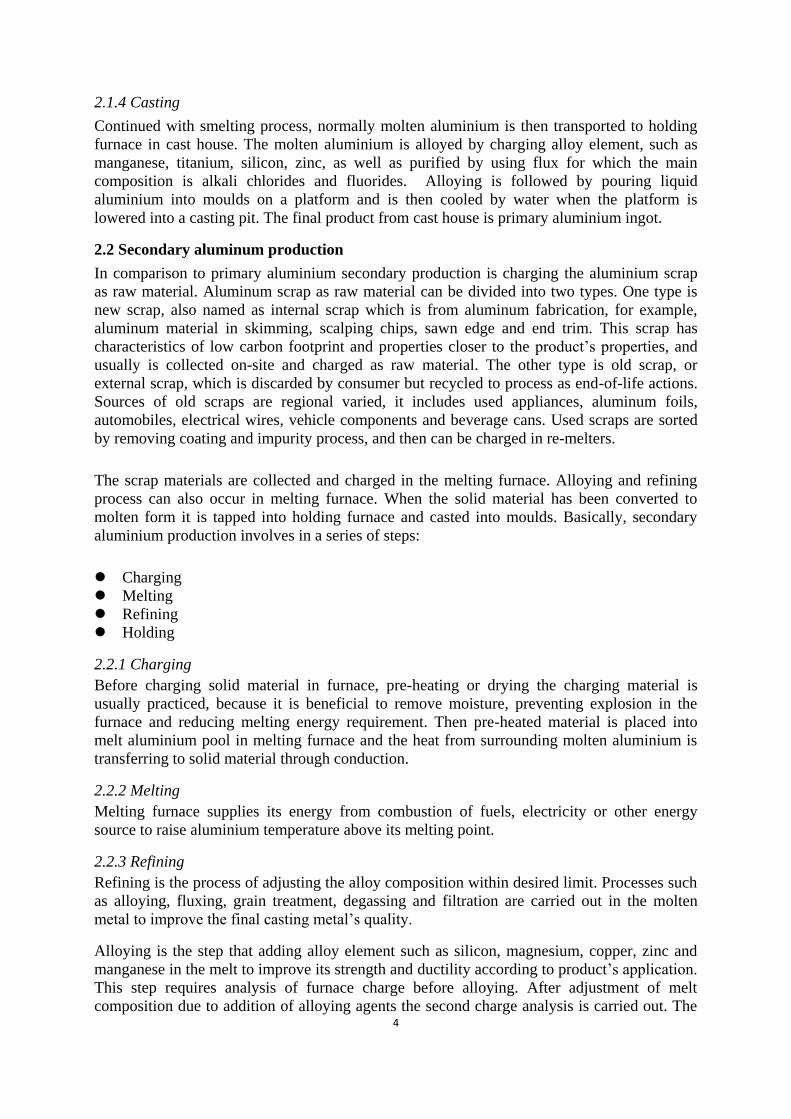
process continues until the melt achieves the correct alloy composition. Charge analysis is
completed by taking on-site sample. The widely used analysing equipment is optical emission
spectrometer (OES), which is applied to analyse material’s composition by spark emission.
Figure 2.2 shows a picture of on-site sample analysed by OES.
Fig.2.2 On-site sample composition analysed by OES
Fluxing is the step to trap impurities or contaminates and floats on the surface of aluminium
melt, which also works as an insulation barrier against oxidation formation and melt loss,
because aluminium is very active in molten state and can be easily oxidized by oxygen in the
air. Oxidation of melt can be reduced by quickly submerging scraps into melt while charging
but normally charging ingots and scrap requires stirring which also causes aluminium oxide to
suspend in the melt. Semi-solid flux, which is also called dross, is the mixture of flux, melt
aluminium and oxides. It should be removed from melt to ensure a good quality melt for
casting. It is normally done several times during melting cycle, the more the contamination
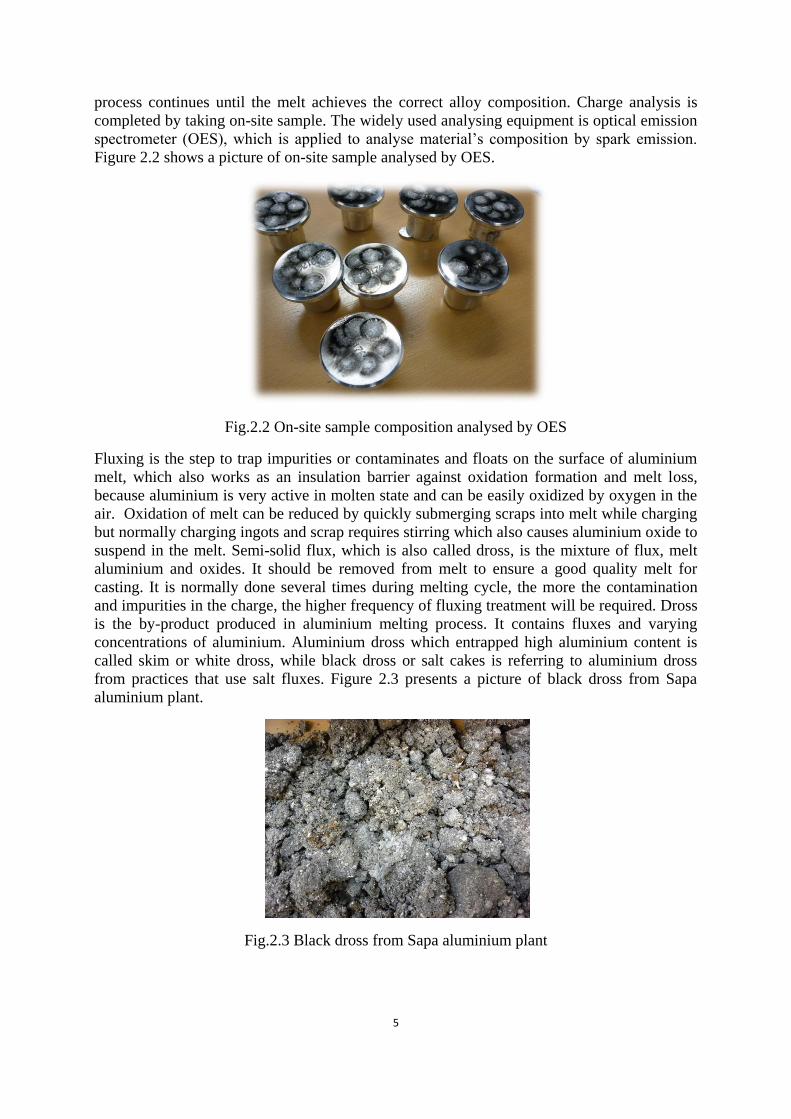
and impurities in the charge, the higher frequency of fluxing treatment will be required. Dross
is the by-product produced in aluminium melting process. It contains fluxes and varying
concentrations of aluminium. Aluminium dross which entrapped high aluminium content is
called skim or white dross, while black dross or salt cakes is referring to aluminium dross
from practices that use salt fluxes. Figure 2.3 presents a picture of black dross from Sapa
aluminium plant.
Fig.2.3 Black dross from Sapa aluminium plant

6
Grain refinement is in purpose with finer grain size to avoid ingot cracking during casting and
subsequent processes. Currently the most common grain refining method is adding grain
refiner material, such as, Al-Ti-B rod alloy.
Molten aluminium has high affinity with hydrogen, especially for fuel-fired furnace which
generates water vapour product. The precipitation of hydrogen from liquid aluminium can
cause slab’s porosity. Degassing is usually carried out by introducing inert gas into melt, for
example Argon gas. Current method for filtering oxides are placing ceramic filter before
casting mold to trap inclusions formed during transfer.
2.2.4 Holding
Molten aluminium is maintained in holding furnace until it is ready to tapping for casting.

7
3. Literature Review
3.1 Energy consumption
Facing to the world issue of fuel shortage, secondary aluminium production consumes only 5%
energy of primary production, which shows distinct advantages on both economical and
friendly environmental aspects. However, in a previous study T.X. Li[4]
has investigated
performance of secondary aluminium melting gas-fired furnace and the analysis result with
plant-site experiment shows that most measured melting furnaces have effective energy
efficiency around 26%-29%, which means more than70% heat is lost during production. The
analysis indicates that out of these heat losses the loss from flue gas is 35%-50%. In order to
lower both, energy consumption and emission, in secondary aluminium production all
possible energy saving potentials have to be monitored and analyzed through different plant
processes. In addition, energy assessment can also be conducted through evaluation of furnace
performance.
3.2 Carbon footprint
3.2.1 Carbon footprint
Carbon footprint can be used by individual or a company to access their contribution to
climate change, so that they can make more efforts and improvements on minimizing
emission across the whole life cycle. Nowadays more and more efforts are been taken to
reduce greenhouse gas emission, which is the main reason leading to greenhouse effect.
Carbon footprint is a term to describe the overall greenhouse gas (GHG) emission associated
with a product or a service through its entire life cycle. GHG includes CO2, CH4, N2O etc,
which can be emitted from combustion of fossil fuel, manufacturing, transportation and so on.
Global warming potential (GWP) is an indicator that express overall contribution to climate
change of different greenhouse gas emission over a fixed time horizon, for example 20,100 or
500 years. Carbon dioxide’s GWP is standardized to 1 and the other green house gas species’
GWP is expressed as a factor of CO2. For example, Table 3.1 is presenting a 100 year GWP.
The GWP100 for methane is 25, which means if same mass of CH4 and CO2 is emitted into
atmosphere, methane will trap 72 times more heat than CO2 over the next 100 years. To make
it simple for reporting, GHG is often expressed in terms as CO2 equivalent (CO2eq.)
Table 3.1 GWP100 for green house gas [7]
GHG SPECIES CHEMICAL FORMULAR GWP100
Carbon dioxide CO2 1
Methane CH4 25
Nitrous oxide N2O 298
Sulphur hexafluoride SF6 22800
3.2.2 Life cycle assessment
Carbon footprint is classified into one category of life cycle assessment (LCA). LCA is an
international standard “cradle-to-grave” approach to evaluate resource consumption and
environment impacts during product life cycle. LCA offers a comprehensive overview to aid
decision-makers to compare environmental impacts caused by products, processes or services.
8
This information can be used together with cost and performance data to achieve process
design and optimization in order to implement a sustainable development. LCA result may
vary with the researcher’s objectives, the data availability during research, and so on. It is not
the assistance to obtain the real impacts and give conclusion of the most cost effective or
works the best product or process but it’s helpful to provide potential impacts between cost
and performance while working with process assessing decision.
International Standard Organisation develops guidance on methodology and sets down rules
for transparency and reporting. The relevant standards are ISO 14040 and ISO 14044. ISO
14040 describes principle and framework of life cycle assessment, while ISO14044 is about
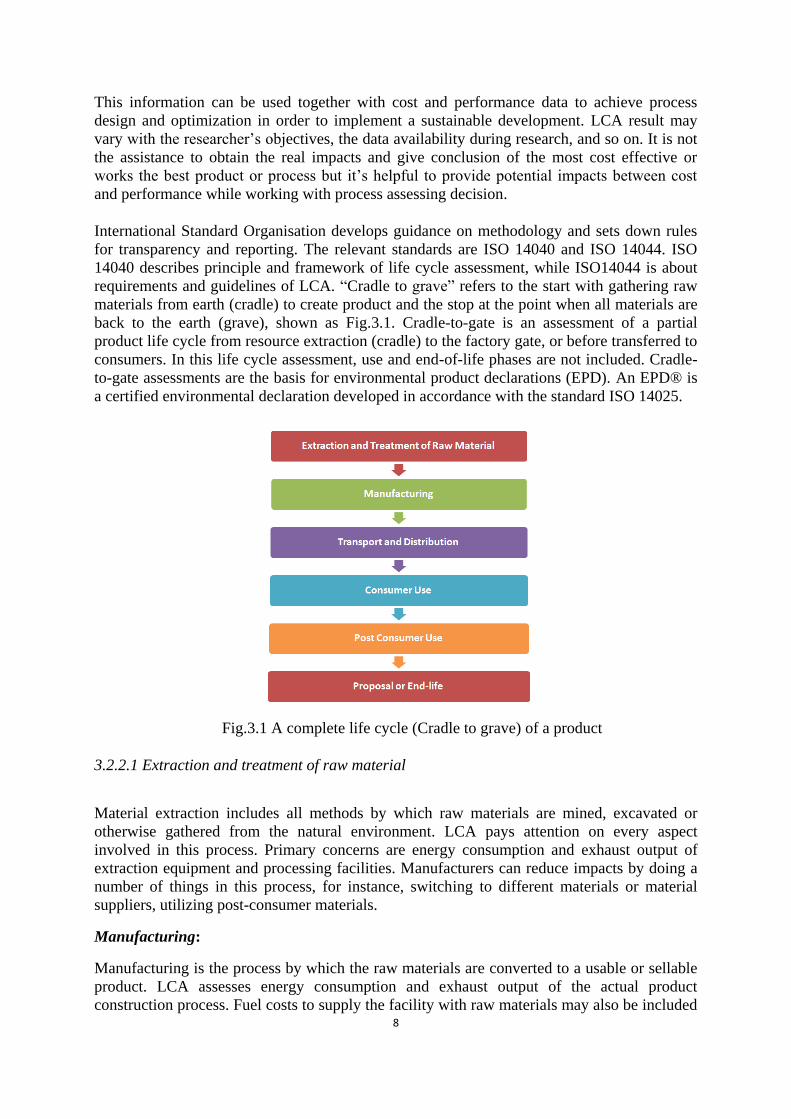
requirements and guidelines of LCA. “Cradle to grave” refers to the start with gathering raw
materials from earth (cradle) to create product and the stop at the point when all materials are
back to the earth (grave), shown as Fig.3.1. Cradle-to-gate is an assessment of a partial
product life cycle from resource extraction (cradle) to the factory gate, or before transferred to
consumers. In this life cycle assessment, use and end-of-life phases are not included. Cradle-
to-gate assessments are the basis for environmental product declarations (EPD). An EPD® is
a certified environmental declaration developed in accordance with the standard ISO 14025.
Fig.3.1 A complete life cycle (Cradle to grave) of a product
3.2.2.1 Extraction and treatment of raw material
Material extraction includes all methods by which raw materials are mined, excavated or
otherwise gathered from the natural environment. LCA pays attention on every aspect
involved in this process. Primary concerns are energy consumption and exhaust output of
extraction equipment and processing facilities. Manufacturers can reduce impacts by doing a
number of things in this process, for instance, switching to different materials or material
suppliers, utilizing post-consumer materials.
Manufacturing:
Manufacturing is the process by which the raw materials are converted to a usable or sellable
product. LCA assesses energy consumption and exhaust output of the actual product
construction process. Fuel costs to supply the facility with raw materials may also be included

9
in this stage of the LCA. Improvement for easing environmental burden can be done by
utilizing energy conservation technologies, recycling left-over raw materials, recycling
defective products, adopting high-efficiency equipment, installing pollution prevention
devices and simplifying manufacturing process.
3.2.2.2 Transport and distribution
The primary issue during this period is the fuel consumption and greenhouse gas emission
during transportation. Developing a more efficient distribution logistics can be an accessible
way to reduce pollution.
3.2.2.3 Consumer use
It is the stage where a consumer actually uses or stores the product. In this step LCA
consideration focuses on energy consumption of the product (including batteries), toxic
emissions due to use or storage, product efficiency, and durability. Certainly developing
energy or material efficient product is helpful to reduce environmental impacts.
3.2.2.4 Post-consumer use
Products are recycled or reused in this period. Recycling means that the materials in the
product get extracted and used again to create new goods. Reuse means using the item for
something other than its originally intended use. Reuse also usually extends the life of the
item and delays it from entering a landfill. In this stage, LCA considers the benefits of
recycling and using a product. This will significantly lower the overall impact on the
environment. Recycling processes should also be considered in the analysis. Energy is
consumed and exhaust is created during all recycling processes. Several measures can also be
adopted to improve ecology situation, such as utilizing more easily recycled or
environmentally friendly materials, indicating on the package that the product can be reused
or recycled.
3.2.2.5 Proposal or end of life
As the end of a product, disposal can either include burial in a landfill or incineration.LCA
consideration should be given for the energy and exhaust that will be produced by the
incineration of the product. Items placed in a landfill can still impact the environment as well.
Consideration should be given to the potential pollutants harbored by the items buried in a
landfill such as landfill gases. Fuel costs for landfill equipment and garbage trucks should also
be included in the analysis.
10
4. Methodology
In order to accomplish requirements, it is essential to build a process map to identify all
related materials, energy sources, waste and process that contribute to the target product. The
process map is served as a guideline to conduct energy flow, mass flow and carbon footprint
within defined boundary.
After developing a process map, the whole manufacturing process is broken into different
functional units. Focuses should be put on the input and output of each function unit in order
to have a better understanding of how energy and mass flows.
4.1 Process map and boundaries
SHT purchases about 45% external aluminium material (ingot and external scrap) along with
55% internal scrap as raw material. Aluminium containing material and additives are heated
in 3 pre-heating furnaces in order to remove moisture in the material. Processed raw materials
are melted for 6-8 hours with heat generated from gas fuel or electricity in a melting furnace.
During the melting process flux helps with inclusion removal. The melt is then delivered to
gas-fuel holding furnace and have second inclusion cleanness with flux. Before casting,
aluminium melt passes through argon degasser and ceramic foam filter to lower hydrogen gas
bubble and inclusions. Assist with cooling water taken from lake, liquid aluminium turns into
solid slabs in casting pit. After sawing process, some slabs with standard size are transferred
to electrical homogenizing furnace in order to get finer microstructure. The whole cast house
process can be clear stated by Fig.4.1.
As shown in Fig.4.1, there are four recycling parts in cast house. Internal scrap in cast house
which is mainly from casting and sawing process is re-melted as raw material. It occupies 20%
of total internal scrap, while the rest part is from rolling mill and slitting mill. At the same
time, some sustainable energy solutions are applied to decrease energy loss through
production. For example, utilizing flue gas heat around from oxy-fuel melting furnace for one
of the pre-heating furnace is a good example to increase energy efficiency and decrease gas
emission at the same time. Another example is the second use of water heat after cooling
process. The exhaust water heat, which is used for cooling down inductors, is possible to be
collected to vaporized liquid oxygen and supply indoor heat for both industry and community
areas. Meanwhile, casting water taken from lake is mixed with heated casting waste water to
get optimized water temperature before flow into casting pit.

11
Fig.4.1 Input and out put of Sapa secondary aluminium cast house
12
4.2 Function units and on-site data
4.2.1 Pre-heat furnace
Raw materials such as scraps are normally saved and exposed in the open air environment. It
is a necessity to pre-heat load (material coming into furnace) and removes moisture before
melting process, especially for gas-fired melting furnace, sometimes too much water vapour
may result in serve explosion problem. Not only the consideration of security, but also the
pre-heating facility serves to raise temperature of raw material in order to save melting time
and have higher production. Load pre-heating can be achieved in a variety of ways, including:
Utilizing of unfired load heating section, where the load is in contact with incoming
exhaust gas in an extended part of the furnace.
Utilizing of external furnace, which is recovering high-temperature flue gas to dry and
pre-heat the charge before loading.
Utilizing of counter-current flow design in a furnace, where the burner gases flows in
opposite direction of load being heated.
In Sapa cast house, external furnace is used for load pre-heating, they are:
Fuel-fired pre-heat furnace
Flue gas pre-heat furnace
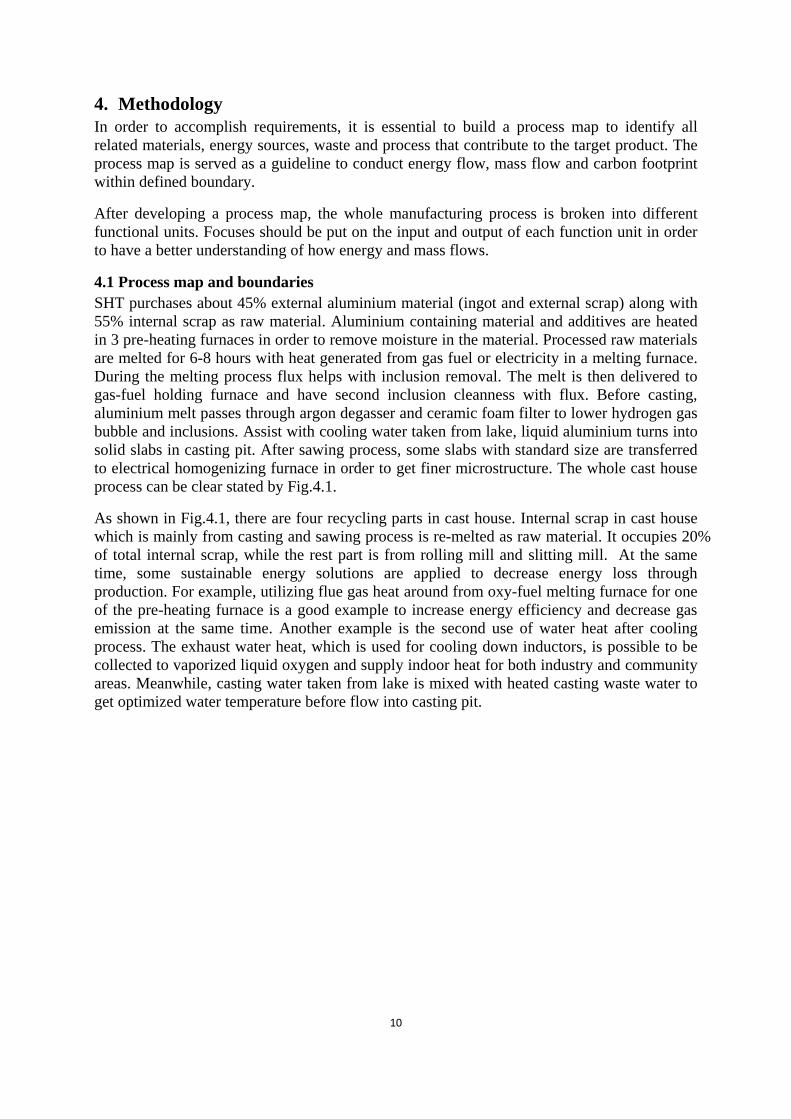
Figure 4.2 shows a schematic of a fuel-fired and a flue gas pre-heat furnace and the major
sources of energy loss from the furnaces.
Fig.4.2 Input and output for two types of pre-heat furnaces
(a) Flue gas pre-heat furnace (b) Fuel-fired pre-heat furnace
Fuel-fired furnace is the most common pre-heating furnace and it supplies thermal energy
through combustion of fuel. Compared to fuel-fired heating system, flue gas pre-heat furnace
brings combustion exhaust gas from a fuel-fired furnace into contact with cold incoming loads.
Flue gas pre-heat furnace offers effective possibilities of increasing thermal efficiency by
recovering waste heat and reducing fuel consumption. The amount of energy saving obtained
by load pre-heating helps to decrease waste gas emission give off to the atmosphere, so it is
also regarded as ‘green power’’ furnace. Figure 4.3 is showing one flue gas pre-heat furnace
which is using exhaust gas heat from oxy-fuel melting furnace to pre-heat load.
13
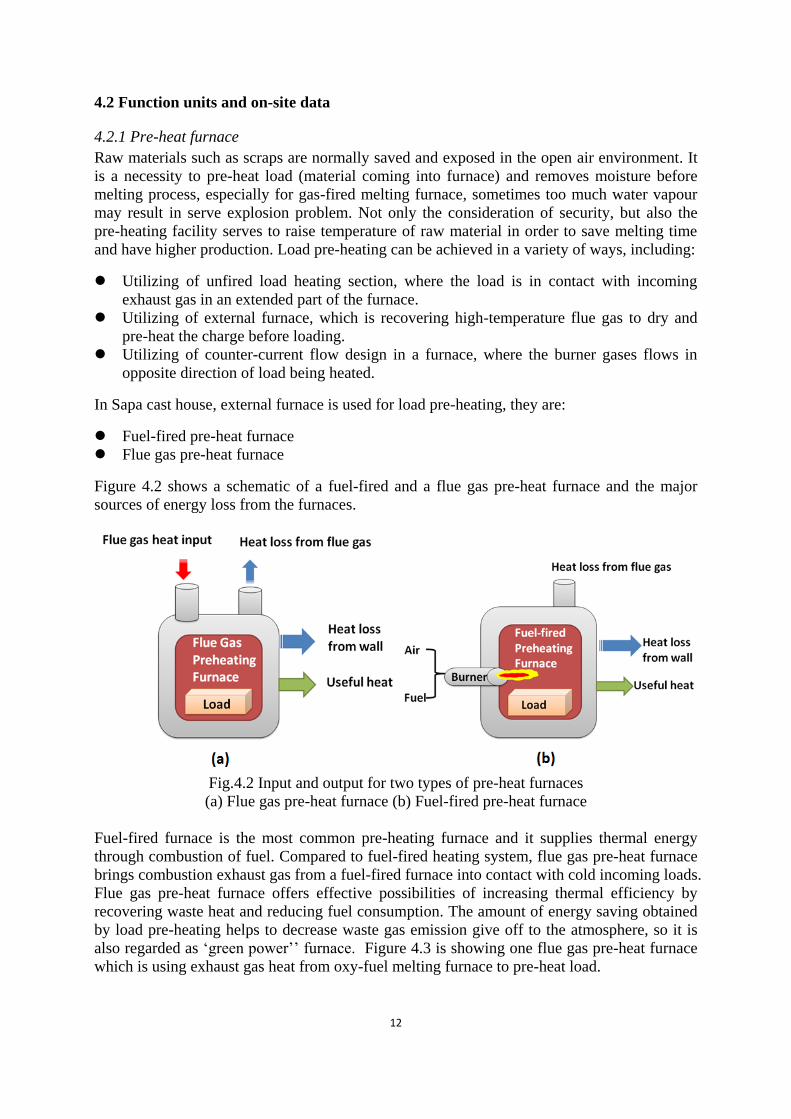
Figure 4.3 Flue gas pre-heat furnace in Sapa (left), oxy-fuel furnace (right)
In this project, one flue gas and two fuel-fired pre heating furnaces have been considered for
calculations. Input and output flue gas temperature of the waste gas pre-heat furnace is
measured 930°C and 307°C separately. Fuel-fired pre-heating furnace utilizes combustion
chemical energy of propane and air to heat the load. The load temperature after pre-heating is
measured as 196 °C.
4.2.2 Melting furnace
Melting furnace in secondary aluminium production is also called remelter due to charging
aluminium containing scrap as raw material. Scrap is melted and refined by removing
impurities and entrained gases by following steps:
Pure aluminium melts at the temperature of 660°C, while the melting furnace is usually
operated at 700°C. Melting furnace is regarded as the most energy-cost unit during the whole
secondary aluminium manufacturing process for the reason of high temperature and long
heating period requirement, for example, for a one-inductor induction furnace with capacity
of 11 tons the average melting time is about 1 ton/h. It means that the melting system is the
priority while considering improving energy efficiency of process.
Melting furnace is divided into two basic types based on energy source, they are:
Electric induction melting furnace
Gas-fired melting furnace
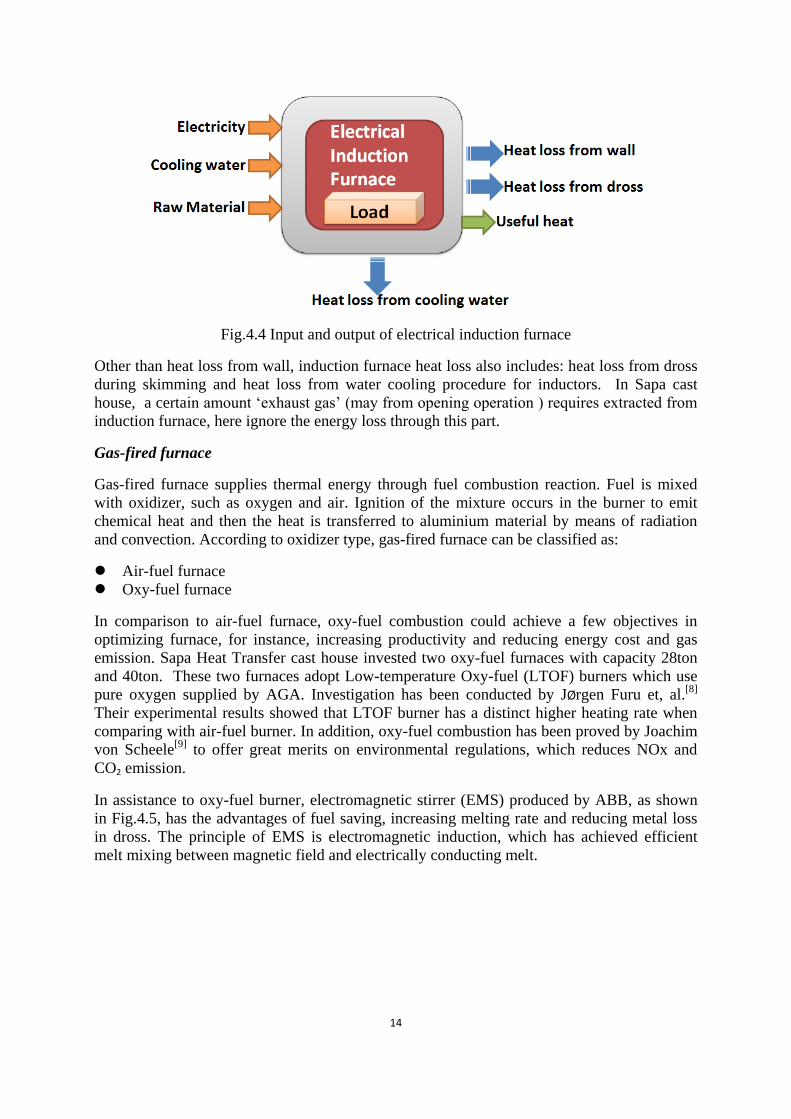
Electric induction furnace
Electric induction furnace is using induction heat to melt metal material. Induction heating is
a non-contact heating process which uses 50 to 400 kHz or higher operation frequency to heat
conductive material, for example metal. Electromagnetic induction requires an electric coil,
which is working with operation frequency and called inductor in induction furnace,
generating intensive alternating magnetic field to heat metal in furnace. In order to avoid
overheat or melt the working coil, a water cooling system is usually required for induction
heating.
Compared to gas furnace, induction furnace is regarded as clean melting operation with low
emissions. Since it is a non-contact heating method, contamination of melt is avoided during
heating. In addition, induction furnace keeps high energy efficiency for generating heat inside
the electrically conductive metallic material. Major energy losses through induction furnace
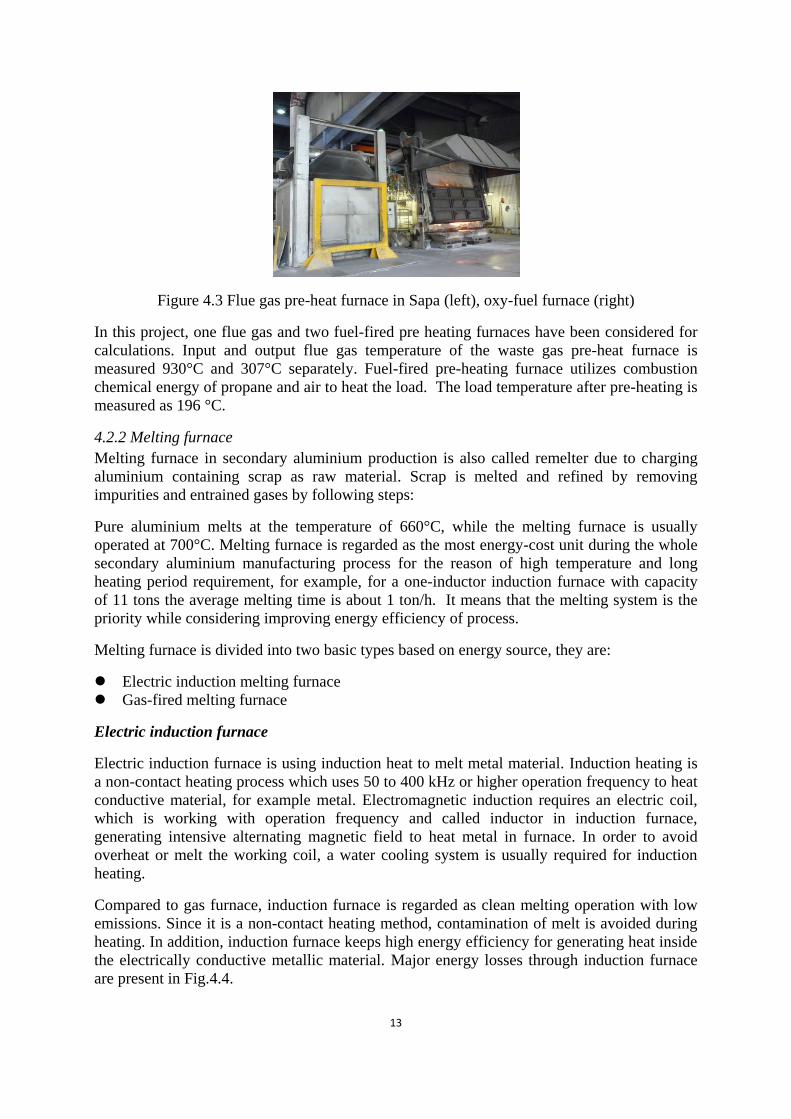
are present in Fig.4.4.
14
Fig.4.4 Input and output of electrical induction furnace
Other than heat loss from wall, induction furnace heat loss also includes: heat loss from dross
during skimming and heat loss from water cooling procedure for inductors. In Sapa cast
house, a certain amount ‘exhaust gas’ (may from opening operation ) requires extracted from
induction furnace, here ignore the energy loss through this part.
Gas-fired furnace
Gas-fired furnace supplies thermal energy through fuel combustion reaction. Fuel is mixed
with oxidizer, such as oxygen and air. Ignition of the mixture occurs in the burner to emit
chemical heat and then the heat is transferred to aluminium material by means of radiation
and convection. According to oxidizer type, gas-fired furnace can be classified as:
Air-fuel furnace
Oxy-fuel furnace
In comparison to air-fuel furnace, oxy-fuel combustion could achieve a few objectives in
optimizing furnace, for instance, increasing productivity and reducing energy cost and gas
emission. Sapa Heat Transfer cast house invested two oxy-fuel furnaces with capacity 28ton
and 40ton. These two furnaces adopt Low-temperature Oxy-fuel (LTOF) burners which use
pure oxygen supplied by AGA. Investigation has been conducted by JØrgen Furu et, al.[8]
Their experimental results showed that LTOF burner has a distinct higher heating rate when
comparing with air-fuel burner. In addition, oxy-fuel combustion has been proved by Joachim
von Scheele[9]
to offer great merits on environmental regulations, which reduces NOx and
CO2 emission.
In assistance to oxy-fuel burner, electromagnetic stirrer (EMS) produced by ABB, as shown
in Fig.4.5, has the advantages of fuel saving, increasing melting rate and reducing metal loss
in dross. The principle of EMS is electromagnetic induction, which has achieved efficient
melt mixing between magnetic field and electrically conducting melt.
15
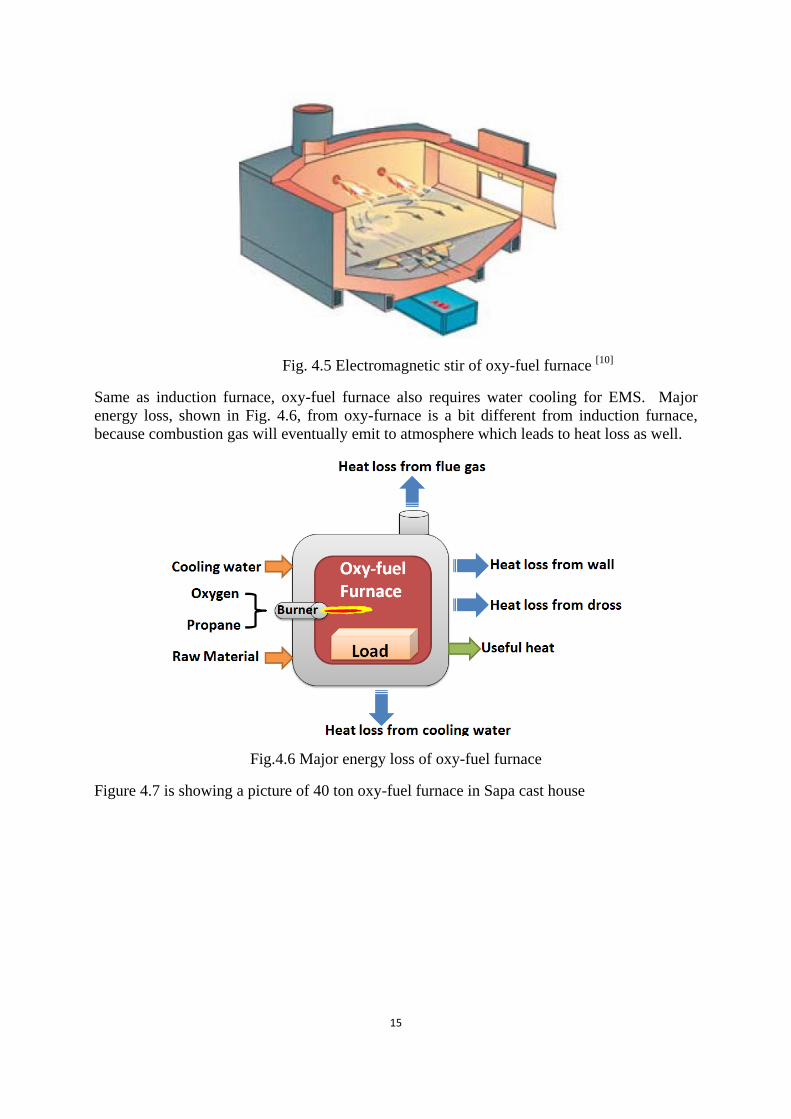
Fig. 4.5 Electromagnetic stir of oxy-fuel furnace [10]
Same as induction furnace, oxy-fuel furnace also requires water cooling for EMS. Major
energy loss, shown in Fig. 4.6, from oxy-furnace is a bit different from induction furnace,
because combustion gas will eventually emit to atmosphere which leads to heat loss as well.
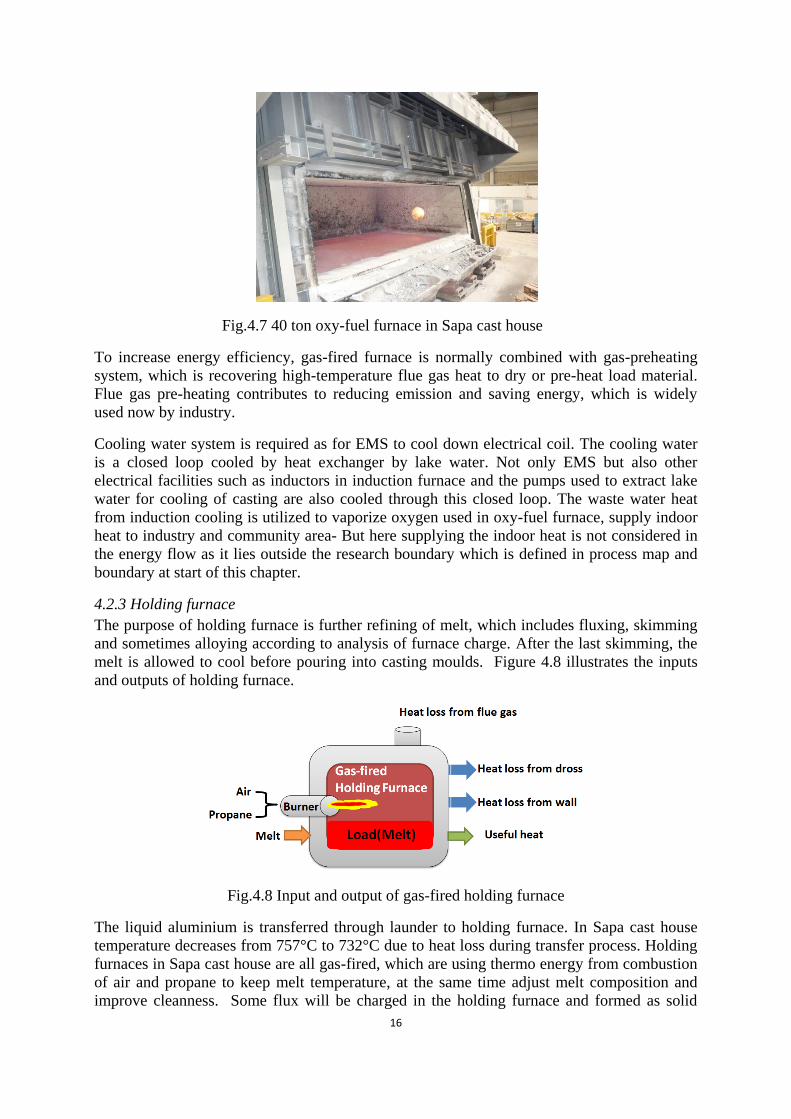
Fig.4.6 Major energy loss of oxy-fuel furnace
Figure 4.7 is showing a picture of 40 ton oxy-fuel furnace in Sapa cast house
16
Fig.4.7 40 ton oxy-fuel furnace in Sapa cast house
To increase energy efficiency, gas-fired furnace is normally combined with gas-preheating
system, which is recovering high-temperature flue gas heat to dry or pre-heat load material.
Flue gas pre-heating contributes to reducing emission and saving energy, which is widely
used now by industry.
Cooling water system is required as for EMS to cool down electrical coil. The cooling water
is a closed loop cooled by heat exchanger by lake water. Not only EMS but also other
electrical facilities such as inductors in induction furnace and the pumps used to extract lake
water for cooling of casting are also cooled through this closed loop. The waste water heat
from induction cooling is utilized to vaporize oxygen used in oxy-fuel furnace, supply indoor
heat to industry and community area- But here supplying the indoor heat is not considered in
the energy flow as it lies outside the research boundary which is defined in process map and
boundary at start of this chapter.
4.2.3 Holding furnace
The purpose of holding furnace is further refining of melt, which includes fluxing, skimming
and sometimes alloying according to analysis of furnace charge. After the last skimming, the
melt is allowed to cool before pouring into casting moulds. Figure 4.8 illustrates the inputs
and outputs of holding furnace.
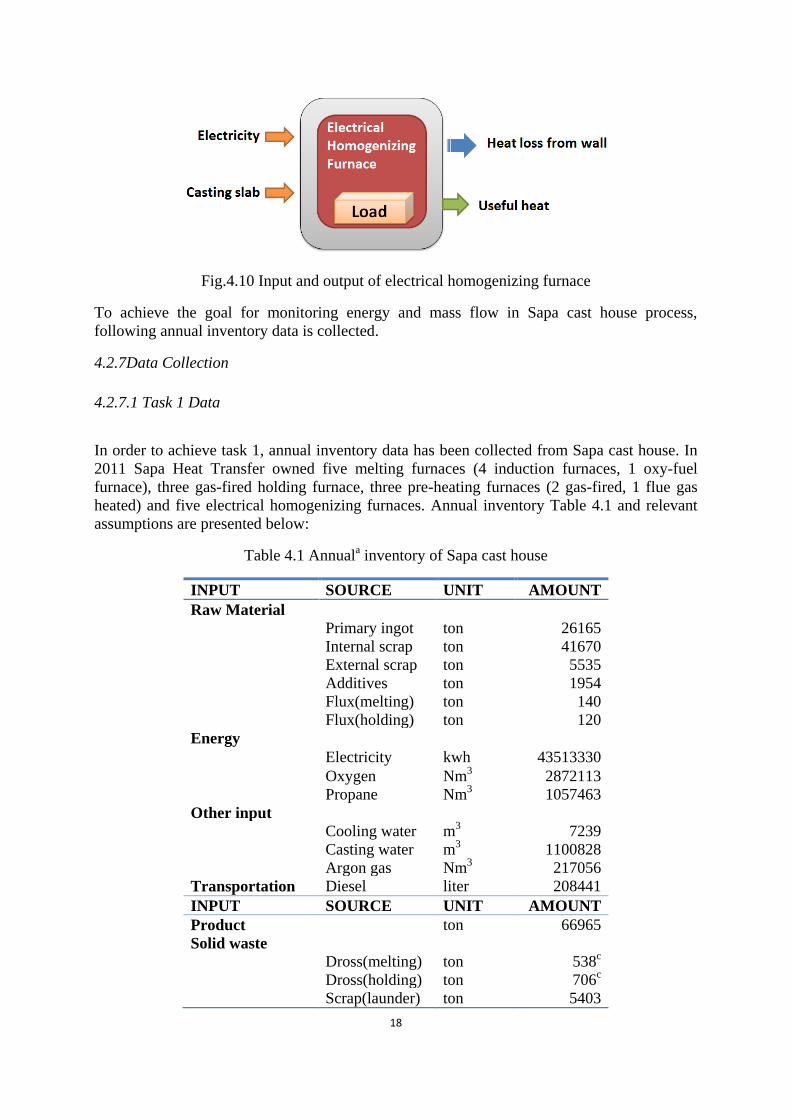
Fig.4.8 Input and output of gas-fired holding furnace
The liquid aluminium is transferred through launder to holding furnace. In Sapa cast house
temperature decreases from 757°C to 732°C due to heat loss during transfer process. Holding
furnaces in Sapa cast house are all gas-fired, which are using thermo energy from combustion
of air and propane to keep melt temperature, at the same time adjust melt composition and
improve cleanness. Some flux will be charged in the holding furnace and formed as solid

17
layer on the melt surface. Basically, the average melt temperature in the holding furnace is
723°C.
4.2.4 Casting
Before pouring the melt into casting moulds, grain refining and degassing steps should also be
implemented. Degassing is a process applied to remove entrained gases in molten aluminium,
especially for gas-fired furnace. In Sapa cast house, inert gas Argon is used for degassing,
which intends to decrease hydrogen content in the melt. TiB coil is applied for grain refining
purpose in Sapa cast house. Average melt temperature between filter and casting pit is 693°C,
heat loss through delivery.
Casting occurs with the water cooling system. In casting house the low temperature cooling
water is pumped up from the lake which will mix with hot casting water before flows into
casting mould. The water flow and heat exchange is described as Figure 4.9..
Fig.4.9 Casting cooling water flow
T1, T2 and T3 are measured on-site which is 11°C, 18 °C and 44°C respectively, M1 can be
measured using flow meter. Assuming , in other words, after casting the 44°C hot
water will be divided into two parts, half goes back to lake together with heat waste and half
goes is mixed with upcoming low temp water (e.g.11°C) and obtain 18°C before casting. Slab
temperature after casting is assumed same as cooling temperature 44°C.
4.2.5 Sawing
The slabs are cooled to room temperature 25°C while are laid in the casting house. Solidified
slabs are delivered to sawing machine to cut the dimensions according to customer’s
requirement. Some metal is lost in the form of sawing scrap in this process.
4.2.6 Homogenizing
Some casting slabs which are subjected to rolling must be homogenized in a homogenizing
furnace. This step is served for refining the grain size and improving the material’s properties.
Electricity charged furnace homogenizes the slabs at 600°C for almost 24 hours. In Sapa cast
house there are five homogenizing furnaces. Figure 4.10 presents inputs and outputs of
homogenizing furnace.
18
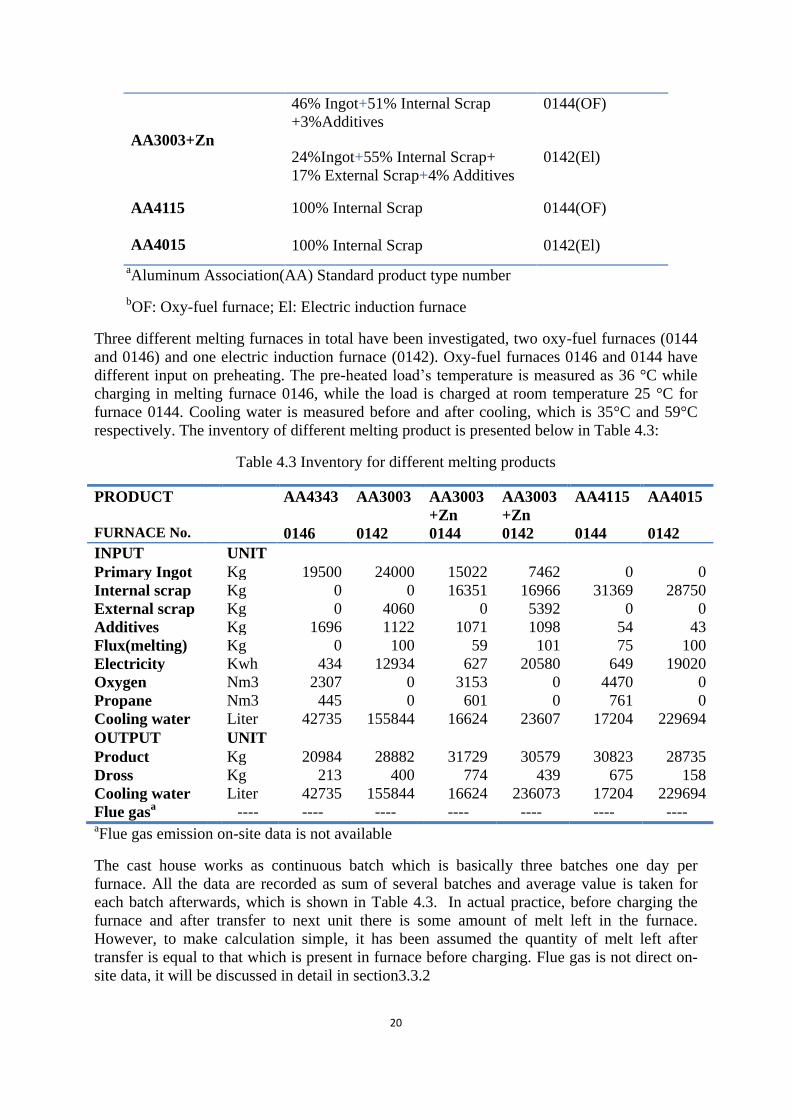
Fig.4.10 Input and output of electrical homogenizing furnace
To achieve the goal for monitoring energy and mass flow in Sapa cast house process,
following annual inventory data is collected.
4.2.7Data Collection
4.2.7.1 Task 1 Data
In order to achieve task 1, annual inventory data has been collected from Sapa cast house. In
2011 Sapa Heat Transfer owned five melting furnaces (4 induction furnaces, 1 oxy-fuel
furnace), three gas-fired holding furnace, three pre-heating furnaces (2 gas-fired, 1 flue gas
heated) and five electrical homogenizing furnaces. Annual inventory Table 4.1 and relevant
assumptions are presented below:
Table 4.1 Annuala inventory of Sapa cast house
INPUT SOURCE UNIT AMOUNT
Raw Material
Primary ingot ton 26165
Internal scrap ton 41670
External scrap ton 5535
Additives ton 1954
Flux(melting) ton 140
Flux(holding) ton 120
Energy
Electricity kwh 43513330
Oxygen Nm3 2872113
Propane Nm3 1057463
Other input
Cooling water m3 7239
Casting water m3 1100828
Argon gas Nm3 217056
Transportation Diesel liter 208441
INPUT SOURCE UNIT AMOUNT
Product ton 66965
Solid waste
Dross(melting) ton 538c
Dross(holding) ton 706c
Scrap(launder) ton 5403

19
Scrap(sawn) ton 2971
Liquid waste Casting water m3 550414
Gas waste Flue gasb
Nm3 ----
a Data source from year 2011
b Flue gas emission on-site data is not available
c In reality, Dross(melting)+ Dross(holding)=2400ton
As an approximation for annual data, it is assumed that:
All the raw materials (ingot, scrap, additives) are 100% Al, oxygen (100%O2), fuel (100%
C3H8), and flux (100% NaCl).
Except for combustion in furnace, fuel is also consumed in order to heat the casting
launder. Here it has been assumed that all propane is used for combustion.
In cast house, most pre-heated load is ingots. A simple assumption is made here that only
ingots are pre-heated. Meanwhile, in order to achieve mass and energy balance, pre-
heated ingot’s weight is assumed as 50% of total annual ingots’ weight due to only ingots
for oxy-furnace 0146 has pre-heating treatment.
50% casting water flows back to pre-heat newly coming casting water, in other words,
half casting water waste heat can be recycled here.
, on-site experiment for testing aluminum percent has
shown average statistics of component’s proportion in melting and holding dross.
Heat loss from wall usually consists of convection, radiation and conduction. However,
compared to convection and radiation, conduction heat loss is negligible.
Ideal gas behavior for all gaseous species or gas mixture is assumed. Enthalpy varies with
temperature. According to on-site analysis for oxy-fuel furnace and gas-fired holding
furnace, heat loss from flue gas for oxy-fuel furnace is around 14% of total oxy-fuel
furnace’s input energy. Air-fueled holding and pre-heating furnaces are assumed to have
50% energy loss through flue gas, based upon the onsite data analysis the heat loss
through flue gases in air-fueled furnace in Sapa cast house is in the range of 34-62%.
4.2.7.2 Task 2 Data
In order to accomplish task 2 i.e. to investigate effects of different melting furnaces and raw
material groups on energy consumption and carbon footprint, four different melting products
have been tracked on-site. Theses melting products have different ratio of raw material
(primary ingot, internal scrap and external scrap), as shown on Table 4.2.
Table 4.2 Raw material table for selected melting products
PRODUCT RAW MATERIAL FURNACE No.
AA4343a 92%Ingot+8%Additives(Si) 0146(OF)
b
AA3003 82% Ingot+14% External Scrap
+4%Additive
0142(El) b
20
AA3003+Zn
46% Ingot+51% Internal Scrap
+3%Additives
0144(OF)
24%Ingot+55% Internal Scrap+
17% External Scrap+4% Additives
0142(El)
AA4115
AA4015
100% Internal Scrap 0144(OF)
100% Internal Scrap 0142(El)
aAluminum Association(AA) Standard product type number
bOF: Oxy-fuel furnace; El: Electric induction furnace
Three different melting furnaces in total have been investigated, two oxy-fuel furnaces (0144
and 0146) and one electric induction furnace (0142). Oxy-fuel furnaces 0146 and 0144 have
different input on preheating. The pre-heated load’s temperature is measured as 36 °C while
charging in melting furnace 0146, while the load is charged at room temperature 25 °C for
furnace 0144. Cooling water is measured before and after cooling, which is 35°C and 59°C
respectively. The inventory of different melting product is presented below in Table 4.3:
Table 4.3 Inventory for different melting products
PRODUCT AA4343 AA3003 AA3003
+Zn
AA3003
+Zn
AA4115 AA4015
FURNACE No. 0146 0142 0144 0142 0144 0142
INPUT UNIT
Primary Ingot Kg 19500 24000 15022 7462 0 0
Internal scrap Kg 0 0 16351 16966 31369 28750
External scrap Kg 0 4060 0 5392 0 0
Additives Kg 1696 1122 1071 1098 54 43
Flux(melting) Kg 0 100 59 101 75 100
Electricity Kwh 434 12934 627 20580 649 19020
Oxygen Nm3 2307 0 3153 0 4470 0
Propane Nm3 445 0 601 0 761 0
Cooling water Liter 42735 155844 16624 23607 17204 229694
OUTPUT UNIT
Product Kg 20984 28882 31729 30579 30823 28735
Dross Kg 213 400 774 439 675 158
Cooling water Liter 42735 155844 16624 236073 17204 229694
Flue gasa ---- ---- ---- ---- ---- ---- ----
aFlue gas emission on-site data is not available
The cast house works as continuous batch which is basically three batches one day per
furnace. All the data are recorded as sum of several batches and average value is taken for
each batch afterwards, which is shown in Table 4.3. In actual practice, before charging the
furnace and after transfer to next unit there is some amount of melt left in the furnace.
However, to make calculation simple, it has been assumed the quantity of melt left after
transfer is equal to that which is present in furnace before charging. Flue gas is not direct on-
site data, it will be discussed in detail in section3.3.2
21
4.3 Mass and energy conservation
For calculating energy consumption, the basic principles of mass and energy conservation has
been used, which means total input of mass and energy equals to total output of mass and
energy, suggested as Eq. 1 and 2.
(1)
(2)
Energy efficiency is used to describe how much energy resources are converted into useable
work, for example energy efficiency of a melting furnace means the ratio of heat delivered to
the material. If a melting furnace energy efficiency is 60%, that’s to say, 60% of the furnace’s
input energy is used for melting purpose. Energy efficiency is also used to judge the energy
conversion equipment’s working performance. It can be calculated with total input of energy
and energy loss, as presented in Eq.3.
(3)
4.3.1 Input energy
4.3.1.1 Electricity
In order to compare energy distribution during process, in this work the unite energy unit is
used. According to the energy convert: ℎ
4.3.1.2 Gas fuel
Gas fuel in Sapa cast house is liquid petroleum gas (LPG) which contains 95% C3H8 and
gross calorific value (GCV) or higher heating value (HHV) of the fuel is 94.15 MJ/Nm3. The
fuel is vaporized by electricity and used in all gas-fired furnaces to provide energy for heating.
In addition to this, some propane is also consumed by casting launder for 1-2 hours for pre-
heating. The energy stored in fuel can be estimated using Eq.4.
(4)
4.3.1.3 Pre-heating with waste heat recovery
Pre-heating with waste heat recovery consists of water waste heat and gas waste heat in Sapa
cast house process. Load pre-heating for one of the oxy-fuel furnaces is done by recovering
hot flue gas from oxy-fuel furnace. Meanwhile, water waste heat is recycled for newly
incoming casting water pre-heating and vaporizing liquid oxygen. The amount of energy
saving obtained by load is higher than the amount of actual heat transferred to the load. The
actual heat delivered to the load should be accounted for the efficiency of furnace.
a. Flue gas pre-heating
Flue gas temperature after oxy-fuel melting furnace is usually quite high i.e. 700-1000°C.The
energy stored in flue gas is utilized to pre-heat input materials, such as heat load material.
22
This preheating can decrease heat lost and improve efficiency. Vaporizing heat of oxygen can
be calculated as Eq.5:
(5)
The technical data of vaporizing energy 213kJ/kg required for oxygen is obtained from
supplier, AGA company. Pre-heating of raw materials in cast house is mainly heating of ingot
materials and a relatively small part of scraps. To ease the calculations it has been assumed
that only ingots are pre-heated, and the energy for pre-heating can be calculated as Eq.6:
(6)
Ingot material, which consists of Al, Si and Fe, is pre-heated to a temperature of 196°C.
Ambient temperature has been tested with thermocouple and average value is 25°C.
and is calculated by
computational thermodynamic software Thermocalc. This computational method will be
described in section 3.3.3.
b. Cooling water pre-heating
In casting house the low temperature cooling water is pumped up from the lake which is
mixed with hot casting water before it flows into casting mould, as shown in Fig.4.10. The
heat of pre-heating cooling water can be calculated by Eq. 7
(7)
Where =4.2J/g*K, and is independent of temperature in liquid state.
, .
4.3.2 Output energy
Energy output consists of sources below:
4.3.2.1Useful heat
Useful heat which means the energy used to heat the load, for instance the useful heat for a
melting furnace is the heat stored in the melt. The more energy flows to useful heat, the higher
will be efficiency the furnace. The average heating temperature of melting furnace in this
project is assumed 757°C. Melting furnace’s useful heat can be obtained according to Eq.8.
(8)
4.3.2.2Heat loss of flue gases
Energy loss through flue gas is the sum of sensible heat of each component, which is equal to
each component’s enthalpy difference between flue gas temperature and ambient temperature,
as given in Eq.9.
(9)
Where, is flue gas component’s molar fraction, is temperature of flue gas, and it
varies upon furnace and time range, which is usually obtained by thermocouple in flue gas
pipe.

23
a. Flue gas composition
Flue gas composition analysis is conducted by AGA company. Flue gas is taken from
production (shown as Fig.4.11) and treated with water and particle filters, then taken
composition analysis of dry flue gas for about 8 hours.
Fig. 4.11 Taking flue gas from gas pipe
Two oxy-fuel furnaces 0144, 0146, three holding furnaces 0143(for induction furnace 0142),
0145(for oxy-fuel furnace 0144), 0147 (for oxy-fuel furnace 0146) have been analysed for
flue gas composition.
A simple assumption has been made that the furnace is working with complete combustion
and gas products are only CO2, O2, N2 and water vapour gas and the composition is
independent of time. The analysis result is listed in Table 4.4
Table 4.4 Flue gas composition of Sapa’s furnace (Measured as dry gas)
FURNACE No. CO2%vol O2%vol
0144(Oxy-fuel furnace) 29.8 18.3
0146(Oxy-fuel furnace) 59.8 8.4
0143(Holding furnace) 9.1 7.2
0145(Holding furnace) 6.1 11.9
0147(Holding furnace) 4.6 14.3
This composition is analysed in dry condition, which requires one step conversion of H2O
ratio. According to propane’s combustion reaction, presented in Eq.10, the theoretical ratio of
CO2/H2O=3/4.
(10)
As mentioned earlier, there is one flue gas pre-heating furnace which utilizes flue gas from
oxy-fuel melting furnace 0146 to pre-heat load, in this project the output flue gas of this pre-
heating furnace is regarded as the same gas composition as melting furnace 0146.
b. Mass of flue gas
Mass balance shows input gas mass is equal to output gas. In other words, mass of flue gas is
equal to total input gas. Input gas is made of propane, oxidizer gas (oxygen for oxy-fuel
24
furnace and air for air-fuel furnaces), and air leakage. Ignoring the influence of oxidizer gas
react with melt, the flue gas can be calculated by Eq.11
(11)
Consumption of propane and oxygen from oxy-fuel furnace is easily obtained from Sapa cast
house’s fuel consumption record history. However, the consumption for all gas-fired holding
furnaces is not recorded by company. It has been assumed that these furnaces’ burners are
working at 50% power all the time.. The energy consumed by burners indirectly indicates
rough propane consumption.
Air amount is calculated based on following Eq. 12 and Eq.13
(12)
(13)
According to flue gas component’s molar fraction in Table 4.5, the air amount can be
obtained.
c. Flue gas temperature
Flue gas temperature of two oxy-fuel preheating furnace is measured by thermocouples which
are installed for controlling furnaces. Temperature under different time is recorded
automatically and can be extracted from computer system.
For three holding furnaces, no flue gas temperature data is stored. Hence here it has been
assumed that the flue gas temperature of furnaces 0143, 0145, 0147 is the same as furnace’s
roof temperature, which can also be obtained from company’s computer system.
Flue gas temperature varies with time and charge and in this work for each charge is the
average value within time range.
d. Enthalpy
, gas components CO2, O2, N2, H2O (assuming complete
combustion) under different temperature can be checked through handbook of thermo
chemical data [11]
.
Due to water is liquid form at the temperature of 25°C, the latent heat of water should also be
considered, as mentioned in Eq. 14, and latent heat for water is
[12].
(14)
4.4.2.3Heat loss of cooling water
Cooling water is used to cool down electrical facilities in production which raise the internal
closed loop system from 35°C to 59°C. Regarding casting water, as is presented in Fig.4.10,
half hot casting water flows back to lake and the rest water is recycled to pre-heat new lake
water. So here, only the energy loss associated with the proportion of water which goes back
25
to lake is considered and it is the sensible heat of water, from casting temperature 44°C to
temperature before mixing 11°C. Heat loss is calculated by Eq. 15.
(15)
4.3.2.4 Heat loss of delivery
In real production process, the material is not able to be directly transferred to next furnace.
The heat is lost during delivery period with ambient environment. Energy loss results in
material’s temperature decreasing. Raw material temperature after pre-heating is 196°C and
the temperature drops down to 33°C while charging in melting furnace. The melt temperature
in melting furnace is 757°C and the temperature decreased to 732°C while transfer to holding
furnace. The melt loses energy during transfer from holding furnace to casting pit, which
shows temperature difference from 723 °C to 693°C. The newly cast slab and homogenized
slabs have temperature of 44 °C and 600 °C for each, but both heats will radiate and decline
to ambient temperature. The loss through delivery is obtained by using Eq.16.
(16)
is also calculated through computational software Thermocalc
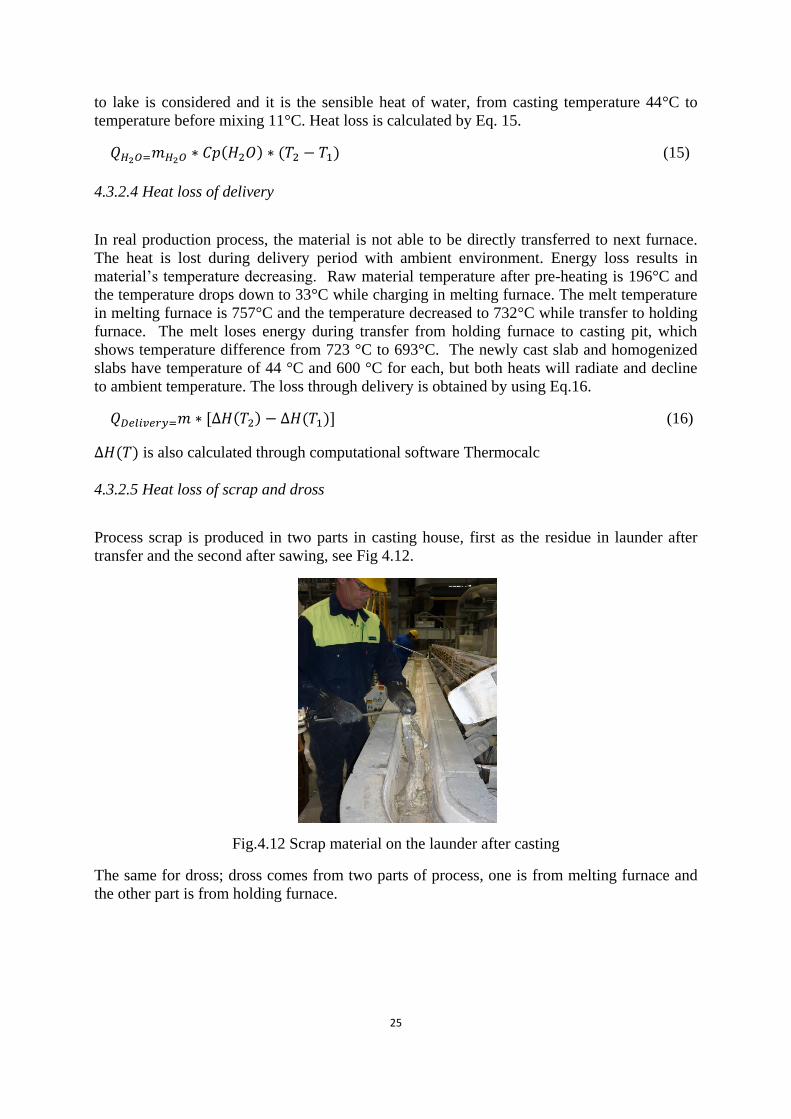
4.3.2.5 Heat loss of scrap and dross
Process scrap is produced in two parts in casting house, first as the residue in launder after
transfer and the second after sawing, see Fig 4.12.
Fig.4.12 Scrap material on the launder after casting
The same for dross; dross comes from two parts of process, one is from melting furnace and
the other part is from holding furnace.
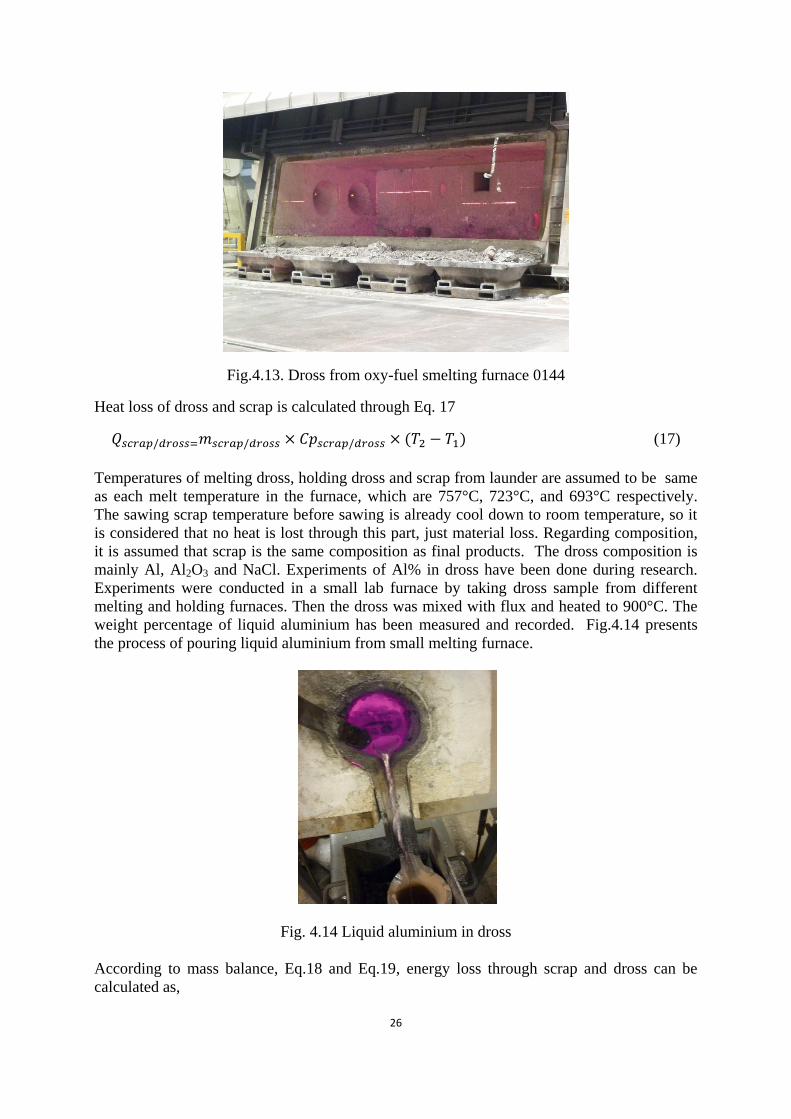
26
Fig.4.13. Dross from oxy-fuel smelting furnace 0144
Heat loss of dross and scrap is calculated through Eq. 17
(17)
Temperatures of melting dross, holding dross and scrap from launder are assumed to be same
as each melt temperature in the furnace, which are 757°C, 723°C, and 693°C respectively.
The sawing scrap temperature before sawing is already cool down to room temperature, so it
is considered that no heat is lost through this part, just material loss. Regarding composition,
it is assumed that scrap is the same composition as final products. The dross composition is
mainly Al, Al2O3 and NaCl. Experiments of Al% in dross have been done during research.
Experiments were conducted in a small lab furnace by taking dross sample from different
melting and holding furnaces. Then the dross was mixed with flux and heated to 900°C. The
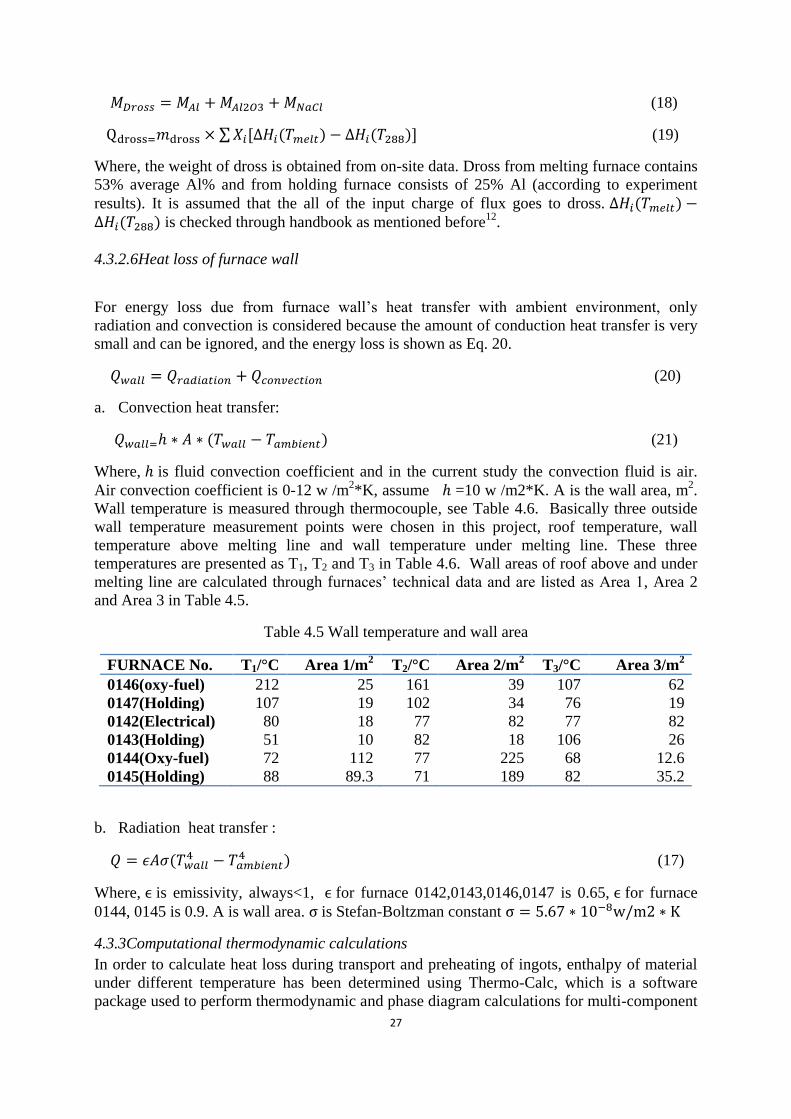
weight percentage of liquid aluminium has been measured and recorded. Fig.4.14 presents
the process of pouring liquid aluminium from small melting furnace.
Fig. 4.14 Liquid aluminium in dross
According to mass balance, Eq.18 and Eq.19, energy loss through scrap and dross can be
calculated as,
27
(18)
(19)
Where, the weight of dross is obtained from on-site data. Dross from melting furnace contains
53% average Al% and from holding furnace consists of 25% Al (according to experiment
results). It is assumed that the all of the input charge of flux goes to dross. is checked through handbook as mentioned before
12.
4.3.2.6Heat loss of furnace wall
For energy loss due from furnace wall’s heat transfer with ambient environment, only
radiation and convection is considered because the amount of conduction heat transfer is very
small and can be ignored, and the energy loss is shown as Eq. 20.
(20)
a. Convection heat transfer:
(21)
Where, is fluid convection coefficient and in the current study the convection fluid is air.
Air convection coefficient is 0-12 w /m2*K, assume =10 w /m2*K. A is the wall area, m
2.
Wall temperature is measured through thermocouple, see Table 4.6. Basically three outside
wall temperature measurement points were chosen in this project, roof temperature, wall
temperature above melting line and wall temperature under melting line. These three
temperatures are presented as T1, T2 and T3 in Table 4.6. Wall areas of roof above and under
melting line are calculated through furnaces’ technical data and are listed as Area 1, Area 2
and Area 3 in Table 4.5.
Table 4.5 Wall temperature and wall area
FURNACE No. T1/°C Area 1/m2 T2/°C Area 2/m
2 T3/°C Area 3/m
2
0146(oxy-fuel) 212 25 161 39 107 62
0147(Holding) 107 19 102 34 76 19
0142(Electrical) 80 18 77 82 77 82
0143(Holding) 51 10 82 18 106 26
0144(Oxy-fuel) 72 112 77 225 68 12.6
0145(Holding) 88 89.3 71 189 82 35.2
b. Radiation heat transfer :
(17)
Where, is emissivity, always<1, for furnace 0142,0143,0146,0147 is 0.65, for furnace
0144, 0145 is 0.9. A is wall area. is Stefan-Boltzman constant
4.3.3Computational thermodynamic calculations
In order to calculate heat loss during transport and preheating of ingots, enthalpy of material
under different temperature has been determined using Thermo-Calc, which is a software
package used to perform thermodynamic and phase diagram calculations for multi-component

28
systems. The calculations performed on Thermo-calc are based upon high quality database
developed by assessment and evaluation of various experimental and theoretical information.
In the current study TCAL1 database was assessed using TCC ((thermo calc classic) to
perform the desired calculations. The obtained values of the enthalpy under different
temperature are listed as Table 4.6 and Table 4.7.
Table 4.6Enthalpy of pre-heated primary aluminium ingot
TEMPERATURE 196°C 36°C 25°C
INGOT (J/KG) 157560 9943.09 -4170
Table 4.7 Pure aluminium enthalpy under different temperature
TEMPERATURE 25°C 36°C 196°C 757°C 726°C 723°C 693°C 600°C
Al (J/KG) -720 9943 161873 1182620 1146140 1142610 1107320 597774
4.4Carbon footprint analysis
Carbon footprint calculation of any good is based on life cycle assessment method, with
following steps:
4.4.1 Goal and boundaries definition
The goal of carbon footprint analysis in this study is to compare a number of secondary cast
house aluminium products. After identification of the goal, the system boundary should also
be clear clarified before the next following data collection step. This study is a cradle-to-gate
life cycle analysis of secondary aluminium cast house product (see Fig.4.15).It doesn’t
include the downstream use phase and end-of–life cycling of the analysed cast house products.
Fig. 4.15 GHG emission process map in Cast house
As shown in Fig.4.15, the system boundaries for LCA for secondary aluminum cast house
product involves the activities of secondary aluminum manufacturing sites and the production
and transport of raw material, energy sources, and other consumables(diesel for internal
transport, oxygen, nitrogen etc.) used in the aluminumworks.
29
Carbon footprint is used to access a product or process’s contribution to greenhouse effect and
it can be accumulated by both direct and indirect ways. The direct carbon dioxide emission in
Sapa cast house is from diesel and liquid petroleum gas’s (propane) combustion. On the other
hand, indirect carbon dioxide is related to raw material and energy source, as well as auxiliary
activity input.
4.4.2 Data collection
Each material has different contribution to the final emission. It’s supposed to have a better
sense of priority, where and when not to focus. For instance, immaterial emissions sources
(less than 1% of total footprint), human inputs to processes and animal providing transport
have no significant influence so they can be ignored while collecting data.
Data collection step directly decides on the result quality. The data recorded in relation to a
product shall include all GHG emission and removals occurring within the boundary of that
product. It is recommended to use as many primary activity data as possible for all processes
and material, because primary data is on-site measured data and more reliable. When primary
activity data is not available or not able to directly measure on-site, secondary data should be
derived from other sources and used to ensure consistency. For secondary data, it’s
recommended to use verified data, publications and other competent sources.
4.4.2.1 Fuels and energy
Electricity
Electricity used in Sapa is supplied by Vattenfall company, which is owned by Swedish
government. The electricity is generated by 100% nuclear power and is a certified
environmental product by environment product declaration (EPD). The life cycle includes
three processes: upstream process (uranium mining, conversion, enrichment and fuel
fabrication etc.), core process(operation of nuclear power plant and radioactive waste facilities)
and downstream (operation and construction of electricity networks ). 3% distribution of
electricity losses has also been included in the downstream calculation in this EPD. Green
house gas emission is 6.5gCO2eq./kwh[13]
.
Combustion Fuel-Propane
Propane, liquid petroleum gas (LPG) is purchased from COOR AB. Emission factor of LPG,
0.24140kgCO2eq/kwh, is collected from 2012 Guidelines to Detra, which is documenting
GHG emission factor for company reporting in U.K. [14]
This emission factor allows activity
data for example liter of fuel, to be converted into carbon dioxide equivalent (CO2eq.), which
is a global unit be widely used. Values for N2O and CH4 are presented as CO2eq. as well.
Considering the measured unit in Sapa is Nm3, convert with combustion value 94.15MJ/Nm3
which is provided by AGA company, the contribution factor of GHG for propane is
6.31328kg CO2eq. /Nm3.
4.4.2.2 Raw material
Primary aluminium ingot
30
Raw material primary aluminium ingot is purchased from LME ware house in Netherland. In
this study the data of raw aluminium material is acquired from an aluminium environment
profile report [15]
by European Aluminium Association (EAA). This environment report
contributes to providing aluminium life cycle inventory (LCI) data based on European
aluminium production, and the LCI data refers to International standards ISO 14040 and ISO
14044. The primary aluminium production LCI dataset corresponds to the production of 1 ton
of ingot from bauxite mining to sawn aluminium ingot ready to delivery and the GHG
emission is 9677kg CO2eq./ton.
Disregarding recycling of aluminium material, if a 100kg of primary aluminium is required
for a product system, the environmental burden of the production of 100kg primary
aluminium have to be fully charged to the product. But since most aluminium product is not
consumed but used due to high recycling rate, the recycled aluminium scraps have almost
same properties as primary aluminium which reduces the environmental burden from primary
aluminium. According to ISO14041, the environmental burdens related to extraction and
manufacturing of raw materials and end-of –life operation should be shared with subsequent
product life cycles. European aluminium industry recommended substitution methodology
which considers that recycled aluminium substitutes primary aluminium and only metal losses
during the whole life cycle needs to be balanced by primary aluminium [16]
. In this case, if
90kg of recycled ingot in above example, the environmental burden from primary aluminium
is only the lost aluminium, which is 10kg of primary aluminium have to be charged to the
product under study, together with the burden of the recovery operation.
In this study, assumptions of aluminium life cycle have been made: recycling rate for the
product in Sapa cast house is 95%, meanwhile, recovery operation contributes 150kg CO2eq.
per ton recycled material. This end-of-life burden’s assumption is also applied to external
scrap. The scrap preparation procedure is highly varied upon scrap type and the contamination
in the material, but the value can be adjusted in further study if higher accuracy is required.
Scrap
Scrap input to the secondary aluminium process is defined in three types:
a. Internal Scrap-Aluminium scrap is from cast house, which is mainly from casting and
sawing process.
b. Home scrap-Aluminium scrap is from milling or scalping, other than cast house.
c. External scrap-Aluminium scraps from external supply, outside Sapa Heat Transfer
company.
In this study it is assumed that the home scrap has the same carbon footprint as internal scrap
and can be fully recycled without metal loss. The environmental burden of scrap is almost 0 if
it corresponds to remelting process without any scrap pre-treatment. Howerver, for external
scrap, 159kg CO2eq./ton burden for recycling material is estimated for recovery operation like
shredding, cutting and drying.
4.4.2.3 Additives
Additives including all alloy elements, like silicon, magnesium, zinc. They are aluminium
based material, and for most alloy products the alloy elements is less than 5% in total raw
31
materials, simply make assumption here all additives’ carbon footprint contribution factor is
same as external scrap’s.
4.4.2.4 Transport
Internal transportation is using diesel produced in Preem. The diesel product is ACP Diesel
without RME. This Preem’s standard diesel contains maximum 5 percent FAME, which is a
renewable fuel and thus reduces the net contribution of fossil carbon dioxide. Contribution
factor, 3.1672kg CO2 eq., of diesel is referring bio fuel blend in 2012 Guidelines to Detra,
which is documenting GHG emission factor for company reporting in U.K.
External transportation, which is used for delivering raw material (ingot, external scrap,
additives) from manufacturing site to Sapa cast house, is not considered in this study due to
insufficiency of data. But environmental burden from this part shouldn’t be ignored and the
accuracy can be improved when data is available.
4.4.2.5 Other consumables
Other input sources like oxygen, cooling water and argon gas has little contribution to GHG
emission, they are omitted in this study.
4.4.3 Carbon footprint calculation
Mass and energy balance is applied to account for all input and output streams. Total energy
and mass input equal to total energy and mass output. Generally, carbon footprint is
calculated in two parts: the primary and secondary footprint. The primary footprint is the
direct greenhouse gas amount generated in the process, for example burning of gas and fossil
fuel which release direct carbon dioxide emission. The secondary footprint is the CO2 gas
amount created in the production of items that are used in the process, for instance, the
electricity is consumed during secondary production but the emissions are indirect as they
occurred at the generation plant. Footprint value of product is the sum of all raw material,
energy and waste through all activities in a product’s life cycle, see Eq.18
(18)
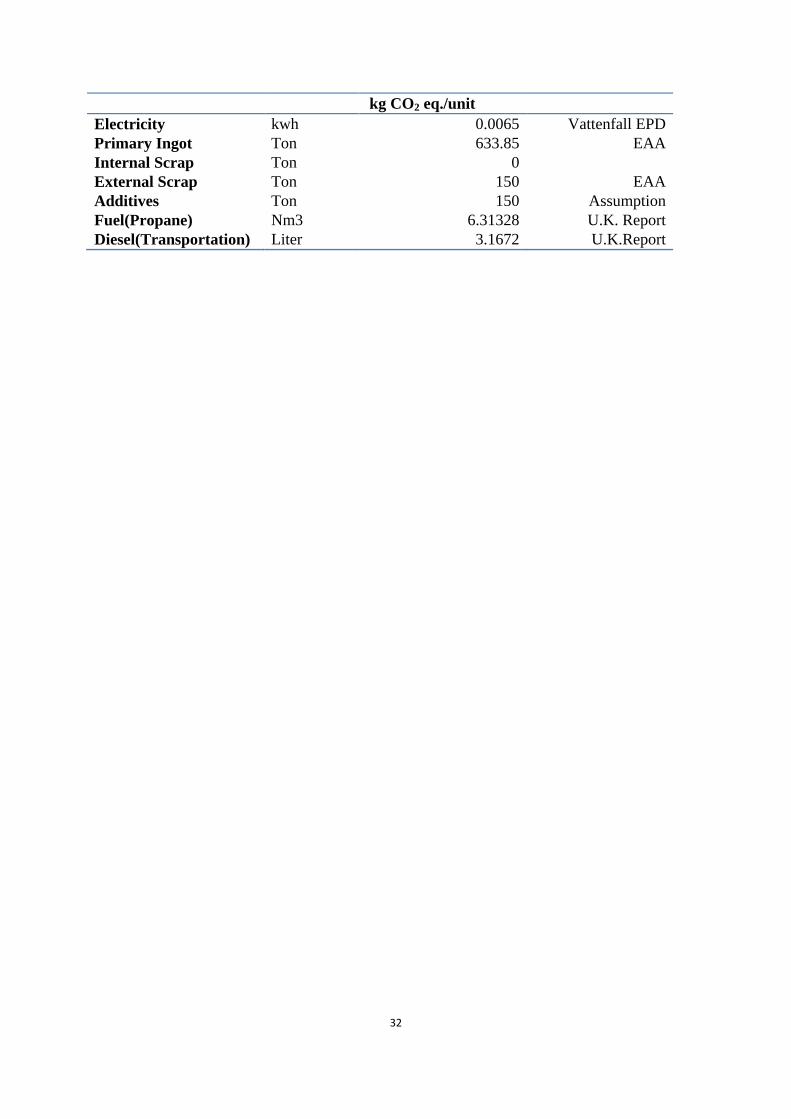
A contribution factor is the GHG emission (measured as CO2 eq.) generated from per unit
GHG contributor. Based on data collection and assumptions in section 4.4.2, contribution
factors used in this project are shown in Table4.8. In this project, only raw material ingot,
internal scrap, external scrap, additives and internal transportation are taken into consideration
as indirect GHG emission due to small influence of other source and insufficient data in
current situation, shown as Table 4.8. Other sources like cooling water, flux, oxygen and
argon which has small emission during production are ignored in the calculation.
Table4.8 Contribution factor for GHG emission contributors in Sapa cast house
GHG EMISSION
CONTRIBUTOR
UNIT CONTRIBUTION
FACTOR
SOURCE
32
kg CO2 eq./unit
Electricity kwh 0.0065 Vattenfall EPD
Primary Ingot Ton 633.85 EAA
Internal Scrap Ton 0
External Scrap Ton 150 EAA
Additives Ton 150 Assumption
Fuel(Propane) Nm3 6.31328 U.K. Report
Diesel(Transportation) Liter 3.1672 U.K.Report
33
5. Results and Discussion
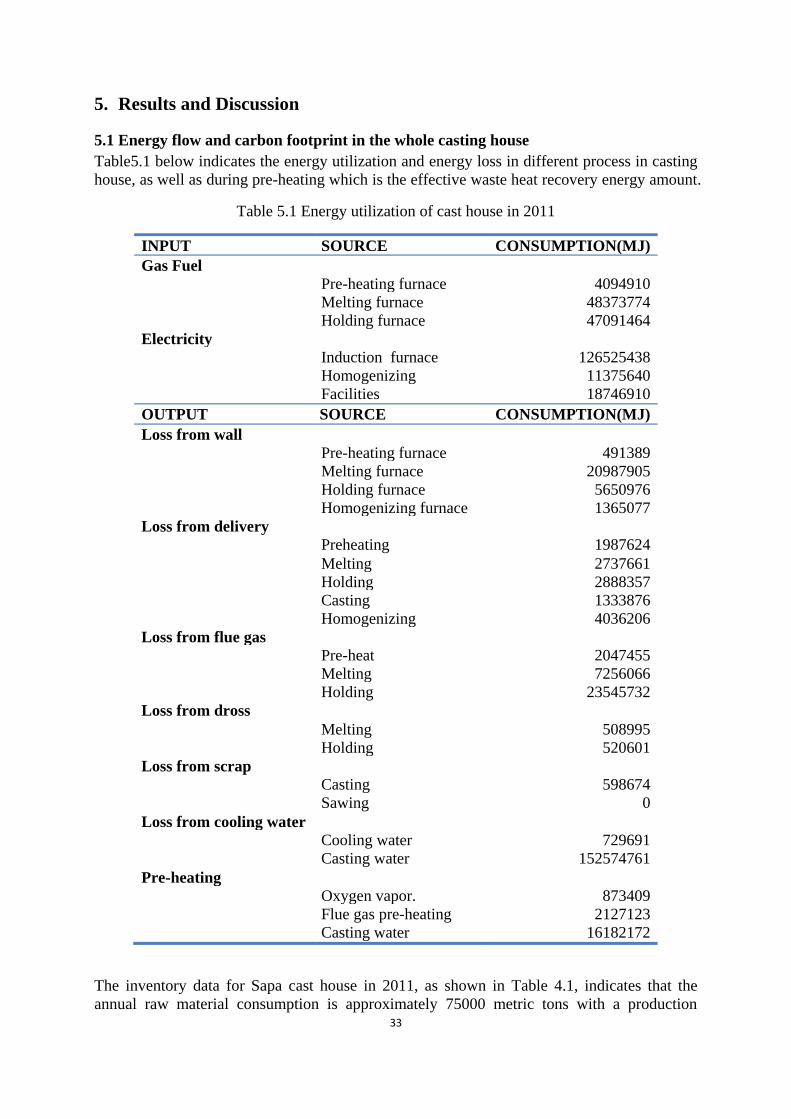
5.1 Energy flow and carbon footprint in the whole casting house
Table5.1 below indicates the energy utilization and energy loss in different process in casting
house, as well as during pre-heating which is the effective waste heat recovery energy amount.
Table 5.1 Energy utilization of cast house in 2011
INPUT SOURCE CONSUMPTION(MJ)
Gas Fuel
Pre-heating furnace 4094910
Melting furnace 48373774
Holding furnace 47091464
Electricity
Induction furnace 126525438
Homogenizing 11375640
Facilities 18746910
OUTPUT SOURCE CONSUMPTION(MJ)
Loss from wall
Pre-heating furnace 491389
Melting furnace 20987905
Holding furnace 5650976
Homogenizing furnace 1365077
Loss from delivery
Preheating 1987624
Melting 2737661
Holding 2888357
Casting 1333876
Homogenizing 4036206
Loss from flue gas
Pre-heat 2047455
Melting 7256066
Holding 23545732
Loss from dross
Melting 508995
Holding 520601
Loss from scrap
Casting 598674
Sawing 0
Loss from cooling water
Cooling water 729691
Casting water 152574761
Pre-heating
Oxygen vapor. 873409
Flue gas pre-heating 2127123
Casting water 16182172
The inventory data for Sapa cast house in 2011, as shown in Table 4.1, indicates that the
annual raw material consumption is approximately 75000 metric tons with a production
34
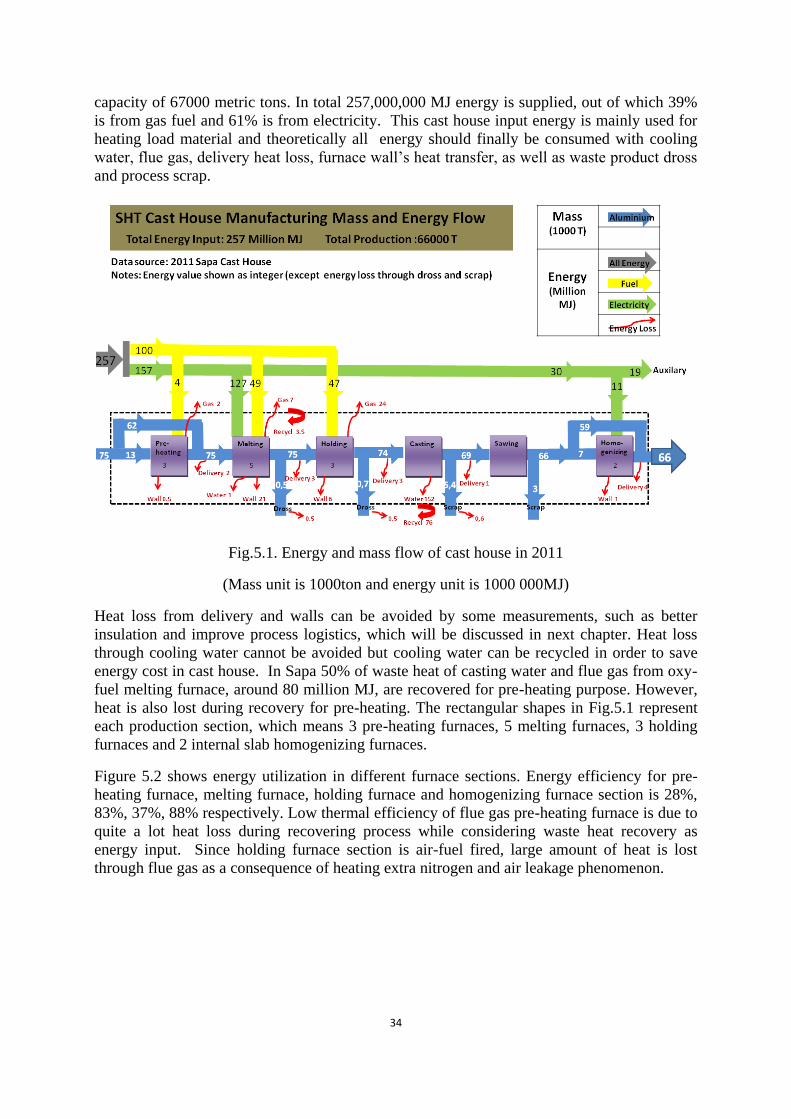
capacity of 67000 metric tons. In total 257,000,000 MJ energy is supplied, out of which 39%
is from gas fuel and 61% is from electricity. This cast house input energy is mainly used for
heating load material and theoretically all energy should finally be consumed with cooling
water, flue gas, delivery heat loss, furnace wall’s heat transfer, as well as waste product dross
and process scrap.
Fig.5.1. Energy and mass flow of cast house in 2011
(Mass unit is 1000ton and energy unit is 1000 000MJ)
Heat loss from delivery and walls can be avoided by some measurements, such as better
insulation and improve process logistics, which will be discussed in next chapter. Heat loss
through cooling water cannot be avoided but cooling water can be recycled in order to save
energy cost in cast house. In Sapa 50% of waste heat of casting water and flue gas from oxy-
fuel melting furnace, around 80 million MJ, are recovered for pre-heating purpose. However,
heat is also lost during recovery for pre-heating. The rectangular shapes in Fig.5.1 represent
each production section, which means 3 pre-heating furnaces, 5 melting furnaces, 3 holding
furnaces and 2 internal slab homogenizing furnaces.
Figure 5.2 shows energy utilization in different furnace sections. Energy efficiency for pre-
heating furnace, melting furnace, holding furnace and homogenizing furnace section is 28%,
83%, 37%, 88% respectively. Low thermal efficiency of flue gas pre-heating furnace is due to
quite a lot heat loss during recovering process while considering waste heat recovery as
energy input. Since holding furnace section is air-fuel fired, large amount of heat is lost
through flue gas as a consequence of heating extra nitrogen and air leakage phenomenon.
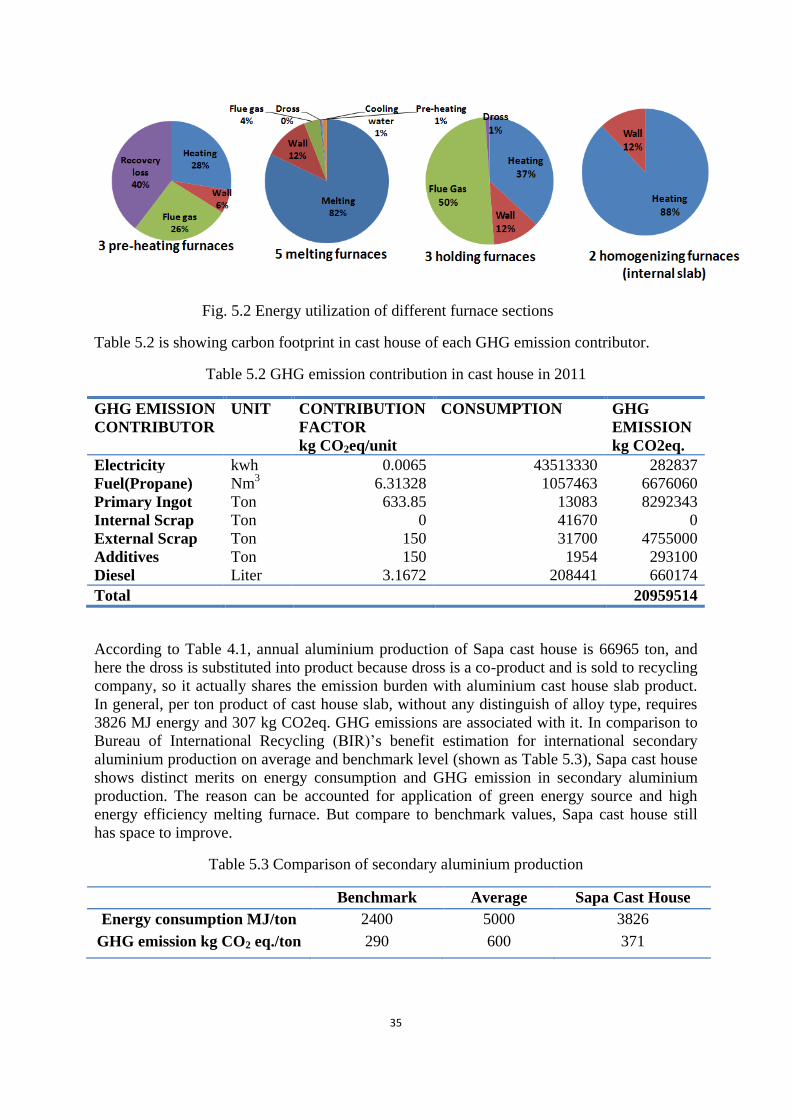
35
Fig. 5.2 Energy utilization of different furnace sections
Table 5.2 is showing carbon footprint in cast house of each GHG emission contributor.
Table 5.2 GHG emission contribution in cast house in 2011
GHG EMISSION
CONTRIBUTOR
UNIT CONTRIBUTION
FACTOR
kg CO2eq/unit
CONSUMPTION GHG
EMISSION
kg CO2eq.
Electricity kwh 0.0065 43513330 282837
Fuel(Propane) Nm3 6.31328 1057463 6676060
Primary Ingot Ton 633.85 13083 8292343
Internal Scrap Ton 0 41670 0
External Scrap Ton 150 31700 4755000
Additives Ton 150 1954 293100
Diesel Liter 3.1672 208441 660174
Total 20959514
According to Table 4.1, annual aluminium production of Sapa cast house is 66965 ton, and
here the dross is substituted into product because dross is a co-product and is sold to recycling
company, so it actually shares the emission burden with aluminium cast house slab product.
In general, per ton product of cast house slab, without any distinguish of alloy type, requires
3826 MJ energy and 307 kg CO2eq. GHG emissions are associated with it. In comparison to
Bureau of International Recycling (BIR)’s benefit estimation for international secondary
aluminium production on average and benchmark level (shown as Table 5.3), Sapa cast house
shows distinct merits on energy consumption and GHG emission in secondary aluminium
production. The reason can be accounted for application of green energy source and high
energy efficiency melting furnace. But compare to benchmark values, Sapa cast house still
has space to improve.
Table 5.3 Comparison of secondary aluminium production
Benchmark Average Sapa Cast House
Energy consumption MJ/ton 2400 5000 3826
GHG emission kg CO2 eq./ton 290 600 371

36
Figure 5.3 presents carbon footprint contribution from each contributor. It indicates that the
two highest GHG contributions are from primary ingot and propane, which is 65% and 26%
respectively. With this indication, the effects of raw material and furnace on energy
consumption and carbon footprint are going to be further discussed in the following chapter in
order to optimize product’s production process.
Fig.5.3 Contribution of GHG emission from different contributors
5.2 Effects on melting product’s energy consumption and carbon footprint
As is mentioned in section 4.2.7.2, four different melting products have been selected. They
are the product after melting furnace, and energy utilization of each melting product is listed
as Table 5.4
Table 5.4 Energy consumption of different melting product
PRODUCT AA4343 AA3003 AA3003
+Zn
AA3003
+Zn
AA4115 AA4015
FURNACE No. 0146
(OF)
0142
(El)
0144
(OF)
0142
(El)
0144
(OF)
0142
(El)
INPUT
Electricity/MJ 1563 44820 2258 74086 2337 68472
Fuel(propane)/MJ 41897 0 56626 0 71621 0
Pre-heating/MJ 977 0 959 0 1359 0
OUTPUT
Melting heat/MJ 26518 25268 39158 45538 51316 40987
Wall/MJ 6412 3465 9295 4337 9619 4219
Cooling water/MJ 4308 15709 1676 23796 1734 23153
Flue gas/MJ 6016 0 8012 0 10643 0
Dross/MJ 205 378 744 416 646 113
Energy distribution has been calculated, as presented in section 4.3, according to input and
output of melting furnaces shown in Figure 4.4 and Figure 4.6. The calculation results are
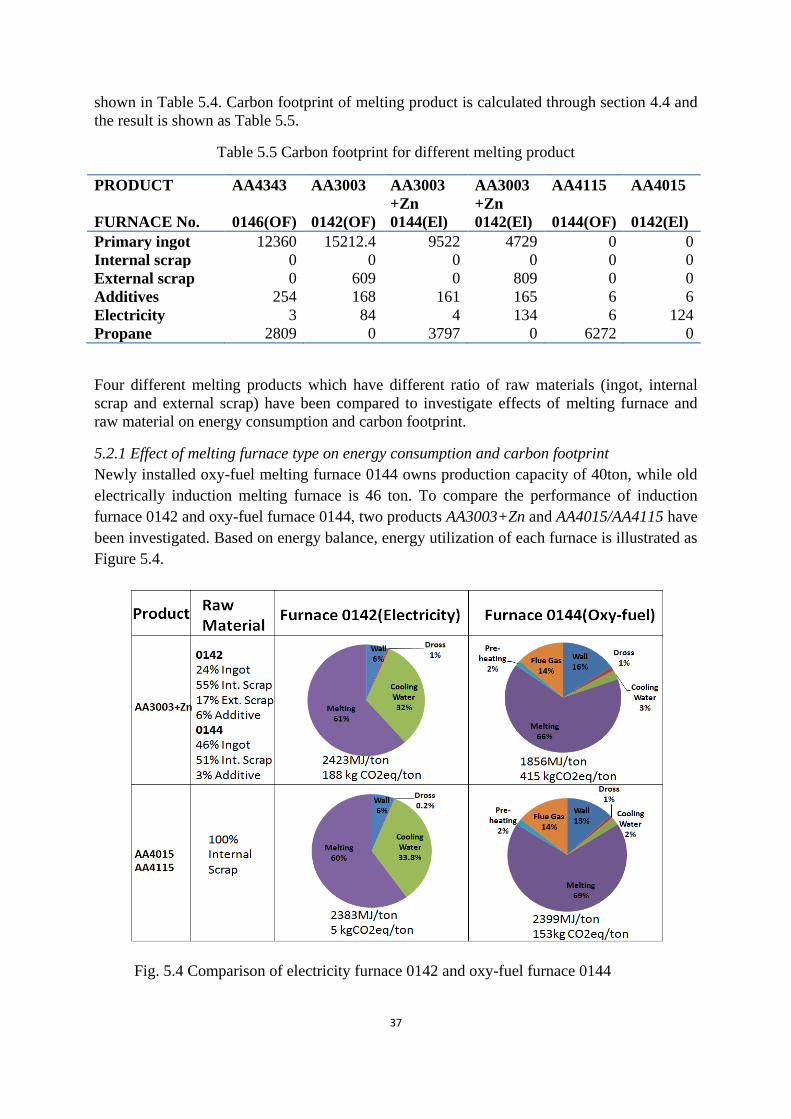
37
shown in Table 5.4. Carbon footprint of melting product is calculated through section 4.4 and
the result is shown as Table 5.5.
Table 5.5 Carbon footprint for different melting product
PRODUCT AA4343 AA3003 AA3003
+Zn
AA3003
+Zn
AA4115 AA4015
FURNACE No. 0146(OF) 0142(OF) 0144(El) 0142(El) 0144(OF) 0142(El)
Primary ingot 12360 15212.4 9522 4729 0 0
Internal scrap 0 0 0 0 0 0
External scrap 0 609 0 809 0 0
Additives 254 168 161 165 6 6
Electricity 3 84 4 134 6 124
Propane 2809 0 3797 0 6272 0
Four different melting products which have different ratio of raw materials (ingot, internal
scrap and external scrap) have been compared to investigate effects of melting furnace and
raw material on energy consumption and carbon footprint.
5.2.1 Effect of melting furnace type on energy consumption and carbon footprint
Newly installed oxy-fuel melting furnace 0144 owns production capacity of 40ton, while old
electrically induction melting furnace is 46 ton. To compare the performance of induction
furnace 0142 and oxy-fuel furnace 0144, two products AA3003+Zn and AA4015/AA4115 have
been investigated. Based on energy balance, energy utilization of each furnace is illustrated as
Figure 5.4.
Fig. 5.4 Comparison of electricity furnace 0142 and oxy-fuel furnace 0144
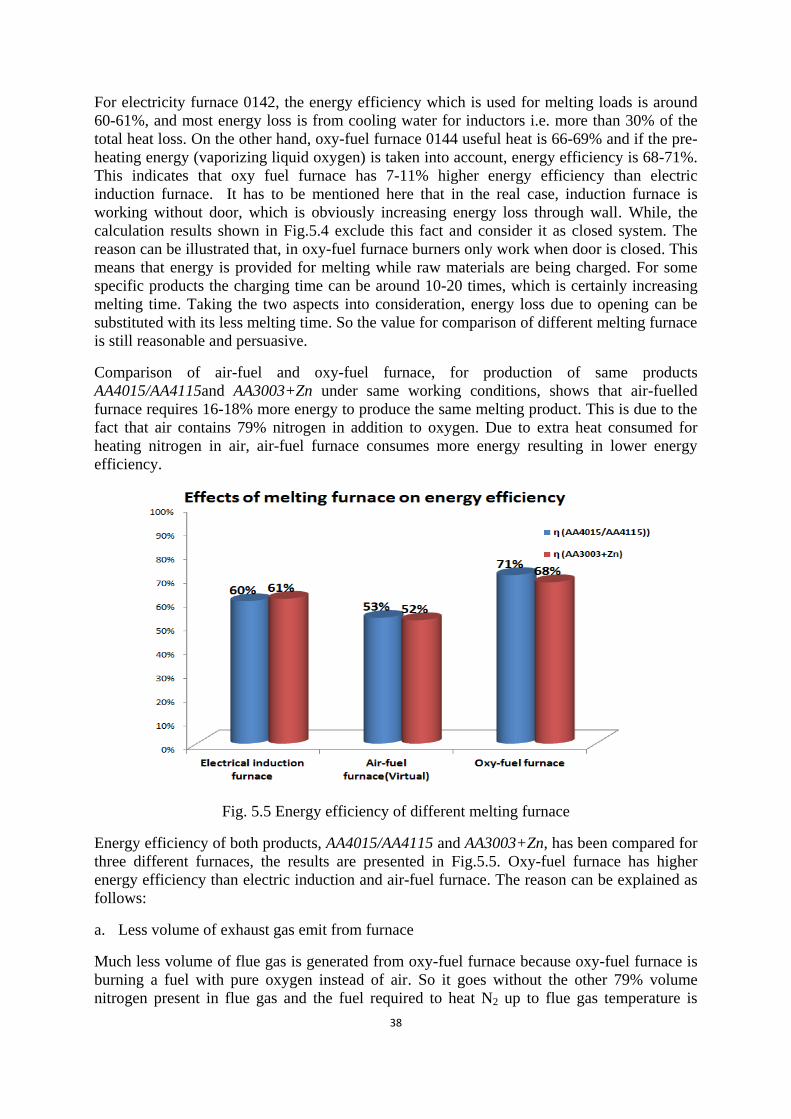
38
For electricity furnace 0142, the energy efficiency which is used for melting loads is around
60-61%, and most energy loss is from cooling water for inductors i.e. more than 30% of the
total heat loss. On the other hand, oxy-fuel furnace 0144 useful heat is 66-69% and if the pre-
heating energy (vaporizing liquid oxygen) is taken into account, energy efficiency is 68-71%.
This indicates that oxy fuel furnace has 7-11% higher energy efficiency than electric
induction furnace. It has to be mentioned here that in the real case, induction furnace is
working without door, which is obviously increasing energy loss through wall. While, the
calculation results shown in Fig.5.4 exclude this fact and consider it as closed system. The
reason can be illustrated that, in oxy-fuel furnace burners only work when door is closed. This
means that energy is provided for melting while raw materials are being charged. For some
specific products the charging time can be around 10-20 times, which is certainly increasing
melting time. Taking the two aspects into consideration, energy loss due to opening can be
substituted with its less melting time. So the value for comparison of different melting furnace
is still reasonable and persuasive.
Comparison of air-fuel and oxy-fuel furnace, for production of same products
AA4015/AA4115and AA3003+Zn under same working conditions, shows that air-fuelled
furnace requires 16-18% more energy to produce the same melting product. This is due to the
fact that air contains 79% nitrogen in addition to oxygen. Due to extra heat consumed for
heating nitrogen in air, air-fuel furnace consumes more energy resulting in lower energy
efficiency.
Fig. 5.5 Energy efficiency of different melting furnace
Energy efficiency of both products, AA4015/AA4115 and AA3003+Zn, has been compared for
three different furnaces, the results are presented in Fig.5.5. Oxy-fuel furnace has higher
energy efficiency than electric induction and air-fuel furnace. The reason can be explained as
follows:
a. Less volume of exhaust gas emit from furnace
Much less volume of flue gas is generated from oxy-fuel furnace because oxy-fuel furnace is
burning a fuel with pure oxygen instead of air. So it goes without the other 79% volume
nitrogen present in flue gas and the fuel required to heat N2 up to flue gas temperature is
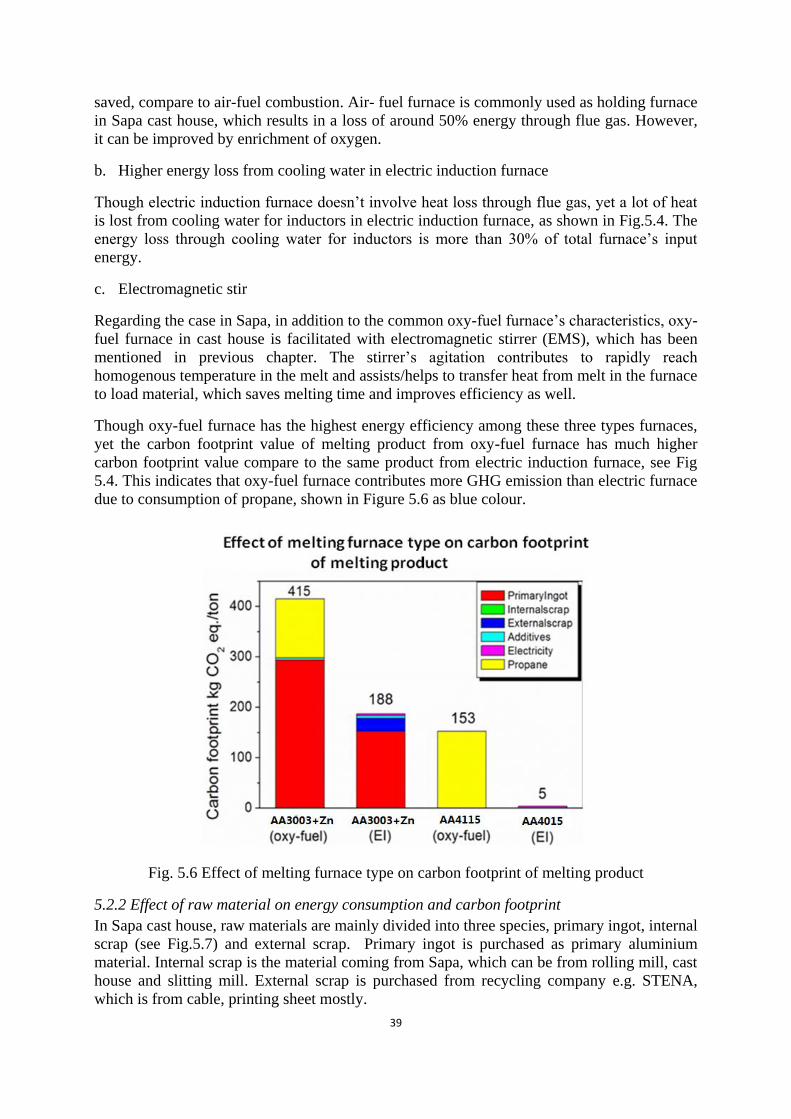
39
saved, compare to air-fuel combustion. Air- fuel furnace is commonly used as holding furnace
in Sapa cast house, which results in a loss of around 50% energy through flue gas. However,
it can be improved by enrichment of oxygen.
b. Higher energy loss from cooling water in electric induction furnace
Though electric induction furnace doesn’t involve heat loss through flue gas, yet a lot of heat
is lost from cooling water for inductors in electric induction furnace, as shown in Fig.5.4. The
energy loss through cooling water for inductors is more than 30% of total furnace’s input
energy.
c. Electromagnetic stir
Regarding the case in Sapa, in addition to the common oxy-fuel furnace’s characteristics, oxy-
fuel furnace in cast house is facilitated with electromagnetic stirrer (EMS), which has been
mentioned in previous chapter. The stirrer’s agitation contributes to rapidly reach
homogenous temperature in the melt and assists/helps to transfer heat from melt in the furnace
to load material, which saves melting time and improves efficiency as well.
Though oxy-fuel furnace has the highest energy efficiency among these three types furnaces,
yet the carbon footprint value of melting product from oxy-fuel furnace has much higher
carbon footprint value compare to the same product from electric induction furnace, see Fig
5.4. This indicates that oxy-fuel furnace contributes more GHG emission than electric furnace
due to consumption of propane, shown in Figure 5.6 as blue colour.
Fig. 5.6 Effect of melting furnace type on carbon footprint of melting product
5.2.2 Effect of raw material on energy consumption and carbon footprint
In Sapa cast house, raw materials are mainly divided into three species, primary ingot, internal
scrap (see Fig.5.7) and external scrap. Primary ingot is purchased as primary aluminium
material. Internal scrap is the material coming from Sapa, which can be from rolling mill, cast
house and slitting mill. External scrap is purchased from recycling company e.g. STENA,
which is from cable, printing sheet mostly.

40
Fig. 5.7 Different raw material, left is internal scrap, right is primary ingot
In order to investigate effects of raw material on energy consumption and carbon footprint,
four Sapa cast house melting products have been tracked on-site. Four melting products
including high primary ingot percentage product AA4343, as well as 100% internal scrap
product AA4015/AA4115.
Table.5.5 Comparison of effects with different raw material
PRODUCT RAW
MATERIAL
FURNACE
No.
ENERGY
(MJ/ton)
GHG
(kg CO2eq.)
EFFICIENCY
AA4343 92%Ingot
8%Additives(Si)
0146(OF) 2071 728 63
AA3003 82% Ingot
14% External Scrap
4%Additive
0142(El) 1552 549 56
AA3003+Zn
AA3003+Zn
46% Ingot
51% Internal Scrap
3%Additives
0144(OF) 2423 415 61
24%Ingot
55% Internal Scrap
17% External Scrap
4% Additives
0142(El) 1856 188 68
AA4115
AA4015
100%Internal Scrap 0144(OF) 2399 153 71
100%Internal Scrap 0142(El) 2383 5 60
Table 5.5 presents energy consumption and carbon footprint of per ton product, as well as
energy efficiency of different furnaces. The highest energy efficiency is of oxy-fuel furnace
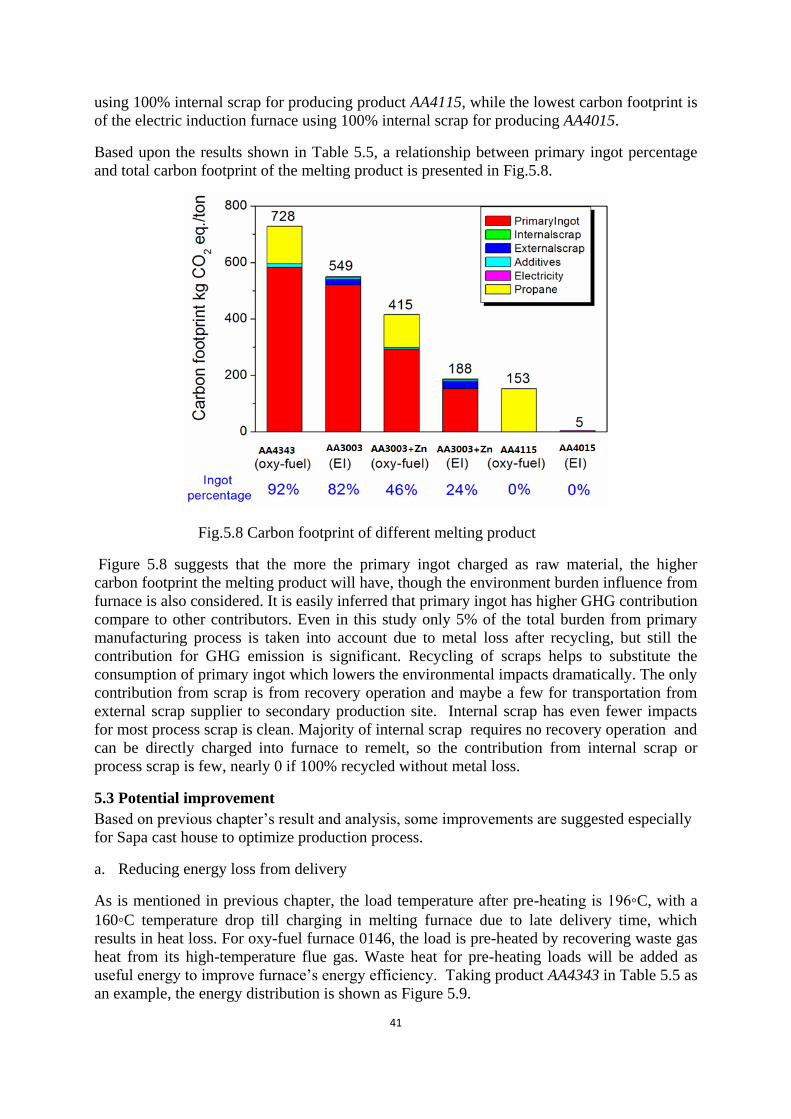
41
using 100% internal scrap for producing product AA4115, while the lowest carbon footprint is
of the electric induction furnace using 100% internal scrap for producing AA4015.
Based upon the results shown in Table 5.5, a relationship between primary ingot percentage
and total carbon footprint of the melting product is presented in Fig.5.8.
Fig.5.8 Carbon footprint of different melting product
Figure 5.8 suggests that the more the primary ingot charged as raw material, the higher
carbon footprint the melting product will have, though the environment burden influence from
furnace is also considered. It is easily inferred that primary ingot has higher GHG contribution
compare to other contributors. Even in this study only 5% of the total burden from primary
manufacturing process is taken into account due to metal loss after recycling, but still the
contribution for GHG emission is significant. Recycling of scraps helps to substitute the
consumption of primary ingot which lowers the environmental impacts dramatically. The only
contribution from scrap is from recovery operation and maybe a few for transportation from
external scrap supplier to secondary production site. Internal scrap has even fewer impacts
for most process scrap is clean. Majority of internal scrap requires no recovery operation and
can be directly charged into furnace to remelt, so the contribution from internal scrap or
process scrap is few, nearly 0 if 100% recycled without metal loss.
5.3 Potential improvement
Based on previous chapter’s result and analysis, some improvements are suggested especially
for Sapa cast house to optimize production process.
a. Reducing energy loss from delivery
As is mentioned in previous chapter, the load temperature after pre-heating is 196◦C, with a
160◦C temperature drop till charging in melting furnace due to late delivery time, which
results in heat loss. For oxy-fuel furnace 0146, the load is pre-heated by recovering waste gas
heat from its high-temperature flue gas. Waste heat for pre-heating loads will be added as
useful energy to improve furnace’s energy efficiency. Taking product AA4343 in Table 5.5 as
an example, the energy distribution is shown as Figure 5.9.
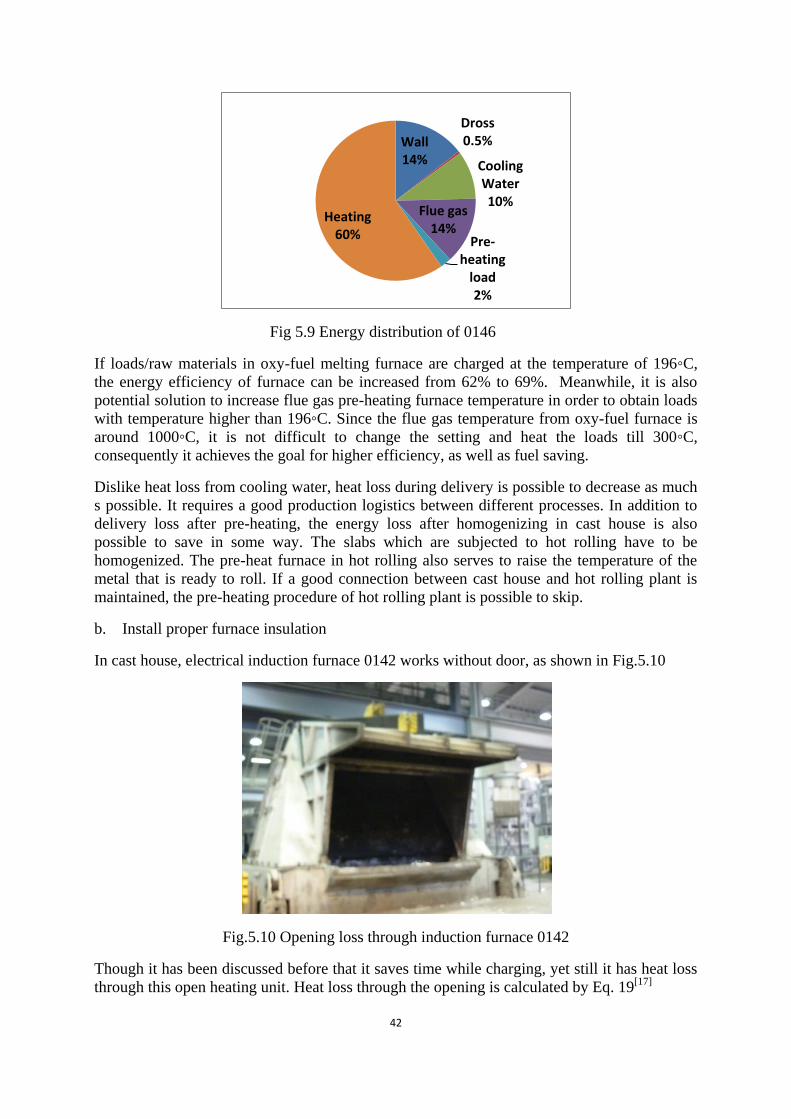
42
Fig 5.9 Energy distribution of 0146
If loads/raw materials in oxy-fuel melting furnace are charged at the temperature of 196◦C,
the energy efficiency of furnace can be increased from 62% to 69%. Meanwhile, it is also
potential solution to increase flue gas pre-heating furnace temperature in order to obtain loads
with temperature higher than 196◦C. Since the flue gas temperature from oxy-fuel furnace is
around 1000◦C, it is not difficult to change the setting and heat the loads till 300◦C,
consequently it achieves the goal for higher efficiency, as well as fuel saving.
Dislike heat loss from cooling water, heat loss during delivery is possible to decrease as much
s possible. It requires a good production logistics between different processes. In addition to
delivery loss after pre-heating, the energy loss after homogenizing in cast house is also
possible to save in some way. The slabs which are subjected to hot rolling have to be
homogenized. The pre-heat furnace in hot rolling also serves to raise the temperature of the
metal that is ready to roll. If a good connection between cast house and hot rolling plant is
maintained, the pre-heating procedure of hot rolling plant is possible to skip.
b. Install proper furnace insulation
In cast house, electrical induction furnace 0142 works without door, as shown in Fig.5.10
Fig.5.10 Opening loss through induction furnace 0142
Though it has been discussed before that it saves time while charging, yet still it has heat loss
through this open heating unit. Heat loss through the opening is calculated by Eq. 19[17]
Wall 14%
Dross 0.5%
Cooling Water 10%
Flue gas 14%
Pre-heating
load 2%
Heating 60%
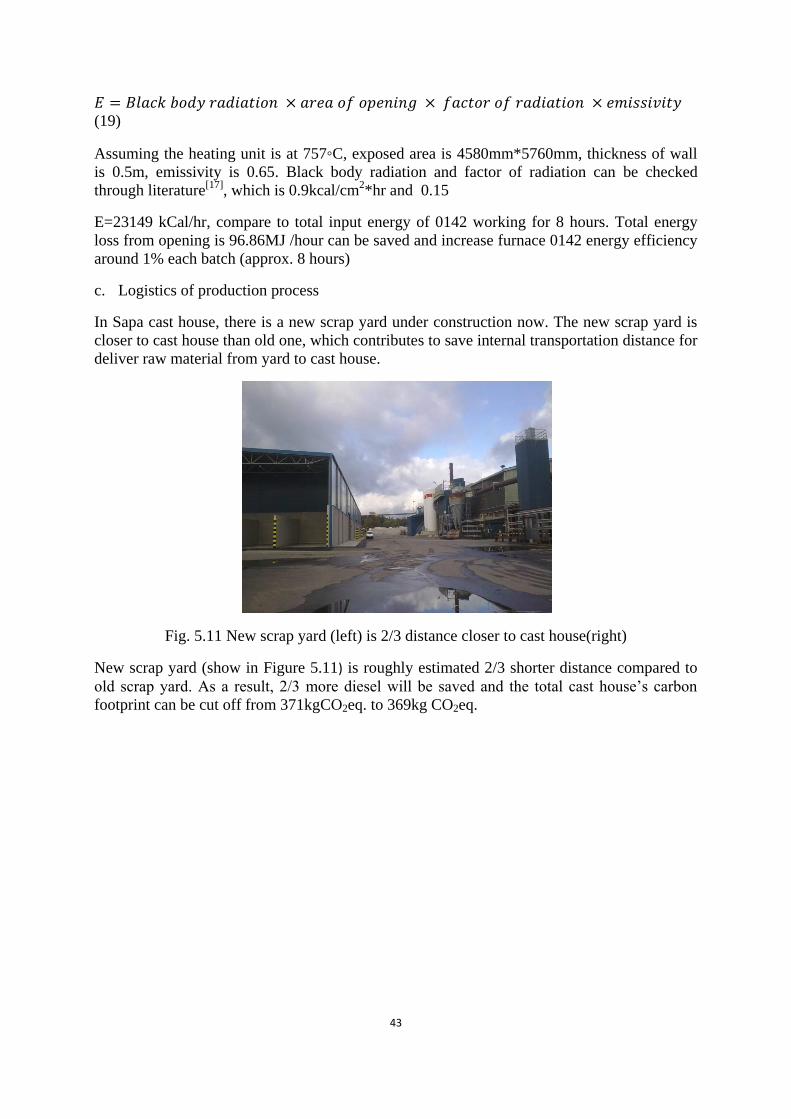
43
(19)
Assuming the heating unit is at 757◦C, exposed area is 4580mm*5760mm, thickness of wall
is 0.5m, emissivity is 0.65. Black body radiation and factor of radiation can be checked
through literature[17]
, which is 0.9kcal/cm2*hr and 0.15
E=23149 kCal/hr, compare to total input energy of 0142 working for 8 hours. Total energy
loss from opening is 96.86MJ /hour can be saved and increase furnace 0142 energy efficiency
around 1% each batch (approx. 8 hours)
c. Logistics of production process
In Sapa cast house, there is a new scrap yard under construction now. The new scrap yard is
closer to cast house than old one, which contributes to save internal transportation distance for
deliver raw material from yard to cast house.
Fig. 5.11 New scrap yard (left) is 2/3 distance closer to cast house(right)
New scrap yard (show in Figure 5.11) is roughly estimated 2/3 shorter distance compared to
old scrap yard. As a result, 2/3 more diesel will be saved and the total cast house’s carbon
footprint can be cut off from 371kgCO2eq. to 369kg CO2eq.
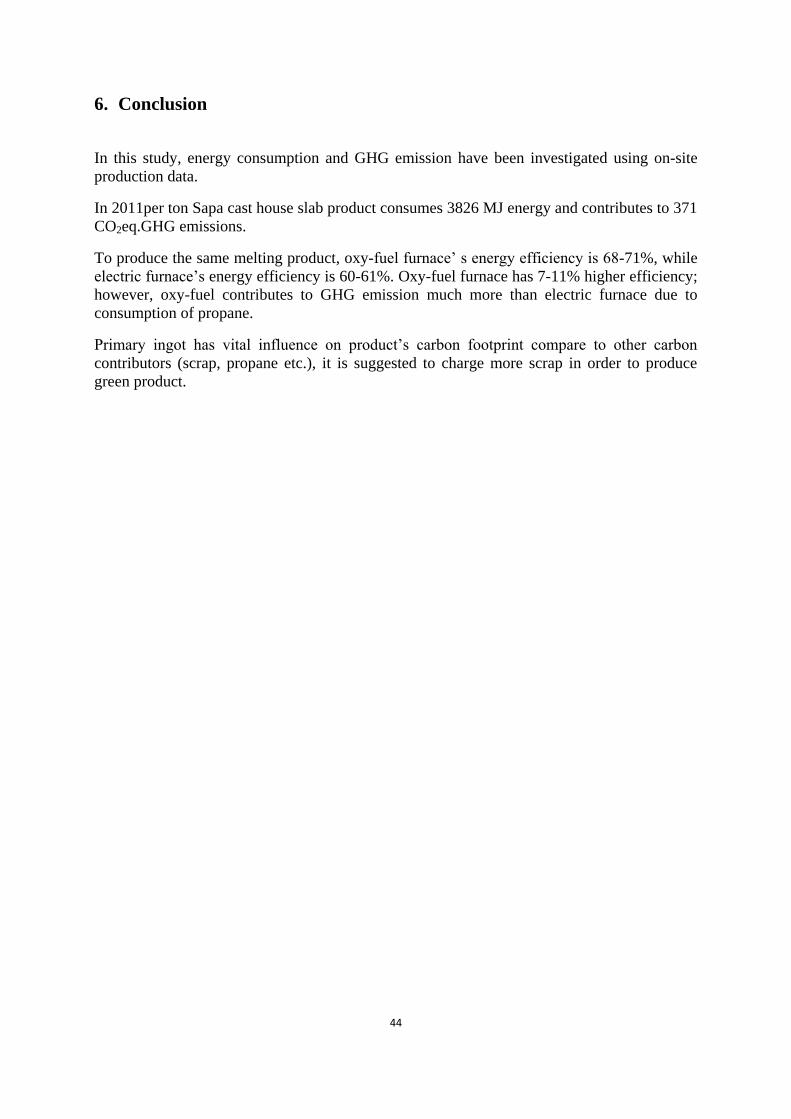
44
6. Conclusion
In this study, energy consumption and GHG emission have been investigated using on-site
production data.
In 2011per ton Sapa cast house slab product consumes 3826 MJ energy and contributes to 371
CO2eq.GHG emissions.
To produce the same melting product, oxy-fuel furnace’ s energy efficiency is 68-71%, while
electric furnace’s energy efficiency is 60-61%. Oxy-fuel furnace has 7-11% higher efficiency;
however, oxy-fuel contributes to GHG emission much more than electric furnace due to
consumption of propane.
Primary ingot has vital influence on product’s carbon footprint compare to other carbon
contributors (scrap, propane etc.), it is suggested to charge more scrap in order to produce
green product.
45
7. Reference
[1] W.D. Menzie, JJ Barry, et,al.. The global flow of aluminum from 2006 through 2025: U.S.
Geological Survey Open-File Report 2010–1256.
[2] Report on the environmental benefits of recycling, Bureau of International Recycling,
2008
[3] Road map from Europe and North America, Workshop on Aluminum Recycling, 13-15th,
2010, Trondheim, Norway
[4] T.X. Li et, al., Performance of secondary aluminum melting: Thermodynamic analysis and
plant-site experiments, Energy 31 (2006), 1769-1779
[5] Aluminum: The Element of Sustainability, A North American Aluminum Industry
Sustainability Report, the Aluminum Association, 2011
[6] Life Cycle Inventory data for aluminum production and transformation processes in
Europe , Environmental Profile Report for the European Aluminum Industry , 2008
[7] Intergovernmental Climate Change (IPCC), 2007
[8] Jorgen Furu et,al., A comparison of air-fuel and Low-temperature Oxyfuel Burners for
Aluminum Heating and Melting, Proceedings of the 12th International Conference on
Aluminum Alloys
[9] J.V. Scheele, M. Gartz et,al.. Flameless oxyfuel combustion for increased production and
reduced CO2 and NOx emissions, Stahl und eisen 128(2008),vol.7.
[10] ABB webpage, available at:
http://www05.abb.com/global/scot/scot227.nsf/veritydisplay/1f0b2aef465848acc1257408
0039c168/$file/3bse%20052884%20lr.pdf
[11] I.Barin, Thermochemical data of pure substances
[12] R.Stephen, Turns, An Introduction to Combustion: Concepts and Applications, Appendix
A, p.632
[13] http://gryphon.environdec.com/data/files/6/7310/epd21.pdf
[14] http://archive.defra.gov.uk/environment/business/reporting/pdf/110819-guidelines-ghg-
conversion-factors.pdf
[15] Environmental Profile Report for the European Aluminum Industry, Life Cycle
Inventory data for aluminum production and transformation processes in Europe,
European Aluminum Association, 2008
[16] Life cycle assessment of aluminum: Inventory data for the worldwide primary aluminum
industry, International Aluminum Association, 2003
[17]Available at web page: http://www.enercon.gov.pk/images/pdf/4ch2.pdf