carbon footprint analyse - pipelife nederland rapport... · 2-emissions co 2 compensation ... page...
TRANSCRIPT

20 DECEMBER 2011 REF.NR.: 11.A0449/1
YEAR 2, NR. 1 Carbon Footprint Analysis 2011 H1
Contents
Management statement
Organization
Reporting organization
Responsible person
Organizational boundaries
ISO 14064 statement
Verification statement
Carbon Footprint Analysis
Basis of analysis
Measurement results and explanation
Reported period
Scope 1: Direct CO2 -emissions
Statement of CO2 sources and sinks omitted
CO2 emissions from burning biomass
Scope 2: Indirect CO2-emissions
Indirect CO2 emissions from purchased energy
Influence measurement inaccuracies and uncertainties
Scope 3: Other indirect CO2-emissions
CO2 compensation
Progress against reference year
Historical base year
Adjustments to historical base year
Normalization measurements
Calculation Models
Quantification Methods
Explanation for changes in the quantification methods
Reduction targets
Annex 1 CO2-emissions 2011 H1 scope 1 and 2

Management statement
Page 2 Carbon Footprint
In the last years it has become clear that energy resources are not inexhaustible and that the us-age affects our environment. We see it as our duty to deal with our environment in a sustainable way. In addition to creating good and sustainable products, we also take into account our envi-ronment and our employees, while a motivated organization is the key to sustainable success.
We are convinced that we find the right balance between People, Planet and Profit with a good CSR policy. Therefore we are working for many years according to this policy. For example, we have established our Carbon Footprint and we are busy to realize our reduction targets in the area of energy consumption and CO2 emissions. We are also very active in recycling and redu-cing the material consumption in our products. Also by an active Health, Safety, Environmental and Energy policy we are improving our work environment.
Sustainability is a joint effort of our employees, customers, business partners, suppliers and other stakeholders. Together with these partners, we are convinced that we can shape our policy in the future and continuing to play a leading role within our industry.
Paul Ummels
Managing Director
Pipelife Nederland B.V.
Paul Ummels
Managing Director Pipelife Nederland B.V.

Reporting organization
Pipelife Nederland B.V. is located in Enkhuizen. Pipelife Nederland B.V. is part of Pipelife Interna-tional GmbH, an international manufacturer of plastic piping systems and fittings and one of the market leaders in Europe. Pipelife was established in 1947, today one of the oldest plastic pipe producers worldwide. Products include sewage, inhouse: electro, water, gas, drainage, cable pipes and eco systems.
Pipelife Nederland has approximately 200 employees spread over eight locations: headquarters and production site in Enkhuizen and seven local sales branches and two in-store warehouses with cooperating suppliers. Part of Pipelife Nederland B.V. Is Twebotube B.V., located in Enschede.
Pipelife International GmbH is a joint venture of the Solvay Group (Chemistry) and Wienerberger (ceramic industry) and is located in 27 countries, with headquarters in Vienna, Austria. 2,350 em-ployees worldwide are working on 26 production sites.
Summary of the activities:
Development, production and sale of plastic piping systems and fittings;
Wholesale trade services of synthetic materials and chemical products.
Organization
Page 3 Carbon Footprint
Responsible person The person statutorily responsible for the reporting organization is mr. P.L.B. Ummels, MD Pipelife Nederland B.V.
Organizational boundaries The organizational boundaries of Pipelife Nederland B.V. are determined in the context of CO2 (carbon dioxide)-consciousness in accordance with the principle of the operational sphere of influ-ence of the certifying company.
Within the GHG protocol, this is described as the 'operational boundary'. In practice, this means that when activities are executed under the auspices of Pipelife Nederland B.V., the accountability for the CO2-production is taken: the own organization has control of this.
Based on the lateral purchase analysis of the CO2 -performance ladder, it is determined that Pipelife Deutschland GmbH & CO. KG is added within the organizational boundary of Pipelife Nederland B.V.
The organizational boundaries for this inventory includes:
Pipelife Nederland B.V.;
Twebotube B.V.;
Pipelife Deutschland GmbH & CO. KG,.
The rationale for this boundary is listed in the boundary report (doc. nr 11.A0138b).
ISO 14064 statement
With this, Pipelife Nederland B.V. states that this report for the “CO2-bewust” certificate is prepared in accordance with the guidelines of NEN-ISO 14064, version March 2006.
Verification state-
ment With this, Pipelife Nederland B.V. states that this report has been verified by <instell.> and that on <date> has come to the opinion that during the verification work no evidence was found that:
the inventory had not been designed according to the needs and requirements from the ISO 14064-1, the GHG Protocol, the CO2-prestatieladder Manual
said CO2 inventory has ma-terial misstatements, de-rogatory to the materiality requirement of 5%.
Verification state-
ment With this, Pipelife Nederland B.V. states that this report has been verified by KEMA Emis-sion Verification Services B.V. and that on 19th December 2011 has come to the opinion that during the verification work no evidence was found that:
the inventory had not been
designed according to the needs and requirements from the ISO 14064-1, the GHG Protocol, the CO2-prestatieladder Manual
said CO2 inventory has ma-
terial misstatements, de-rogatory to the materiality requirement of 5%.

YEAR 2, NR. 1 Page 4
Carbon Footprint Analysis
Basis of analysis
CO2-emissions and absorptions by activities of the organization have been identified based on the established operational limits. At the identification of emissions a distinction has been made be-tween three sources of emission (known as scopes) into two categories: direct emissions and in-direct emissions. This is in line with the Greenhouse Gas (GHG) Protocol.
Scope 1 covers direct emissions under control, and controlled by, the organization. Exam-
ples include the combustion of fuels in machinery, business transport with vehicles owned by the reporting organization and emissions of refrigeration and air conditioning systems;
Scope 2 includes indirect emissions from purchased electricity, steam or heat;
Scope 3 includes other indirect emissions from sources such as commuter travel, produc-
tion of purchased materials and outsourced activities such as freight.
This carbon footprint analysis includes the CO2-emissions (one of the six greenhouse gases) of Pipelife Nederland BV, in scope 1 and 2 of the first half of 2011. The CO2 emission is analyzed in accordance with the “CO2 prestatieladder”, manual 2.0 june 2011.
Measurement results and explanation
Reported period Pipelife Nederland B.V. has synchronized its carbon footprint reporting period with its fiscal year. The fiscal year for Pipelife Nederland B.V. runs from January 1 to December 31. The reported period is the first half of 2011.

YEAR 2, NR. 1 Page 5
Scope 1: Direct CO2-emissions
THE DIRECT CO2 EMISSION IS MEASURED AND CALCULATED AS 1.163,8 TONNES CO2
Fuel use own car fleet (business car travel) In the first half of 2011 33%, 385,9 tonnes of the CO2 emissions is assigned to the fuel consump-tion of the fleet with 55 leased cars. In 2011 H1 the leasing company has reported an usage of 117.377 litres diesel and 4.393 litres of petrol and 867 litres LPG and 18.733 fleet kilometres.
Stationairy combustion equipment 574,7 tonnes CO2 (314.927 m3 ,49% of the total direct emission) is the result of consumption of natural gas. The natural gas is used for heating of the locations. 314.927 m3 is used in stationary combustion equipment, 81% of the consumption is in Enkhuizen.
Gasses In the first half of 2011 54,2 tonnes of CO2 emission is caused by the usage of the gasses CO2 gasses, Acetylene, Propane, Butane and Sagox 18 for the production processes in the Nether-lands and Germany.
CO2-emissions from burning biomass The combustion of biomass did not occur at Pipelife Nederland B.V.
Statement of CO2 sources and sinks omitted All identified sources and sinks of CO2 are included in the report. Storage of CO2 does not occur; there are no sinks.
Leakage of cooling gasses In the first half of 2011 149,0 tonnes of CO2 emission is caused by the consumption of cooling gasses in the production processes in Germany and cooling and freezing systems. These sys-tems for storage and transportable air conditioning-units are regarded as a closed system. There-fore only CO2-causing emissions of consumption are calculated.
-
100,0
200,0
300,0
400,0
500,0
600,0
Stationary combustion equipment
Gasses Airco refrigerants Own car fleet
574,7
54,2
149,0
385,9
Direct CO2 emission
Ton
CO
2
Scope 1 sources
Ton
CO
2To
n C
O2

YEAR 2, NR. 1 Page 6
Scope 2: Indirect CO2-emissions
INDIRECT CO2-EMISSIONS MEASURED AND CALCULATED ARE 6.904,0 TONNES CO2
Electricity purchased 98,1 % of the indirect CO2 emis-sion is caused by consumption of the repurchased electricity.
In the reported period, the electric-ity consumption was 14.887.524 kWh, this is 6.773,8 ton CO2 emis-sion. Under the terms of the CO2–prestatieladder, the electricity is registered and calculated with a grey label performance.
Based on the energy management system of Pipelife Nederland the extrusion processes caused 54,5% of the consumption of electricity, second Injection Molding caused 23,8% of the usage. Lighting caused 4,2% of the consumption.
Business air travel In the first half of 2011 employees in the Netherlands and Germany made flights for business purposes. 16% of the flights concerned flight distances between 0 – 700 km, 34% of the flights concerned flight distances between 700 – 2500 km and 50% of the flights concerned flight dis-tances more than 2500 km. The air travel caused 124,5 ton CO2, 1,8% of the indirectly CO2 emis-sions.
Heat Delivery Twebotube in Enschede reported in the first half of 2011 an usage of 118 GJ for heating (1,3 ton CO2).
Personal cars for business travel In the first half of 2011 several employees used their private car for business purposes and de-clared the mileage. The total mileage declarations by private car were 20.955 km in the reported period. This leaded to 4,4 ton CO2, 0,1% of the indirectly CO2 emissions.
54,5%
23,8%
2,0%
3,1%9,5%
0,0% 4,2%
1,2%0,4%
0,4% 0,3%
0,6%
Type of consumption - electricity
Extrusion
Injection Molding
Forming
Crushing
Other production
ICT
Lighting
Climate control
Kitchen
Other
Stanfriesweg
Zoutketen
-
1.000,0
2.000,0
3.000,0
4.000,0
5.000,0
6.000,0
7.000,0
Purchased electricity Heat delivery Personal cars for business travel
Business air travel
6.773,8
1,3 4,4 124,5
Indirect CO2 emission
To
n C
O2
Scope 2 sources
To
n C
O2
To
n C
O2

YEAR 2, NR. 1 Page 7
SCOPE 1:
The fuel data of stationary combustion equipment for heating is provided by the energy suppliers of the locations and controlled with the internal measurements. For the location Flevolaan Pipe-life has a joint heating installation with the neighbour company Renolit. Renolit has specified the information for natural gas on the location Flevolaan. The data of gasses are provided by the suppliers. These information is deemed as sufficiently reliable.
The fleet management data is provided by the fuel suppliers of the leasing companies who man-age the fuel passes linked to the vehicles and by declarations of the fuel in fleet cars by employ-ees. Because the mileage registration is less accurate, since not every employee carefully keeps track of the mileage by registering the mileage at the gas station, the CO2 emission is based on the fuel data if present.
Influence of measurement inaccuracies and uncertainties in
scope 1 and 2
The foregoing information shows that the vast majority of CO2 emission is caused by use of fuel in the stationary equipments (574,7 ton of CO2) and the electricity consumption (6.773,8 ton of CO2). Therefore, it is important to accurately capture these emissions.
Scope 3: Other indirect CO2-emissions
CO2-compensation
There is no compensation for CO2 emissions. Available resources are used to make improve-ments within the production processes in the framework of the CO2-emission.
SCOPE 2:
The consumption data of the electricity is registered from billing information received from the energy suppliers of the different locations. Renolit has specified the information for electricity on the location Flevolaan. This information is considered as sufficiently reliable. It should be noted that most of the energy is used in the production processes.
The emission data of travel by private cars for business purpose is collected by employee decla-rations. The fuel type and engine classification of the applicable private cars are not registered.
De flight data for business purpose is collected by information from the travel organisation.
A complete emission inventory for scope 3 is currently outside the CO2 inventory. This report does therefore not include such an inventory.

YEAR 2, NR. 1 Page 8
Adjustments to historical year
For the first half of 2011 there are no adjustments to the base year.
Historical base year
The initial measurements in the context of the ISO 14064 standard have been done by Pipelife Nederland B.V. for the calendar year 2010. This year therefore serves as base year against which an increase or decrease in CO2 emissions is established.
Progress against reference year
Normalization measurements
The size of the CO2 emissions has a clear correlation with the scale of the activities carried out by the organization. For the comparison of the emissions in the reference year and future reported periods, standards are determined to normalize measurement results. For Pipelife, Kg product produced is the standard to scale the business activities. Based on the kg product produced the reported measurement results will be normalized.
In scope 1 the CO2 emissions par kg product produced are significantly lower in the first half of 2011 than in the base year 2010. This is due to an increase in the kg product produced and simul-taneously a small decrease in CO2 emissions. The reduction of CO2 emissions is due to a lower usage of fuel for stationairy combustion equipment and a significant reduction of cooling gasses. The litres of fuel for the own car park increased with 3,3%.
In scope 2 the CO2 emissions par kg product produced in the first half of 2011 is also lower than in the base year 2010. The reduction is less than the decrease in scope 1 because the increase in the kg product produced is accompanied by a rise in CO2 emissions in scope 2. This increase is caused by the electricity consumption in the first half of 2011, 5,4% higher than in the base year 2010. Also air travel has increased because the number of passenger by long haul flights in-creased with 30% in relation to the long haul flights in 2010.
0,0
20,0
40,0
60,0
80,0
100,0
120,0
140,0
2010
2011-H1
YEAR 2, NR. 1 Page 9
Calculation models
Quantification methods
The quantification of raw materials to CO2 emissions is always calculated by registered volume units of the fuels used if present. The conversion of volume to emission values is straightforward and provides the most reliable comparison. In those situations where no volume units of fuel were available, the most reliable information available was used.
Electricity consumption is either taken based on calibrated meters and/or based on the invoices of the energy company. By applicable law, this is the most reliable source of information that is available.
Explanation for changes in the quantification methods
The measurement in 2011 H1 is the second measurement in the framework of the ISO 14064 standard. No adjustments in the quantitative methods are made against to the historical year.

Reduction targets
Based on this Carbon Footprint and the Energy Management System Pipelife defined meas-ures to reduce its CO2 emissions for the period 2010-2016 for scope 1 and 2.
The first target is to reduce the direct emissions per Kg product produced by reducing our loca-tions, replacements of own fleet by cars with a tag A or B and improve the involvement of our employees. Next to these reduction targets several investigations in the Netherlands and Ger-many are this moment carried out, for example in isolation improvements in production, Im-provement of heating and lighting in buildings. The outcome of these investigations is expected in 2012.
Reduction of the indirect emissions (scope 2) will be carried out by reducing the Electricity us-age in the production, replacement of lighting (sensoring) and office equipment and the per-sonal involvement of employees. The replacement of diesel forklifts by electric forklifts will have an increase the Electricity.
Because of longterm contracts for electricity Pipelife will first start to use green power for the distribution locations only. Possibilities for usage of green power on other locations are investi-gated. Currently this will lead to an reduction of 118,3 tonnes of CO2.
Based on the current quantitative information Pipelife wants to reduce its CO2-emissions for the period 2010 till 2016 with 4% per Kg product produced. The Kg product produced is the stan-dardization factor to make comparison possible between the reference period and the progress reports.
Page 10 YEAR 2, NR. 1
Nr. Reduction target CO2
Total
reduction
2010-2016
(Kg product
produced) (%)
Reduction
(Tonnes CO2)
(Kg product
produced)
1 Energy usage locations 28,32 4% 52,6 27,1
2 Fuel consumption fleet 16,87 2% 11,6 16,6
Replacement own fleet A/B tag
3 Personal involvement 15,62 1% 6,7 15,5
For example New driving
100,0 3% 71,0 97,3
Purchased electricity 285 3% 408,9 272,5
1 Energy usage locations 26,4
2 Usage production proces 191,7
3 Lighting 61,7
4 Office equipment 6,9
5 Personal involvement 1% 122,3
6 Green Power* 1% 118,3
Heat delivery 0,1 0% - 0,1
Personal cars for business travel 0,2 0% - 0,2
Business air travel 4,9 0% - 4,9
100,0 4% 527,2 95,8
100,0 4% 598,2 96,0
CO2-
emission
2010 CO2-emission 2016
Index CO2-emission scope 1
Index CO2-emission scope 2
Index CO2-emission scope 1 and 2
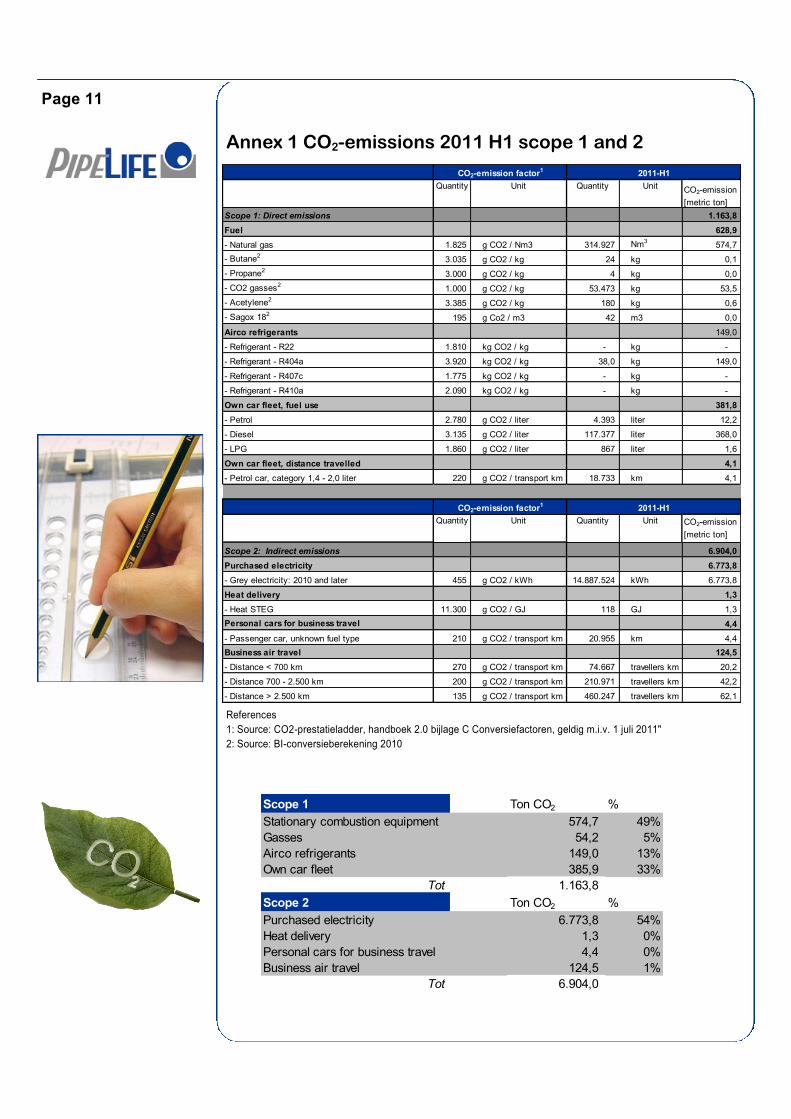
Annex 1 CO2-emissions 2011 H1 scope 1 and 2
Page 11
References
1: Source: CO2-prestatieladder, handboek 2.0 bijlage C Conversiefactoren, geldig m.i.v. 1 juli 2011"
2: Source: BI-conversieberekening 2010
Scope 1 Ton CO2 %
Stationary combustion equipment 574,7 49%
Gasses 54,2 5%
Airco refrigerants 149,0 13%
Own car fleet 385,9 33%
Tot 1.163,8
Scope 2 Ton CO2 %
Purchased electricity 6.773,8 54%
Heat delivery 1,3 0%
Personal cars for business travel 4,4 0%
Business air travel 124,5 1%
Tot 6.904,0
Quantity Unit Quantity Unit CO2-emission
[metric ton]
Scope 1: Direct emissions 1.163,8
Fuel 628,9
- Natural gas 1.825 g CO2 / Nm3 314.927 Nm3574,7
- Butane23.035 g CO2 / kg 24 kg 0,1
- Propane23.000 g CO2 / kg 4 kg 0,0
- CO2 gasses21.000 g CO2 / kg 53.473 kg 53,5
- Acetylene23.385 g CO2 / kg 180 kg 0,6
- Sagox 182195 g Co2 / m3 42 m3 0,0
Airco refrigerants 149,0
- Refrigerant - R22 1.810 kg CO2 / kg - kg -
- Refrigerant - R404a 3.920 kg CO2 / kg 38,0 kg 149,0
- Refrigerant - R407c 1.775 kg CO2 / kg - kg -
- Refrigerant - R410a 2.090 kg CO2 / kg - kg -
Own car fleet, fuel use 381,8
- Petrol 2.780 g CO2 / liter 4.393 liter 12,2
- Diesel 3.135 g CO2 / liter 117.377 liter 368,0
- LPG 1.860 g CO2 / liter 867 liter 1,6
Own car fleet, distance travelled 4,1
- Petrol car, category 1,4 - 2,0 liter 220 g CO2 / transport km 18.733 km 4,1
Quantity Unit Quantity Unit CO2-emission
[metric ton]
Scope 2: Indirect emissions 6.904,0
Purchased electricity 6.773,8
- Grey electricity: 2010 and later 455 g CO2 / kWh 14.887.524 kWh 6.773,8
Heat delivery 1,3
- Heat STEG 11.300 g CO2 / GJ 118 GJ 1,3
Personal cars for business travel 4,4
- Passenger car, unknown fuel type 210 g CO2 / transport km 20.955 km 4,4
Business air travel 124,5
- Distance < 700 km 270 g CO2 / transport km 74.667 travellers km 20,2
- Distance 700 - 2.500 km 200 g CO2 / transport km 210.971 travellers km 42,2
- Distance > 2.500 km 135 g CO2 / transport km 460.247 travellers km 62,1
2011-H1CO2-emission factor1
CO2-emission factor1 2011-H1