engineering guidelines for incorporating climate change
TRANSCRIPT
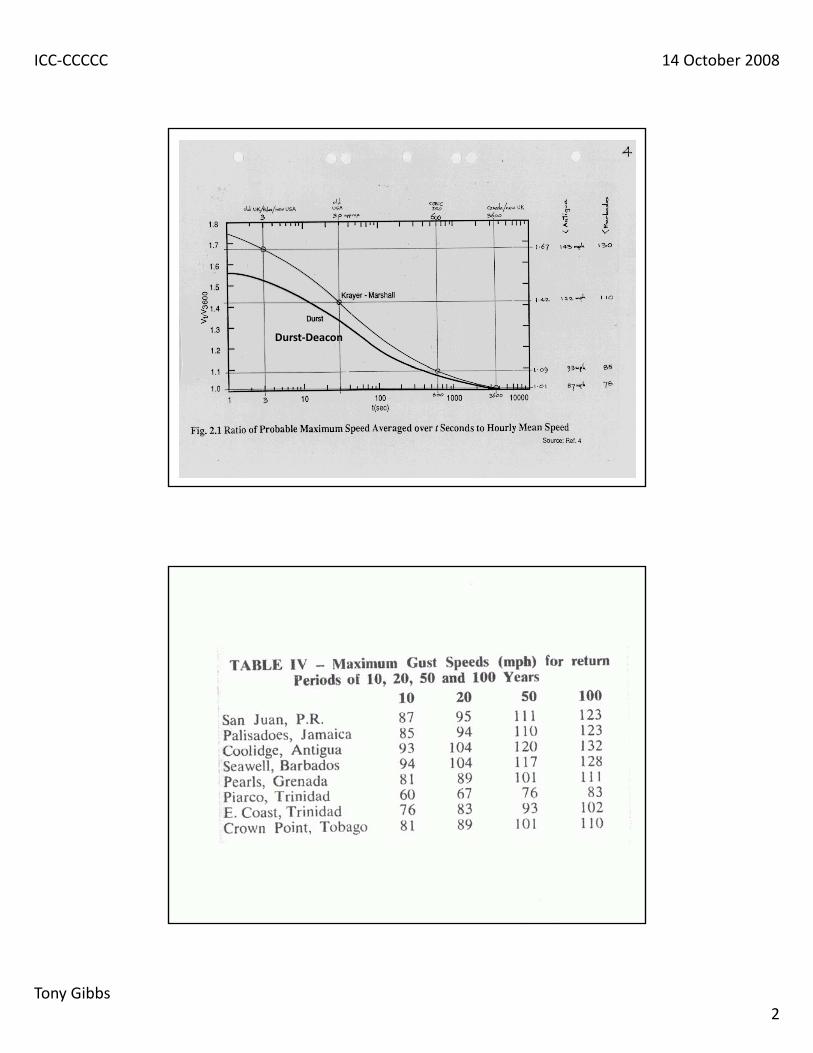
1The chart also shows the Krayer-Marshall relationship which was used briefly in the 1990s for tropicalcyclone regions.
2Please note that the various illustrations in the Appendix are taken from other documents and bear thetable numbers, etc, of the original documents.
1
Engineering Guidelines for Incorporating Climate Changeinto the Determination of Wind Forces
on Buildings and Other Structures
by Tony Gibbs BSc DCT(Leeds) FICE FIStructE FASCE FconsE FRSA FRICS
October 2008
1 History of Wind Hazard Studies for Engineering Design in the Caribbean
Prior to the 1950s the design and construction of buildings and other structures in the Caribbeanwere based on traditional practice and observation of successes and failures in previoushurricane events. The formal calculation of wind forces can be said to have started in the latterhalf of the 1950s, coincident with the growth of the private-sector, consulting-engineeringprofession.
At that time, in the Commonwealth Caribbean, engineering practice followed closely the Britishtraditions. Thus the first wind-loading code of practice to find its way onto design desks was theBritish Standard CP3:Chapter V:Part 2. That document, dated 1952, gave a wind speed of 72miles per hour (1-minute average) for severe exposures. The equivalent 3-second gust would be89 miles per hour. Throughout this document, with one exception, the Durst-Deaconrelationships are used to convert wind speeds from one averaging period to another. Theexception is noted when it occurs. The Dust-Deacon curve can be seen in Appendix Page-2 top1
(App-2-T)2. This was almost equivalent to a minimum hurricane.
Very soon consulting engineers recognised the inappropriateness of CP3:Chapter V:Part 2:1952for the Caribbean with its exposure to severe hurricanes. Guidance was sought from theneighbouring USA and, in particular, the state of Florida. The South Florida Building Codebecame a frequently-quoted reference document in the Caribbean in the 1960s. It also becamethe formal base document for the Bahamas Building Code which was first published towards theend of that decade. Typically, designs based on the South Florida Building Code in those daysused a "fastest-mile" wind speed of 120 miles per hour. At that speed the averaging period is 30seconds and the equivalent 3-second gust would be 139 miles per hour.
About that time the British Standards Institution was undertaking a major rewriting of their wind
3This was triggered by the judicial enquiry into the Ronan Point disaster of 1968.
2
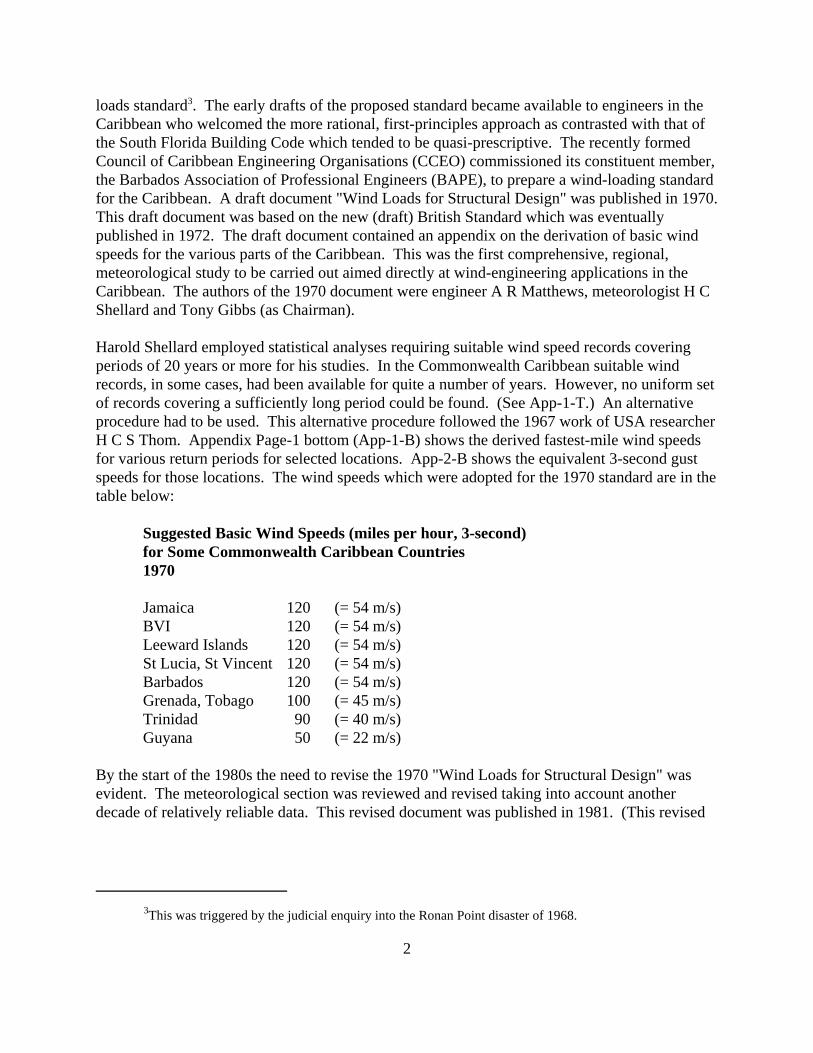
loads standard3. The early drafts of the proposed standard became available to engineers in theCaribbean who welcomed the more rational, first-principles approach as contrasted with that ofthe South Florida Building Code which tended to be quasi-prescriptive. The recently formedCouncil of Caribbean Engineering Organisations (CCEO) commissioned its constituent member,the Barbados Association of Professional Engineers (BAPE), to prepare a wind-loading standardfor the Caribbean. A draft document "Wind Loads for Structural Design" was published in 1970. This draft document was based on the new (draft) British Standard which was eventuallypublished in 1972. The draft document contained an appendix on the derivation of basic windspeeds for the various parts of the Caribbean. This was the first comprehensive, regional,meteorological study to be carried out aimed directly at wind-engineering applications in theCaribbean. The authors of the 1970 document were engineer A R Matthews, meteorologist H CShellard and Tony Gibbs (as Chairman).
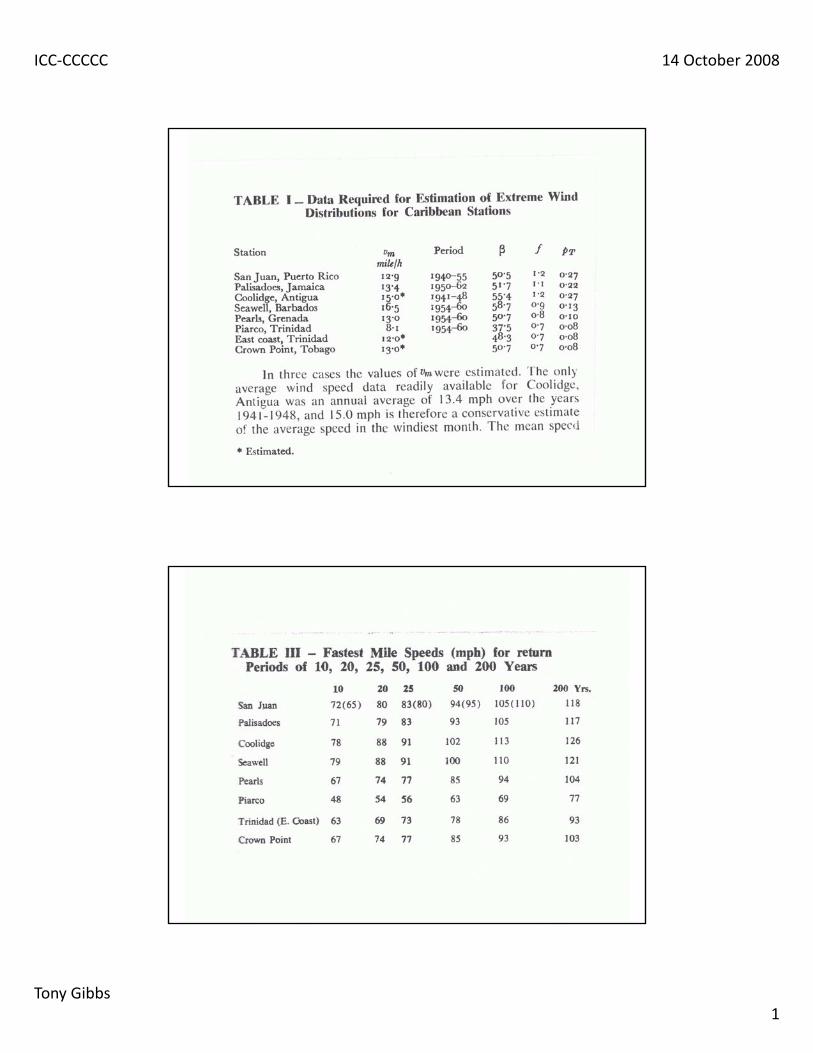
Harold Shellard employed statistical analyses requiring suitable wind speed records coveringperiods of 20 years or more for his studies. In the Commonwealth Caribbean suitable windrecords, in some cases, had been available for quite a number of years. However, no uniform setof records covering a sufficiently long period could be found. (See App-1-T.) An alternativeprocedure had to be used. This alternative procedure followed the 1967 work of USA researcherH C S Thom. Appendix Page-1 bottom (App-1-B) shows the derived fastest-mile wind speedsfor various return periods for selected locations. App-2-B shows the equivalent 3-second gustspeeds for those locations. The wind speeds which were adopted for the 1970 standard are in thetable below:
Suggested Basic Wind Speeds (miles per hour, 3-second)for Some Commonwealth Caribbean Countries1970
Jamaica 120 (= 54 m/s)BVI 120 (= 54 m/s)Leeward Islands 120 (= 54 m/s)St Lucia, St Vincent 120 (= 54 m/s)Barbados 120 (= 54 m/s)Grenada, Tobago 100 (= 45 m/s)Trinidad 90 (= 40 m/s)Guyana 50 (= 22 m/s)
By the start of the 1980s the need to revise the 1970 "Wind Loads for Structural Design" wasevident. The meteorological section was reviewed and revised taking into account anotherdecade of relatively reliable data. This revised document was published in 1981. (This revised

4OAS = Organisation of American States NCST = National Council for Science and Technology (of Barbados)
5now the Caribbean Institute for Meteorology and Hydrology
3
document is known as the OAS/NCST4/BAPE "Wind Loads for Structural Design". It is also aBarbados standard BNS CP28.) The authors of the 1981 revision were engineer H E Browne,meteorologist B A Rocheford and Tony Gibbs (as Chairman). The wind speeds which wereadopted for the 1981 standard are given in the table below:
B A Rocheford (Caribbean Meteorological Institute)5
1981 Revision of “Wind Loads for Structural Design” (3-second)
Jamaica 56 m/s (= 125 mph)BVI 64 m/s (= 143 mph)Leeward Islands 64 m/s (= 143 mph)St Lucia, Dominica 58 m/s (= 130 mph)Barbados, St Vincent 58 m/s (= 130 mph)Grenada, Tobago 50 m/s (= 112 mph)Trinidad 45 m/s (= 101 mph)Guyana 22 m/s (= 49 mph)
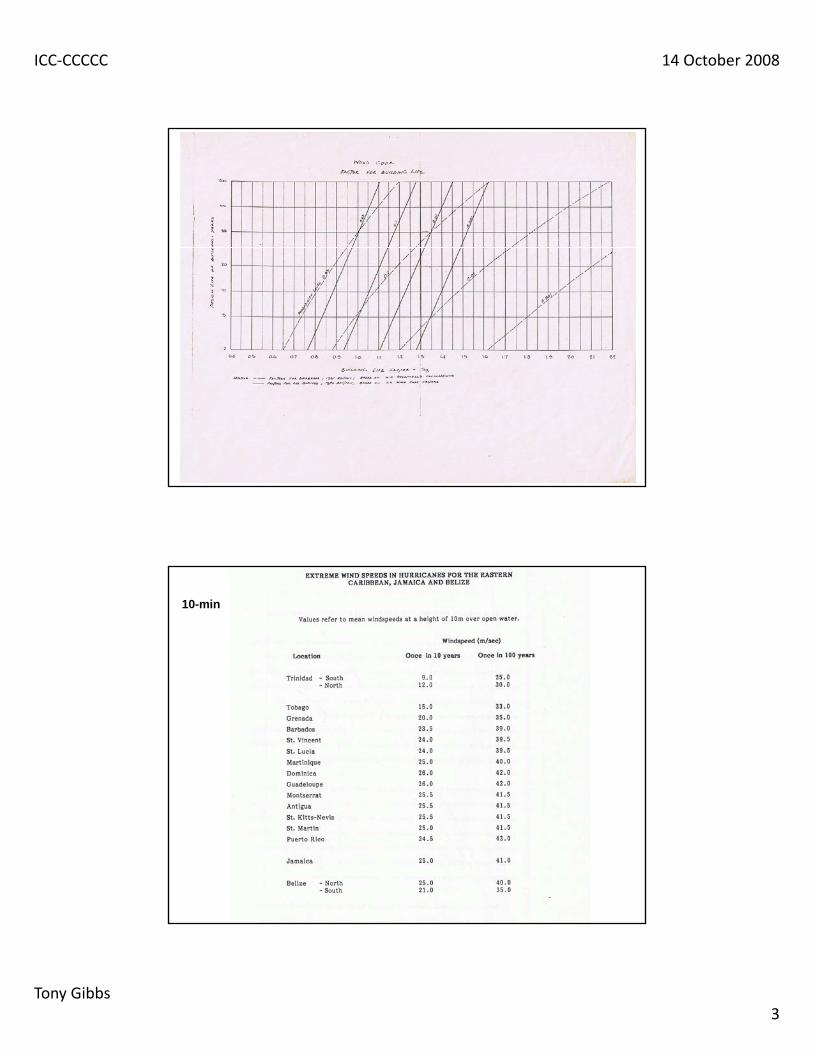
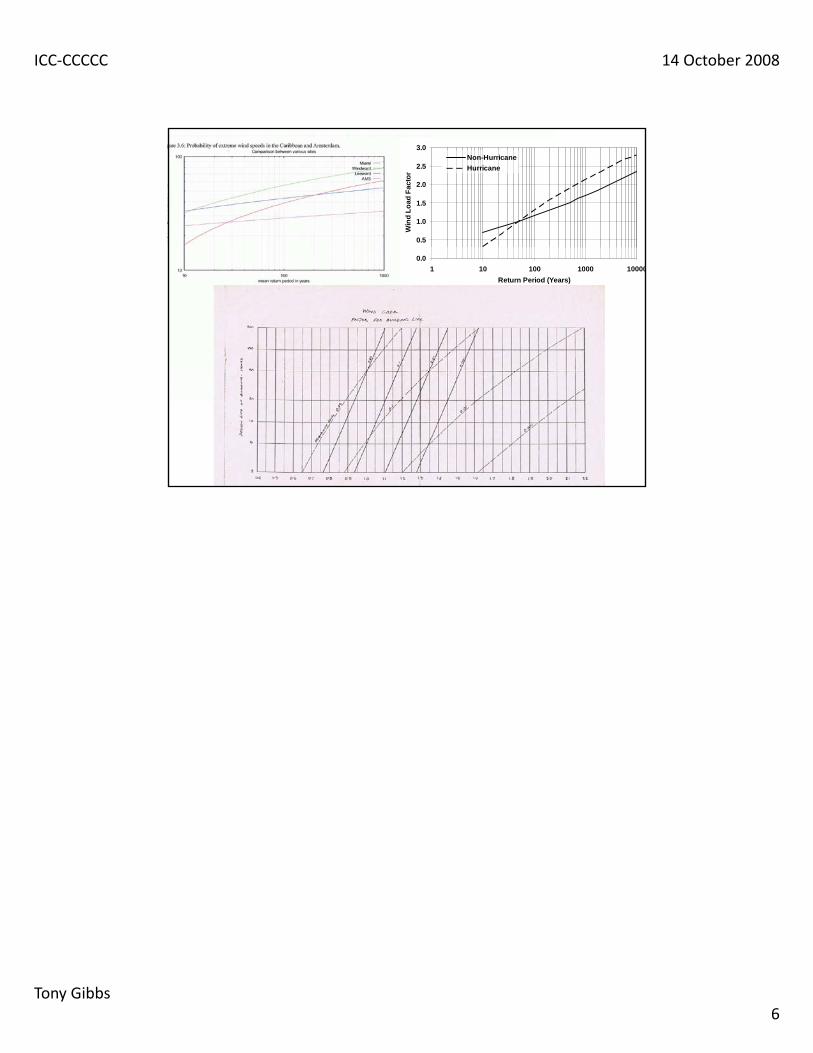
Also of interest in the 1981 edition of the standard was the recognition that the relationships oflong-return-period wind speeds to short-return-period wind speeds were different in theCaribbean when compared with the United Kingdom. The graph in the App-3-T shows the UKrelationships as straight lines and the Caribbean relationships as curves. This information wasprovided in 1971 by Norris Helliwell of the UK Meteorological Office. This characteristic wasconfirmed in subsequent independent investigations.
Three years later Rocheford revisited his work and produced the revised figures shown in thetable below:
B A Rocheford (Caribbean Meteorological Institute)Revision of Wind Speeds – 10-minute averages1984
Belize – Centre 29.0 m/s (= 65 mph) [= 93 mph 3s] Jamaica – N 37.0 m/s (= 83 mph) [= 119 mph 3s]Jamaica – S 41.0 m/s (= 92 mph) [= 132 mph 3s]St Kitts 44.5 m/s (= 100 mph) [= 143 mph 3s] Antigua 46.0 m/s (= 103 mph) [= 147 mph 3s] Dominica 41.0 m/s (= 92 mph) [= 132 mph 3s]St Lucia 43.0 m/s (= 96 mph) [= 137 mph 3s]Barbados 42.0 m/s (= 94 mph) [= 134 mph 3s]
6ISO 4354
4
Tobago 31.5 m/s (= 70 mph) [= 100 mph 3s]Trinidad – Central 27.5 m/s (= 62 mph) [= 89 mph 3s]
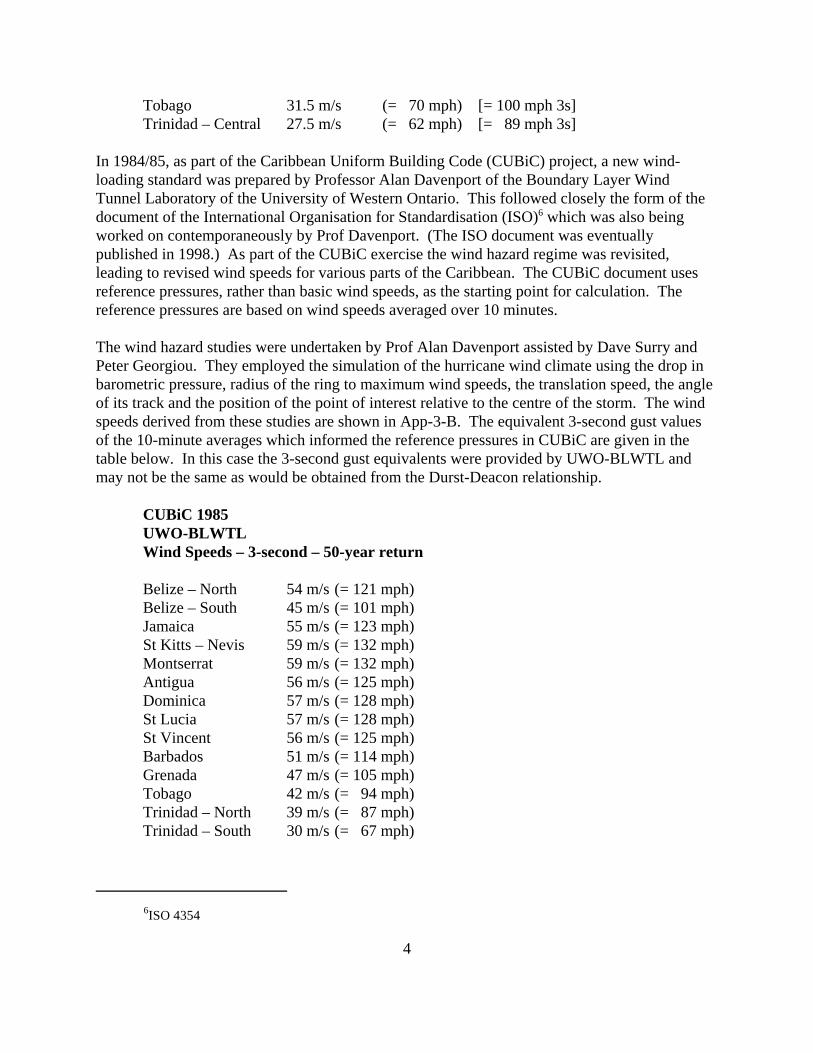
In 1984/85, as part of the Caribbean Uniform Building Code (CUBiC) project, a new wind-loading standard was prepared by Professor Alan Davenport of the Boundary Layer WindTunnel Laboratory of the University of Western Ontario. This followed closely the form of thedocument of the International Organisation for Standardisation (ISO)6 which was also beingworked on contemporaneously by Prof Davenport. (The ISO document was eventuallypublished in 1998.) As part of the CUBiC exercise the wind hazard regime was revisited,leading to revised wind speeds for various parts of the Caribbean. The CUBiC document usesreference pressures, rather than basic wind speeds, as the starting point for calculation. Thereference pressures are based on wind speeds averaged over 10 minutes.
The wind hazard studies were undertaken by Prof Alan Davenport assisted by Dave Surry andPeter Georgiou. They employed the simulation of the hurricane wind climate using the drop inbarometric pressure, radius of the ring to maximum wind speeds, the translation speed, the angleof its track and the position of the point of interest relative to the centre of the storm. The windspeeds derived from these studies are shown in App-3-B. The equivalent 3-second gust valuesof the 10-minute averages which informed the reference pressures in CUBiC are given in thetable below. In this case the 3-second gust equivalents were provided by UWO-BLWTL andmay not be the same as would be obtained from the Durst-Deacon relationship.
CUBiC 1985UWO-BLWTLWind Speeds – 3-second – 50-year return
Belize – North 54 m/s (= 121 mph)Belize – South 45 m/s (= 101 mph)Jamaica 55 m/s (= 123 mph)St Kitts – Nevis 59 m/s (= 132 mph)Montserrat 59 m/s (= 132 mph)Antigua 56 m/s (= 125 mph)Dominica 57 m/s (= 128 mph)St Lucia 57 m/s (= 128 mph) St Vincent 56 m/s (= 125 mph)Barbados 51 m/s (= 114 mph) Grenada 47 m/s (= 105 mph) Tobago 42 m/s (= 94 mph) Trinidad – North 39 m/s (= 87 mph) Trinidad – South 30 m/s (= 67 mph)
7in collaboration with the University of Waterloo, Canada 8Saffir-Simpson Scale
9United States Agency for International Development
10TNO - Netherlands Organisation for Applied Scientific ResearchBuilding and Construction Research
5
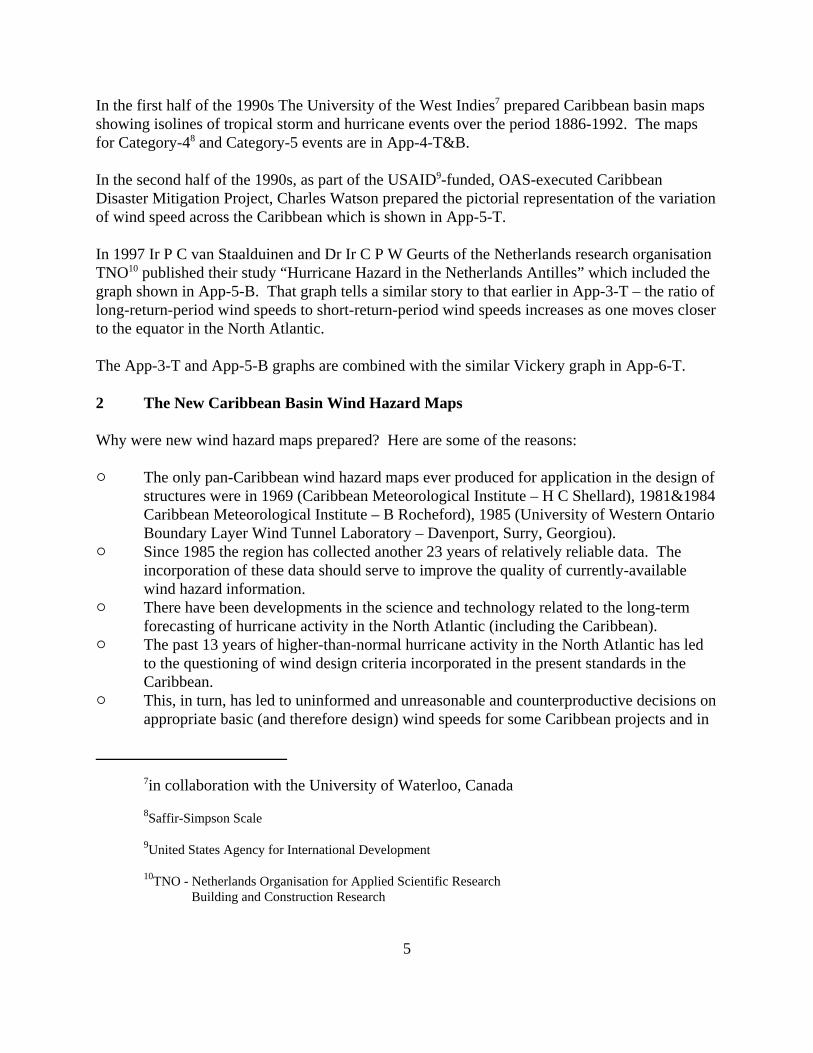
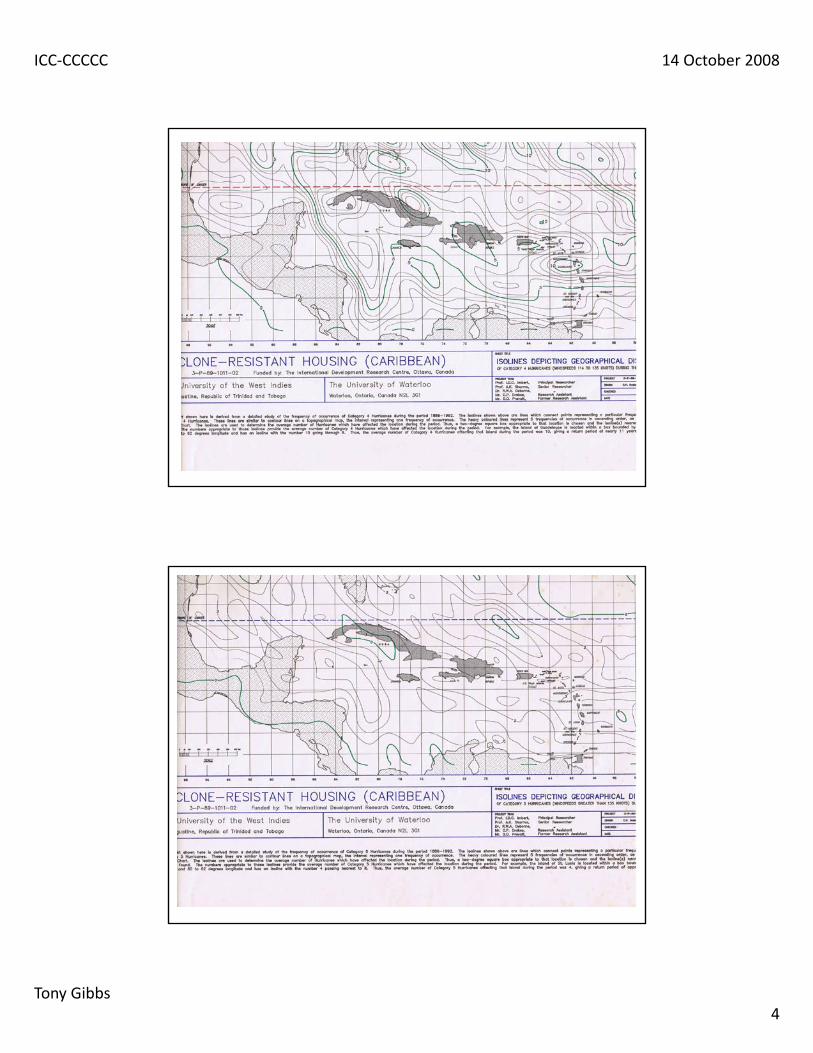
In the first half of the 1990s The University of the West Indies7 prepared Caribbean basin mapsshowing isolines of tropical storm and hurricane events over the period 1886-1992. The mapsfor Category-48 and Category-5 events are in App-4-T&B.
In the second half of the 1990s, as part of the USAID9-funded, OAS-executed CaribbeanDisaster Mitigation Project, Charles Watson prepared the pictorial representation of the variationof wind speed across the Caribbean which is shown in App-5-T.
In 1997 Ir P C van Staalduinen and Dr Ir C P W Geurts of the Netherlands research organisationTNO10 published their study “Hurricane Hazard in the Netherlands Antilles” which included thegraph shown in App-5-B. That graph tells a similar story to that earlier in App-3-T – the ratio oflong-return-period wind speeds to short-return-period wind speeds increases as one moves closerto the equator in the North Atlantic.
The App-3-T and App-5-B graphs are combined with the similar Vickery graph in App-6-T.
2 The New Caribbean Basin Wind Hazard Maps
Why were new wind hazard maps prepared? Here are some of the reasons:
" The only pan-Caribbean wind hazard maps ever produced for application in the design ofstructures were in 1969 (Caribbean Meteorological Institute – H C Shellard), 1981&1984Caribbean Meteorological Institute – B Rocheford), 1985 (University of Western OntarioBoundary Layer Wind Tunnel Laboratory – Davenport, Surry, Georgiou).
" Since 1985 the region has collected another 23 years of relatively reliable data. Theincorporation of these data should serve to improve the quality of currently-availablewind hazard information.
" There have been developments in the science and technology related to the long-termforecasting of hurricane activity in the North Atlantic (including the Caribbean).
" The past 13 years of higher-than-normal hurricane activity in the North Atlantic has ledto the questioning of wind design criteria incorporated in the present standards in theCaribbean.
" This, in turn, has led to uninformed and unreasonable and counterproductive decisions onappropriate basic (and therefore design) wind speeds for some Caribbean projects and in
6
some Caribbean countries." The subject project includes the Caribbean coastlines of South and Central American
countries. In several of these cases there were no previously available wind hazardguidance for structural design purposes. The new maps plug those gaps.
" The phenomenon of hurricane activity in the Caribbean is best dealt with regionally andnot in a country-by-country manner.
What use will be made of the results of the proposed project? Here are some answers:
" New regional standards are currently being prepared in a project funded by the CaribbeanDevelopment Bank (CDB) and executed by the Caribbean Regional Organisation forStandards and Quality (CROSQ). These will replace the Caribbean Uniform BuildingCode (CUBiC). The CDB-CROSQ project does not include new wind hazard maps forthe target region. These new Caribbean Basin maps have been prepared to be consistentwith the CDB-CROSQ intension to base the new standards project on the USA“International” codes which reference the wind load provisions of the American Societyof Civil Engineers (ASCE 7 Chapters 2 and 6). Thus the results of this wind hazardmapping project could be plugged directly into the new CDB-CROSQ standards.
" Those Caribbean countries which, for whatever reason, are developing their ownstandards and not participating in the CDB-CROSQ project will also require wind hazardinformation. This wind hazard mapping project will provide wind hazard informationwhich could readily be represented in forms designed to fit directly into standardsdocuments with different approaches.
" Engineers in all Caribbean countries are designing projects every day which must resistthe wind. Confidence in the wind hazard information is important to designers. Clientssometimes wish to specify the levels of safety of their facilities. Insurance providerssometimes wish to know the risks they underwrite. This depends critically on the qualityof hazard information. Financing institutions sometimes wish to specify wind designcriteria for their projects. There is, in summary, an immediate and palpable need forwind hazard information based on up-to-date meteorological records and methodologiesrecognised by consensus in the scientific community.
The agencies and main personnel responsible for the new maps are:
" Principal researcher – Applied Research Associates (Peter Vickery)" Regional coordinator – Tony Gibbs (CEP International Ltd)" Executing agency – Pan American Health Organisation (PAHO) (Dana van Alphen)" Funding agency – United States Agency for International Development (Tim Callaghan
and Julie Leonard)
The open process adopted in his project is exemplified by:
" The Caribbean Basin Wind Hazard Maps project has prepared a series of overall,regional, wind-hazard maps using uniform, state-of-the-art approaches covering all of the
7
Caribbean islands and the Caribbean coastal areas of South and Central America. Theproject was executed in consultation with interest groups throughout the target region.
" An interim, information meeting was held at PAHO in Barbados on 01 October 2007. Meteorologists, engineers, architects, emergency managers, standards personnel andfunding agency personnel from the wider Caribbean were invited (and were funded) toattend.
" At that meeting the principal researcher, Dr Peter Vickery of Applied ResearchAssociates (ARA) described the methodology for developing the maps; presented theinterim results available at the time of the meeting; received comments from participantsand answered their questions; discussed what systems need to be put in place to improveknowledge of the wind hazard in the Caribbean region and outlined the further work tofinalise the mapping exercise.
There are web sites presenting the results of the project including:
http://www.paho.org/english/dd/ped/caribbeanwindhazardmaps.htmandhttp://www.istructe.org/BRANCH/CARIBBEAN/news/article.asp?NID=370&Name=CARIBBEAN&BID=30
The sites contain:
" the 20 wind hazard maps;" Peter Vickery’s paper describing the methodology;" Tony Gibbs’s presentation of the CBWHM project to recent conferences;" Peter Vickery’s presentation of the CBWHM project to the 2008 National Hurricane
Conference.
3 Guidelines for the Use of Peter Vickery’s Wind Speed Results as Adjusted forClimate Change
Vickery’s study has developed a methodology to estimate the change in the wind speeds used forthe design of structures in St. Lucia as affected by climate change. The climate changeinformation was obtained from a recently-completed study on the potential increase in hurricanefrequency by J A Curry et al of the Georgia Institute of Technology Climate ForecastApplications Network.
The ASCE 7 Wind Loads standard assumes a level of safety comparable with failure occurring ata wind speed with a 700-year return period for standard (Category II) buildings and a 1,700-yearreturn period for more important (Categories III&IV) buildings. Vickery assumes that the samelevel of safety (or probability of failure) would apply when climate change is taken into account.
The equivalent wind speed (for comparison with the St Lucia Code) in the PAHO-USAID maps,before allowing for climate change, would be 123 miles per hour. If an increase of 13% isallowed for climate change (standard buildings – Category II) the new value would be about 8%
8
higher than envisaged in the St Lucia Building Code.
The Curry et al estimate of the hurricane activity circa 2020 to 2025 which was used by Vickerymeans that the estimate of a future Atlantic Ocean climate with three to four Category 4 and 5hurricanes per year is a likely upper-bound estimate of a future hurricane climate. Since all newCategory II, III and IV buildings are likely to have lifespans beyond 2025, the wind speedadjustments for climate change will simply be an additional 12 to 14 percent for Category IIbuildings in St. Lucia and 10 percent for Category III and IV buildings. Thus the wind speedsajusted for climate change would be:
175 mph (“ultimate” or 700-year wind speed) – Category II buildings189 mph (“ultimate” or 1,700-year wind speed) – Categories III & IV buildings
In implementing these wind speeds while using ASCE 7-05 Chapters 2 and 6, the followingLoad Combinations should be used as factored loads in strength design. Combinations 3a, 4aand 6a will replace combinations 3, 4 and 6. The combinations relate to Category II buildings. For Category III and IV buildings W700 should be replaced by W1700.
1: 1.4(D + F)2: 1.2(D + F + T ) + 1.6(L + H) + 0.5(Lr or R)3: 1.2D + 1.6(Lr or R) + (L or 0.8W)3a: 1.2D + 1.6(Lr or R) + (L or 0.8W700/1.6) 4: 1.2D + 1.6W + L + 0.5(Lr or R)4a: 1.2D + 1.0W700 + L + 0.5(Lr or R)5: 1.2D + 1.0E + L6: 0.9D + 1.6W + 1.6H6a: 0.9D + 1.0W700 + 1.6H7: 0.9D + 1.0E + 1.6H
The symbols are:
D = dead loadE = earthquake loadF = load due to fluids with well-defined pressures and maximum heightsFa = flood loadH = load due to lateral earth pressure, ground water pressure, or pressure of bulkmaterialsL = live loadLr = roof live loadR = rain loadT = self-straining forceW = wind load
Alternatively, the following Load Combinations should be used as nominal loads in allowable
9
stress design. Combinations 5a, 6a and 7a will replace combinations 5, 6 and 7. Thecombinations relate to Category II buildings. For Category III and IV buildings W700 should bereplaced by W1700.
1: D + F2: D + H + F + L + T3: D + H + F + (Lr or R)4: D + H + F + 0.75(L + T ) + 0.75(Lr or R)5: D + H + F + (W or 0.7E)5a: D + H + F + (W700/1.6 or 0.7E)6: D+H+F+0.75(W or 0.7E)+0.75L+0.75(Lr or R)6a: D+H+F+0.75(W700/1.6 or 0.7E)+0.75L+0.75(Lr or R)7: 0.6D + W + H7a: 0.6D + W700/1.6 + H 8: 0.6D + 0.7E + H
The present St Lucia Building Code adopts by reference CUBiC:Part-2:Section-2:Wind Load. The CUBiC reference pressures are stated as 50-year return period, 10-minute averages. StLucia is allocated a reference pressure which equates to a 3-second gust of 128 miles per hour.
The loads obtained from the CUBiC standard are “working” loads, not failure or “ultimate”loads. The failure loads would be obtained by multiplying the working loads by load factors.
The engineering guidelines to allow for climate change are quite simple. However, there will bethe need for a significant amount of familiarisation of interested persons (owners, financiers,insurers) and training of designers (engineers, architects) in the use of ASCE 7 Wind Loadsincorporating the new wind hazard maps enhanced by climate change considerations andmodified by the Caribbean Application Document (under preparation) for ASCE 7 (Chapters 2and 6).

10
Appendix
ICC‐CCCCC 14 October 2008
Tony Gibbs1
ICC‐CCCCC 14 October 2008
Tony Gibbs2
Durst‐Deacon
ICC‐CCCCC 14 October 2008
Tony Gibbs3
10-min
ICC‐CCCCC 14 October 2008
Tony Gibbs4

ICC‐CCCCC 14 October 2008
Tony Gibbs5
Maximum Wind Speeds (50‐year return)
W23 N
CDMP
89.5
59 W
9 N
Wind Speeds0 1 2 3 4 5
knotsmph
kph
m/s
Storm Category
25 50 75 100 125
25 50 75 100 125 150
50 100 150 200 250
10 20 30 40 50 60 70
ICC‐CCCCC 14 October 2008
Tony Gibbs6
0.5
1.0
1.5
2.0
2.5
3.0
Win
d Lo
ad F
acto
r
Non-HurricaneHurricane
0.01 10 100 1000 10000
Return Period (Years)