incorporating climate change into pavement analysis and design
TRANSCRIPT
Incorporating Climate Change into Pavement Analysis and Design
Jayne F. Knotta, Anne M. K. Stonerb, Jo E. Siasc, Jennifer M. Jacobsc, and Katharine Hayhoeb
aJFK Environmental Services LLCbClimate Center, Texas Tech University
cDept. of Civil and Environmental Eng., University of New Hampshire

Outline
2
Background and Motivation
Future Climate Projections
Accounting for Climate Change in Pavement Design
Scenario-Based Approach
Asset-Based Approach
Hybrid Approach & Case Study
Summary and Future Work

Background and Motivation
3
Global temperatures are rising and are projected to continue to rise.
Precipitation patterns are changing.
Sea levels and groundwater levels near the coast are rising.
These changes will affect pavement performance and service life all over the world.
Increased costs of maintaining roads due to climate impacts are estimated to be billions of dollars in the U.S.
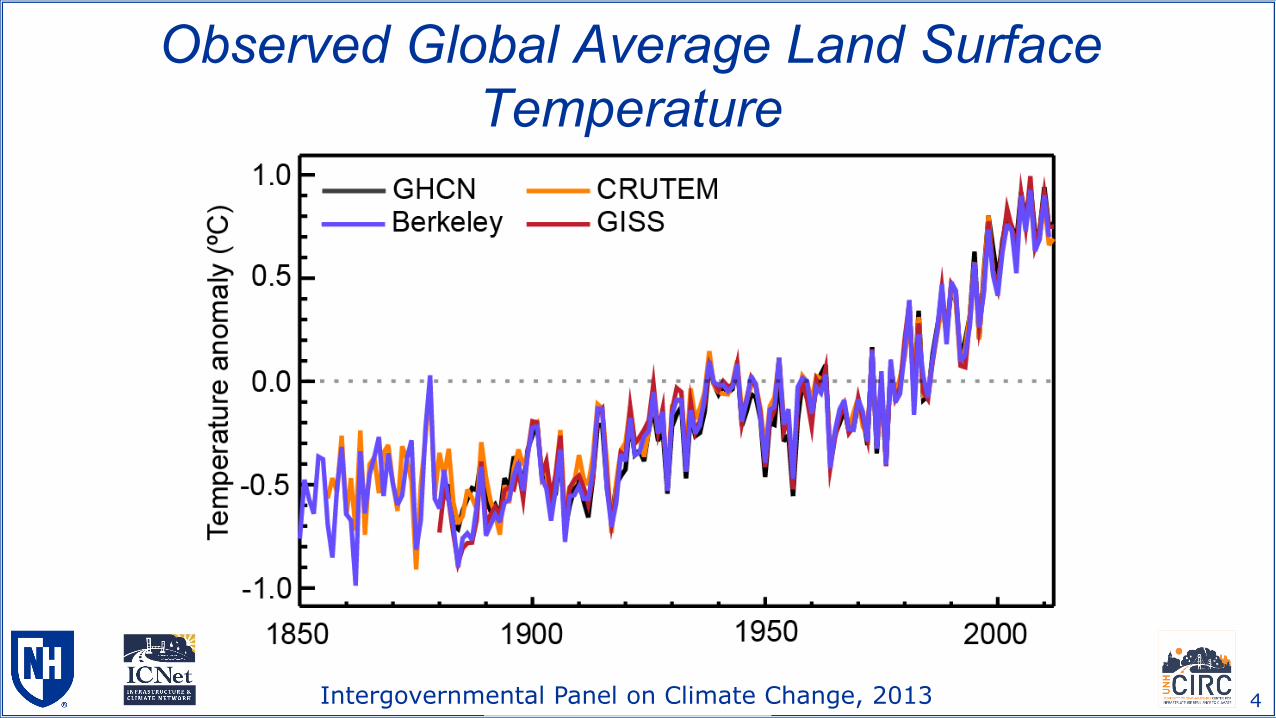
Observed Global Average Land Surface Temperature
4Intergovernmental Panel on Climate Change, 2013
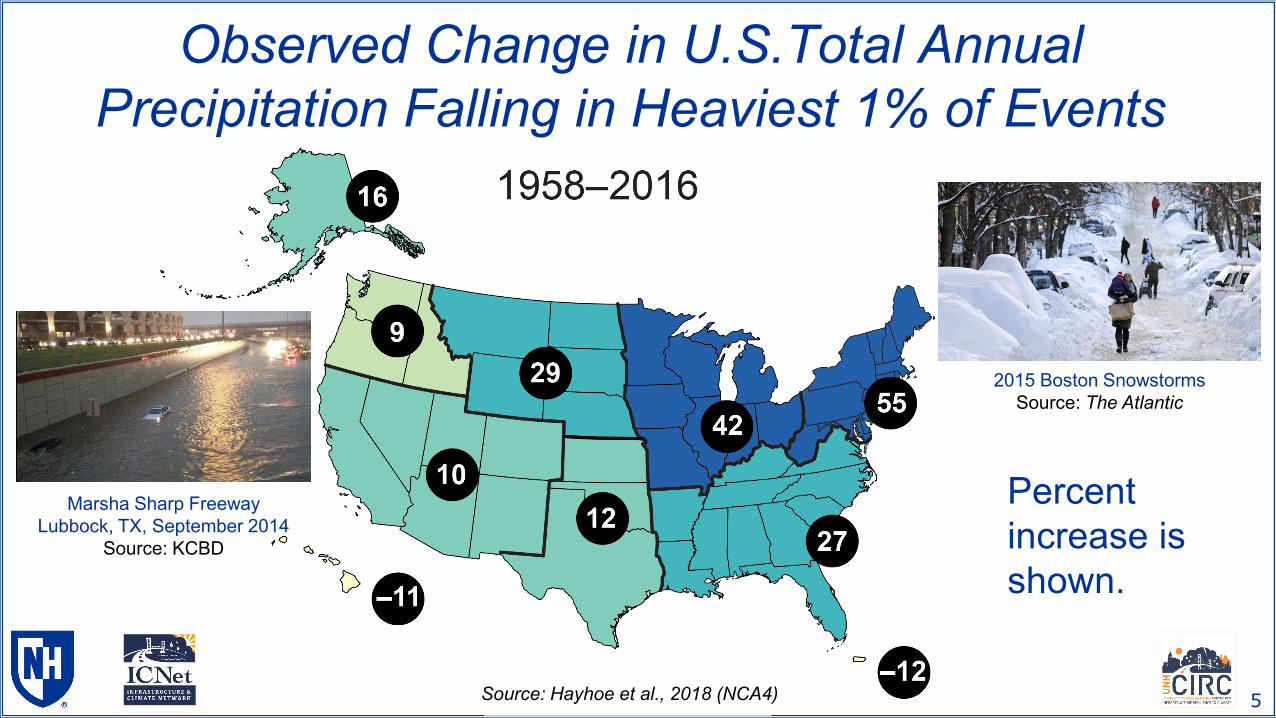
Observed Change in U.S.Total Annual Precipitation Falling in Heaviest 1% of Events
5Source: Hayhoe et al., 2018 (NCA4)
Percent increase is shown.
Marsha Sharp FreewayLubbock, TX, September 2014
Source: KCBD
2015 Boston SnowstormsSource: The Atlantic
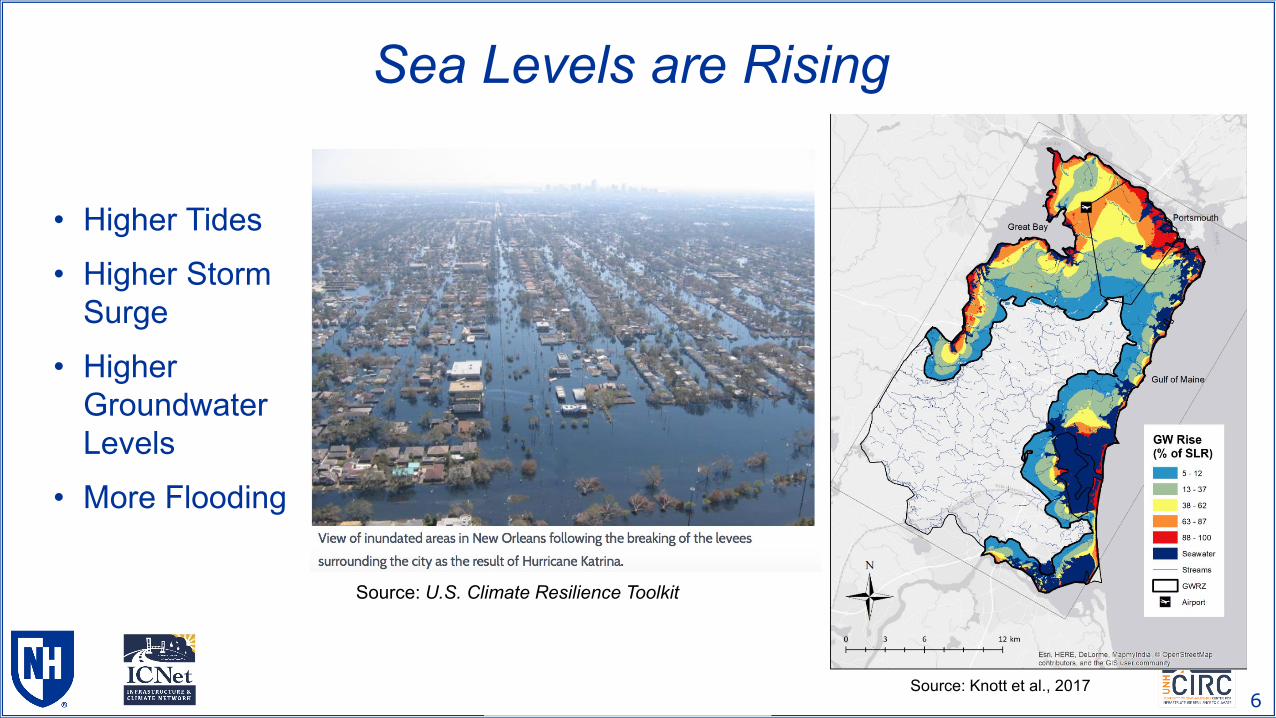
Sea Levels are Rising
6
Source: U.S. Climate Resilience Toolkit
• Higher Tides• Higher Storm
Surge• Higher
Groundwater Levels
• More Flooding
Source: Knott et al., 2017
7
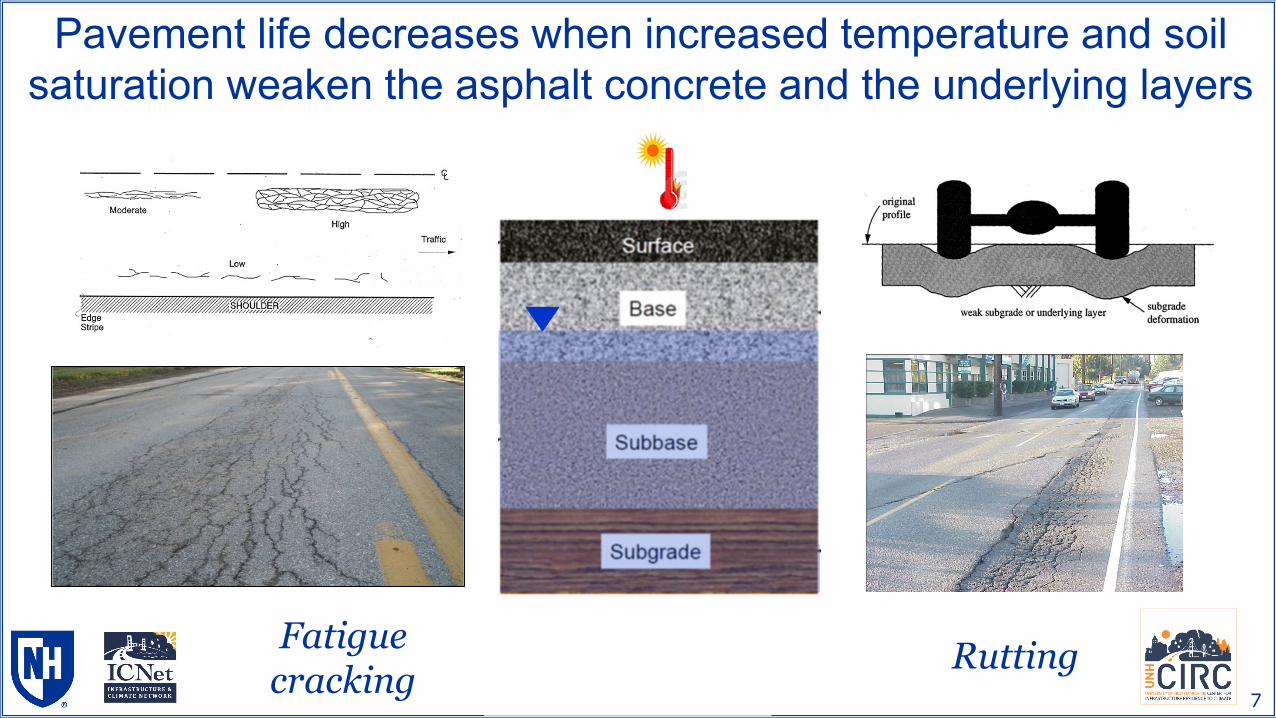
Fatigue cracking
Pavement life decreases when increased temperature and soil saturation weaken the asphalt concrete and the underlying layers
Rutting

Climate Data for Design Traditionally, we assume long term climate will remain stable
and can be predicted based on past climate normals
8

Climate Data for Design In reality, climate is non-stationary: future climate conditions
and weather risks will differ from those experienced in the past
9

Future Climate Projections
10
Climate Models simulate physical processes and interactions in and between the atmosphere, ocean, sea ice, land, and biosphere on a grid covering the entire earth.
Source: NOAA

Projected Global Average Temperature Rise
11Source: The National Climate Assessment (NCA4, 2018)
There are four Representative Concentration Pathways (RCPs):
RCP2.6
RCP4.5
RCP6.0
RCP8.5
RCP8.5 represents the “business-as-usual” pathway.
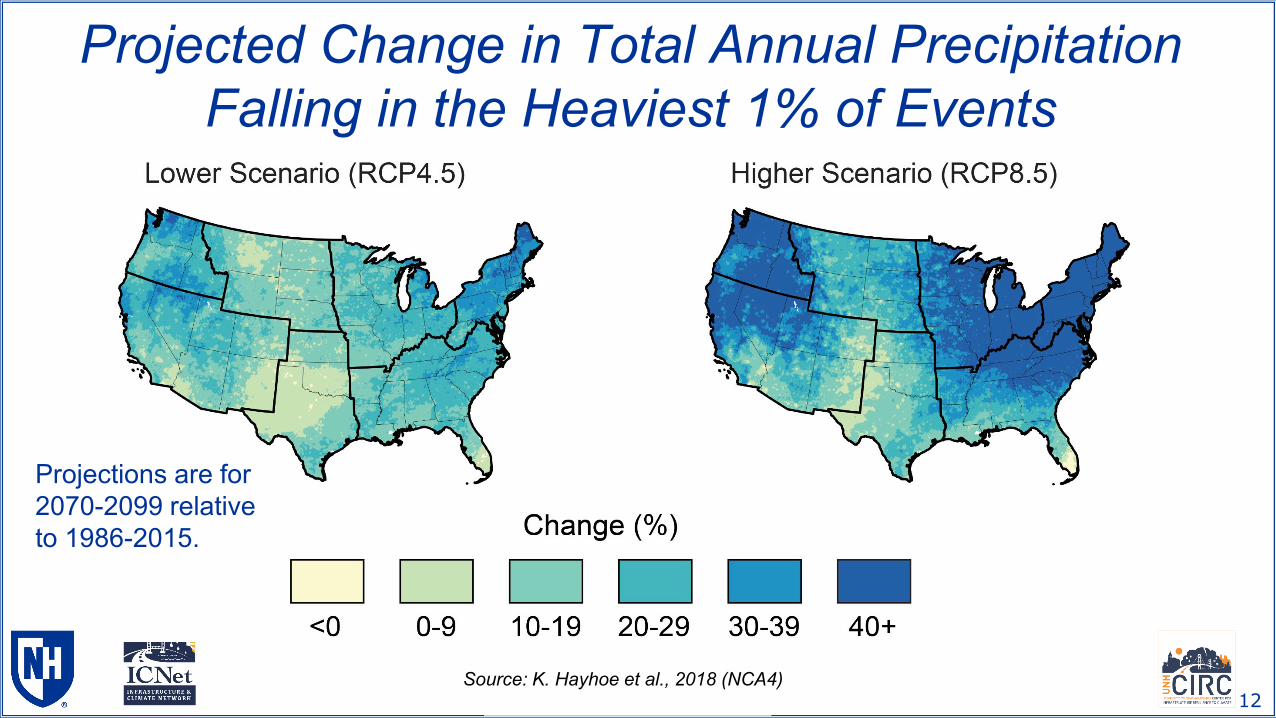
Projected Change in Total Annual Precipitation Falling in the Heaviest 1% of Events
12Source: K. Hayhoe et al., 2018 (NCA4)
Projections are for 2070-2099 relative to 1986-2015.

Projected Sea Level Rise
13Sweet et al. (2017)
Glo
bal M
ean
Sea
Lev
el (
m)
Year

14
Incorporating Climate Projections Into Pavement Design
• Identify the climate or weather-related concerns already known to potentially affect the pavement that is being designed, built, and/or maintained.
• Quantify the type of the information required by engineers to assess future impacts and minimize vulnerability
• Determine which of these risks have changed historically or are likely to change in the future, and the extent to which climate science can provide robust information on these risks to be used in future planning.
15
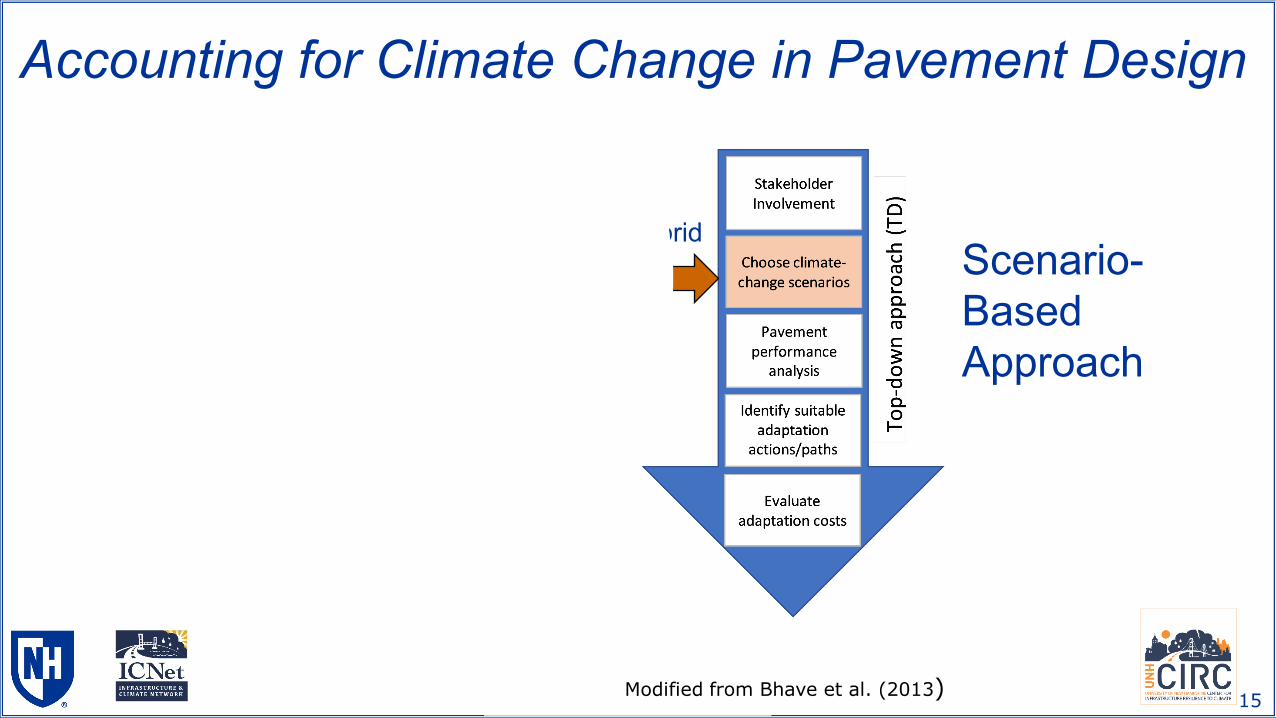
Asset-Based Approach
Scenario-Based Approach
Accounting for Climate Change in Pavement Design
Hybrid
Modified from Bhave et al. (2013)

16
Scenario-Based ApproachStudy: Examine impact of climate change on pavement performance of 24 sites in four different climate zones across the continental U.S.
2 Pavement Structures: Interstate and Primary Roads
Interstate Primary Road
3” AC surface course 4” AC
6” AC base course 10” aggregate base
18” aggregate base semi-infinite subgrade
semi-infinite subgrade
2,500 AADTT 1,000 AADTT
Climate input: • Calculated from 1 GCM and 1
future scenario (RCP8.5)• Statistically downscaled daily
projections to the station level• Temporally disaggregated daily
output to hourly values

18
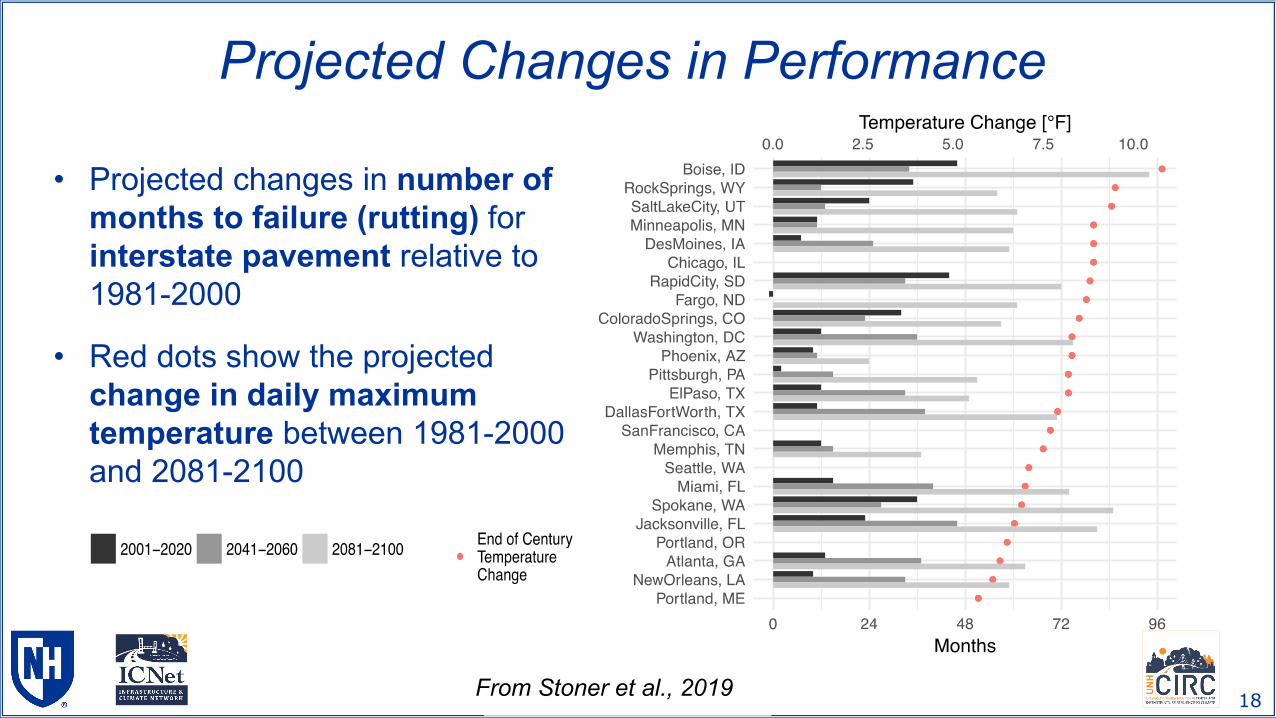
Projected Changes in Performance
• Projected changes in number of months to failure (rutting) for interstate pavement relative to 1981-2000
• Red dots show the projected change in daily maximum temperature between 1981-2000 and 2081-2100
From Stoner et al., 2019


Hybrid Asset/Scenario-Based Approach – Case Study
20
Road surface elevation = 4.2 meters (NAVD88)
Pavement Design considering:
• Groundwater rise caused by SLR
• Temperature increases
• Can evaluate other parameters
HMA = 140 mm
Base = 406 mm
Source: Knott et al., 2017

21
Pavement Adaptation to Temperature Rise Only
Optimum HMA layer thickness to achieve 85% reliability assuming 406 mm gravel base
Colored boxes = the range of temperature rise projected for the period indicated
Annual Average Temperature Rise, ºC
Source: Knott et al., 2018

Pavement Climate Sensitivity Catalog (PCSC)
Gro
undw
ater
Ris
e (m
m)
Temperature Rise (deg. C)
Methodology from Taner et al. (2017)
HMA thickness required to achieve 85% reliability
4 gravel base thicknesses

23
After Assessing Asset’s Sensitivity to Climate Change, Introduce RCP Scenarios to Determine the Timing of the Effects
Source: Knott et al., 2019
24
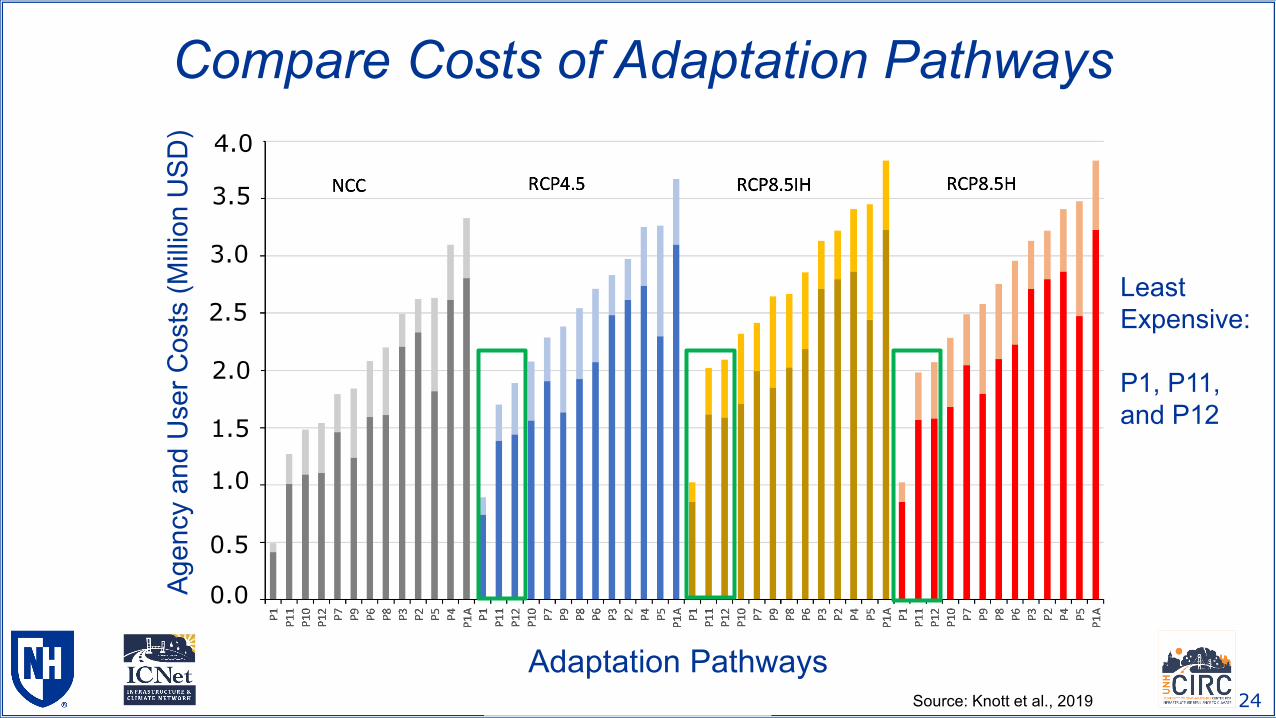
Compare Costs of Adaptation Pathways
Least Expensive:
P1, P11, and P12
Adaptation Pathways
Agen
cy a
nd U
ser C
osts
(Milli
on U
SD) 4.0
3.5
3.0
2.5
2.0
1.5
1.0
0.5
0.0
Source: Knott et al., 2019

25
Stepwise Adaptation Plan – Pathways Map
P1 – overlays only
P3 – Increase base to 610 mm in 2020, overlays
P7 – Overlays, increase base to 610 mm in 2040, overlays
P11 – Overlays, increase base to 610 mm in 2060, overlays
P12 – Overlays, increase base to 711 mm in 2060
Five of the most effective pathways:
Source: Knott et al., 2019

26
Adaptation Actions Along Adaptation Pathways
Adaptation Pathway
HM
A O
verla
y Th
ickn
ess,
mm
NCC RCP 4.5 IL
RCP 8.5 IH RCP 8.5 H
P1 P1A P3 P7 P11 P12Rehab.
Source: Knott et al., 2019

Factors to Consider when Creating/Changing the Adaptation Plan
27
What is the current condition of the pavement?
Have the climate/traffic projections changed?
Are there new materials to consider?
What is the projected condition of the service area?
Re-evaluate the adaptation plan every 10-20 years

Case Study Conclusions
28
• A stepwise and flexible adaptation framework is introduced and demonstrated at a case-study site.
• HMA overlays of prescribed thickness and implementationtiming is the least costly adaption pathway.
• Pavement management without considering climate change is the most costly option.
• At this case-study site, climate-change scenarios affect adaptation costs, but the adaptation-pathway choice was dictated by rehabilitation efficiencies and implementation timing.

Summary
29
The climate is changing and the change is projected to accelerate. This will have an impact on countless infrastructure assets.
Preliminary results show that continuing current asphalt pavement design practices will result in reduced pavement performance and service life.
We can incorporate quantitative projections into preparing for risks we know will intensify under greater change

Recommendations for Future Work
30
• Pavement Climate Sensitivity Catalogs are needed for more climate stressors, traffic, materials, and pavement structures.
• Pavement-model input of future climate stressors and climate-sensitive material properties should be simplified.
• The carbon footprint of adaptation options should be considered when choosing adaptation strategies.

Acknowledgements
31
• New Hampshire Sea Grant• Infrastructure and Climate Network (ICNet)• UNH Center for Infrastructure Resilience to Climate (UCIRC)• Minnesota Department of Transportation (MNDOT)• Eshan V. Dave, Ph.D., University of New Hampshire• UNH Asphalt Research Group

Thank you for your attention.
32
Jo E. Sias, [email protected] F. Knott, [email protected] M. K. Stoner, [email protected] M. Jacobs, [email protected] Hayhoe, [email protected]